The influence of micro-scale thermal habitat on the movements of juvenile white sharks in their Southern California aggregation sites
 Emily Spurgeon1*
  Marten L. Thompson2
  Mitchell D. Alexander1
  James M. Anderson1
  Patrick T. Rex1
  Brian Stirling1 Kevin Abbott1
  Christopher G. Lowe1
- 1Department of Biological Sciences, California State University, Long Beach, CA, United States
- 2School of Statistics, University of Minnesota, Minneapolis, MN, United States
While juvenile white sharks (JWS) can display regional endothermy, the need to maintain internal temperatures within an energetically favorable range likely drives thermoregulatory movements to maximize growth and foraging efficiency. Many JWS from the northeastern Pacific population aggregate seasonally in nearshore nursery habitats throughout the Southern California Bight and historic data show that inter-seasonal movement patterns may be heavily dependent on ambient water temperature. However, the degree to which micro-scale (e.g., ~10 m2) water temperature heterogeneity influences JWS three-dimensional movement within nearshore aggregation sites is unknown. High-resolution temperature and passive acoustic-telemetry geo-positional data were used to quantify how temperature and vertical thermal stratification influenced JWS movement using several modeling approaches. JWS selected for water temperatures between 16 – 22°C and depths shallower than 2 m. Sharks occupied deeper waters during dawn and dusk periods, and their distance from the seafloor and spatial orientation of their depth distribution was significantly related to the thermal structure of the water column across the monitored area. Tagged sharks remained above a 16°C thermal threshold and altered their horizontal and vertical distributions accordingly. While high-resolution movement and environmental data provide improved predictability of micro-scale habitat use and distribution, other variables such as prey distribution, behavior, and competition would further improve habitat use models for this highly mobile species.
Introduction
Animals respond behaviorally to environmental conditions over a range of spatio-temporal scales, often in ways that shape their habitat use and movement patterns. While seasonal environmental changes across a species’ entire range may dictate long-term migration patterns, many aquatic animals likely make movement decisions based on micro-scale differences in conditions which may vary based on ontogenetic stage (White et al., 2019). For many elasmobranch species, the young spend the first years of their life in nursery areas that are discrete from the areas occupied by adults (Heupel et al., 2007). Since the essential qualities of a nursery habitat are dynamic, including protection from predators (Vaudo & Heithaus, 2013), access to abundant and suitable prey (Heupel & Hueter, 2002; Vinagre & Cabral, 2008; Knip et al., 2010) and physiologically suitable environmental conditions, a change in one or more of these variables may cause animals to relocate. Most nurseries for both coastal and pelagic elasmobranch species are in shallow (< 200 m deep) and nearshore (< 22 km offshore) waters (Garla et al., 2006, 2009; Cartamil et al., 2010; Oñate-González et al., 2017; George et al., 2019; White et al., 2019; Anderson et al., 2021) where some of these marine habitats experience increased current and wave action making the environmental conditions highly variable across three dimensional space (Walter et al., 2014).
Changes in environmental temperature directly influence physiology and are thought to be an important factor driving juvenile shark movement and site fidelity in their preferred habitats (Crawshaw, 1977; Magnuson et al., 1979; Heithaus et al., 2002; Heupel et al., 2004; Speed et al., 2012; Avgar et al., 2013; Schlaff et al., 2014; Bernal & Lowe, 2015; Ward-Paige et al., 2015; Spurgeon et al., 2022). Due to relatively high spatiotemporal variations in temperature in nearshore habitats, juveniles may be temporarily exposed to conditions outside of their thermal optima; however, individuals may tolerate the physiological costs of unfavorable temperatures given adequate protection and food availability (Huey & Stevenson, 1979; Papastamatiou et al., 2015; Lear et al., 2019). This wider thermal range constitutes the animal’s thermal preferendum; the temperature range at which the individual is not most efficient but still can maintain a positive growth rate assuming no biotic and abiotic limitations (Hertz et al., 1993; Dewar et al., 2004; Heupel et al., 2004; Topping et al., 2006; Weng et al., 2007b).
White sharks are one of the only regional endotherms known to utilize nearshore nursery habitats (Dewar et al., 2004; Weng et al., 2007a, b; Oñate-González et al., 2017; Anderson et al., 2021). While juvenile white sharks (JWS) are physiologically capable of tolerating a wide range of water temperatures (6°C - 26°C), previous studies have shown they spend most of their time in water temperatures ranging from 14°C to 24°C (Dewar et al., 2004; Weng et al., 2007b; Bruce & Bradford, 2008; Curtis et al., 2018; White et al., 2019; Spurgeon et al., 2022). Individuals may behave in ways to maintain internal temperatures within their thermal preferendum to maximize growth during this more vulnerable lifestage. As such, JWS may benefit by spending a majority of their time in warmer water than adults (Klimley et al., 2002; Dewar et al., 2004; Weng et al., 2007b; Nasby-Lucas et al., 2009; Towner et al., 2013; White et al., 2019).
The Southern California Bight (SCB), extending from Point Conception, California to Bahia Sebastian Vizcaino, Mexico contains several JWS nursery habitats for the northeastern Pacific (NEP) population (Weng, et al., 2007a; Oñate-González et al., 2017; White et al., 2019; Anderson et al., 2021). Coastal water temperatures in the SCB can routinely fluctuate 2°C within a 12-hour period and have shallow (< 10 m deep), nearshore (< 1 km) seafloor and sea surface temperatures that vary by 13°C over the course of the year (Spurgeon et al., 2022). The vertical thermal structure of the SCB is weakly stratified in the winter and more stratified in the summer months, with the degree of stratification varying over potentially short periods of time (e.g., hours) (Winant & Bratkovich, 1981; Spurgeon et al., 2022). JWS have been observed showing high site fidelity at specific stretches of coastline (~3 - 8 km2) and forming loose aggregations (up to 40 individuals) throughout their NEP nursery area for weeks to months at a time (Anderson et al., 2021; Spurgeon et al., 2022). These areas are an ideal study site for understanding micro-scale environmental effects on shark behavior due to the heterogeneous conditions across the aggregation site experienced by the high density of individuals present. While temperature is a predictor of large-scale seasonal movement of JWS over annual cycles (White et al., 2019; Spurgeon et al., 2022), little is known about how micro-scale thermal changes influence movement patterns of JWS while resident at nursery aggregation sites.
We used high-resolution acoustic telemetry tracking data to quantify how ambient water temperature and vertical thermal stratification influence horizontal and vertical distributions of JWS. Determining the thermal gradients that JWS select for within a nursery aggregation site may improve fine-scale habitat suitability models and increase predictability of aggregation formation, thereby providing insight for effective conservation and potential public safety.
Methods
Study site
Passive acoustic telemetry and environmental monitoring were established at a JWS nearshore aggregation site at Padaro Beach near Carpinteria, CA, USA. This area was characterized as a south/southwest facing sandy beach habitat with patchy rock reefs and an adjacent, semi-open estuary. Water depths monitored ranged from 0 to ~10 m at distances from the shoreline to ~ 1 km offshore and encompassed most of the area where sharks were observed via unmanned aerial surveys (Rex et al., 2023) (Figure 1). Tagged JWS in the area were continuously monitored across a 5.5 km2 area from May to December 2020 and 2021, since many individuals would leave the aggregation site during winter months.
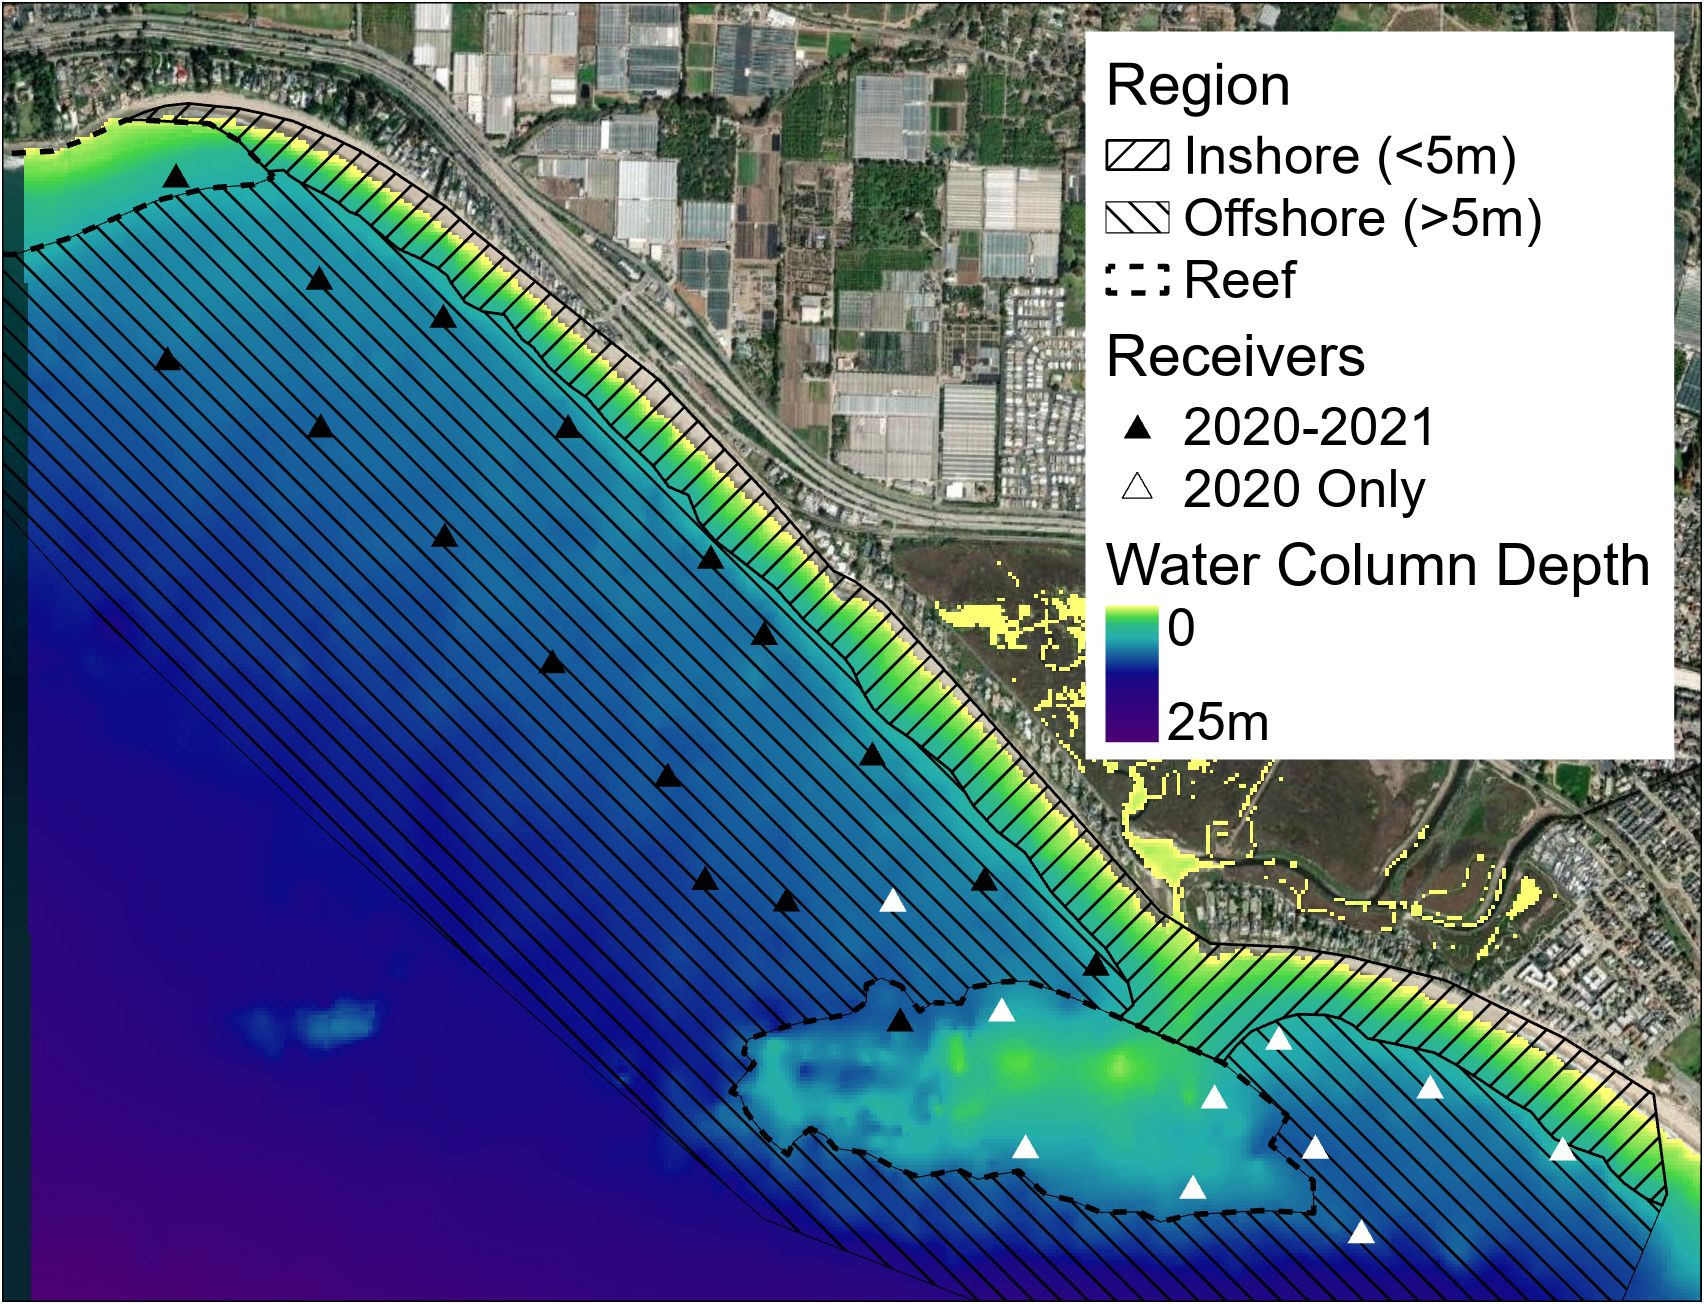
Figure 1 Map of receiver positions in 2020 and 2021 as well as general region layered on bathymetry data (California 1/3 arc-second MHW Coastal Digital Elevation Model) for the area sourced via NOAA. https://www.ncei.noaa.gov/metadata/geoportal/rest/metadata/item/gov.noaa.ngdc.mgg.dem:603/html#.
Tagging
All individuals were externally dart-tagged with either an Innovasea (Innovasea Systems Inc. | Boston, Massachusetts, USA) V13P coded acoustic transmitter (V13P-1x, 147–152 dB, 1-year battery life) equipped with a pressure sensor (0.15 m resolution, 34 m depth rating), a V16TP coded acoustic transmitter (V16TP-6x-BLU-2-0204m, 152-158 dB, 10-year battery life) equipped with a pressure (0.9 m resolution, 204 m depth rating) and temperature sensor (0.15°C resolution, 0 - 40°C range), or a V13TP coded acoustic transmitter (V13TP-1x-BLU-3-0034m, 147-152 dB, 1-year battery life) equipped with a pressure (0.15 m resolution, 34 m depth rating) and temperature sensor (0.15°C resolution, 0 - 40°C range). All transmitters had pseudo-random pulse intervals between 40 and 250 s to decrease probability of code collisions assuming a high proportion of tagged sharks showed high residency to a particular area. Prior to tagging, a GoPro™ camera at the end of a 2 m long pole was submerged under the shark to identify sex. The approximate size of the animal was estimated using aerial drone video at the time of tagging using ImageJ (NIH, v.1.8.0). To account for any error in aerial drone size estimates (P. Rex, Pers Comm), sharks and were grouped in the following size classes: 125 – 175 cm total length (TL), 175 – 225 cm TL, 225-275 cm TL, and 275 – 325 cm TL.
All tagging and tracking procedures were approved and conducted under the guidelines of the California State University Long Beach Institutional Animal Care and Use Committee (IACUC), protocol #364 and the State of California Department of Fish and Wildlife permit S-20057001-20105-001.
Tracking
To quantify relatively fine-scale movement of JWS across horizontal (± 3 m) and vertical space (± 0.2 m), we deployed a VPS (VEMCO Positioning System) acoustic array comprised of 27 Innovasea omni-directional VR2W (n = 10) and VR2Tx receivers (n = 17) spaced 250-500 m apart across the ~5.5 km2 study site from 15 May to 9 December 2020. In 2021, a smaller array made up of 17 omni-directional VR2Tx (n = 17) receivers spaced ~500 m apart across a ~4 km2 area was deployed from 4 May to 10 December 2021 (Figure 1). VPS uses time difference of arrival (TDOA) of moving transmitters among three or more receivers to tri-laterate a geo-position of the individual in the array (Espinoza et al., 2011; Orrell & Hussey, 2022). Raw derived geoposition estimates were filtered using horizontal position error (HPE) to include data where HPE was ≤ 7. HPE is a unitless error measurement and in this system, an HPE of ≤ 7 equates to approximately ≤ 3 m of horizontal positional error.
Environmental monitoring
To measure how temperature influences JWS movement within the aggregation site, we collected continuous sea surface (SST) and seafloor temperature (SFT) at each receiver station. Water temperature ~ 1 m from the seafloor was collected using either a HOBO (Onset Computer Corporation | Cape Cod, Massachusetts, USA) Stowaway TidbiT v2 UTBI-001 (0.1°C resolution and ± 1°C accuracy), the internal thermistor of the VR2Tx receivers (0.1°C resolution with ± 0.5°C accuracy), an aquaMeasure sensor (0.01°C resolution, ± 0.2°C accuracy), or Electric Blue (ElectricBlue | Vairão, Porto, Portugal) EnvLogger (0.1°C resolution and < 0.2°C accuracy). Sea surface temperatures were collected in the first 0.1 m of water using either Electric Blue EnvLogger (0.1°C resolution and < 0.2°C accuracy) or the built-in thermistor on the Rx-Live cabled acoustic receiver (0.01°C resolution, ± 0.2°C accuracy). The distribution of sensor types varied across years.
To aid in quantifying 3D thermal gradients and improve spatial interpolations for continuously monitoring stationary temperature loggers, we also used an Iver 3 autonomous underwater vehicle (AUV) (L3Harris Technologies | Melbourne, Florida, USA) equipped with a Xylem/YSI sonde suite (YSI Inc. | Yellow Springs, Ohio, USA). We ran 18 undulating surveys from the sea surface to 1.5 m above the seafloor across a 4 km2 area mapping thermal differences across distance and depth gradients. Surveys were run in a lawnmower pattern with each leg spaced 60 m apart and sampling occurring roughly every 1.5 m (Supplementary Figure F1). Surveys were run every 2-4 weeks to minimize influence on shark behavior but to still capture temperature changes across time throughout the duration of the study period.
Data analysis
Depth distribution across time and space
To measure the diel depth distribution of JWS and how that pattern differed across time, average shark depth per hour was calculated for each month across both years. Generalized additive mixed models (GAMM) were used to determine if there were any significant differences in JWS depth distribution over time (i.e. month and hour of the day). The models included hour of day as a cyclic smoothed variable, month as a categorical fixed effect, and individual shark as a random effect. Residual plots were viewed to confirm the data were not autocorrelated and the model with the lowest Akaike Information Criterion (AIC) value was chosen. All data were filtered and analyzed using R version 4.0.3 (RStudio Team, 2020) unless otherwise stated. Since different sharks were tagged and tracked at the aggregation site each study year with transmitters of different resolutions, each year was analyzed separately unless otherwise stated.
To quantify how depth use varied over the spatial extent of the array, we determined the locations where sharks were horizontally distributed over time with respect to the seafloor (i.e., horizontal space use patterns in context of depth). To do this, we used a Hot Spot Analysis (HSA) (Getis-Ord Gi*) using ArcGIS Pro™ version 3.0.3 for each week of shark positional data to identify statistically significant spatial clusters of where the sharks are using either the bottom third of the water column (deemed “hot spots” for this analysis) or top third of the water column (deemed “cold spots” for this analysis) (Getis & Ord, 1992; Esri, 2022). Positional data were pooled by week to provide sufficient number of geo-positions for the analysis. The total water column depth for each position was determined using mean high tide water level obtained through a NOAA bathymetry dataset (Del Greco &Ansari, 2008). Using the total water column depth and the shark depth obtained from the pressure sensors on the transmitters, we calculated a distance from the seafloor for each position. Shark geo-positions acquired from VPS renderings were then assigned a score (1-3) depending on where it was in relation to the water column, with three being in the bottom third of the water column and a score of one being at the top third. The HSA considered each position within the context of neighboring positions to determine statistical significance by proportionally comparing the local sum for each positional score and its neighboring scores to the sum of all positional scores during that week time period. Tidal height was not taken into consideration in this analysis.
Interaction with available thermal habitat
To determine if JWS occupied a narrower range of temperatures than was available, we interpolated all vertical and horizontal temperatures collected through time at the aggregation site. For this, we implemented a Feed Forward Neural Network (FFNN) temperature model using water temperature as a function of location, depth, and time throughout the array from Anderson et al. (2022) and retrained it with temperature data from 2021 (mean absolute error rate < 0.3°C). Each VPS rendered position was run through this model to obtain a predicted temperature of each occupied location of each tagged JWS in the array and will be henceforth referred to as the “occupied” temperature. To create an “available” habitat data frame to determine what temperatures were available to the sharks at an hourly temporal resolution throughout the array across each year, ArcGIS Pro was used to grid the 3D habitat (250 m x 250 m horizontally x 2 m vertically) along the depth gradient of the habitat obtained from bathymetry data. The center point latitude and longitude for each cell at each depth for every hour was then run through the FFNN to obtain temperatures constituting “available” habitat to the sharks. All shark positions were assigned a grid ID of the horizontal cell they were found within (Figure 2). To determine if there was a temperature threshold (Tt) that the JWS were responding to, we used a Chi square test to compare the percentage of occurrences in 1°C bins for temperatures the JWS occupied relative to the temperatures available to them at the time for both years combined. The Chi square was used to identify if there were change points where JWS altered their selection preferences for or against a thermal range. The temperature at which this preference switched is henceforth defined as a temperature threshold (Tt).
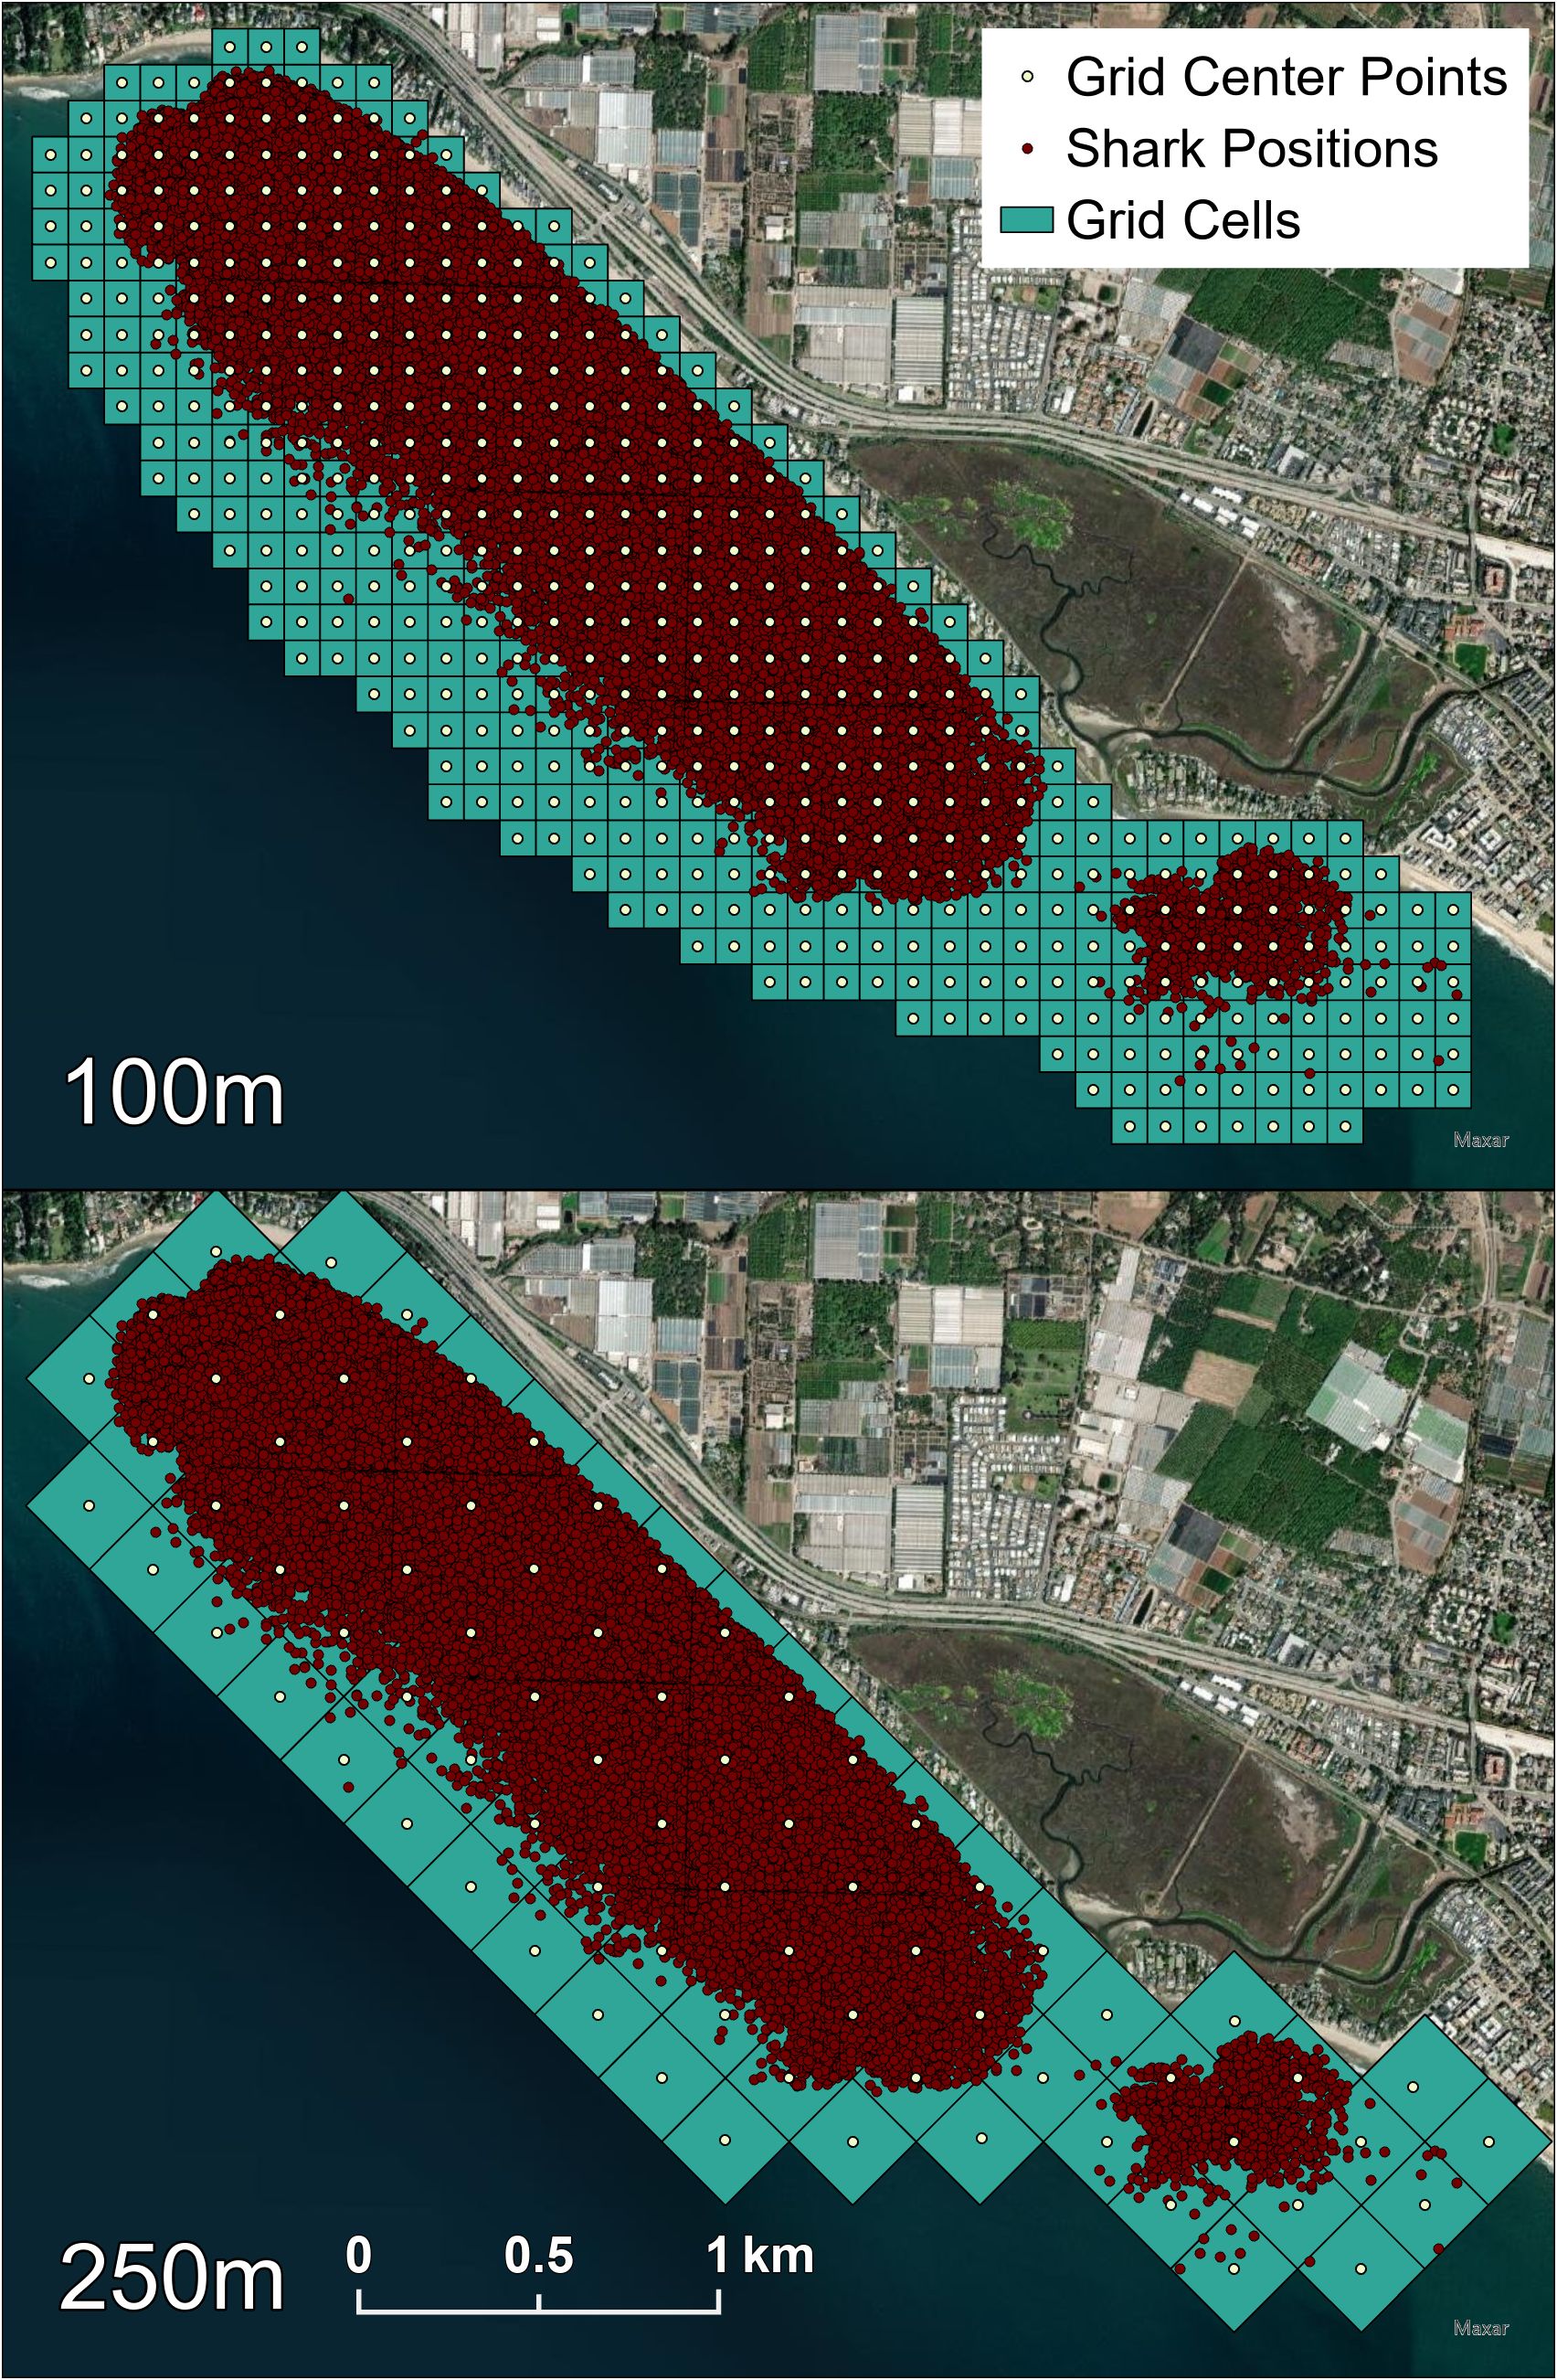
Figure 2 Both the 100 m by 100 m and 250 m by 250 m grid cells that each shark position was associated with. The 250 m grids were also used to obtain available temperatures at each center point. Red dots represent all VPS calculated shark positions that were each assigned both grid IDs.
We conducted polynomial interpolations and fit curves across the available water column temperatures for each 250 m x 250 m grid center point to quantify the water depth at which the vertical thermal gradient reached below Tt (which will be referred to as dT) for every hour of each year. The thermal gradient of the water column is highly variable, which could lead to the entire water column at any given time and location being warmer than Tt, so in those cases dT was assigned the maximum water column depth at that center point location. If the entire water column was colder than Tt, dT was assigned 0 m. All VPS positions were then assigned a thermal threshold depth based on the grid ID it occupied at that given time. Each shark’s relative vertical position to dT, was assigned as being either “above” or “below” depending on the shark’s position in the water column. We compared the proportion of occurrences of occupied positions above or below dT to the proportion of occurrences of available gridded positions above or below dT using a Chi square test for each year to identify if the shark’s relative position was random in relation to the available thermal habitat.
To quantify other aspects of microhabitat use, we used ArcGIS Pro to assign the general region the sharks occupied as classifications: reef (positions over rocky substrate), inshore (positions not over rock in less than 5 m of water), or offshore (all other positions) (Figure 1). We also standardized JWS positions to boost locational sample size while maintaining high spatial resolution by assigning each VPS position a grid ID number from a 100 m x 100 m grid of the study site (Figure 2). Once all metadata were added to the dataset, we tested for multicollinearity to eliminate adding redundant variables to the model and undermine any statistical significance (Supplementary Figure F2). GAMMs were run to compare the shark’s distance from the seafloor to temperature, day of the year, hour of day (as a cyclic smoother), sex and size class of the animal, 100 x 100 m grid ID, general region occupied, dT, and JWS relative position to dT. Day of the year was used to account for potential seasonal patterns while considering high daily thermal variability. Models were run separately by year since there was no overlap in individuals across years. To account for individual variation, shark ID was used as a random effect. Multimodel inference was applied to account for model selection uncertainty and reduce model selection bias (Burnham et al., 2011), and ranked by AIC values. If several models had AIC values within 2 points from one another, and had the same degrees of freedom, the model with the fewest predictors was chosen.
Results
From May 2020 to September 2021, twenty-two JWS were tagged at the aggregation site, ranging in size from 155 cm to 289 cm TL (Table 1). Acoustic monitoring yielded 139,032 geo-positions with an HPE ≤ 7 across both years (n = 110,897 in 2020 from 6 sharks and n = 28,135 in 2021 from 16 sharks). In 2020, shark depths ranged from 0 to 10.5 m (mean = 1.4 m, median = 0.15 m) with occupied temperatures calculated via the FFNN model ranging from 12.3 to 23.2°C (mean =18.3°C). In 2021, individual shark depth ranged from 0 to 10.9 m (mean = 1.8 m, median = 1.4 m), and they occupied temperatures ranging from 11.9 to 24.4°C (mean = 16.9°C). We calculated hourly available temperatures from 3,059,160 total grid cell positions spanning 3D space across both years. Derived available temperatures in 2020 ranged from 12.3 to 22.4°C (mean = 16.6°C) and 2021, ranged from 11.1 to 23.5°C (mean = 16.2°C). JWS spent 71% of their time within two meters of the sea surface regardless of total water column depth which was significantly disproportionate to the available habitat (X2 = 54.344, p = 0.0005) (Figure 3).
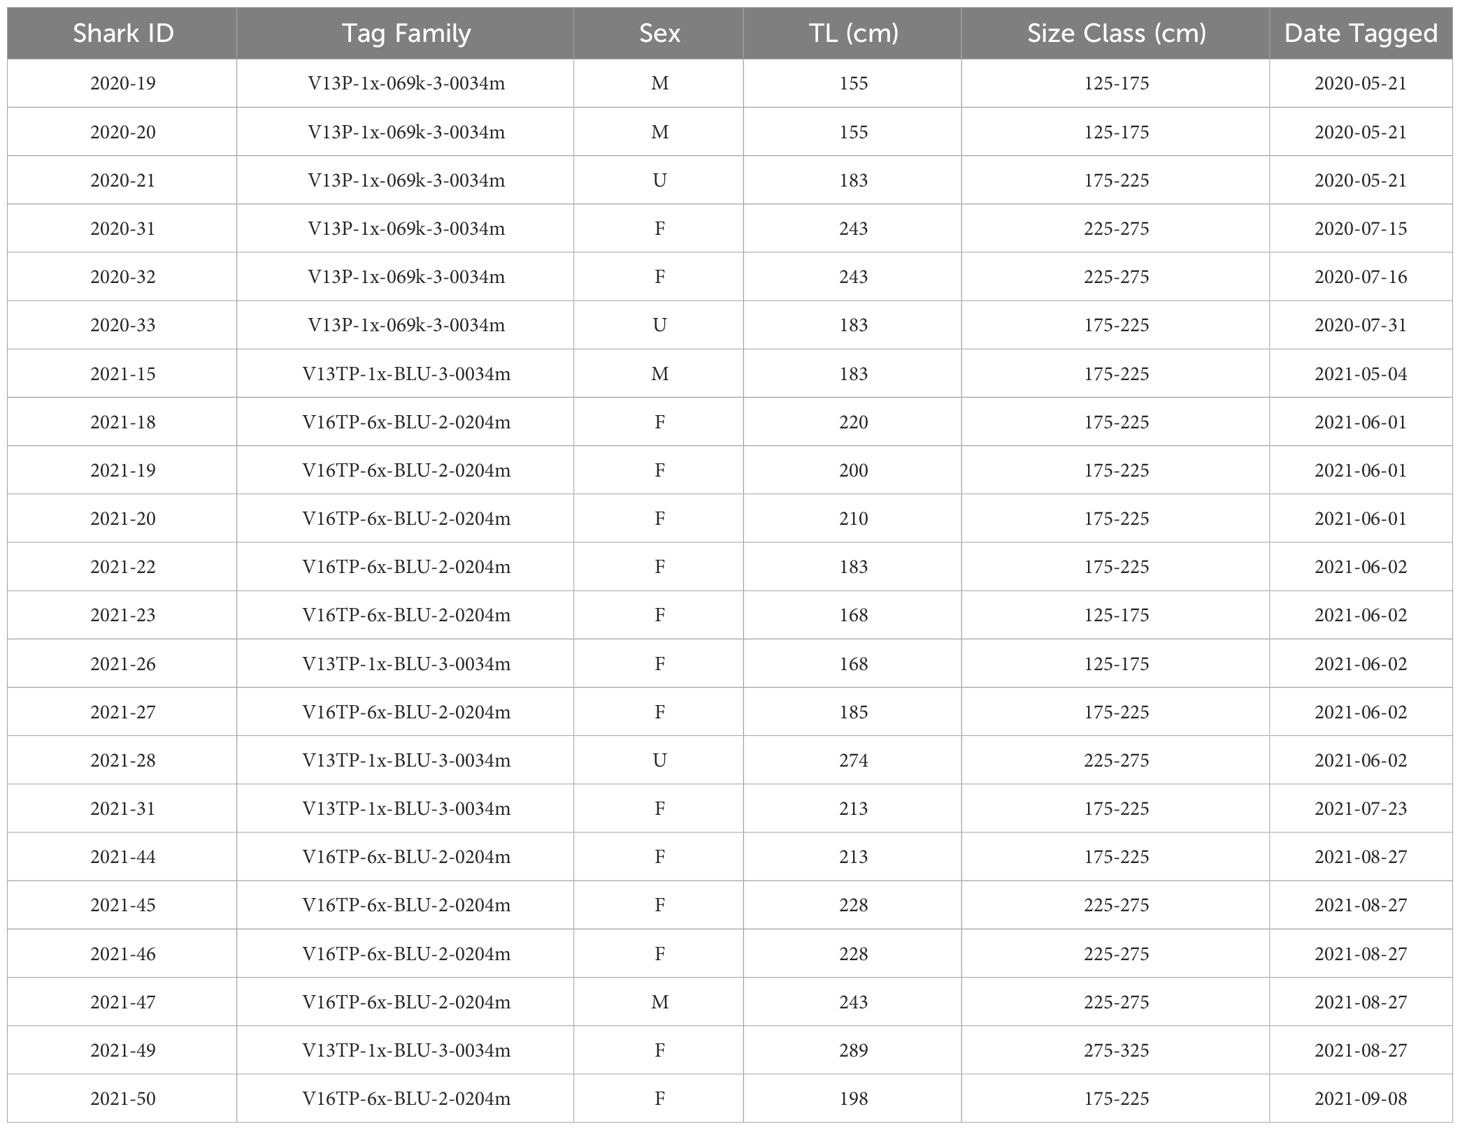
Table 1 Full list of JWS tagged with depth sensor transmitters, their estimated total length, approximate size range and sex (M = male, F = female, U = unidentified).
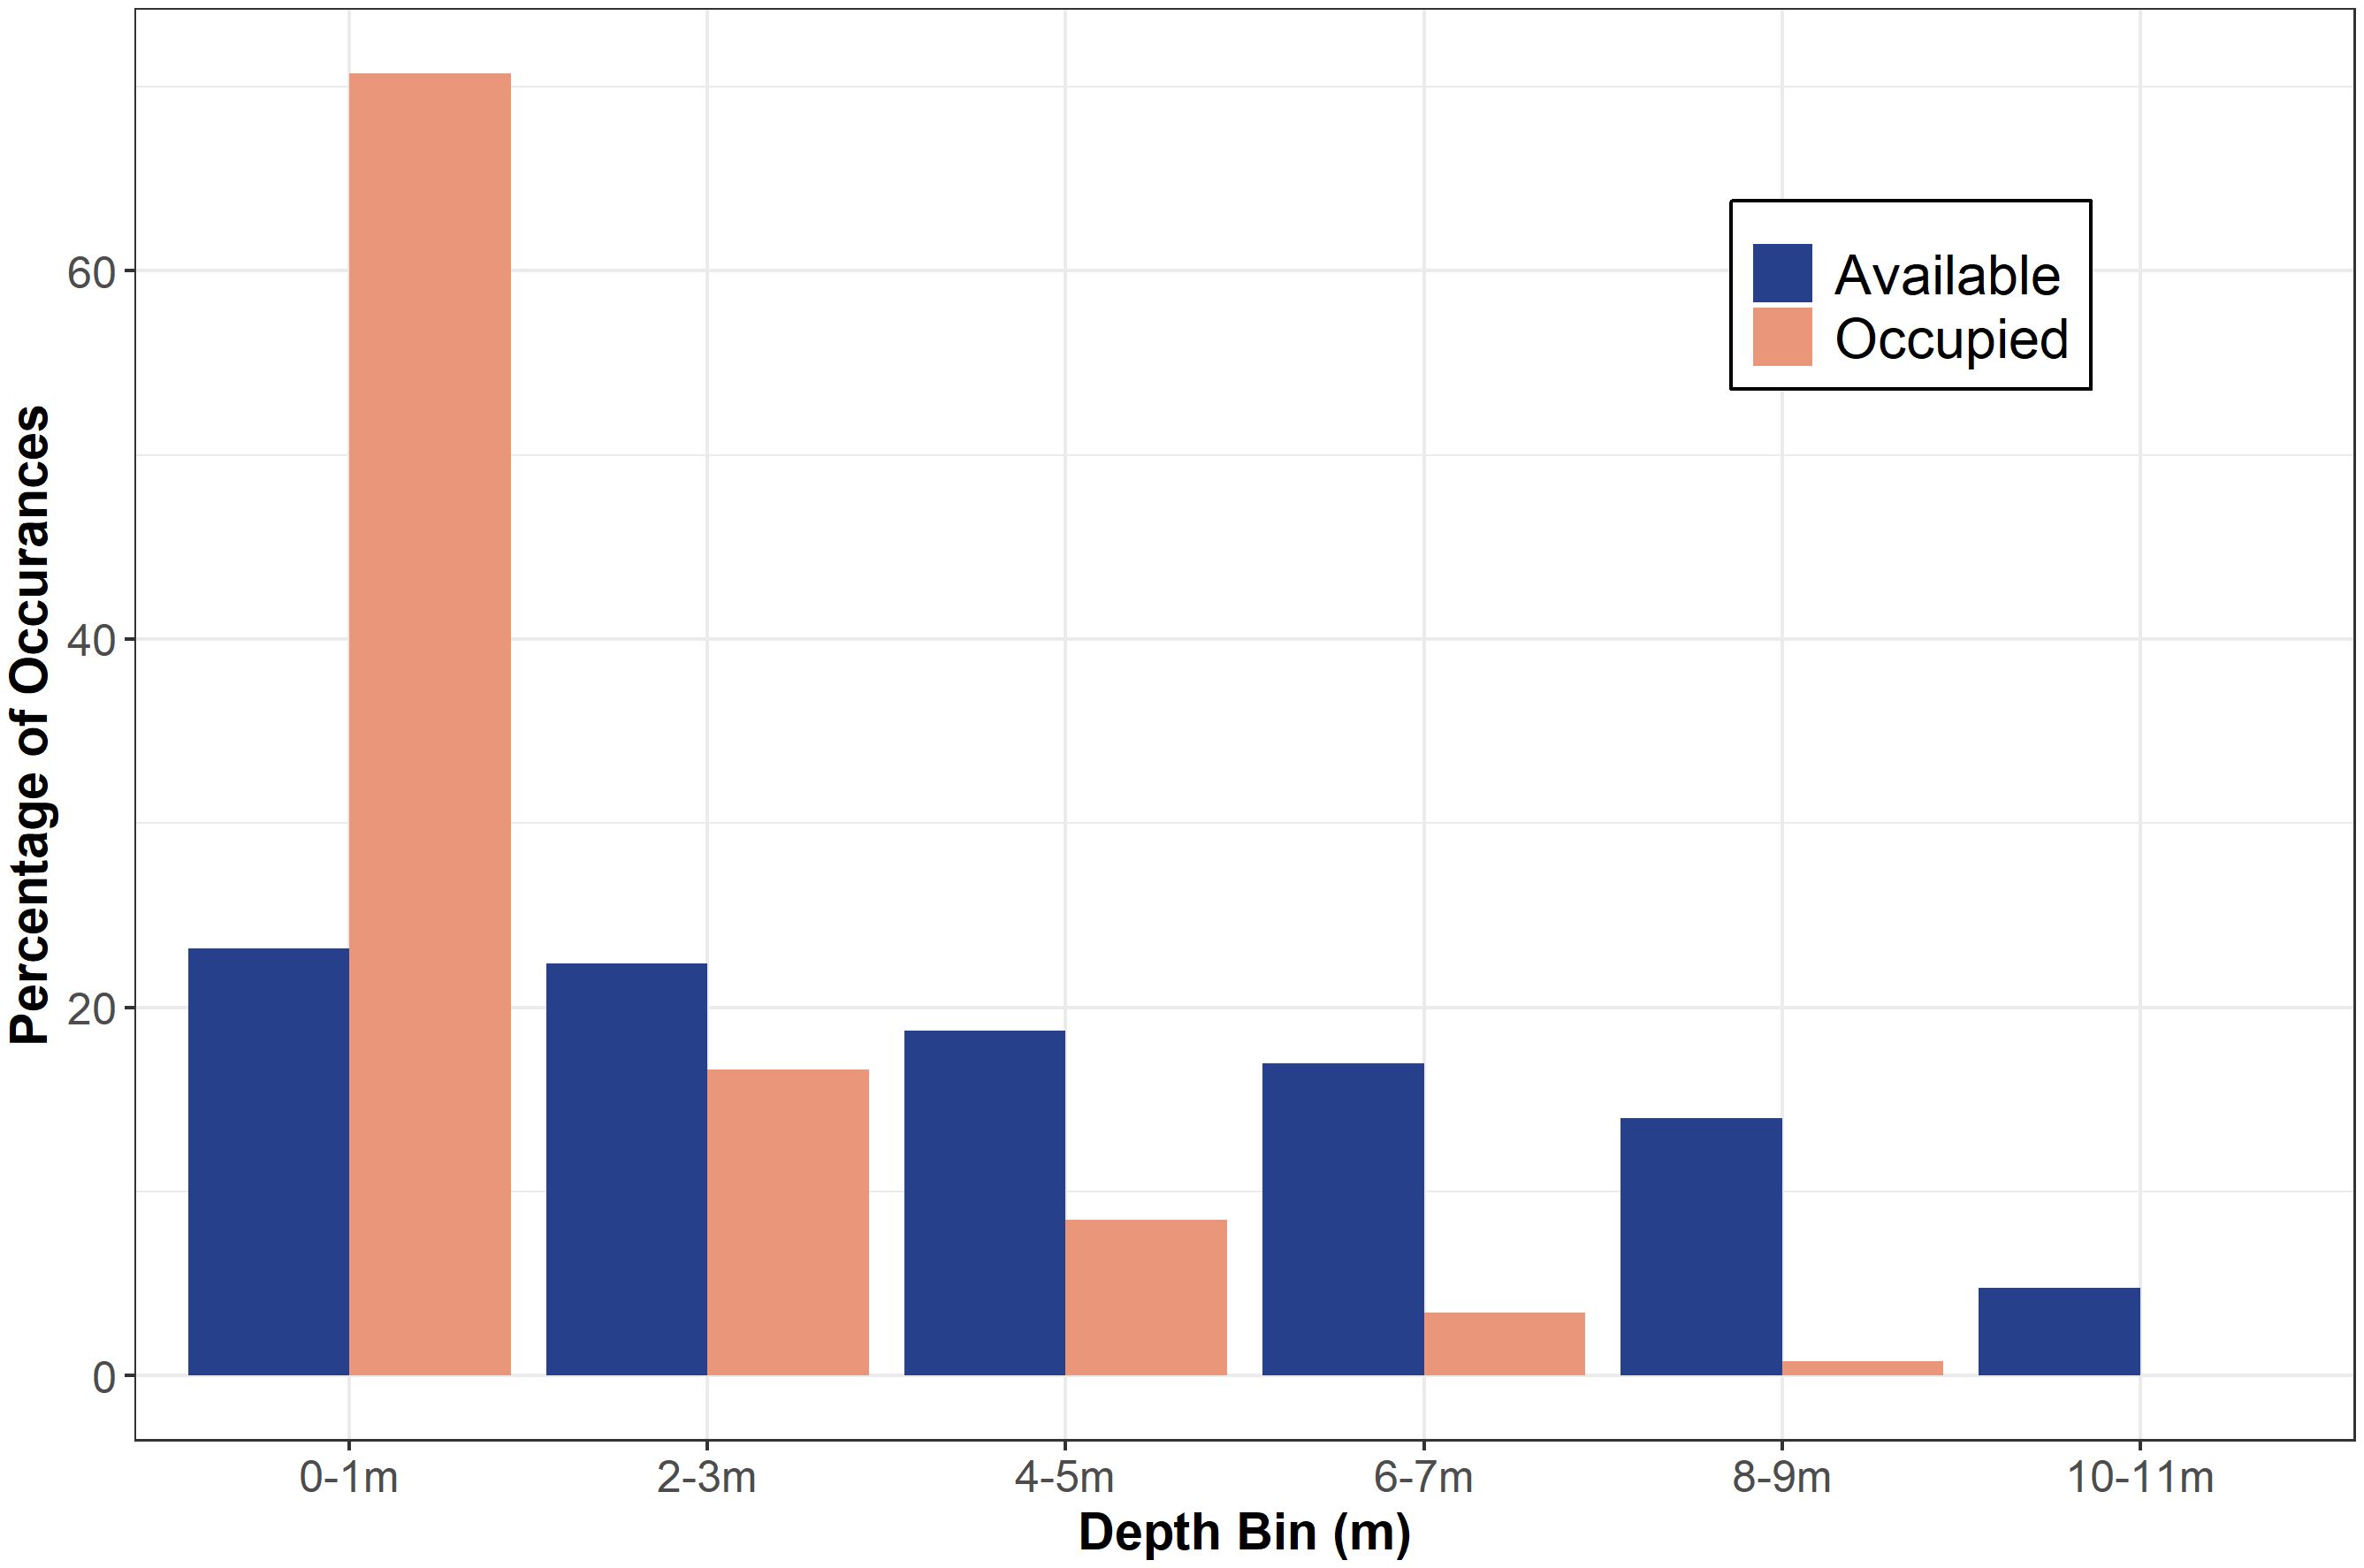
Figure 3 The percentage of occurrences of available depth (out of 3,059,160 positions) and occupied depth (out of 139,032 positions) data in each two-meter depth bin for both years combined.
The sharks disproportionately used warmer waters than were available throughout the monitored area (X2 = 26.4, p = 0.002) and residuals showed a strong negative association between occupied and available temperature bins beginning below 16°C (Figure 4 & Supplementary Figure S3). JWS spent 80% of their time in waters ranging from 16 to 21.9°C. There was no significant difference in occupied vs available temperature use distributions in the 16°C to 16.9°C bin range (Figure 4). Above that range, there was a positive correlation in shark occurrence and temperature until temperatures were above 22°C and there was no difference in occupied and available temperature (Figure 4 & Supplementary Figure S3). Due to this pattern of thermal habitat use, the thermal threshold temperature (Tt) was set at 16°C. In addition, there was a significant difference between the available and occupied positions relative to the thermal gradient threshold depth (dT) in both years, indicating that sharks were significantly selecting for depths above dT (2020: X2 = 21.35, p < 0.01, 2021: X2 = 8.27, p < 0.01).
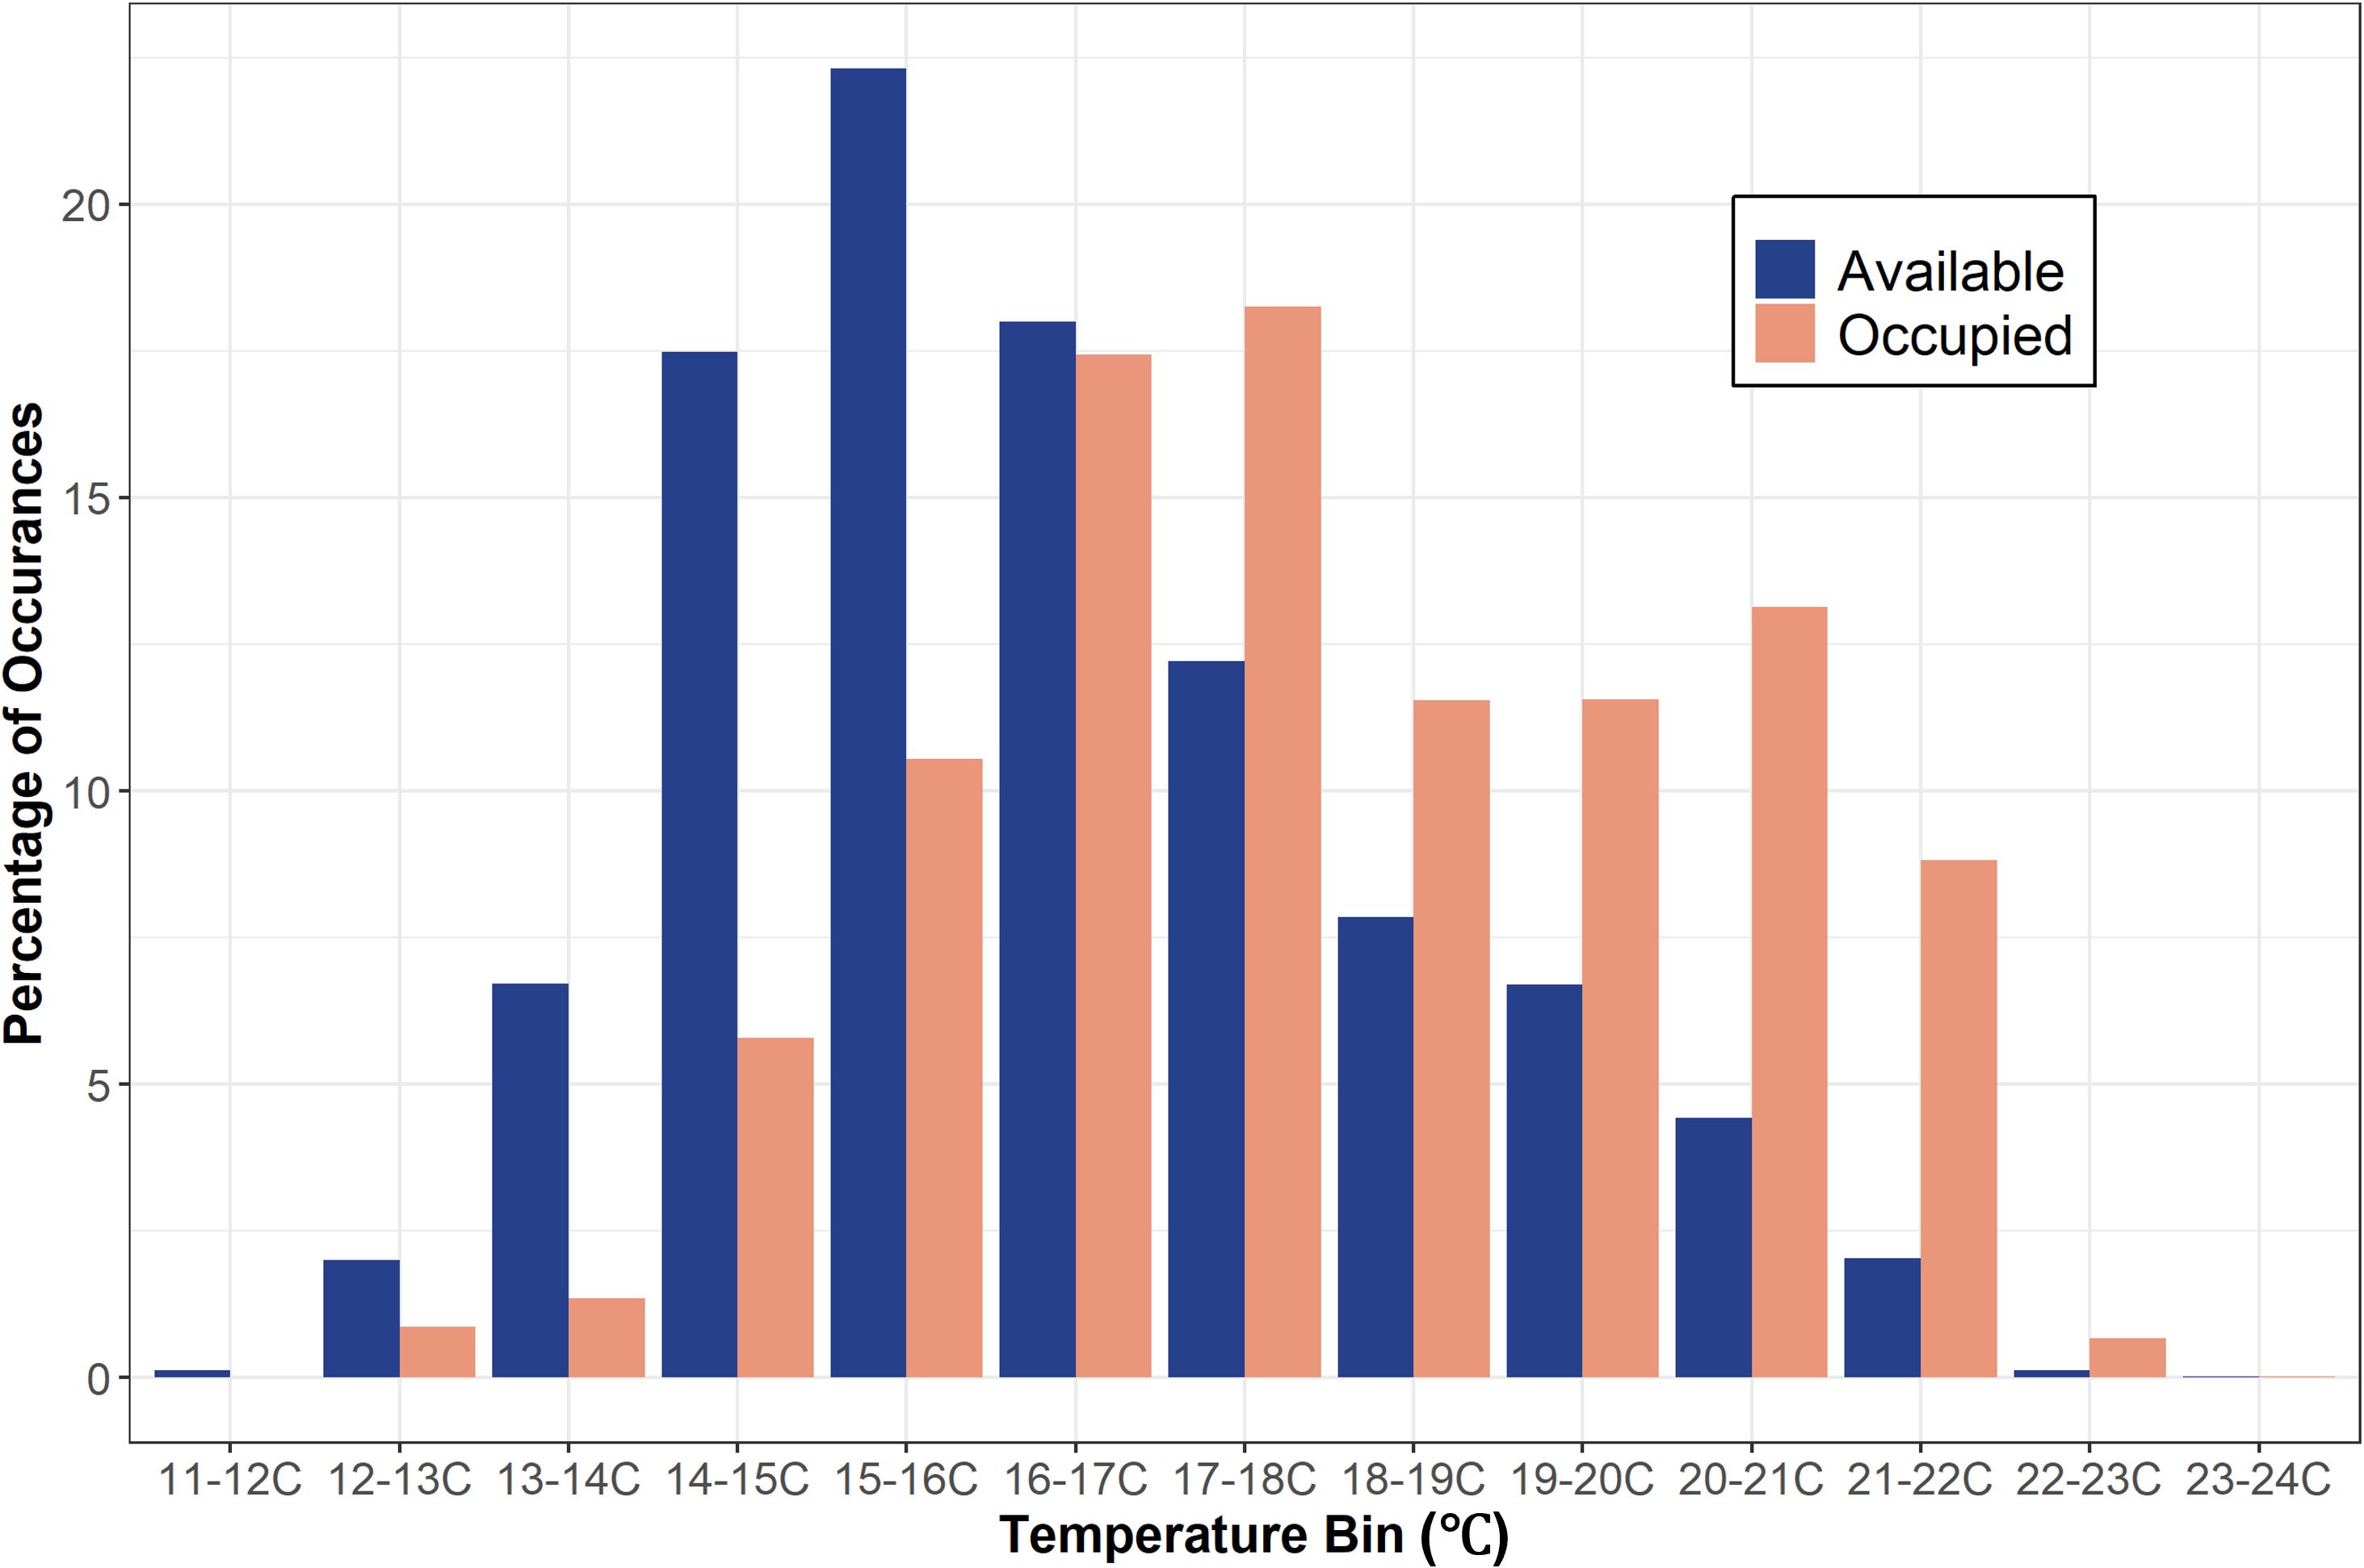
Figure 4 Bar graph showing the percentage of occurrences of available temperature (out of 3,059,160 positions) and occupied temperature (out of 139,032 positions) data in each temperature bin for both years combined.
Available habitat rendered via the FFNN model confirmed that the aggregation site has highly variable three-dimensional thermal structure and that stratification of the water column changed throughout the course of a day and throughout the year. Differences between SFT and SST ranged from 0.33 to 8.29°C in 2020 and 0.65 to 7.64°C in 2021 throughout the monitored area (Figures 5, 6).
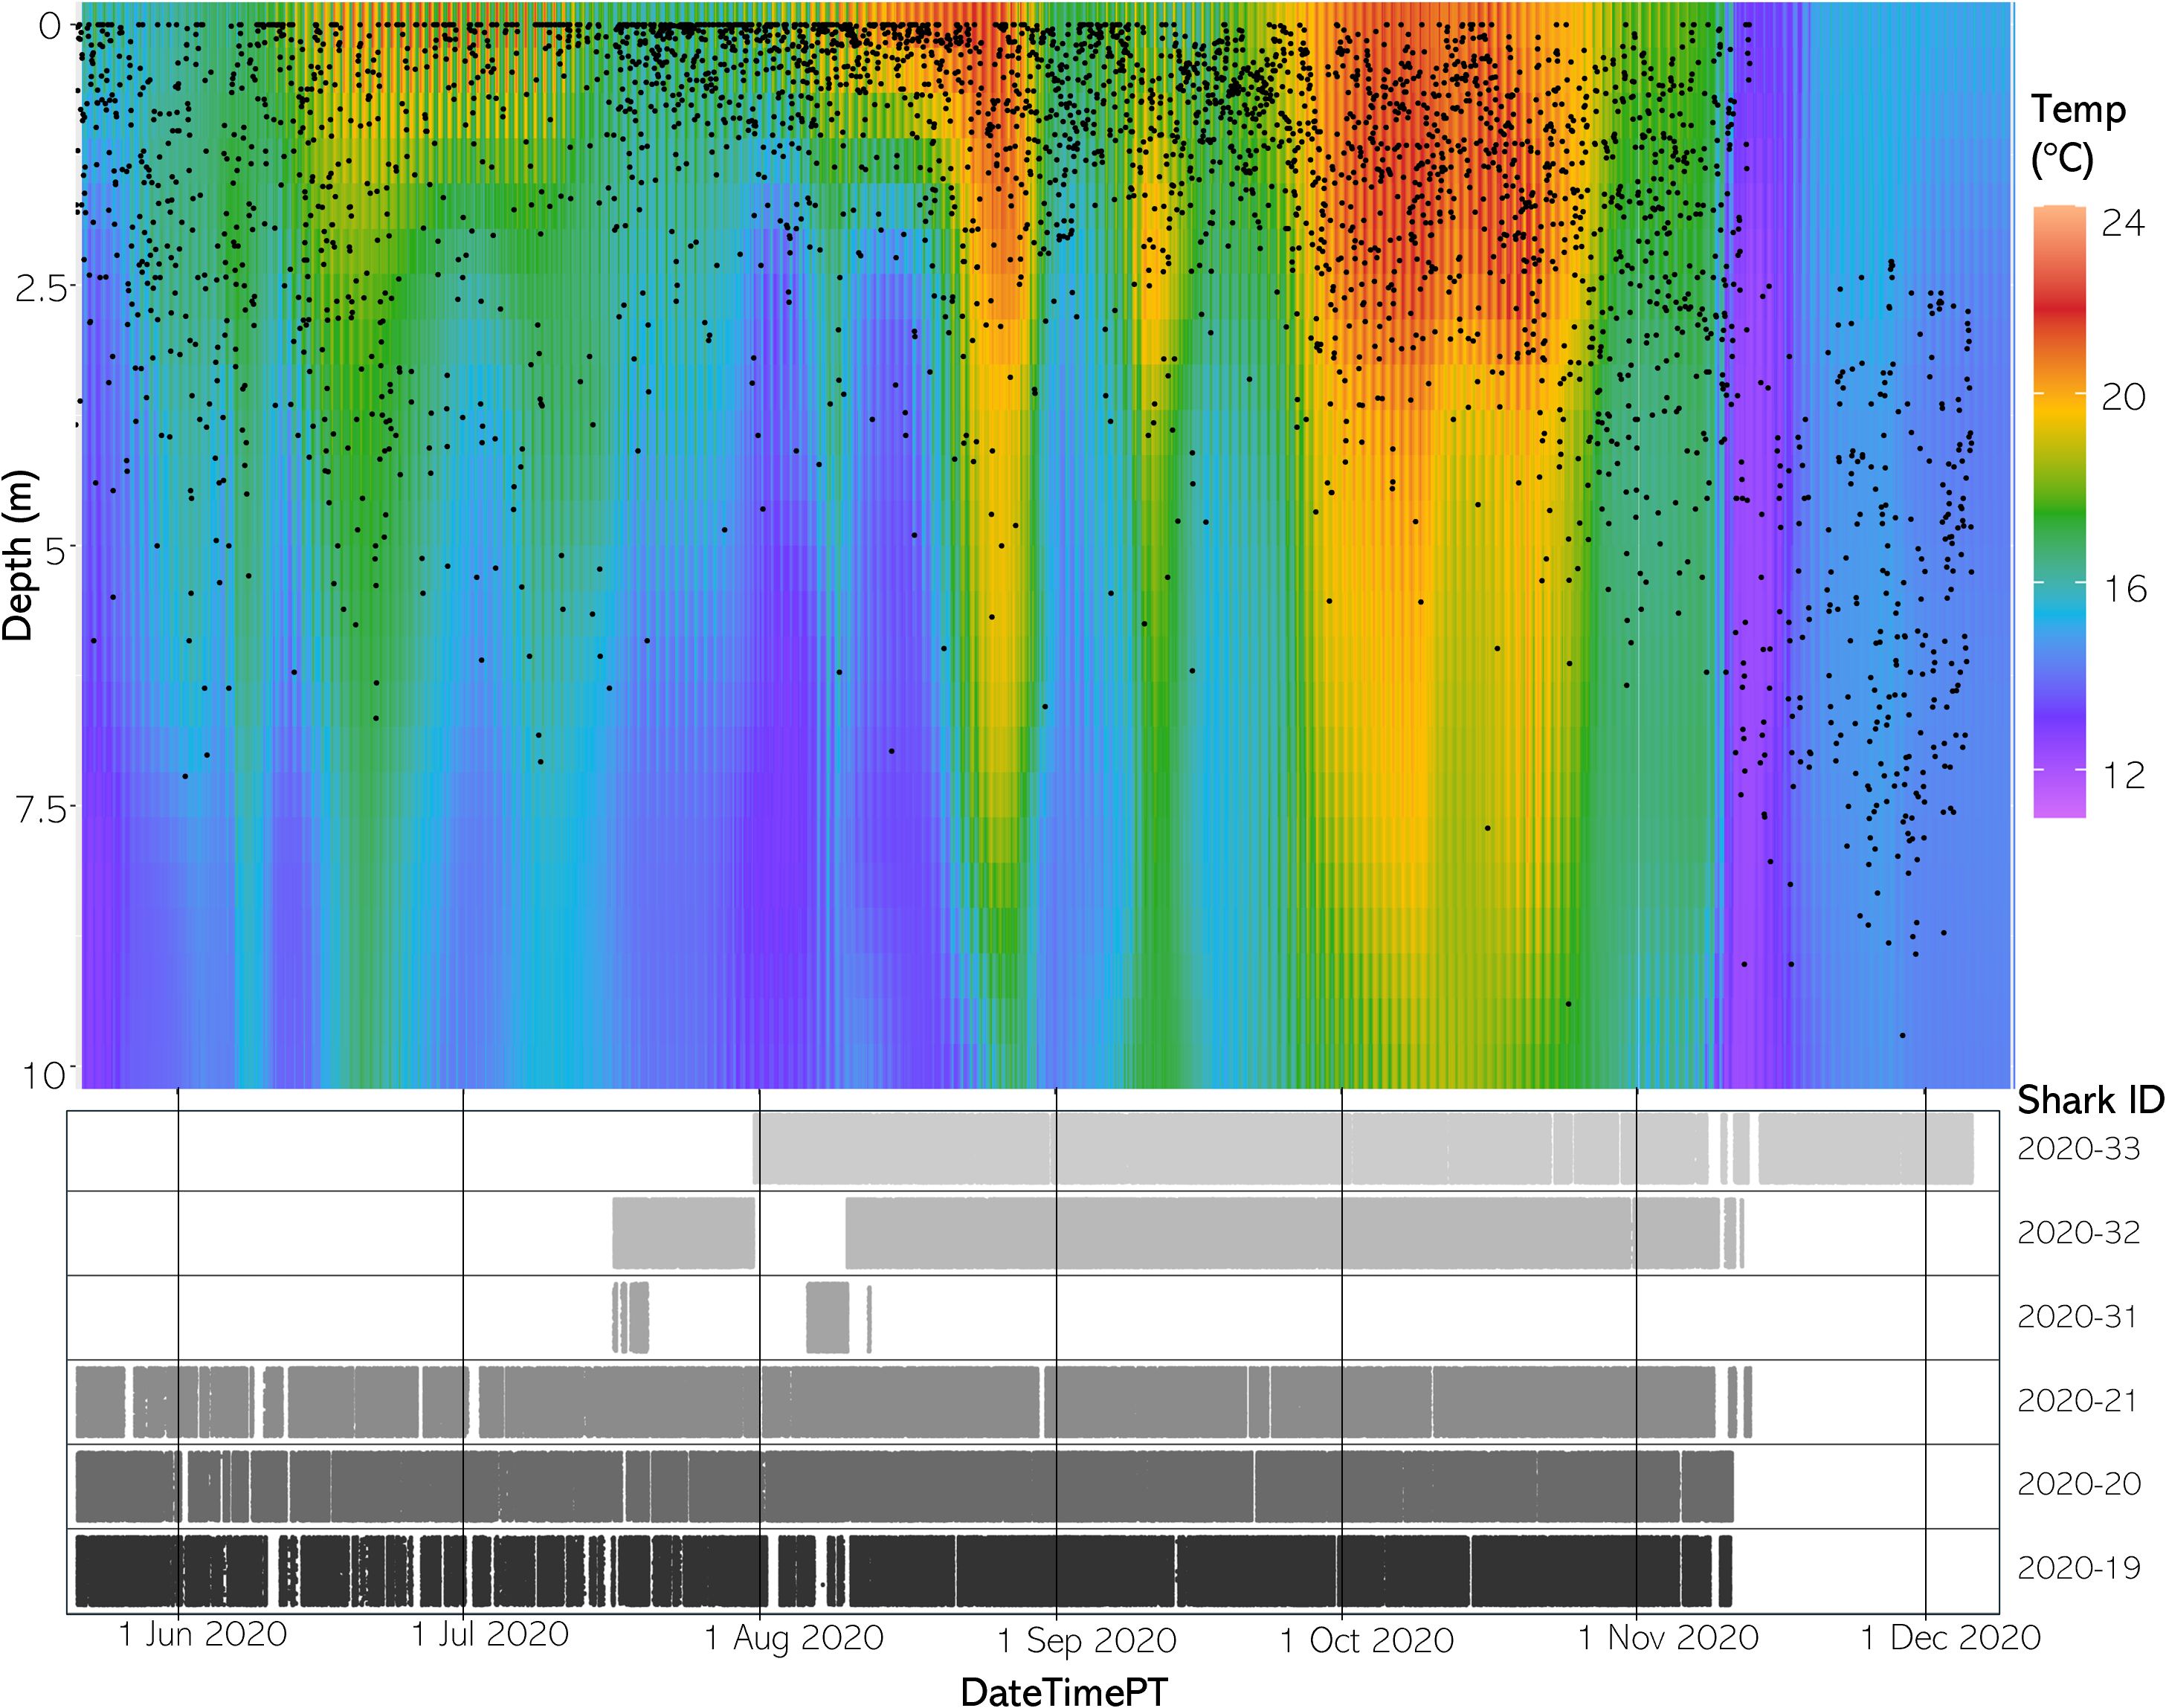
Figure 5 (Top) The vertical thermal structure for average hourly temperature May to December 2020. Black dots represent average shark depth at that same hour. (Bottom) An abacus plot showing the six sharks present across May to December 2020 and their detection occurrences at the study site. Each dot represents a unique shark detection.
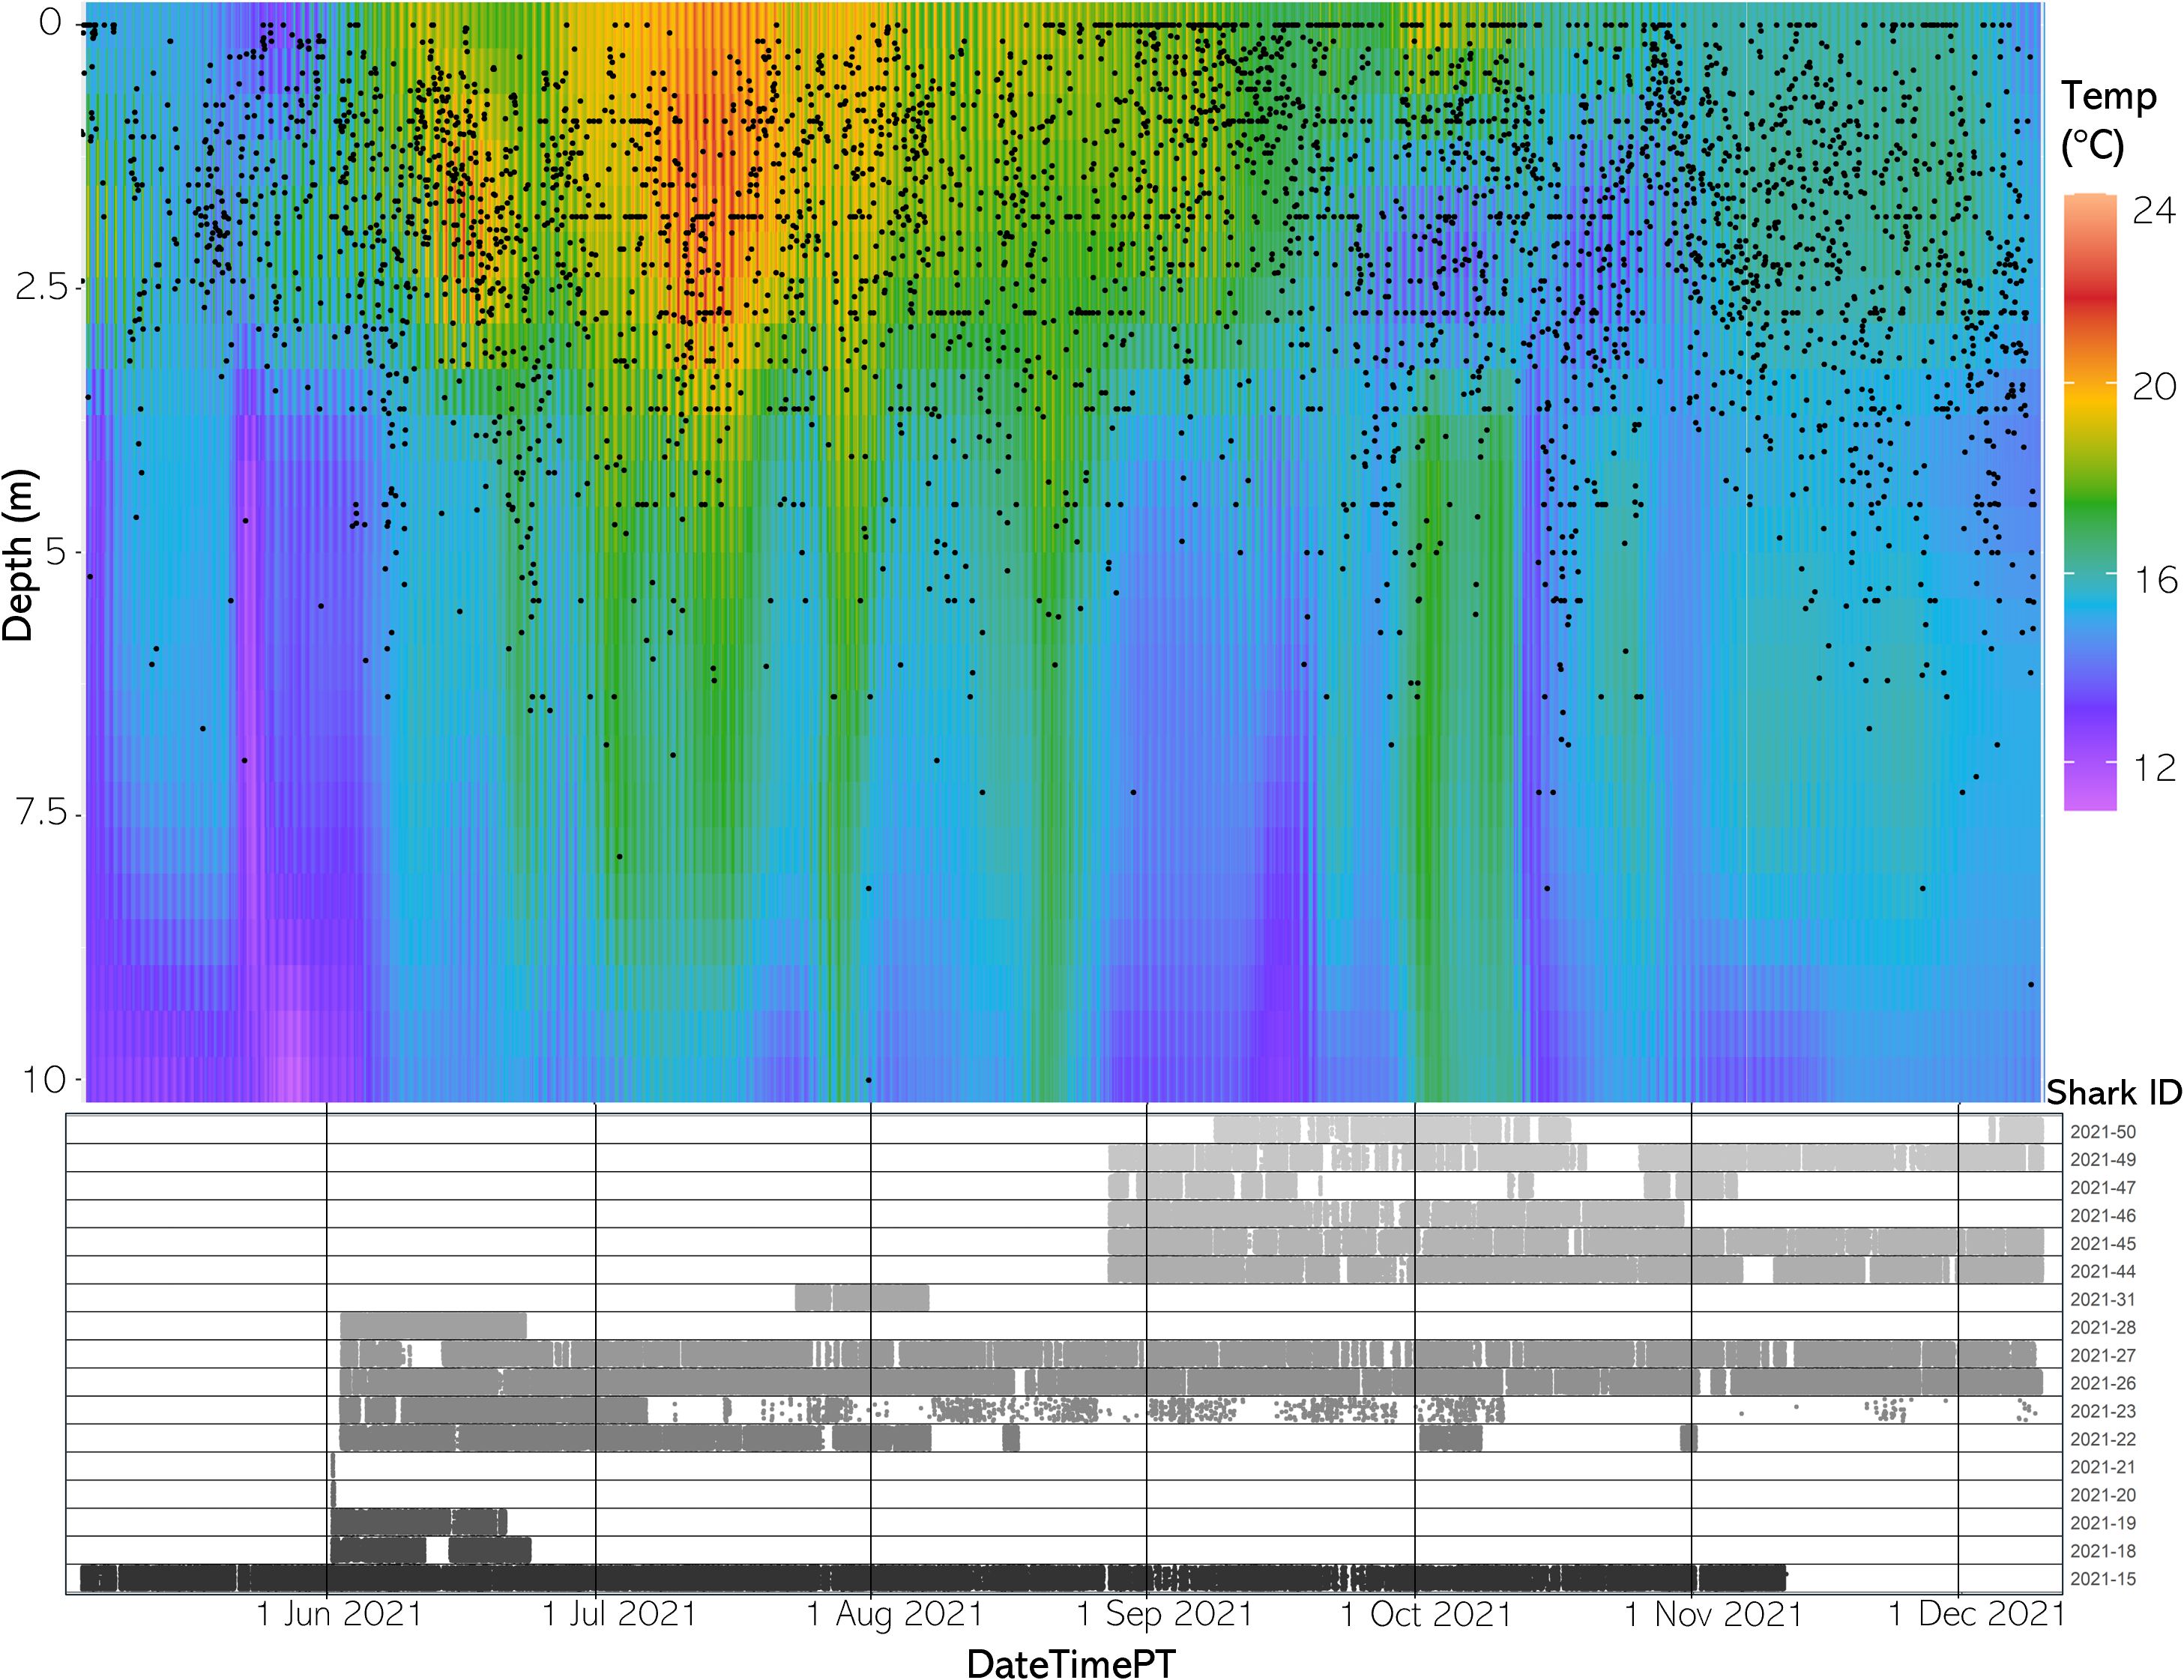
Figure 6 (Top) The vertical thermal structure for average hourly temperature from May to December 2021. Black dots represent average shark depth at that same hour. (Bottom) An abacus plot showing the six sharks present across May to December 2021 and their detection occurrences at the study site. Each dot represents a unique shark detection.
Spatiotemporal depth distribution
JWS depth was significantly influenced by both hour of the day and month across both years with the 2020 model explaining 39.9% of the deviance and the model for 2021 explaining 29.9% of the deviance in the data (Figure 7, Supplementary Tables T1, T2). The sharks showed a deeper depth distribution in 2021 than in 2020. There was high variability in the depth of JWS across times of day each year where sharks had deeper depth distributions during dawn and dusk periods and were at the most shallow in the late afternoon (Figure 7). The sharks also showed an affinity towards deeper depths in the colder fall and winter months and shallower depths during the warmer spring and summer months. While this general distribution remained constant across both years, the hourly vertical space-use profile of the JWS changed depending on the vertical thermal gradient at the time (Supplementary Animations A1, A2 for all weeks, Figures 8A-12A for representatives from different thermal regimes).
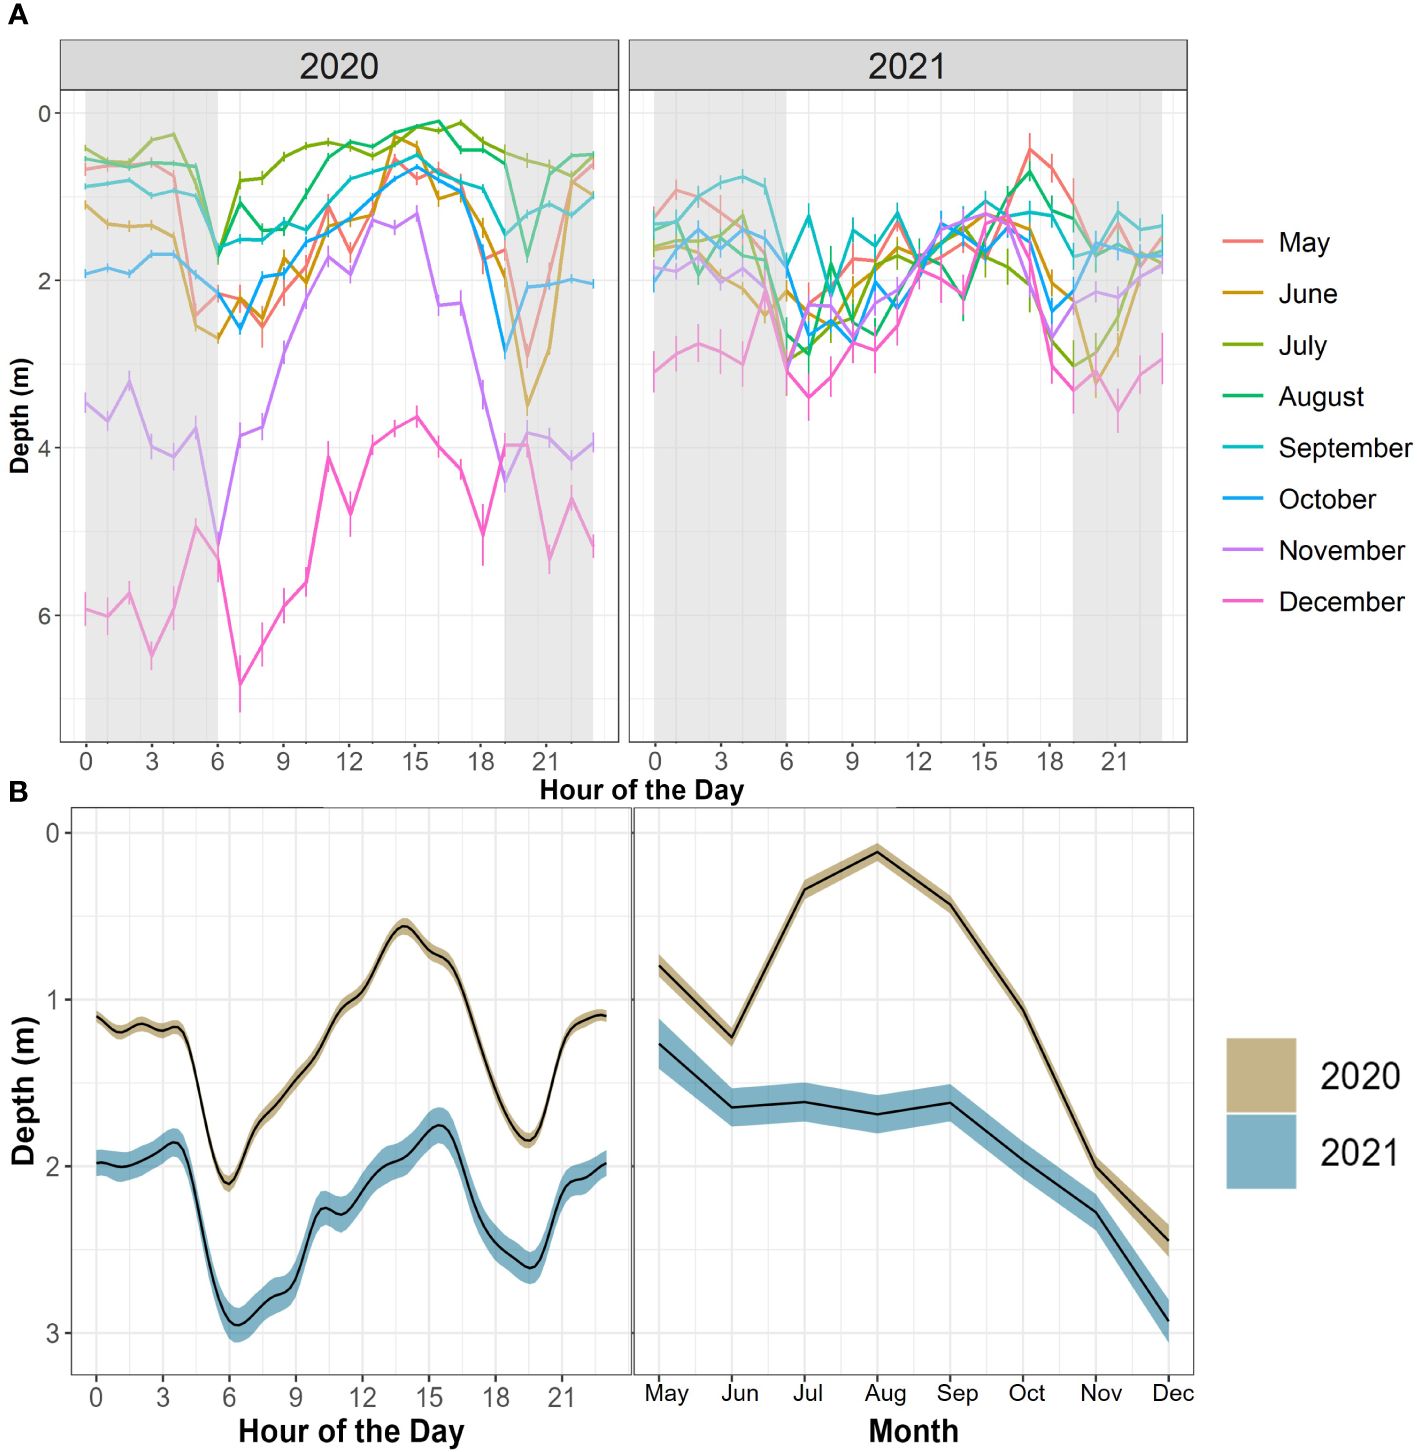
Figure 7 (A) Mean JWS depth across hour of the day and month of the year from May to December of 2020 and 2021. Error bars represent standard error. Grey shading represents the average period between dusk and dawn across the year. (B) GAMM predictive plots of shark’s smoothed occupied depth as it relates to two different, significant covariates across both years (hour of the day and month) surrounded by their respective 95% confidence intervals.
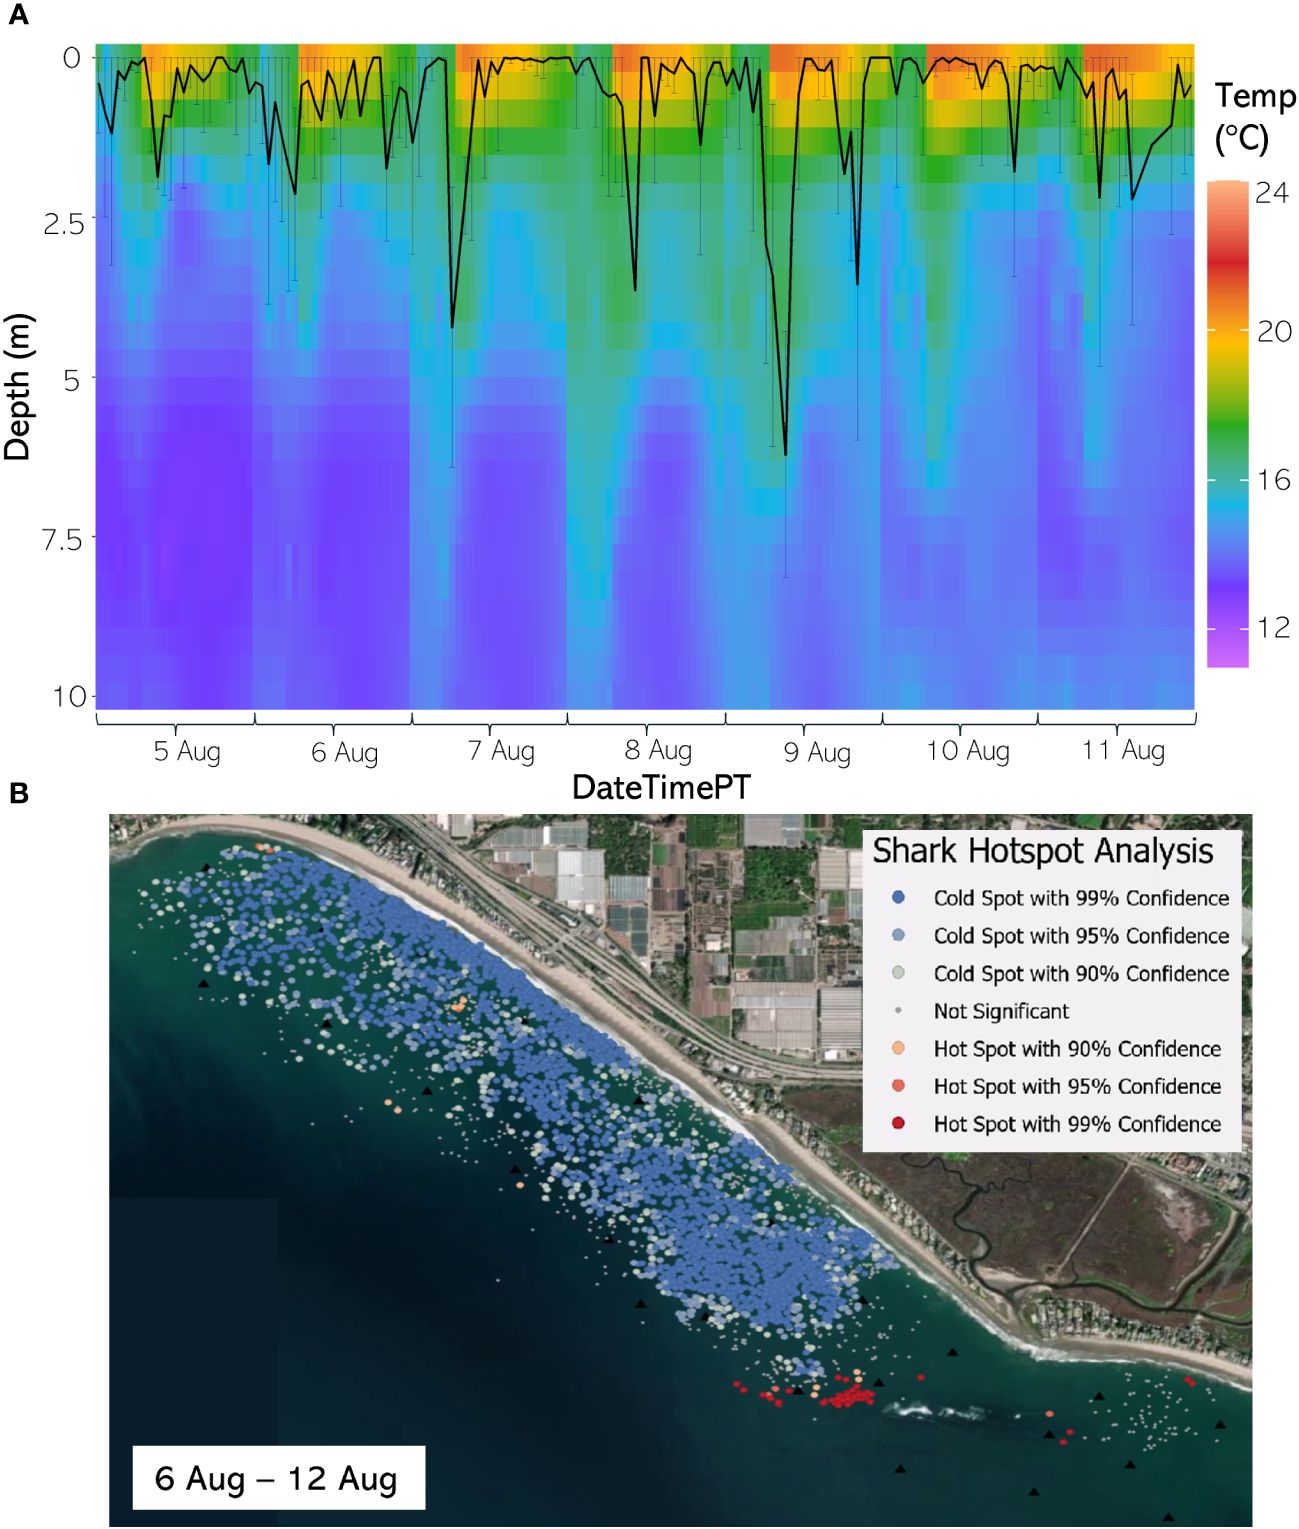
Figure 8 (A) From 5 Aug through 11 August 2020, the hourly average depth of the JWS ± SD plotted on the hourly average thermal gradient of the water column across the study site. (B) From 6 Aug to 12 Aug 2020, the results of the hotspot analysis showing where sharks are significantly in the bottom of the water column (red) or significantly at the surface of the water column (blue).
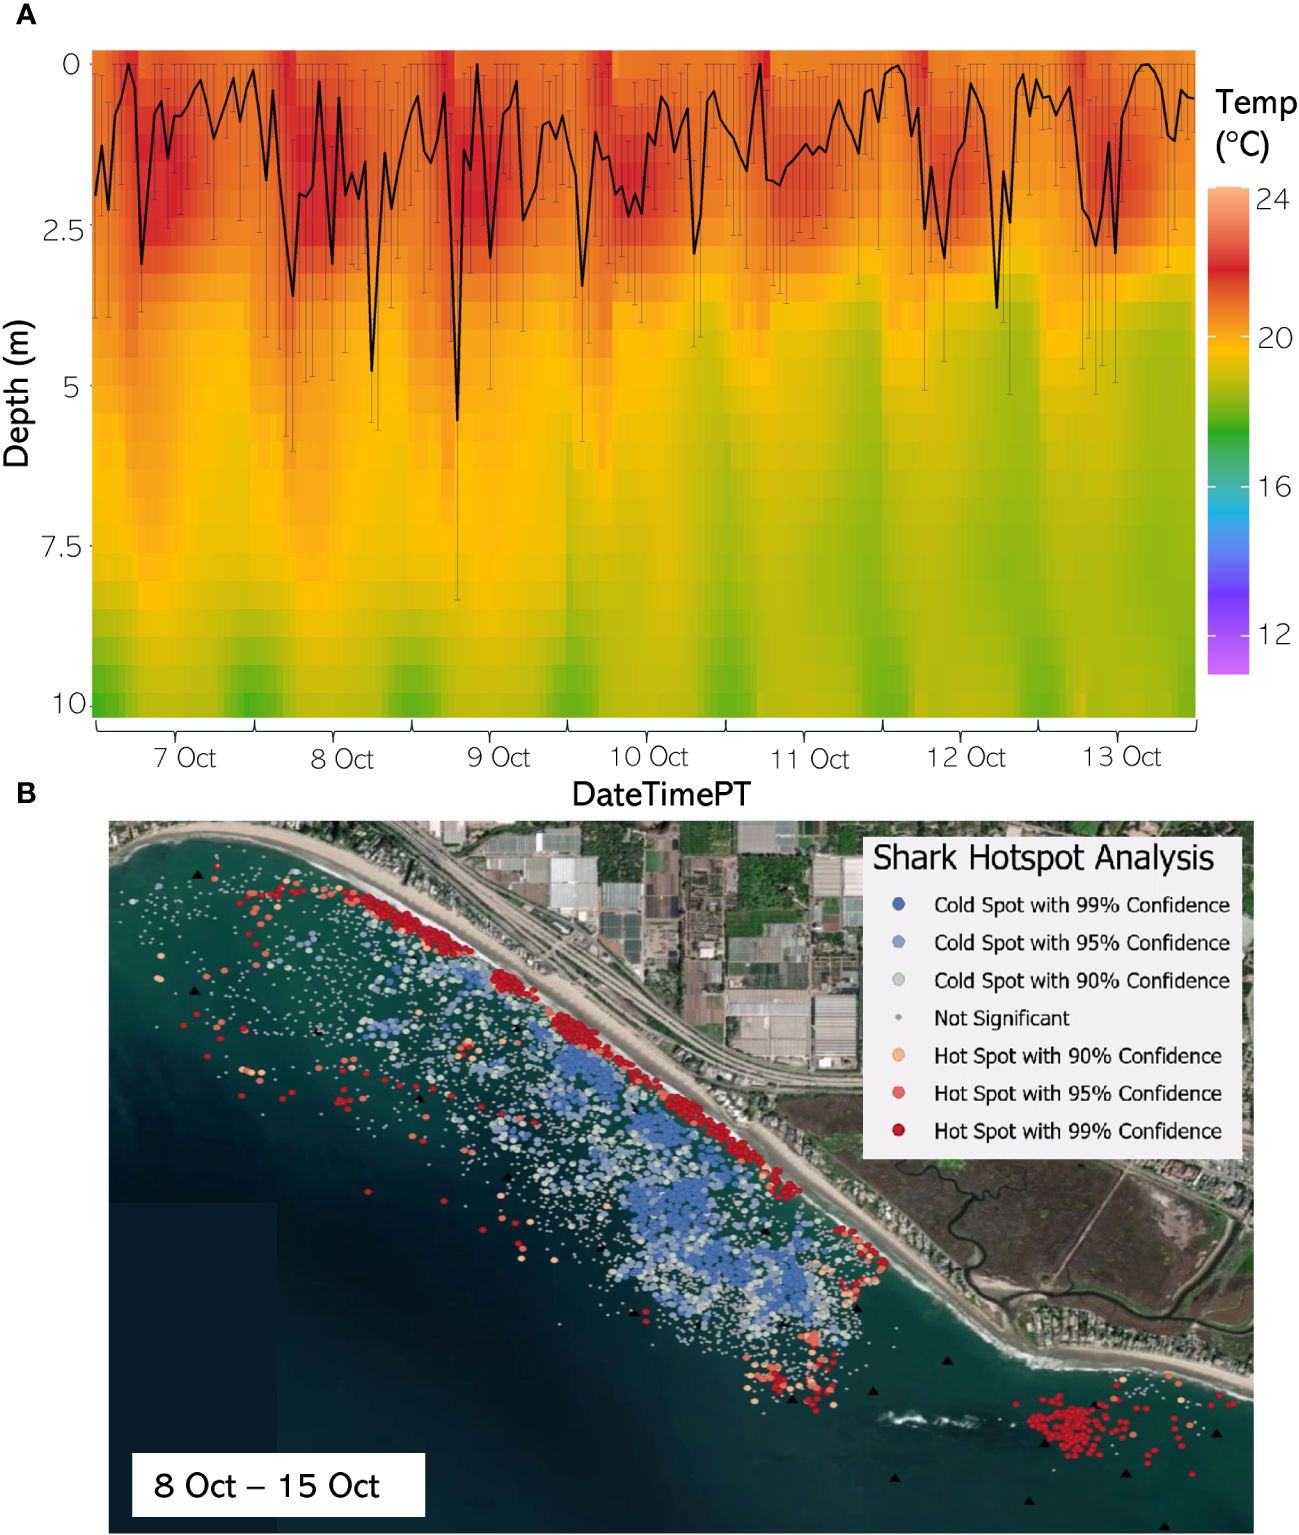
Figure 9 (A) From 7 Oct through 13 August 2020, the hourly average depth of the JWS ± SD plotted on the hourly average thermal gradient of the water column across the study site. (B) From 8 Oct to 15 Oct 2020, the results of the hotspot analysis showing where sharks are significantly in the bottom of the water column (red) or significantly at the surface of the water column (blue).
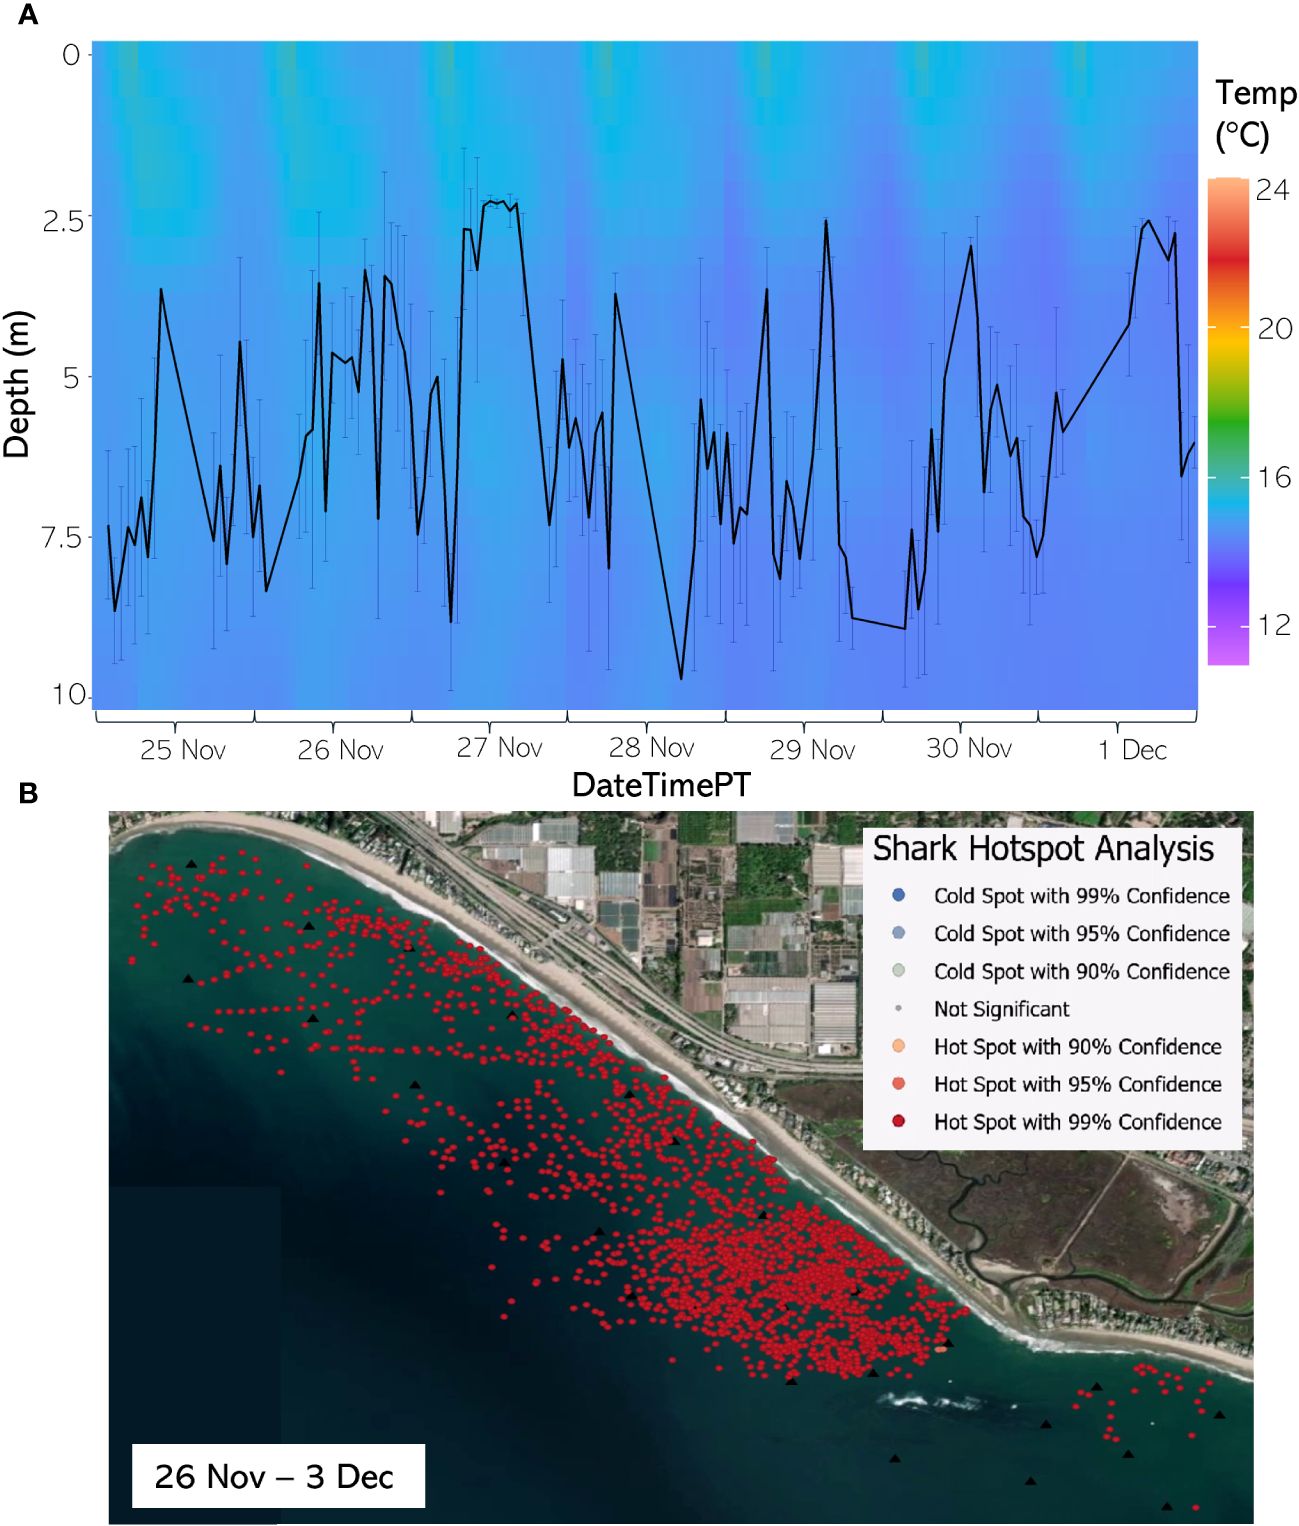
Figure 10 (A) From 25 Nov through 1 Dec 2020, the hourly average depth of the JWS ± SD plotted on the hourly average thermal gradient of the water column across the study site. (B) From 26 Nov through 3 Dec 2020, the results of the hotspot analysis showing where sharks are significantly in the bottom of the water column (red) or significantly at the surface of the water column (blue).
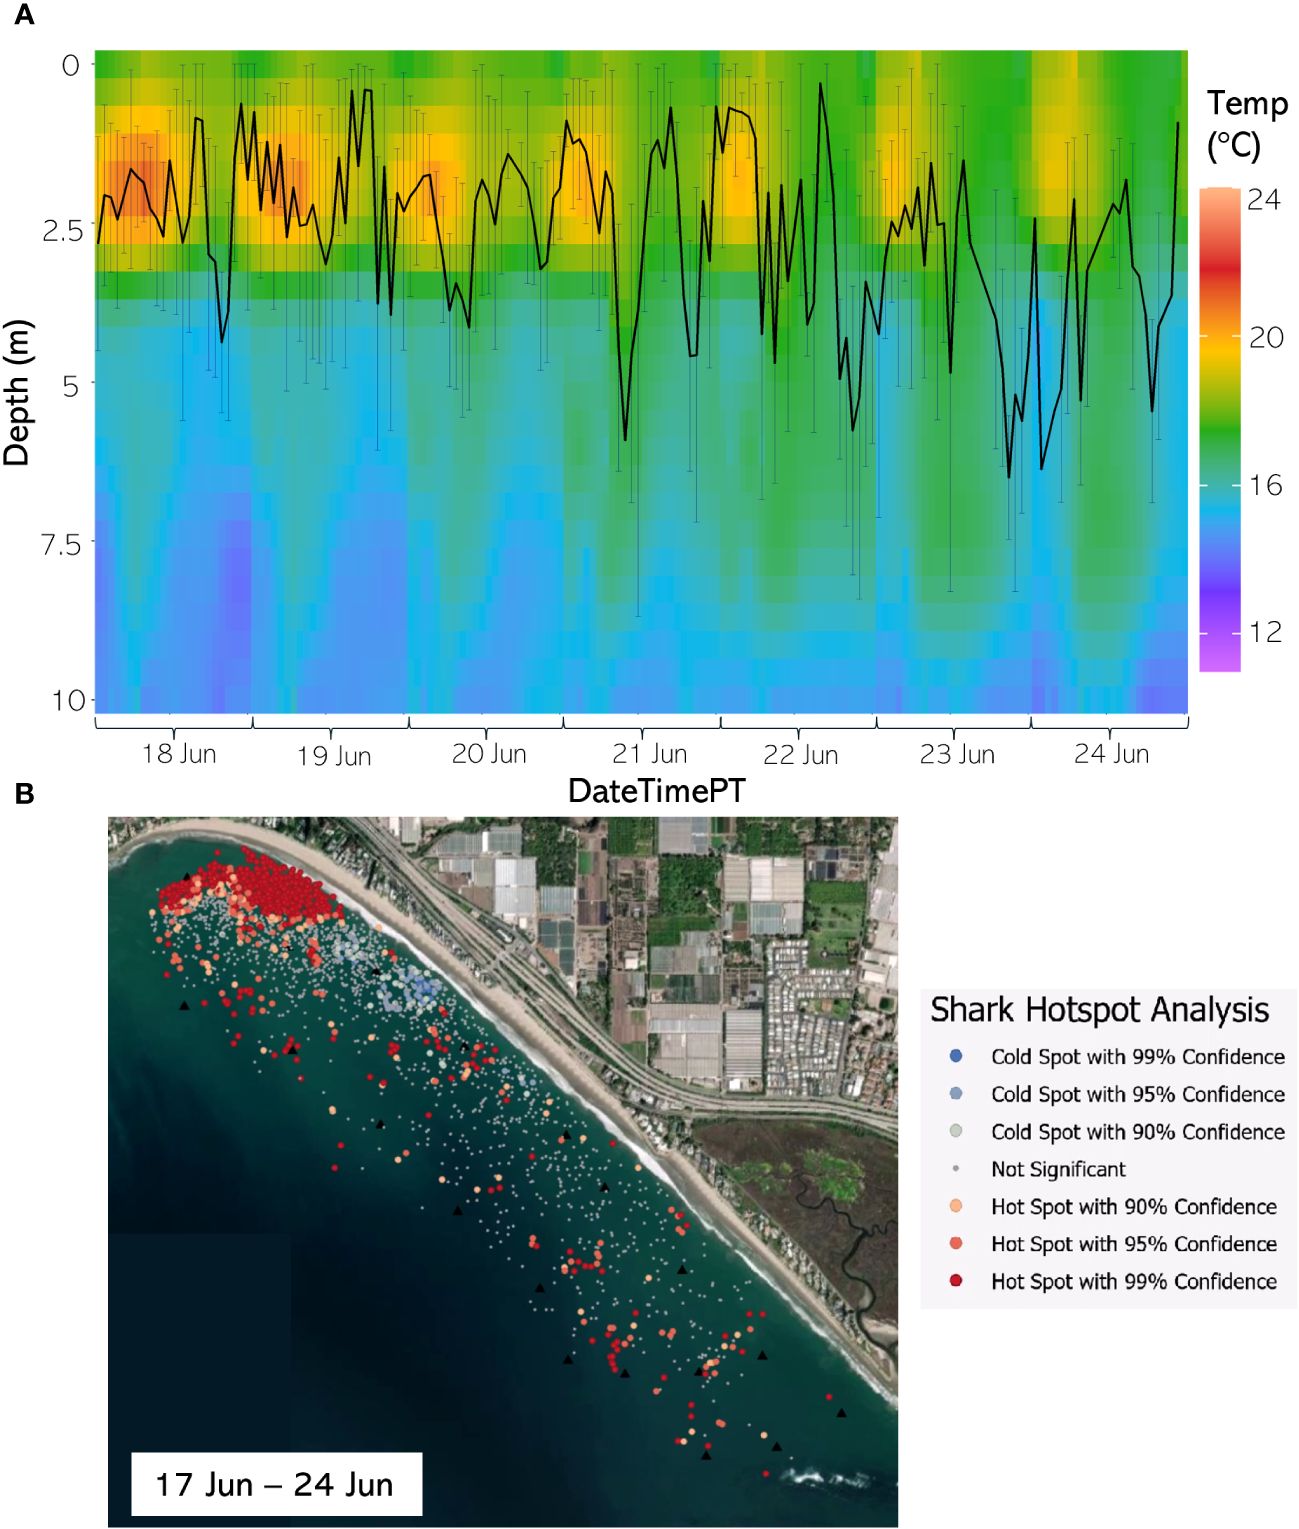
Figure 11 (A) From 18 Jun through 24 Jun 2021, the hourly average depth of the JWS ± SD plotted on the hourly average thermal gradient of the water column across the study site. (B) From 17 Jun through 24 Jun 2021, the results of the hotspot analysis showing where sharks are significantly in the bottom of the water column (red) or significantly at the surface of the water column (blue).
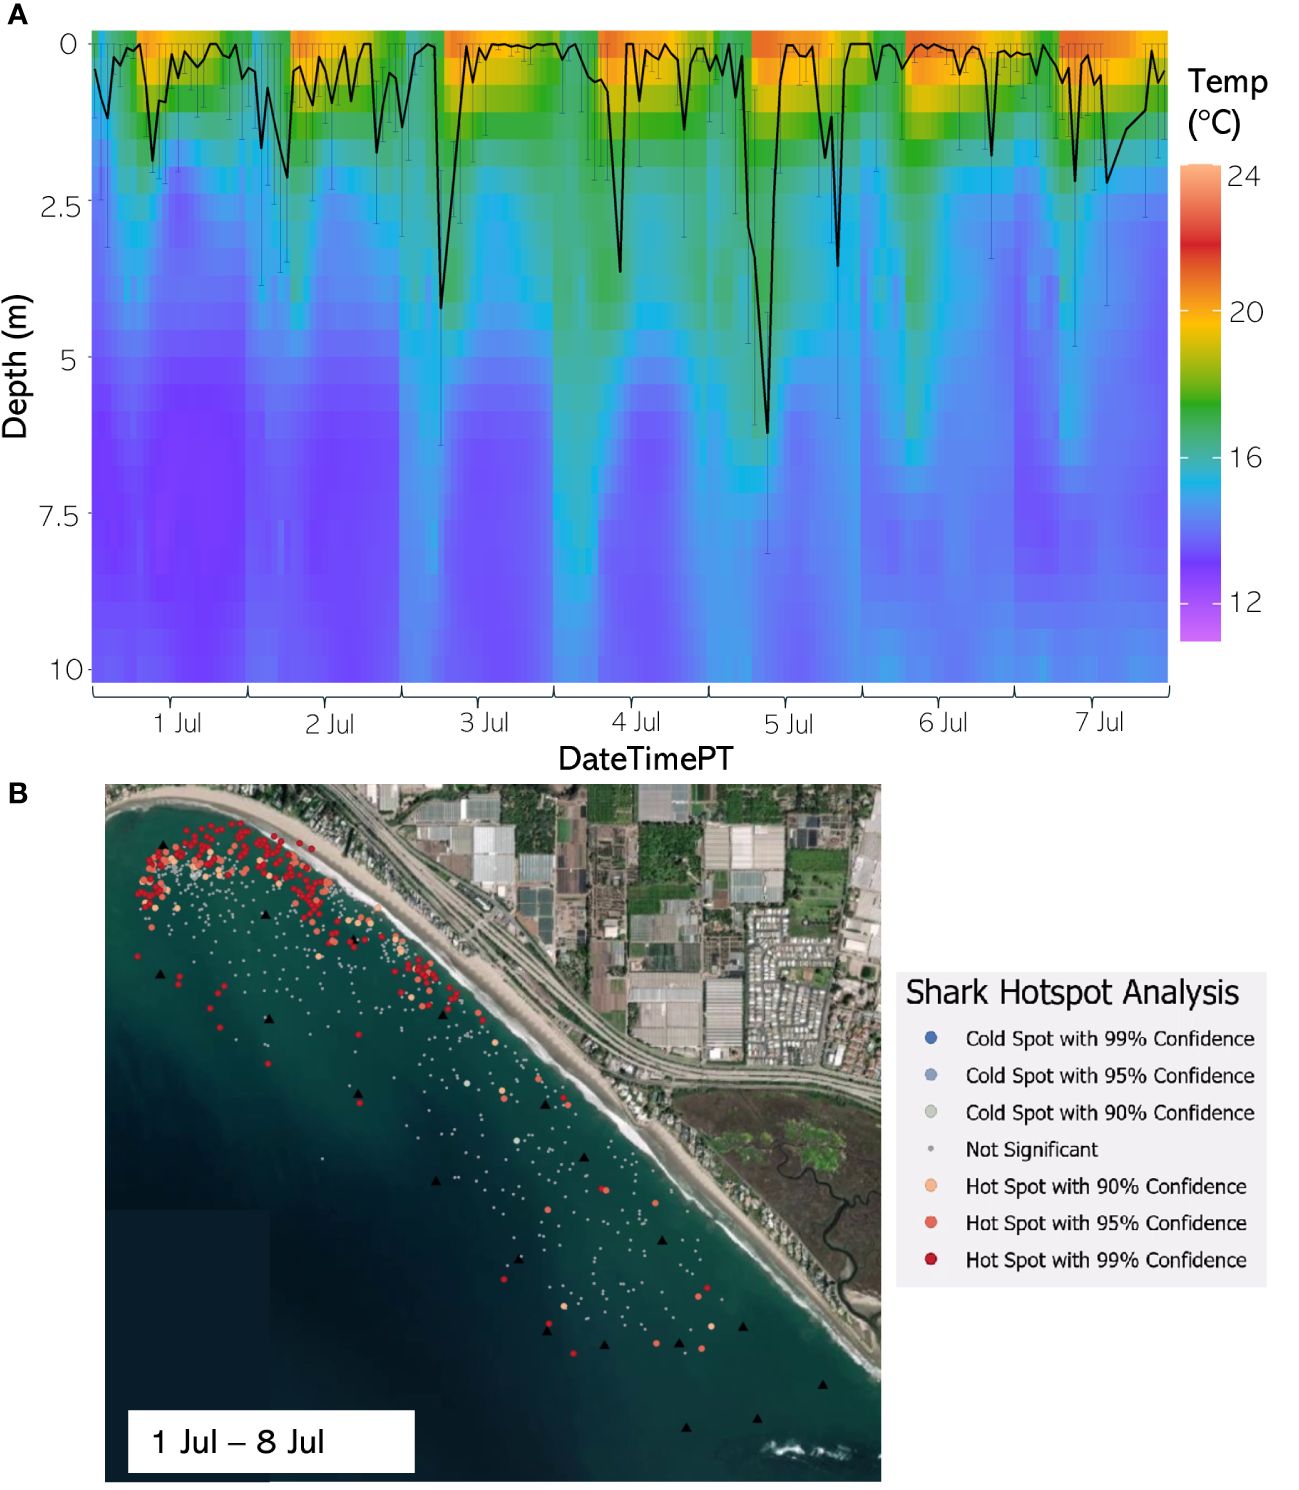
Figure 12 (A) From 1 Jul through 7 Jul 2021, the hourly average depth of the JWS ± SD plotted on the hourly average thermal gradient of the water column across the study site. (B) From 1 Jul through 8 Jul 2021, the results of the hotspot analysis showing where sharks are significantly in the bottom of the water column (red) or significantly at the surface of the water column (blue).
The weekly HSA revealed the locations in the study area the sharks significantly occupied the top third of the water column (deemed “cold spots”) and which locations in the site the sharks significantly occupied the bottom third of the water column (deemed “hot spots”). The statistically significant clustering of hot and cold spots changed location each week throughout the habitat (Supplementary Animations A3, A4 for all weeks, Figures 8B–12B representatives from different thermal regimes). Each shark geo-position was assigned a p-value in the following ranges: p < 0.1 (90% CI), p < 0.05 (95% CI), and p < 0.01 (99% CI) if it was in the upper or lower third of the water column. The distinct clustering of sharks near the seafloor was near the reef and inshore locations, with the sharks utilizing the bottom third of the water column at several specific locations offshore which changed weekly. Most of the shark positions that occurred in the offshore region were specified as “cold spots” as the sharks were in the top third of the water column (Supplementary Animations A3, A4). Due to the wave action and shallow nature of the inshore portion of the array, very few positions were rendered in shallow water (< 3 m deep) (1.4% of positions in 2020 and 0.27% of positions in 2021) (Supplementary Figure F4). Consequently, the water’s depth accommodated the sharks’ ability to position themselves either near the seafloor or the sea surface.
JWS interaction with available thermal habitat
Using multimodel inferencing, over 2000 GAMMs were run for each year to compare shark distance from the seafloor to a variety of variables and the top four models had an AIC Δ < 1 (Supplementary Tables T3, T4). The top models from 2020 and 2021 both included temperature, day of the year, hour of day, dT, grid ID, shark sex, binned shark size, region occupied, and relative shark position to dT. Shark distance from the seafloor was predicted by several covariates with the 2020 model explaining 71.4% of the deviance and the model for 2021 explaining 70.8% of the deviance in the data (Supplementary Tables T5, T6). Hour of day was significant in predicting distance from the seafloor as sharks were closer to the bottom of the water column during periods associated with dawn and dusk (Figure 7). The models revealed that there were certain locations (grid IDs) that were significant in one year and there were six locations significant across years (Supplementary Figure F5). The sharks were significantly closer to the seafloor when their relative position was below dT, and they were significantly closer to the seafloor in inshore and reef-associated regions while significantly closer to the surface in offshore regions (Supplementary Tables T5, T6). There was a significant negative relationship between dT and shark distance from the seafloor and across both years where the sharks dive deeper when dT was deeper (Figure 13). Occupied temperature had a significantly positive relationship with shark distance from the seafloor where the sharks occupied warmer water as they got closer to the surface across both years (Figure 13). The day of the year also had a significant effect on distance from the seafloor (Figure 13).
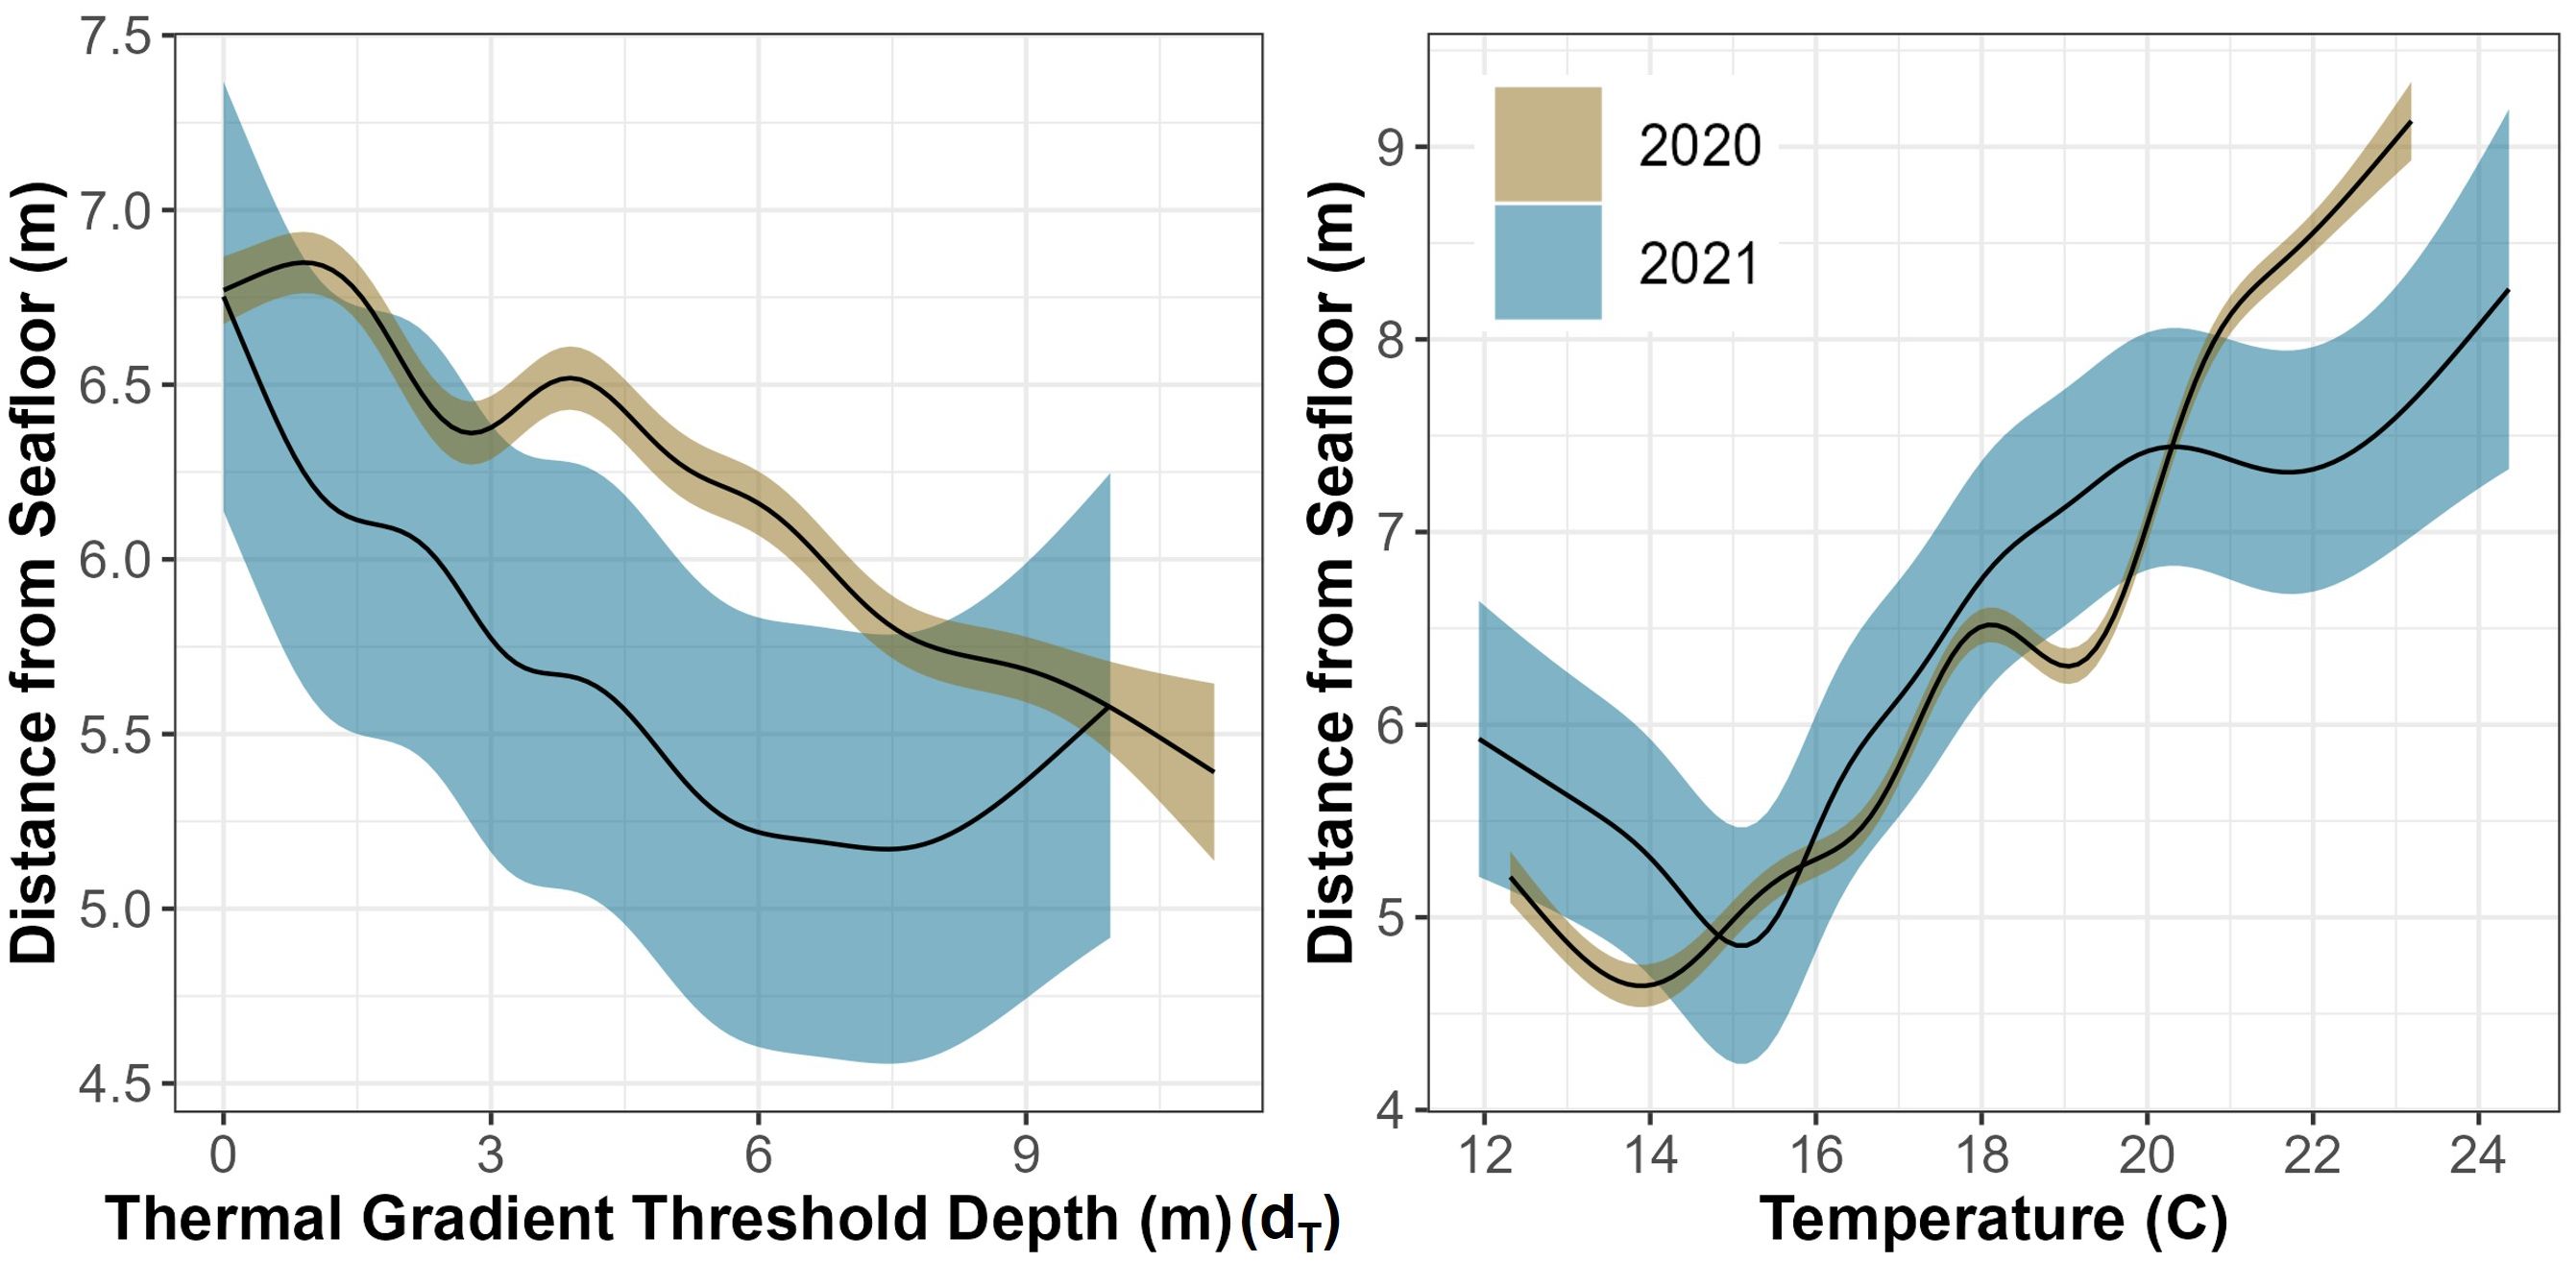
Figure 13 GAMM predictive plots of shark’s smoothed vertical position above the seafloor as it relates to two different, significant covariates across both years (temperature and thermal gradient threshold depth) surrounded by their respective 95% confidence intervals.
Discussion
In the SCB, regional-scale winds, coastal upwelling, local surface heating, and topography within nearshore environments lead to high variability in stratification and thermocline depth and micro-scale cells (~10 m3) of water (Pineda & López, 2002; Woodson et al., 2009). We found that sharks disproportionately selected warmer waters in the study area, spending 80% of their time in waters 16°C to 23°C. This temperature window is likely the JWS thermal preferendum, with JWS displaying the greatest selection preferences at temperatures ranging from 20°C to 22°C, which may be the JWS thermal optima. Similarly, Dewar et al. (2004) observed that one female JWS (1.4 m fork length) tracked via a pop-up satellite archival tag for 28 days within the SCB spent 89% of her time in water ranging from 16°C to 22°C. This thermal occupancy range seems to be common across the species, as Bruce and Bradford (2008) observed 12 satellite tagged JWS of the Australian population that spent 45% of their time in 18-20°C. Neither study was able to account for the available thermal habitat, making it difficult to quantify habitat selection. Our data, however, show that JWS adjust their microhabitat use at least in part due to shifts in water temperature, which we expect to occur in other nurseries.
Derived available 3D temperatures at Padaro Beach ranged from 11.1°C to 23.5°C throughout the study period, with an average of 16.4 ± 2°C across years and vertical differences in water temperature ranging from 0.33°C to 8.29°C across the study area. The range and strength of this thermal stratification varied throughout the day and across seasons (Figures 5, 6, 8A–12A, Supplementary Animations A1, A2). In turn, regardless of the max available water column depth, JWS occupied depths from 0 to 10.9 m throughout the study period with a median of 0.15 m in 2020 and 1.4 m in 2021. The difference in occupied depth across years is likely attributed to the differences in vertical thermal stratification between years (Figures 5, 6). For instance, in May and June of 2021, there was a persistent marine cloud layer which cooled sea surface temperatures while a pocket of warm water occurred 1-2 m below the sea surface. Consequently, JWS spent less time at the surface in May-June of 2021 compared to 2020. Annual differences in daily average sea surface and seafloor temperature throughout each year may have also played a role in the observed differences in 2020 and 2021, and likely explains why day of the year differed in its predictions for JWS distance from the seafloor - water temperatures in 2020 exhibited more variable oscillatory trends whereas 2021 thermal trends were more consistent. In turn, JWS exhibited greater fluctuations in depth distributions in 2020, illustrating their responsiveness to changes in water temperature likely to optimize thermoregulation.
Tagged JWS vertical range was a function of the depth-temperature threshold (dT) in which sharks explored greater depths as dT got deeper and predominantly remained above the thermal threshold of 16°C. Similar observations have been made for tagged and tracked Shortfin Mako sharks (Isurus oxyrinchus) that avoided diving into waters below 14°C (Holts & Bedford, 1993; Klimley et al., 2002). Vertical thermoregulation is well documented across a variety of shark species as they modulate their diving behavior to stay within a particular thermal range, which can expectantly vary based on body size (e.g., Meekan et al., 2015; Andrzejaczek et al., 2018; Arrowsmith et al., 2021). JWS may have a more limited capacity for regional endothermy than adults due to their relatively smaller body size and higher surface area:body volume, thus behavioral thermoregulation may be more important for JWS. JWS may either increase their activity rates to maintain elevated body temperatures or select warmer waters. Considering increased activity rates result in higher energetic costs, microhabitat selection may enable them to conserve energy and effectively thermoregulate when water temperatures allow them to do so (Di Santo & Bennett, 2011; Anderson et al., 2021). Indeed, JWS only spent 14% of their time below the thermal threshold of 16°C in 2020 and 34% of their time below it in 2021.
Infrequent excursions into colder waters are, however, likely unavoidable for JWS. Over shorter temporal and spatial scales, ectothermic Grey Reef sharks (Carcharhinus amblyrhynchos) tracked at a Pacific atoll were found to make brief dives below the thermocline where they exhibited higher activity rates indicated by increases in overall dynamic body acceleration (Papastamatiou et al., 2018b). Foraging behavior may have been the primary driver of increased acticity, but would also provide a thermoregulatory function by increasing body temperature in colder, deeper waters (Papastamatiou et al., 2018b). JWS may engage in similar behavior, in which they briefly tolerate colder temperatures when diving below the thermocline to forage, exhibit exploratory behavior, cool down, and/or avoid conspecifics when temperatures in the water column are stratified. Intraspecific interactions commonly influence animal behavior, and the aggregation site in the SCB had a high number of JWS that may have influenced each other’s movements as smaller individuals tend to give way to larger conspecifics (Sperone et al., 2010; Jewell et al., 2013). In addition to the 22 JWS tracked for this study, there were an additional 37 tagged sharks detected at the aggregation site that did not have pressure sensing transmitters and therefore were not included in this study but may have had a conspecific effect (n = 19 in 2020, n = 18 in 2021). We observed 11 of the sharks that were tagged in 2020 return to the aggregation site in 2021, with as many as 45 tagged sharks detected in 2021 at Padaro Beach throughout the year. Consequently, high densities of conspecifics would expectantly cause subordinate JWS to use less preferred microhabitats to avoid conflict and competition for prey. A higher density of sharks were observed and detected in 2021 which may partially explain why 34% of the JWS shark positions occurred below the thermal threshold as opposed to the 14% in 2020, supporting this hypothesis. Shifts in prey densities could also be responsible for the observed differences. Nearshore benthic elasmobranchs and demersal teleosts are the primary prey of JWS at the Padaro aggregation site (Samara et al. in review), and if the densities of these preferred prey decreased in shallow waters due to changes in distribution in response to abiotic or biotic factors, it may have driven more tagged JWS to dive below their thermal preference.
While the hourly depth profile of the sharks in this study varied in depth range and frequency of changes in vertical distribution throughout the study period (Figures 5, 6, 8A–12A, Supplementary Animations A1, A2), overall depth distributions across the hours of the day and for each month showed a clear pattern with deepest depths occupied during crepuscular periods (Figure 7). Anderson et al. (2022) found that JWS at the Padaro Beach aggregation site in 2020 exhibited their fastest cruising speeds and deepest depths around crepuscular periods, which was likely attributed to periods of active hunting, but could also be due to sharks being in colder water. This diel change in swim speed pattern was similarly observed by Colefax et al. (2020) who monitored fine-scale movements of 108 white sharks during aerial drone surveys in the nearshore environment. Increased activity during crepuscular and post-sunset crepuscular periods is also common in other large elasmobranch predators and is thought to lead to higher predation efficiency (Papastamatiou et al., 2015; Hammerschlag et al., 2017; Papastamatiou et al., 2018b; Ito et al., 2022). Some thermoregulatory behaviors of sharks can directly influence predator-prey interactions when their muscle temperatures are elevated which offer sharks an advantage through higher maximal attainable and sustainable speed compared to their smaller prey with colder muscle (Bennett, 1985; Johnston & Temple, 2002; Papastamatiou et al., 2015). JWS in this study were observed significantly closer to the sea surface between mid to late afternoon, a time when the most solar warming is occurring, and sea surface temperatures are elevated, which could lead to warmer body temperatures and more efficient hunting. Additionally, Anderson et al. (2022) showed that minimum cruising speeds for JWS at the Padaro Beach aggregation site were associated with shallow and surface swimming in warmer water. This behavior may be attributed to sharks actively solar warming to maximize energy gains by reducing activity rates (hunt warm–rest warmer strategy: Papastamatiou et al., 2015; Papastamatiou et al., 2018a). JWS may therefore also be using this time in warmer surface waters to increase their body temperature to speed up their metabolic rate and rate of digestion. For example, bat rays (Myliobatis californica) have been observed to exhibit a “hunt warm – rest cool” foraging strategy showing a highly diel pattern moving to cooler and deeper water in the late afternoon to early morning after foraging in warmer and shallower water (Matern et al., 2000). JWS may therefore be taking advantage of the time periods when bat rays, which are potential prey, are occupying cooler water.
While JWS depth range was altered by thermal stratification, our results showed that regardless of temperature and where they were in the study area, the sharks spent 71% of their time in depths ranging from 0 to 2 m indicating a preferred depth range. JWS might have spent more time at the surface because those upper layers of water were typically warmer, although even when the entire water column was warmer than 16°C, JWS still showed a preference for shallower water. However, JWS showed greater affinity towards the seafloor when the water column temperatures were homogenously colder than ~14-15°C. In addition, JWS had a significantly deeper overall depth distribution in colder months. These inter- and intra-seasonal occurrences at deeper depths in colder water may require individuals to feed more and swim faster to produce more heat in a colder environment (Anderson et al., 2022).
Vertical thermal stratification not only influenced JWS vertical distribution but appeared to also strongly influence the horizontal distribution where JWS spent time at depth. When comparing vertical thermal profile with the Hot Spot Analysis (HSA), instances where the temperature gradient was deeper and most of the water column registered temperatures above 16°C led to JWS utilizing more horizontal space while at depth in both inshore and offshore regions (Figures 8B–12B, Supplementary Animations A3, A4). Conversely, when the water exhibited strong vertical stratification and the 16°C-threshold was closer to the surface, JWS restricted their horizontal movement at depth to specific areas within the aggregation site, which could be important foraging areas. These contracted areas where sharks consistently spent time at depth included areas of reef associated substrate, with additional areas primarily in the inshore region and a few locations offshore, which varied by week (Figures 8–12, Supplementary Animations A3, A4). JWS were significantly closer to the sea surface when in the offshore region and occurred significantly deeper in the reef and inshore associated regions, suggesting habitats offer different functions for JWS in the SCB. The function of these habitats could vary spatiotemporally, though, which we expect JWS to respond to with increasing efficiency as they age and gain experience.
Overall, individuals at this aggregation site exhibited predictable spatial use patterns at locations and depths that were most likely used for thermoregulatory and energetic purposes. If the sharks are trying to maintain a thermo-energetic advantage over their prey (Papastamatiou et al., 2015), it would benefit them to maintain a warmer internal core muscle temperature. This may explain why when the lower thermal threshold (16°C) occurred in shallower depths and the water was highly stratified, JWS were primarily above that threshold except in certain areas when they were likely foraging. It is also possible that JWS were following their prey’s daily movements, which may be more influenced by several aspects of their environment (e.g., substrate, temperature, wave action, etc.). Other regionally endothermic predators, such as bigeye tuna (Thunnus obesus), are crepuscular predators to maximize energy for predation success due to their prey’s vertical migration (Thygesen et al., 2016). Further studies that track JWS and their prey using VPS in the same environments may provide more insight into the degree that prey distribution and movements influenced JWS movement at the micro-habitat scale. Alternatively, the specific areas where sharks chose to be at depth may have also been to select for areas which were simply warmer than others at similar depths as the thermal environment was not homogeneous across the study site. Thus, sharks may be spatially distributing themselves in direct response to smaller cells of warmer or cooler water throughout the habitat.
The restriction of JWS horizontal space use at depth to specific areas may have also been influenced by individual interaction with conspecifics. If the sharks are restricted to diving in specific locations, they may have either interacted with one another more frequently altering their distribution or it may have altered individual schedules on when they were at depth foraging to reduce competition. There was high individual variability in depth from seafloor in the models, which again may indicate how individuals are potentially avoiding conspecific interactions. There was no statistical effect of size and sex of the animal in the predictability of JWS distance from the seafloor across both years. The lack of a difference across sexes may be due to having a highly female-skewed sex ratio at the aggregation site. While it is likely that there are size related differences in thermoregulatory behavior, the lack of predictability due to body size was attributed to most of the tagged sharks being of just one size class. Spurgeon et al. (2022) found that JWS left this aggregation site following a strong upwelling event in November 2020 that caused the entire available thermal habitat to fall below 14°C. Interestingly, larger JWS left the area first during this strong upwelling event, which may have been attributed to previous knowledge of where to find more favorable thermal habitat. While the smallest size class was the slowest to initiate their seasonal migration, it was the larger size class that eventually returned and remained in the colder aggregation site for the remainder of the season as they may be less thermally sensitive due to their larger mass. In addition, the high number of individuals present in the aggregation site in 2021 resulted in significantly fewer calculated geo-positions. Further work would benefit from elucidating how fine-scale differences in thermoregulatory behavior change between sexes and across size classes as we would expect these differences to gradually increase as the individuals grow closer to maturity. Additional measurements of body core temperature across different sizes and sexes of JWS would aid these elucidations.
Due to high code collisions and noise interference associated with reef structures in the habitat, fewer positions were rendered over the reef substrate type than expected. Because of this uneven number of positions over different substrate types, benthic substrate type was not included as a factor in any analysis. It is likely JWS are using rock reef habitat in search of prey, but we were unable to quantify the extent of their activity in this habitat. It is also possible that sharks are not using this habitat as much as reef-sand ecotone due prey have greater opportunities to use reef structure to hide or avoid sharks.
While we do not know where JWS are predominantly foraging, it is likely that they are using particular areas within the aggregation site to increase their foraging success. Tradeoffs must occur throughout JWS developmental period as individuals attempt to find and select areas with adequate environmental conditions to maintain efficient physiological performance, but also try to find sufficient food sources and avoid intra-specific conflicts. They may therefore choose a micro-habitat that is a high prey resource environment to maximize their growth by speeding up their metabolic rate in warmer water. Using a high-density acoustic array in a nearshore aggregation site, we have provided strong evidence of fine-scale behavioral thermoregulatory behaviors exhibited by JWS. Despite individual variation, we have demonstrated a clear pattern in how JWS three-dimensional movements expand and contract in a shallow (< 10 m) and nearshore (< 1 km) habitat in response to ambient water temperature when historic data have primarily focused on non-aggregating individuals using satellite telemetry. The results of this study may be used to inform and improve habitat suitability models and species distribution models within a specific location and help predict potential locations of new aggregation sites as well as advise beach public safety officials. Knowledge on how JWS respond to the environment is vital for management and future space use predictive models to understand how these patterns will transform as micro-habitat thermal patterns are altered due to climate change.
Data availability statement
The raw data supporting the conclusions of this article will be made available by the authors, without undue reservation.
Ethics statement
The animal study was approved by Institutional Animal Care and Use Committee (IACUC), protocol #364. The study was conducted in accordance with the local legislation and institutional requirements.
Author contributions
ES: Conceptualization, Data curation, Formal analysis, Investigation, Methodology, Supervision, Validation, Visualization, Writing – original draft, Writing – review & editing. MT: Formal analysis, Writing – review & editing. MA: Formal Analysis, Writing – review & editing. JA: Investigation, Methodology, Writing – review & editing. PR: Investigation, Methodology, Writing – review & editing. BS: Investigation, Methodology, Writing – review & editing. KA: Formal analysis, Writing – review & editing. CL: Investigation, Methodology, Conceptualization, Funding acquisition, Project administration, Resources, Supervision, Writing – review & editing.
Funding
The author(s) declare that financial support was received for the research, authorship, and/or publication of this article. This study was funded by the State of California Shark Beach Safety Program.
Acknowledgments
Special thanks to Jack May III, Bobby Hyla, Steve McCullough, Erin Pierce, and Yamilla Samara for assisting in downloading receivers throughout the years.
Conflict of interest
The authors declare that the research was conducted in the absence of any commercial or financial relationships that could be construed as a potential conflict of interest.
Publisher’s note
All claims expressed in this article are solely those of the authors and do not necessarily represent those of their affiliated organizations, or those of the publisher, the editors and the reviewers. Any product that may be evaluated in this article, or claim that may be made by its manufacturer, is not guaranteed or endorsed by the publisher.
Supplementary material
The Supplementary Material for this article can be found online at: https://www.frontiersin.org/articles/10.3389/fmars.2024.1290769/full#supplementary-material
References
Anderson J. M., Burns E. S., Meese E. N., Farrugia T. J., Stirling B. S., White C. F., et al. (2021). Interannual nearshore habitat use of young of the year white sharks off Southern California. Front. Mar. Sci. 8. doi: 10.3389/fmars.2021.645142
Anderson J. M., Spurgeon E. I., Stirling B. S., May J., Rex P. T., Hyla B., et al. (2022). High resolution acoustic telemetry reveals swim speeds and inferred field metabolic rates in juvenile white sharks (Carcharodon carcharias). PloS One 17, e0268914. doi: 10.1371/journal.pone.0268914
Andrzejaczek S., Gleiss A. C., Jordan L. K. B., Pattiaratchi C. B., Howey L. A., Brooks E. J., et al. (2018). Temperature and the vertical movements of oceanic whitetip sharks, Carcharhinus longimanus. Sci. Rep. 8, 1–12. doi: 10.1038/s41598-018-26485-3
Arrowsmith L. M., Sequeira A. M. M., Pattiaratchi C. B., Meekan M. G. (2021). Water temperature is a key driver of horizontal and vertical movements of an ocean giant, the whale shark Rhincodon typus. Mar. Ecol. Prog. Ser. 679, 101–114. doi: 10.3354/meps13899
Avgar T., Mosser A., Brown G. S., Fryxell J. M. (2013). Environmental and individual drivers of animal movement patterns across a wide geographical gradient. J. Anim. Ecol. 82, 96–106. doi: 10.1111/j.1365-2656.2012.02035.x
Bennett A. F. (1985). Temperature and muscle. J. Exp. Biol. 115, 333–344. doi: 10.1242/jeb.115.1.333
Bernal D. B., Lowe C. G. (2015). Field studies of elasmobranch physiology. Fish Physiol. 34A, 311–377. doi: 10.1016/B978-0-12-801289-5.00008-0
Bruce B. D., Bradford R. W. (2008). Spatial dynamics & habitat preferences of juvenile white sharks-identifying critical habitat and options for monitoring recruitment (Department of Environment, Water, Heritage and the Arts). Available at: http://www.ag.gov.au/cca.
Burnham K. P., Anderson D. R., Huyvaert K. P. (2011). AIC model selection and multimodel inference in behavioral ecology: Some background, observations, and comparisons. Behav. Ecol. Sociobiology 65, 23–35. doi: 10.1007/s00265-010-1029-6
Cartamil D., Wegner N. C., Kacev D., Ben-Aderet N., Kohin S., Graham J. B. (2010). Movement patterns and nursery habitat of juvenile thresher sharks Alopias vulpinus in the Southern California Bight. Mar. Ecol. Prog. Ser. 404, 249–258. doi: 10.3354/meps08495
Colefax A. P., Kelaher B. P., Pagendam D. E., Butcher P. A. (2020). Assessing white shark (Carcharodon carcharias) behavior along coastal beaches for conservation-focused shark mitigation. Front. Mar. Sci. 7. doi: 10.3389/fmars.2020.00268
Crawshaw L. I. (1977). Physiological and behavioral reactions of fishes to temperature change. J. Fisheries Res. Board Canada 34, 730–734. doi: 10.1139/f77-113
Curtis T. H., Metzger G., Fischer C., McBride B., McCallister M., Winn L. J., et al. (2018). First insights into the movements of young-of-the-year white sharks (Carcharodon carcharias) in the western North Atlantic Ocean. Sci. Rep. 8, 10794. doi: 10.1038/s41598-018-29180-5
Del Greco S., Ansari S. (2008). “Radar visualization and data exporter tools to support interoperability and the global earth observation system of systems (GEOSS), from the national oceanographic and atmospheric administration's (NOAA's) national climatic data center (NCDC),” in World environmental and water resources congress 2008 (Ahupua'A), 1–10.
Dewar H., Domeier M., Nasby-Lucas N. (2004). Insights into young of the year white shark, Carcharodon carcharias, behavior in the Southern California Bight. Environ. Biol. Fishes 70, 133–143. doi: 10.1023/B:EBFI.0000029343.54027.6a.pdf
Di Santo V., Bennett W. A. (2011). Is post-feeding thermotaxis advantageous in elasmobranch fishes? J. Fish Biol. 78, 195–207. doi: 10.1111/jfb.2011.78.issue-1
Espinoza M., Farrugia T. J., Webber D. M., Smith F., Lowe C. G. (2011). Testing a new acoustic telemetry technique to quantify long-term, fine-scale movements of aquatic animals. Fisheries Res. 108, 364–371. doi: 10.1016/j.fishres.2011.01.011
Garla R. C., Chapman D. D., Shivji M. S., Wetherbee B. M., Amorim A. F. (2006). Habitat of juvenile Caribbean reef sharks, Carcharhinus perezi, at two oceanic insular marine protected areas in the southwestern Atlantic Ocean: Fernando de Noronha Archipelago and Atol das Rocas, Brazil. Fisheries Res. 81, 236–241. doi: 10.1016/j.fishres.2006.07.003
Garla R. C., Garcia J., Bertrand Veras L., Peporine Lopes N. (2009). Fernando de Noronha as an insular nursery area for lemon sharks, Negaprion brevirostris, and nurse sharks, Ginglymostoma cirratum, in the equatorial western Atlantic Ocean. Mar. Biodiversity Records 2, e109. doi: 10.1017/S1755267209000670
George L. W., Martins A. P. B., Heupel M. R., Simpfendorfer C. A. (2019). Fine-scale movements of juvenile blacktip reef sharks Carcharhinus melanopterus in a shallow nearshore nursery. Mar. Ecol. Prog. Ser. 623, 85–97. doi: 10.3354/meps13010
Getis A., Ord J. K. (1992). The analysis of spatial association by use of distance statistics. Geographical Anal. 24, 189–206. doi: 10.1111/j.1538-4632.1992.tb00261.x
Hammerschlag N., Skubel R. A., Calich H., Nelson E. R., Shiffman D. S., Wester J., et al. (2017). Nocturnal and crepuscular behavior in elasmobranchs: a review of movement, habitat use, foraging, and reproduction in the dark. Bull. Mar. Sci. 93, 355–374. doi: 10.5343/bms.2016.1046
Heithaus M., Dill L., Marshall G. J., Buhleier B. (2002). Habitat use and foraging behavior of tiger sharks (Galeocerdo cuvier) in a seagrass ecosystem. Mar. Biol. 140, 237–248. doi: 10.1007/s00227-001-0711-7
Hertz P. E., Huey R., Stevenson R. D. (1993). Evaluating temperature regulation by field-active ectotherms. Am. Nat. 142, 796–818. doi: 10.1086/285573
Heupel M. R., Carlson J. K., Simpfendorfer C. A. (2007). Shark nursery areas: Concepts, definition, characterization and assumptions. Mar. Ecol. Prog. Ser. 337, 287–297. doi: 10.3354/meps337287
Heupel M. R., Hueter R. E. (2002). Importance of prey density in relation to the movement patterns of juvenile blacktip sharks (Carcharhinus limbatus) within a coastal nursery area. Mar. Freshw. Res. 53, 543. doi: 10.1071/MF01132
Heupel M. R., Simpfendorfer C. A., Hueter R. E. (2004). Estimation of shark home ranges using passive monitoring techniques. Environ. Biol. Fishes 71, 135–142. doi: 10.1023/B:EBFI.0000045710.18997.f7
Holts D. B., Bedford D. W. (1993). Horizontal and vertical movements of the shortfin mako shark, Isurus oxyrinchus, in the Southern California Bight. Mar. Freshw. Res. 44, 901–909. doi: 10.1071/MF9930901
Huey R. B., Stevenson R. D. (1979). Integrating thermal physiology and ecology of ectotherms: A discussion of approaches. Integr. Comp. Biol. 19, 357–366. doi: 10.1093/icb/19.1.357
Ito K., Higginson A. D., Ruxton G. D., Papastamatiou Y. P. (2022). Incorporating thermodynamics in predator–prey games predicts the diel foraging patterns of poikilothermic predators. J. Anim. Ecol. 91, 527–539. doi: 10.1111/1365-2656.13608
Jewell O. J. D., Johnson R. L., Gennari E., Bester M. N. (2013). Fine scale movements and activity areas of white sharks (Carcharodon carcharias) in Mossel Bay, South Africa. Environ. Biol. Fishes 96, 881–894. doi: 10.1007/s10641-012-0084-4
Johnston I. A., Temple G. K. (2002). Thermal plasticity of skeletal muscle phenotype in ectothermic vertebrates and its significance for locomotory behaviour. J. Exp. Biol. 205, 2305–2322. doi: 10.1242/jeb.205.15.2305
Klimley A. P., Beavers S. C., Curtis T. H., Jorgensen S. J. (2002). Movements and swimming behavior of three species of sharks in La Jolla Canyon, California. Environ. Biol. Fishes 63, 117–135. doi: 10.1023/A:1014200301213.pdf
Knip D. M., Heupel M. R., Simpfendorfer C. A. (2010). Sharks in nearshore environments: Models, importance, and consequences. Mar. Ecol. Prog. Ser. 402, 1–11. doi: 10.3354/meps08498
Lear K. O., Whitney N. M., Morgan D. L., Gleiss A. C. (2021). Temporal niche partitioning as a novel mechanism promoting co-existence of sympatric predators in marine systems. Proc. R. Soc. B. 288, 20210816. doi: 10.1098/rspb.2021.0816
Magnuson J. J., Crowder L. B., Medvick P. A. (1979). Temperature as an ecological resource. Integr. Comp. Biol. 19, 331–343. doi: 10.1093/icb/19.1.331
Matern S. A., Cech J. J., Hopkins T. E. (2000). Diel movements of bat rays, Myliobatis californica, in Tomales Bay, California: Evidence for behavioral thermoregulation? Environ. Biol. Fishes 58, 173–182. doi: 10.1023/A:1007625212099
Meekan M. G., Fuiman L. A., Davis R., Berger Y., Thums M. (2015). Swimming strategy and body plan of the world’s largest fish: Implications for foraging efficiency and thermoregulation. Front. Mar. Sci. 2. doi: 10.3389/fmars.2015.00064
Nasby-Lucas N., Dewar H., Lam C. H., Goldman K. J., Domeier M. L. (2009). White shark offshore habitat: A behavioral and environmental characterization of the eastern pacific shared offshore foraging area. PloS One 4, e8163. doi: 10.1371/journal.pone.0008163
Oñate-González E. C., Sosa-Nishizaki O., Herzka S. Z., Lowe C. G., Lyons K., Santana-Morales O., et al. (2017). Importance of Bahia Sebastian Vizcaino as a nursery area for white sharks (Carcharodon carcharias) in the Northeastern Pacific: A fishery dependent analysis. Fisheries Res. 188, 125–137. doi: 10.1016/j.fishres.2016.12.014
Orrell D. L., Hussey N. E. (2022). Using the VEMCO positioning system (VPS) to explore fine-scale movements of aquatic species: applications, analytical approaches and future directions. Mar. Ecol. Prog. Ser. 687, 195–216.
Papastamatiou Y. P., Iosilevskii G., Leos-Barajas V., Brooks E. J., Howey L. A., Chapman D. D., et al. (2018a). Optimal swimming strategies and behavioral plasticity of oceanic whitetip sharks. Sci. Rep. 8, 1–12, e0127807. doi: 10.1038/s41598-017-18608-z
Papastamatiou Y. P., Watanabe Y. Y., Bradley D., Dee L. E., Weng K., Lowe C. G., et al. (2015). Drivers of daily routines in an ectothermic marine predator: Hunt warm, rest warmer? PloS One 10 (6), e0127807. doi: 10.1371/journal.pone.0127807
Papastamatiou Y. P., Watanabe Y. Y., Demšar U., Leos-Barajas V., Bradley D., Langrock R., et al. (2018b). Activity seascapes highlight central place foraging strategies in marine predators that never stop swimming. Movement Ecol. 6, 1–15. doi: 10.1186/s40462-018-0127-3
Pineda J., López M. (2002). Temperature, stratification and barnacle larval settlement in two Californian sites. Continental Shelf Res. 22, 1183–1198. doi: 10.1016/S0278-4343(01)00098-X
Rex P. T., May J. H. III, Pierce E. K., Lowe C. G. (2023). Patterns of overlapping habitat use of juvenile white shark and human recreational water users along southern California beaches. PloS One 18, e0286575. doi: 10.1371/journal.pone.0286575
RStudio Team (2020). RStudio: integrated development for R (Boston, MA: RStudio, PBC). Available at: http://www.rstudio.com/.
Schlaff A. M., Heupel M. R., Simpfendorfer C. A. (2014). Influence of environmental factors on shark and ray movement, behaviour and habitat use: A review. Rev. Fish Biol. Fisheries 24, 1089–1103. doi: 10.1007/s11160-014-9364-8
Speed C. W., Meekan M. G., Field I. C., McMahon C. R., Bradshaw C. J. A. (2012). Heat-seeking sharks: Support for behavioural thermoregulation in reef sharks. Mar. Ecol. Prog. Ser. 463, 231–244. doi: 10.3354/meps09864
Sperone E., Micarelli P., Andreotti S., Spinetti S., Andreani A., Serena F., et al. (2010). Social interactions among bait-attracted white sharks at dyer island (South africa). Mar. Biol. Res. 6 (4), 408–414.
Spurgeon E., Anderson J. M., Liu Y., Barajas V. L., Lowe C. G. (2022). Quantifying thermal cues that initiate mass emigrations in juvenile white sharks. Sci. Rep. 12, 1–12. doi: 10.1038/s41598-022-24377-1
Thygesen U. H., Sommer L., Evans K., Patterson T. A. (2016). Dynamic optimal foraging theory explains vertical migrations of bigeye tuna. Ecology 97, 1852–1861. doi: 10.1890/15-1130.1
Topping D. T., Lowe C. G., Caselle J. E. (2006). Site fidelity and seasonal movement patterns of adult California sheephead Semicossyphus pulcher (Labridae): An acoustic monitoring study. Mar. Ecol. Prog. Ser. 326, 257–267. doi: 10.3354/meps326257
Towner A. V., Underhill L. G., Jewell O. J. D., Smale M. J. (2013). Environmental influences on the abundance and sexual composition of white sharks Carcharodon carcharias in Gansbaai, South Africa. PloS One 8, e71197. doi: 10.1371/journal.pone.0071197
Vaudo J. J., Heithaus M. R. (2013). Microhabitat selection by marine mesoconsumers in a thermally heterogeneous habitat: behavioral thermoregulation or avoiding predation risk? PloS One 8, e61907. doi: 10.1371/journal.pone.0061907
Vinagre C., Cabral H. N. (2008). Prey consumption by the juvenile soles, Solea solea and Solea Senegalensis, in the Tagus estuary, Portugal. Estuarine Coast. Shelf Sci. 78, 45–50. doi: 10.1016/j.ecss.2007.11.009
Walter R. K., Woodson C. B., Leary P. R., Monismith S. G. (2014). Connecting wind-driven upwelling and offshore stratification to nearshore internal bores and oxygen variability. J. Geophysical Research: Oceans 119, 3517–3534. doi: 10.1002/2014JC009998
Ward-Paige C. A., Britten G. L., Bethea D. M., Carlson J. K. (2015). Characterizing and predicting essential habitat features for juvenile coastal sharks. Mar. Ecol. 36, 419–431. doi: 10.1111/maec.12151
Weng K. C., Boustany A. M., Pyle P., Anderson S. D., Brown A., Block B. A. (2007a). Migration and habitat of white sharks (Carcharodon carcharias) in the eastern Pacific Ocean. Mar. Biol. 152, 877–894. doi: 10.1007/s00227-007-0739-4
Weng K. C., O’Sullivan J. B., Lowe C. G., Winkler C. E., Dewar H., Block B. A. (2007b). Movements, behavior and habitat preferences of juvenile white sharks Carcharodon carcharias in the eastern Pacific. Mar. Ecol. Prog. Ser. 338, 211–224. doi: 10.3354/meps338211
White C. F., Lyons K., Jorgensen S. J., O’Sullivan J., Winkler C., Weng K. C., et al. (2019). Quantifying habitat selection and variability in habitat suitability for juvenile white sharks. PloS One 14, e0214642. doi: 10.1371/journal.pone.0214642
Winant C. D., Bratkovich A. W. (1981). Temperature and currents on the Southern California shelf: A description of the variability. J. Phys. Oceanography 11, 71–86. doi: 10.1175/1520-0485(1981)0112.0.CO;2
Keywords: juvenile white shark, acoustic telemetry, behavioral thermoregulation, space use, three-dimensional movement
Citation: Spurgeon E, Thompson ML, Alexander MD, Anderson JM, Rex PT, Stirling B, Abbott K and Lowe CG (2024) The influence of micro-scale thermal habitat on the movements of juvenile white sharks in their Southern California aggregation sites. Front. Mar. Sci. 11:1290769. doi: 10.3389/fmars.2024.1290769
Received: 11 September 2023; Accepted: 23 February 2024;
Published: 19 April 2024.
Edited by:
Nuno Queiroz, Centro de Investigacao em Biodiversidade e Recursos Geneticos (CIBIO-InBIO), PortugalReviewed by:
Karissa Opal Lear, Murdoch University, AustraliaLara Loureiro Sousa, University of Oxford, United Kingdom
Copyright © 2024 Spurgeon, Thompson, Alexander, Anderson, Rex, Stirling, Abbott and Lowe. This is an open-access article distributed under the terms of the Creative Commons Attribution License (CC BY). The use, distribution or reproduction in other forums is permitted, provided the original author(s) and the copyright owner(s) are credited and that the original publication in this journal is cited, in accordance with accepted academic practice. No use, distribution or reproduction is permitted which does not comply with these terms.
*Correspondence: Emily Spurgeon, e.spurgey@gmail.com