Trends and drivers of CO2 parameters, from 2006 to 2021, at a time-series station in the Eastern Tropical Atlantic (6°S, 10°W)
 Nathalie Lefèvre
 Doris Veleda
 Laurence Beaumont3
- 1Laboratoire d'Océanographie et du Climat: Expérimentations et Approches Numériques/Institut Pierre Simon Laplace (LOCEAN/IPSL), Institut de Recherche pour le Développement (IRD), Sorbonne Université, Centre National de la Recherche Scientifique-Muséum National d'Histoire Naturelle (CNRS-MNHN), Paris, France
- 2Laboratório de Oceanografia Física Estuarina e Costeira (LOFEC), Federal University of Pernambuco, Department of Oceanography, Recife, Brazil
- 3Division Technique, Institut National des Sciences de l'Univers (INSU), Gif sur Yvette, France
The seawater fugacity of CO2 (fCO2) has been monitored hourly at an instrumented mooring at 6°S, 10°W since 2006. The mooring is located in the South Equatorial Current and is affected by the equatorial Atlantic cold tongue. This site is characterized by large seasonal sea surface temperature variations (>4°C). The fCO2 is measured by a spectrophotometric sensor deployed at about 1.5 meters deep. Measurements of seawater fCO2, sea surface temperature (SST) and sea surface salinity (SSS) are used to calculate total dissolved inorganic carbon (TCO2) and pH. Total alkalinity (TA) is calculated using an empirical relationship with SSS determined for this region. Satellite chlorophyll-a concentrations at 6°S, 10°W are low (<0.2 mg m-3) but some peaks over 0.8 mg m-3 are sometimes detected in August. Nevertheless, the site is a permanent source of CO2 to the atmosphere, averaging 4.7 ± 2.4 mmol m-2d-1 over 2006-2021. Despite the weakening of the wind, the CO2 flux increases significantly by 0.20 ± 0.05 mmol m-2d-1 yr-1. This suggests that the source of CO2 is increasing in this region. This is explained by seawater fCO2 increasing faster than the atmospheric increase during 2006-2021. Most of the seawater fCO2 increase is driven by the increase of TCO2, followed by SST. The fCO2 increase leads to a pH decrease of -0.0030 ± 0.0004 yr-1. The SST anomalies (SSTA) at 6°S, 10°W are correlated to the Tropical Southern Atlantic (TSA) index and to the Atlantic 3 region (ATL3) index with a correlation coefficient higher than 0.75. The strong positive phase of both ATL3 and TSA, observed towards the end of the time-series, is likely contributing to the strong increase of seawater fCO2.
1 Introduction
The increase in anthropogenic atmospheric CO2 has caused an increase in seawater CO2, leading to a gradual decrease in seawater pH, which is the process of ocean acidification (Doney et al., 2009). This process might affect marine ecosystems and a global ocean acidification network has been established to better understand the ocean acidification conditions and the response of the various ecosystems (Newton et al., 2015; Tilbrook et al., 2019). Nevertheless, detecting significant CO2 and pH trends requires long-term monitoring because of the high natural variability. Long-term trends are also better assessed when there is sufficient monitoring as it is difficult to evaluate change over time in areas with large short-term spatio-temporal variability. Fixed time-series stations are useful for documenting the high frequency variability at key locations as the ocean acidification rate might vary depending on the processes occurring (Fassbender et al., 2017). Most of the time-series stations are located in the northern hemisphere, near the American and European coasts, as they are easier to access. Using 7 time-series stations, Bates et al. (2014) reported rates of pH decrease varying from -0.0026 to -0.0013 yr-1, over 15 to 30 years, and an increase of the partial pressure of CO2 (pCO2) from 1.28 to 2.37 μatm yr-1. This highlights the variability corresponding to different ocean environments.
Given the dynamics of the tropical Atlantic, there is currently a lack of CO2 monitoring in this region. In the western tropical Atlantic, using pH data of the CARIACO (CArbon Retention In A Colored Ocean) time-series (Muller-Karger et al., 2019), Bates et al. (2014) reported a significant decrease of -0.0025 ± 0.0004 over 1995-2012. A network of instrumented buoys is a good opportunity to install biogeochemical sensors and monitor the carbon properties. For example, in the Pacific, the TAO (Tropical Atmosphere Ocean) moorings are largely used with 7 moorings equipped with CO2 sensors (Sutton et al., 2019). In the Atlantic, the PIRATA (Prediction and Research Moored Array in the Tropical Atlantic) network, initiated in 1997, provides data for improving the understanding of ocean-atmosphere variability (Bourlès et al., 2019).
Since 2006, we took advantage of this network to monitor CO2 in the Eastern Tropical Atlantic (ETA) using the mooring at 6°S, 10°W. Measurements of the surface fugacity of CO2 (fCO2) at the site and in its vicinity highlighted the complexity and high dynamics in the ETA (Lefèvre et al., 2021).
The ETA exhibits a marked annual cycle of sea surface temperature (SST) (e.g. Caniaux et al., 2011). It is also affected by the meridional migration of the Atlantic intertropical convergence zone (ITCZ). Seasonal to decadal variability of the north-south interhemispheric SST gradient characterizes the Atlantic Meridional Mode (AMM) (Brierley and Wainer, 2018), which impacts the intensity and position of the ITCZ. AMM is the dominant mode of tropical SST-wind coupled variability, linked to changes in surface winds and evaporation feedbacks (Xie and Carton, 2004; Amaya et al., 2017). Another interannual signal affecting the ETA is the tropical Southern Atlantic (TSA) index, which is estimated from the SST anomalies (SSTA) in the box 30°W - 10°E, 20°S - 0° (Enfield et al., 1999). A zonal mode of variability is identified as the Atlantic cold tongue (ACT), which is the dominant seasonal SST signal in the eastern equatorial Atlantic.
Here, we present the trend of CO2 parameters and the ocean acidification rate determined at the 6°S, 10°W time-series station from 2006 to 2021. With measurements of seawater fCO2 and a total alkalinity (TA)-sea surface salinity (SSS) relationship, pH and total dissolved inorganic carbon (TCO2) could be calculated. The pH calculation from 2006 to 2021 allows us to document the ocean acidification in the open ocean. Section 3 presents the site, the variability of the different parameters and the trends from 2006 to 2021. In the discussion (section 4), we determine the main factors explaining the trends and we examine the link between the CO2 parameters and the various climatic indices affecting the ETA, especially the TSA and ATL3 indices. We also compare the rates of changes with some other oceanic time-series stations.
2 Materials and methods
2.1 Study site
The mooring is far enough from the African coast and is not affected by the runoff of the Congo River (Figure 1). Rainfall is quite low at this site. The ITCZ is in its northernmost position in August-October and in its southernmost position in January-March (Liu et al., 2020), but is always located north of 6°S.
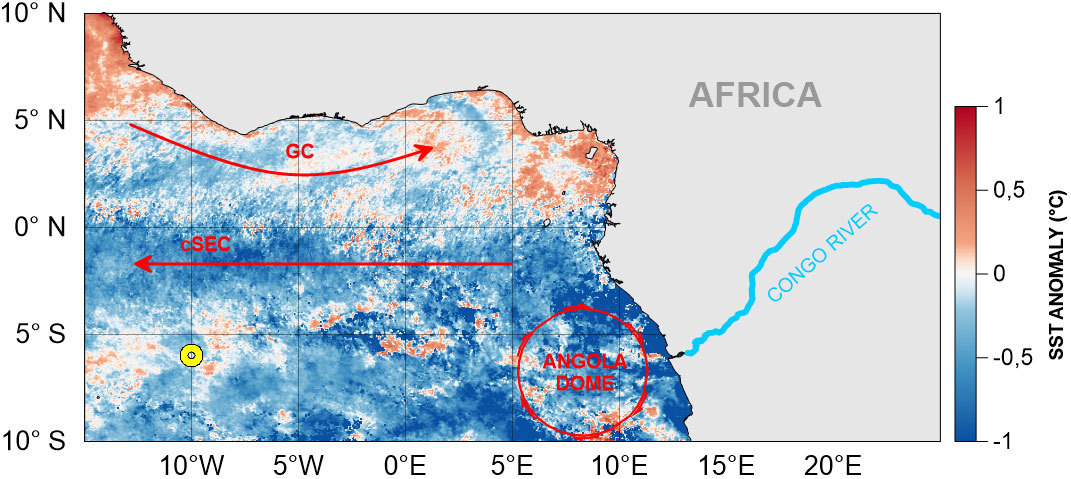
Figure 1 Map of the ETA with the location of the mooring (in yellow) and the main surface currents: the Guinea Current (GC) and the central branch of the South Equatorial Current (cSEC). The colored background corresponds to the MODIS SST anomalies of December 2020 calculated over the 2003-2023 period.
The ETA has two main surface currents. The Guinea Current (GC), an extension of the North Equatorial Counter Current (NECC), flows eastward north of ~2°N. From 10°S to 2°N, the central branch of the South Equatorial Current (cSEC) westward across the Atlantic. The surface waters at the mooring come from the cSEC. In boreal spring and summer, the region is affected by the development of the cold tongue (e.g. Caniaux et al., 2011). Depending on the surface currents, waters from the cold tongue may reach the mooring.
The ACT is maximum south of the equator, between the African coast and 20°W, with maximum upwelling from March to July, in response to the intensification of the southeast winds (Caniaux et al., 2011; Lübbecke et al., 2014). The ACT is reduced due to the weakening of the southerly cross–equatorial winds from September onward (Deppenmeier et al., 2016). On interannual timescales, the ACT exhibits large variability, with warm (cold) interannual SSTA, also known as Atlantic Niño (La Niña) events. These Atlantic Niño/Niña events stand out in boreal summer, coinciding with the seasonal expansion of the equatorial cold tongue (Lübbecke et al., 2014; Lübbecke and McPhaden, 2017; Vallès-Casanova et al., 2020). The Atlantic Niño/Niña can be represented through the ATL3 index, defined as the anomalies of averaged SST in the region between 20 ° W – 0 °E and 3°S – 3°N (Zebiak, 1993). Using a fully coupled physical-biogeochemical model, Wang et al. (2015) compare the equatorial Pacific and Atlantic basins. They show that SST mainly drives the carbon fields in the equatorial Atlantic. Examining the impact of the Atlantic Niño on the sea-air CO2 flux, Koseki et al. (2023) conclude that the Atlantic Niño enhances CO2 outgassing in the central tropical Atlantic.
On interannual time scales, the SSTA, registered by the buoy at 6°S, 10°W, follow well the variability of the TSA index from 2006 to 2014, as analyzed by Lefèvre et al. (2016) and this explained the lower SST observed at the 6°S, 10°W site from December 2011 to March 2012.
2.2 Carbon parameters at the mooring site
The surface fugacity of CO2 has been measured continuously, on an hourly basis, at 6°S, 10°W since June 2006 (Lefèvre et al., 2008). The CO2 sensor is located at 1.5m depth on a mooring and measures CO2 by spectrophotometry with an accuracy of ±3 μatm (Hood and Merlivat, 2001). The sensor is calibrated before and after each annual deployment against fCO2 measurements made by an infrared detector. Due to several failures of the CO2 sensor, the dataset presents some gaps with few data at the beginning of the year and no data in 2014, 2018 and 2019 (Figure 2). July is the most frequently sampled month, with data collected over 11 years, while February is the lowest sampled month. In 2012, CO2 data are available every month.
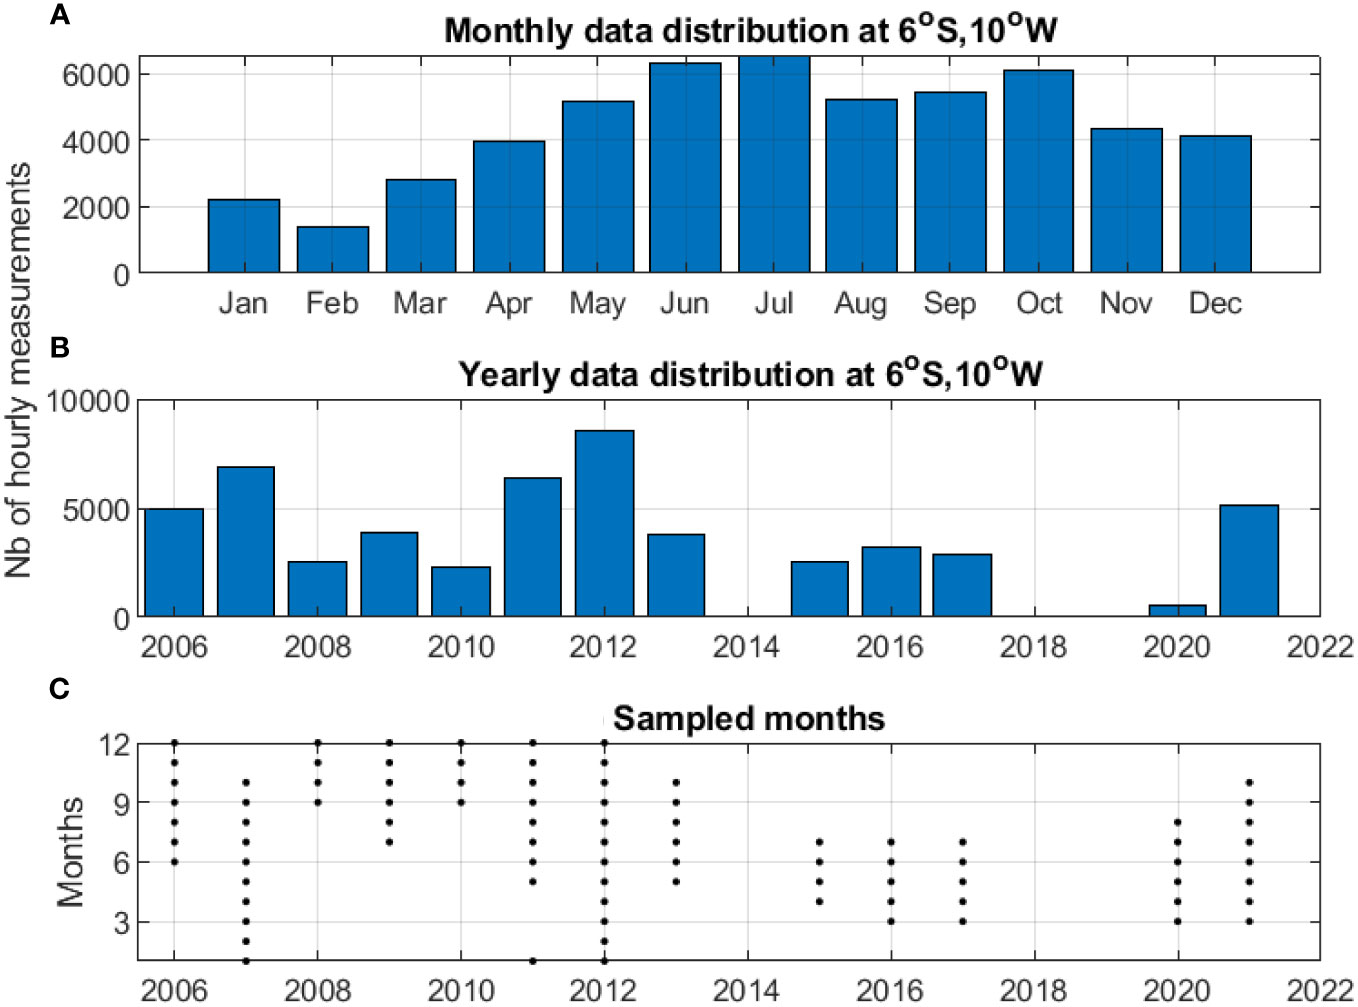
Figure 2 (A) Monthly, (B) yearly numbers of fCO2 measurements performed by the CO2 sensor at 6°S, 10°W over the June 2006 – October 2021 period, and (C) sampled months for each year, with the numbers 1 to 12 corresponding to the months from January to December.
The carbon system equations allow the calculation of pH, when it is not measured directly, by the knowledge of two carbon parameters such as fCO2 and TA (e.g. Lauvset et al., 2015) or TCO2 and TA (e.g. Azetsu-Scott et al., 2014; Bates, 2017).
During the annual cruises servicing the mooring, seawater samples are taken for TA and TCO2 analyses in the ETA. TA and TCO2 are measured on the same sample by potentiometric titration using a closed-cell (Edmond, 1970). Using the TA data collected between 2005 and 2007, Koffi et al. (2010) determined an empirical TA-SSS relationship for the region 10°N-10°S, 10°W-10°E:
This relationship is robust and has been confirmed by more recent observations in the ETA with a root mean square error (rmse) of 8.5 μmol kg-1 and a correlation coefficient (r) > 0.99 (Lefèvre et al., 2021). From 2005-2022, 20 total alkalinity samples were collected at 6°S, 10°W. The measured total alkalinity of these 20 samples and the corresponding total alkalinity estimated by Equation 1 give an rmse of 6.1 μmol kg-1 and an r of 0.98.
An empirical relationship has also been determined to estimate TCO2 from SST, SSS and the year for the ETA between 12°S-12°N, 12°W-12°E from 2005 to 2019 (Lefèvre et al., 2021):
The twenty TCO2 samples measured at 6°S, 10°W are in good agreement with TCO2 estimated by Equation 2 with an rmse of 11.8 μmol kg-1 and r of 0.93.
Using total alkalinity estimated by Equation 1 and the observed hourly fCO2 time-series, we calculate hourly surface pH at seawater conditions on the total hydrogen ion scale and TCO2 with the CO2SYS software for Matlab (Van Heuven et al., 2011; Sharp et al., 2021). The carbonic acid dissociation constants are taken from Mehrbach et al. (1973) refit by Dickson and Millero (1987), the bisulfate dissociation constant from Dickson (1990), the hydrogen fluoride constant from Perez and Fraga (1987) and the formulation of the borate-to-salinity ratio from Lee et al. (2010). Calculated TCO2 compared with TCO2 obtained with Equation 2 gives an rmse of 15.4 μmol kg-1 and an r of 0.86.
The uncertainty of TA estimated from SSS is taken as the rmse between calculated and measured TA, which is 6.1 μmol kg-1. Computing pH and TCO2 using the fCO2-TA pair leads to an error estimated by the routine uncertainty propagation from Orr et al. (2018). With an uncertainty of 0.01°C, 0.02 and 3 μatm for SST, SSS and fCO2 respectively, the mean error is 0.0031 for pH and 4 μmol kg-1 for TCO2, assuming no error in the dissociation constants. Lauvset and Gruber (2014) found a similar error on calculated pH (with an error of 0.0033) using the fCO2-TA pair to detect trends in the North Atlantic.
Atmospheric fCO2 (fCO2atm) is calculated from 2006 to 2021 using the monthly molar fraction of CO2 (xCO2) at the Ascension Island (7.92°S, 14.42°W), an atmospheric station of the international air sampling network (Lan et al., 2022). Atmospheric pressure from the NCEP/NCAR reanalysis project is used (Kalnay et al., 1996), instead of the atmospheric pressure measured at the mooring, to avoid data gaps due to sensor failure.
The daily CO2 flux is calculated as follows (Equation 3):
where k is the gas exchange coefficient from Wanninkhof (2014), and S is the solubility of Weiss (1974). The daily wind speed measured at 6°S, 10°W at 4 m is converted to a 10 m wind speed for the flux calculation using the logarithmic wind profile formula (e.g. Hood et al., 2001; Sutton et al., 2017). It is in good agreement with the daily Cross Calibrated Multi-Platform (CCMP) wind product from 2006 to 2016 with an r of 0.98 and an rmse of 0.28 m s-1 (3652 observations). As the wind speed at the mooring is wrong after 2016, we use the CCMP wind fields for the calculation of the flux and the trends.
2.3 Physical parameters measured at 6°S, 10°W
The CO2 sensor is installed on an instrumented mooring of the PIRATA network and is equipped with various sensors. Temperature and salinity are measured at different depths in the water column. The mooring has an anemometer and a rain gauge. The parameters used in this study are listed in Table 1. The salinity is derived from conductivity and temperature measurements. The details on sensor specifications can be found at https://www.pmel.noaa.gov/gtmba/sensor-specifications. We use an accuracy of ±0.01°C and ±0.02 for SST and SSS respectively.

Table 1 Parameters measured at 6°S, 10°W in the ocean and in the atmosphere.
2.4 Satellite data and climatic indices
No biological parameter is available at the mooring. In order to examine the impact of the biological activity on the carbonate system, we use the chlorophyll-a concentrations from Moderate-resolution Imaging Spectroradiometer (MODIS) Aqua at a resolution of 4 km. We use the 8-day composites from 4 July 2002 to 27 December 2022 extracted at the 6°S, 10°W location. Monthly sea surface temperatures from MODIS Aqua at 4 km resolution are used to calculate the climatic indices relevant to the region. The MODIS SST extracted at 6°S, 10°W is in good agreement with the monthly SST measured at the mooring with r>0.99 and an rmse of 0.43°C. For the TSA index, monthly temperature anomalies from MODIS SST are calculated from 2006 to 2021 in the region 30°W - 10°E, 20°S - 0°. For the ATL3 index, monthly anomalies are calculated in the region 20 ° W – 0 °E and 3°S – 3°N. We apply a low-pass filter of 36 months (moving average of 36 months) to the climatic indices to remove the high frequency fluctuations from the time-series and to highlight the slow variations.
Both chlorophyll-a and temperature products are downloaded from the Goddard Earth Sciences Data and Information Services Center (GES DISC).
2.5 Statistics and trend analysis
Monthly climatologies are calculated from the time-series at 6°S, 10°W. The anomalies are obtained by subtracting the monthly climatology to the observations to remove the seasonal signal. The trends are then calculated by linear regressions of the anomalies over the period. Physical parameters are measured on a longer period at 6°S, 10°W (2000-2023). However, to compare with the CO2 trends, the regressions are calculated for 2006-2021. The slopes of the regressions are compared using t-test to determine whether the trends are similar. A trend is statistically significant when the p-value is less than 0.05. Sutton et al. (2022) presented a method to detect trends and made their software package (TOATS) available. Their method assumes normal distribution of the data. Although our hourly fCO2 are not normally distributed, we calculated the trend using TOATS for comparison.
Seawater fCO2 depends on SST, SSS, TCO2 and TA and can be calculated as a function of these four parameters using CO2SYS (Equation 4):
For each parameter, a trend is calculated and represents a variation over 2006-2021. For example, SSS varied by ΔSSS over this period. This variation of SSS is converted to a seawater fCO2 variation, by keeping other parameters constant to their mean values over 2006-2021, and varying SSS only (Equation 5):
The calculation is done for each parameter. Thus, the seawater fCO2 trend is attributed to changes in SST, SSS, TCO2 and TA as was done at other time-series station (e.g. Bates et al., 2012).
3 Results
3.1 Time-series of SST, SSS, wind speed and chlorophyll-a
Daily SST at 6°S, 10°W are minimum in July-September, at the season of the cold tongue, and maximum in March-April with a mean seasonal amplitude over 4°C (Figure 3A). The seasonal variability is stronger than the interannual variability. The year-to-year amplitude over 2006-2021 is of the order of 1°C with a minimum of 25.6°C in 2012 and a maximum of 26.6°C in 2019. The SST over the 2006-2021 period averages 26.23 ± 0.28°C.
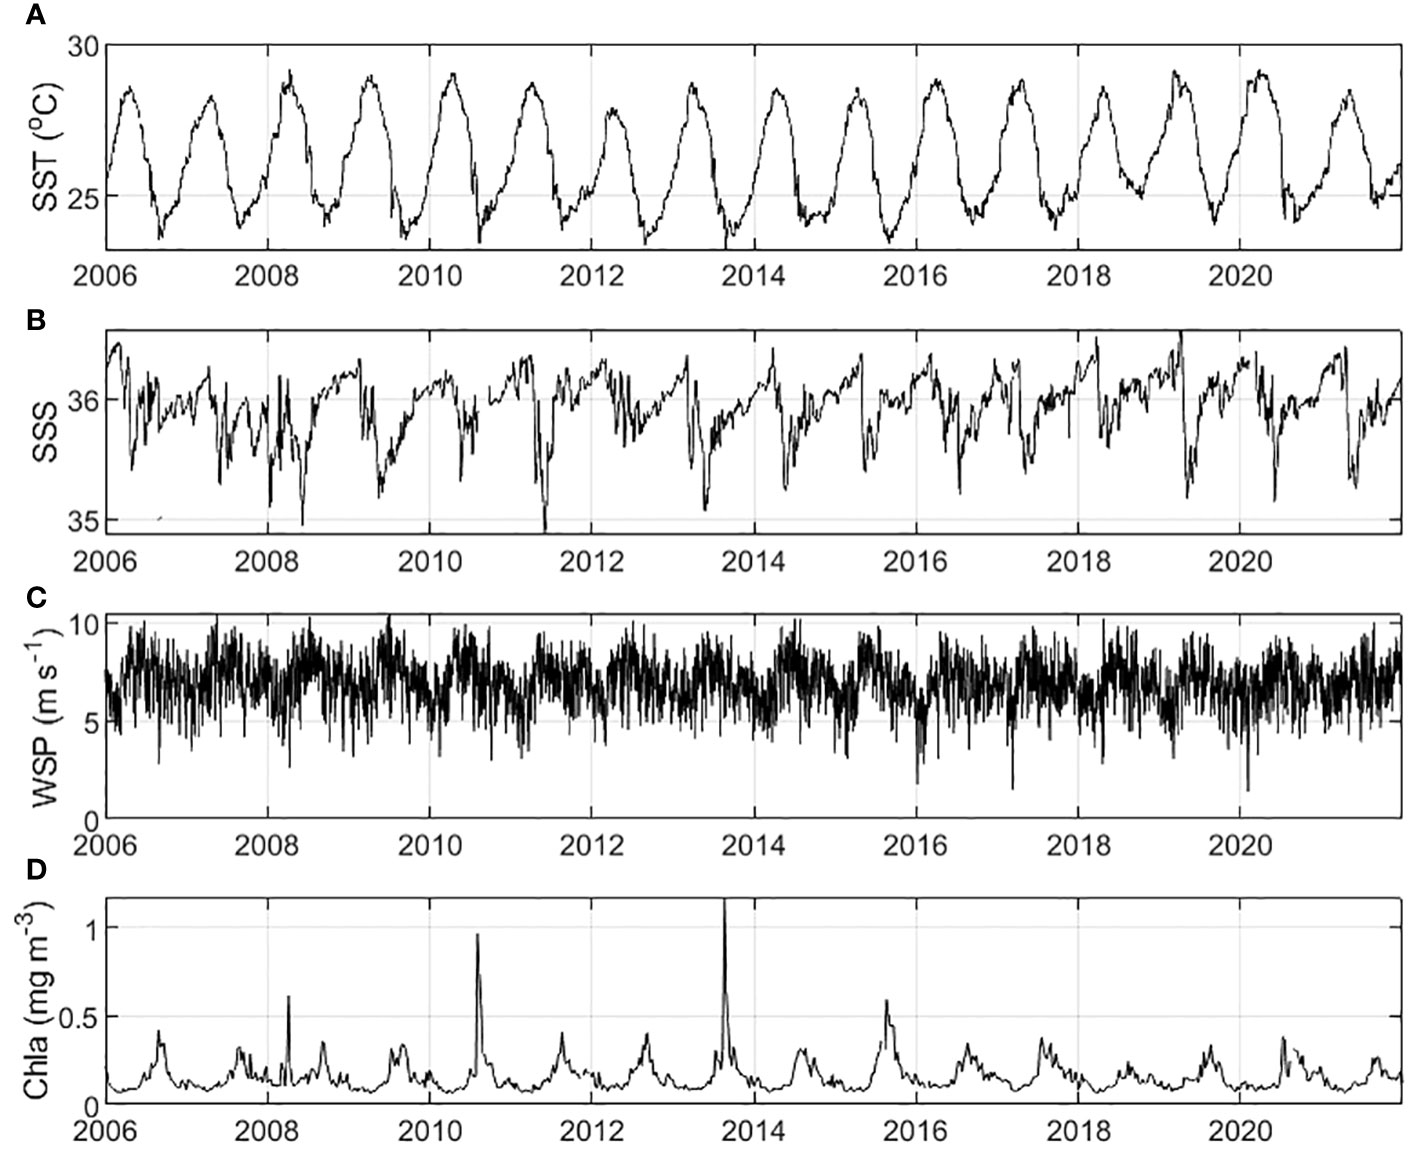
Figure 3 (A) Daily SST (Seabird sensor) and (B) SSS measured at 6°S, 10°W, (C) daily wind speed (WSP) at 10 m from CCMP, and (D) 8-day composites of chlorophyll-a concentrations (Chla) from MODIS Aqua extracted at 6°S, 10°W.
The daily SSS time-series is far less regular than the SST time-series. It exhibits some sharp decreases that vary from year to year (Figure 3B). The mean SSS at 6°S, 10°W over the 2006-2021 period is 35.95 ± 0.26, ranging from 34.88 in June 2011 to 36.57 in April 2019. Rainfall is low at this site (0.011 ± 0.11 mm hr-1) and is characterized by some rain events occurring mainly in April. The lowest SSS are usually observed in May-June whereas the highest peak values occur mainly in March-April. Within a month or so, the SSS decreases abruptly each year at the time of the development of the cold tongue.
The daily CCMP wind speed at 10 m presents a more regular pattern, with a distinguishable seasonal pattern (Figure 3C). It averages of 6.96 ± 1.22 m s-1 over 2006-2021 but there is a strong daily variability with values ranging from 1.4 to 10.5 m s-1. The lowest wind speeds are observed in January-March and the highest in May-July.
The MODIS chlorophyll-a concentrations at the mooring are usually low with a mean of 0.16 ± 0.08 mg m-3 (Figure 3D). Some peaks of chlorophyll-a may occur, mainly in August, during the cold tongue season. There is strong year-to-year variability. The highest concentration is observed in August 2013 with a peak reaching 1.2 mg m-3 associated to the lowest SST (23.24°C). Strong chlorophyll-a peaks are usually associated with lowest SST. There is a noticeable exception with an unusual peak of high chlorophyll-a in April 2008 when the SST reaches high values (29.13°C).
3.2 Time-series of seawater carbonate system variables
The time-series of hourly seawater fCO2 at 6°S, 10°W shows an increase from 2006 to 2021 (Figure 4A). The seawater fCO2 calculated from the discrete measurements of TCO2 and TA (indicated in red) are close to the fCO2 measurements. On the seasonal scale, the lowest fCO2 are usually observed in June. Overall, with the exception of May-July in 2006 and 2011, seawater fCO2 is higher than the atmospheric fCO2 (Figure 4A) making this site a source of CO2 to the atmosphere.
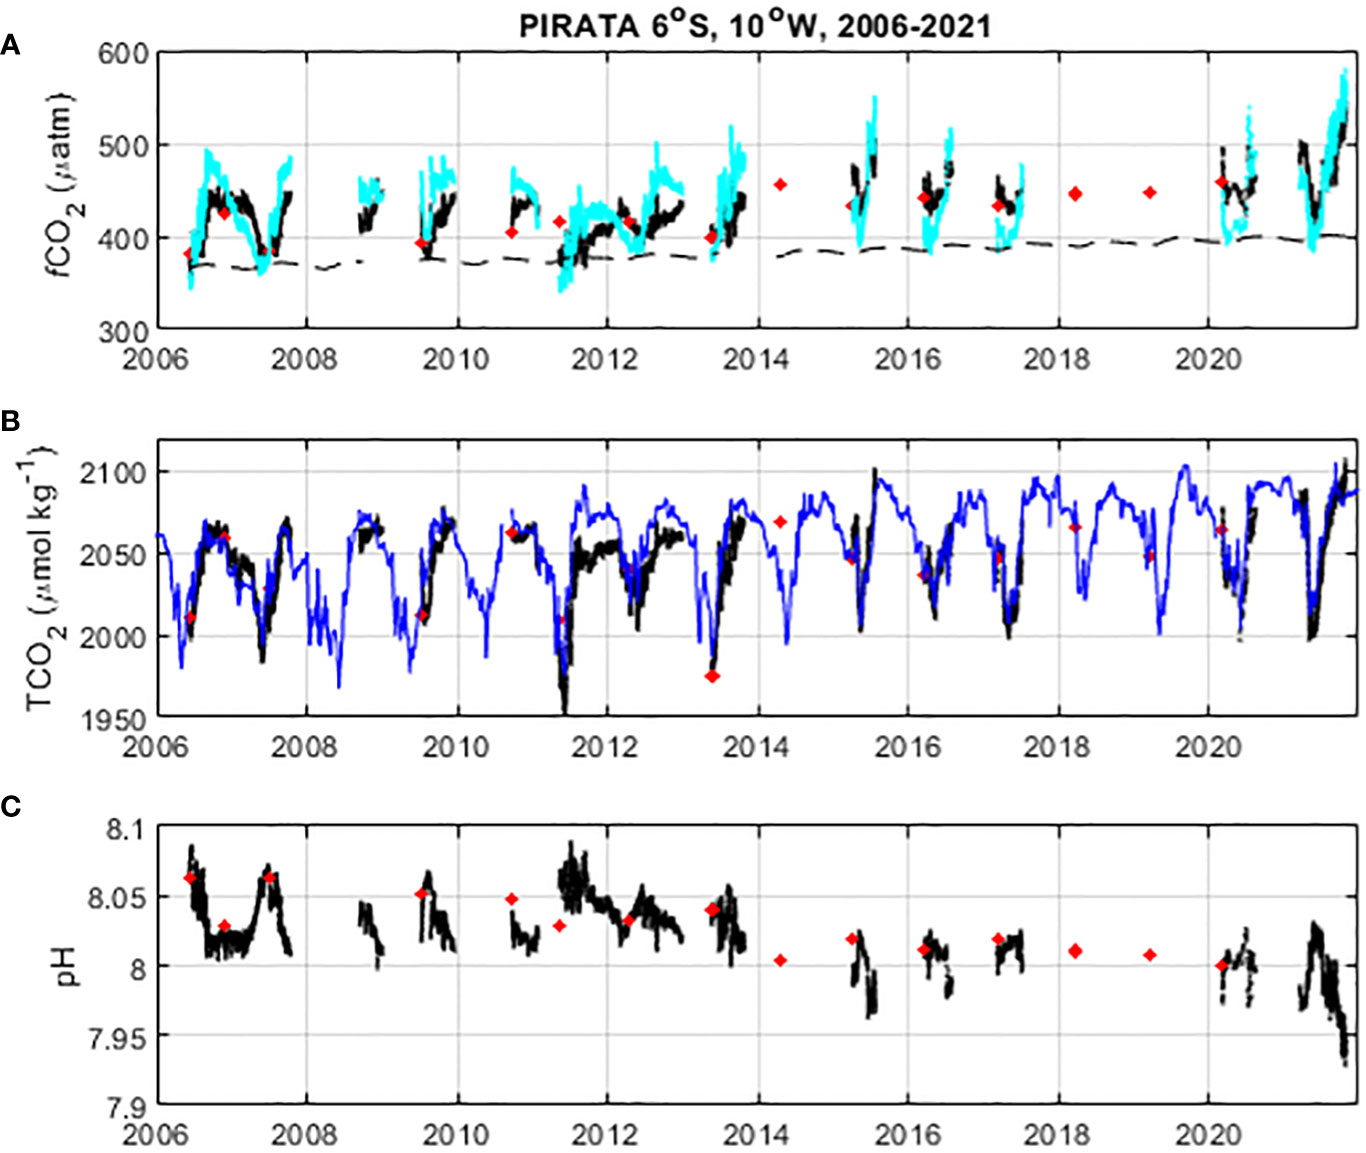
Figure 4 (A) Hourly fCO2 measurements from the mooring at 6°S, 10°W (black line), fCO2 estimated from TA and TCO2 samples (red dots), fCO2 calculated at a temperature of 26.2°C (cyan line), and atmospheric fCO2 (dashed line) (B) hourly TCO2 (in black) calculated from measured fCO2 and TA estimated using Equation 1 (black line), discrete measurements of TCO2 (red dots), and daily TCO2 estimated using Equation 2 (blue line); (C) hourly pH (total hydrogen ion scale at seawater temperature) calculated from measurements of fCO2 and TA estimated using Equation 1 (black line), and pH estimated from TA and TCO2 measurements (red dots).
Although the dataset presents several gaps, fCO2 in recent years seem well above the atmospheric level. In particular, values less than 400 μatm are often observed at the beginning of the time-series whereas, in recent years, fCO2 remains above 400 μatm (Figure 4A). Given this dataset, the fCO2 time-series can be divided in two time periods with stronger values observed after the year 2014. Hourly fCO2 values are significantly different before and after 2014. The monthly fCO2 values from 2006-2014 and 2014-2021 are also significantly different (p< 0.05). However, when the temperature effect is removed, monthly fCO2 calculated at the mean temperature of 26.2°C does not present any significant difference between the two periods. This implies that the difference of fCO2 at monthly scale is mainly due to SST.
As the main jump of fCO2 values is due to a temperature effect, the TCO2 time-series calculated from hourly fCO2 and total alkalinity does not present a difference before and after the year 2014 (Figure 4B). The reconstruction of the TCO2 time-series by Equation 2 shows that the lowest carbon content is found in May-June (Figure 4B). The sharp TCO2 decreases coincide with the sharp SSS decreases as TCO2 is partly driven by SSS changes and the calculation using Equation 2 includes SSS. On the seasonal scale, TCO2 increases from September, with maximum concentrations usually observed around November, and decreases from May.
The upwelling season or development of the cold tongue can be detected on the daily CO2 parameters with negative fCO2-SST correlations of -0.62 (-0.87 for TCO2-SST) from 2006 to 2013 and -0.81 (-0.90 for TCO2-SST) from 2014 to 2021 for the June-September period. The regressions are different for each period and the correlation coefficient drops to 0.13 (-0.52 for TCO2-SST) when the whole period is considered.
The pH time-series is inversely correlated to fCO2 (r = -0.99) and shows a decrease from 2006 to 2021 (Figure 4C). The first year of the time-series presents pH values above 8 whereas pH values below 8 are often observed in more recent years. Overall, the mean pH is 8.026 ± 0.023.
3.3 Trends detected at 6°S, 10°W
The trends of the time-series are calculated from the monthly anomalies over the 2006-2021 period (Table 2) although the observations of physical parameters cover a longer period. Trends with p-values higher than 0.05 are not statistically significant at the 95% confidence level.
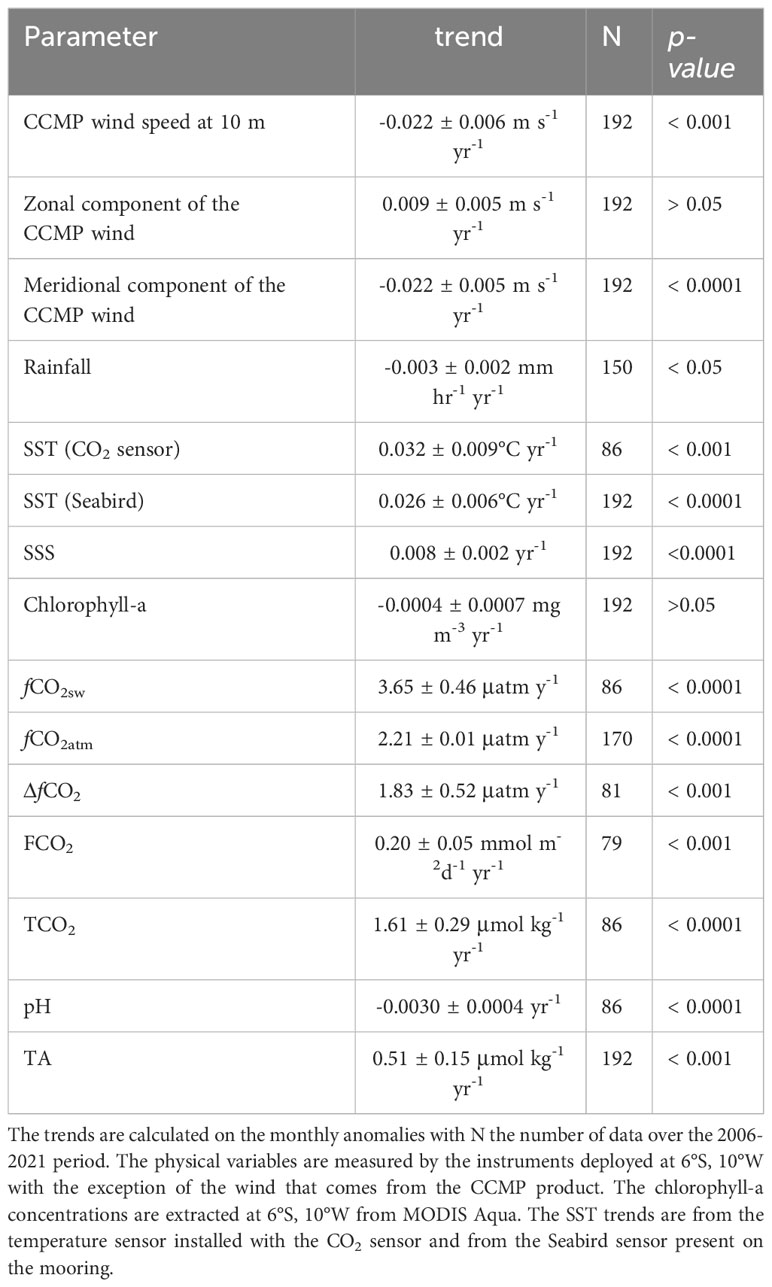
Table 2 Regressions of parameters measured at 6°S, 10°W.
Although the daily wind speed does not increase or decrease (Figure 3C), a trend can be detected when the monthly anomalies are calculated. The wind speed and the meridional component of the wind at 10 m are both decreasing significantly. The zonal component of the wind speed is increasing but the trend is not significant over 2006-2021 (Table 2). However, if the trend is calculated over the 2000-2021 period it becomes significant with an increase at a rate of 0.010 ± 0.003 m s-1 yr-1. The mooring is affected by the southeasterly trade winds and a weakening of these winds will result in less advection of colder southern waters and predominance of the warmer water mass coming from the North.
The weakening of the winds is consistent with an increasing SST over 2006-2021. Even with some data gaps, the SST measured at the same time as the CO2 sensor exhibits a significant increasing trend that is similar to the trend detected by the SST sensor installed on the mooring (Table 2) that provides a more complete time-series (Figure 3A). This suggests that the data gaps do not affect the calculation of the SST trend.
The biological activity does not play an important role on the CO2 variation at this site. The chlorophyll-a concentrations are low, with the exception of some isolated peaks (Figure 3D). The seasonal variability of chlorophyll-a is similar to the observations of Pérez et al. (2005) for the ETA between 0-10°S, 20-0°W. Radenac et al. (2020) observed that the main phytoplankton bloom occurred in the cold tongue in July-August and that it was driven by a vertical supply of nutrients in May-July. At 6°S, 10°W, some peaks of higher chlorophyll-a concentrations are observed in August. This suggests that the water mass sampled at the mooring is probably coming from the cold tongue. Over 2006-2021, the chlorophyll-a concentrations show a small decrease that is not statistically significant.
The seawater fCO2, TCO2 and the CO2 flux increase from 2006 to 2021 (Table 2, Figure 5). As TA is expressed as a function of SSS, TA is also increasing significantly at a rate of 0.51 ± 0.15 μmol kg-1 yr-1 over 2006-2021. Over the same period, pH decreases by 0.0030 ± 0.0004 yr-1. The rate of increase of atmospheric fCO2 is slower than the seawater fCO2 increase (Figure 5A). Using TOATS of Sutton et al. (2022), the seawater fCO2 trend is slightly higher with a rate of 4.3 ± 0.5 μatm yr-1 and the pH decreases by 0.0035 ± 0.0004 yr-1. Both trends are significant with p-value< 0.05 and are in agreement with our results. The pH values are calculated from measured fCO2 and derived TA with an estimated error of 0.0031 (section 2.2). This error remains smaller than the change of pH of 0.04, given the pH trend of 0.0030 yr-1 over the 2006-2021 period.
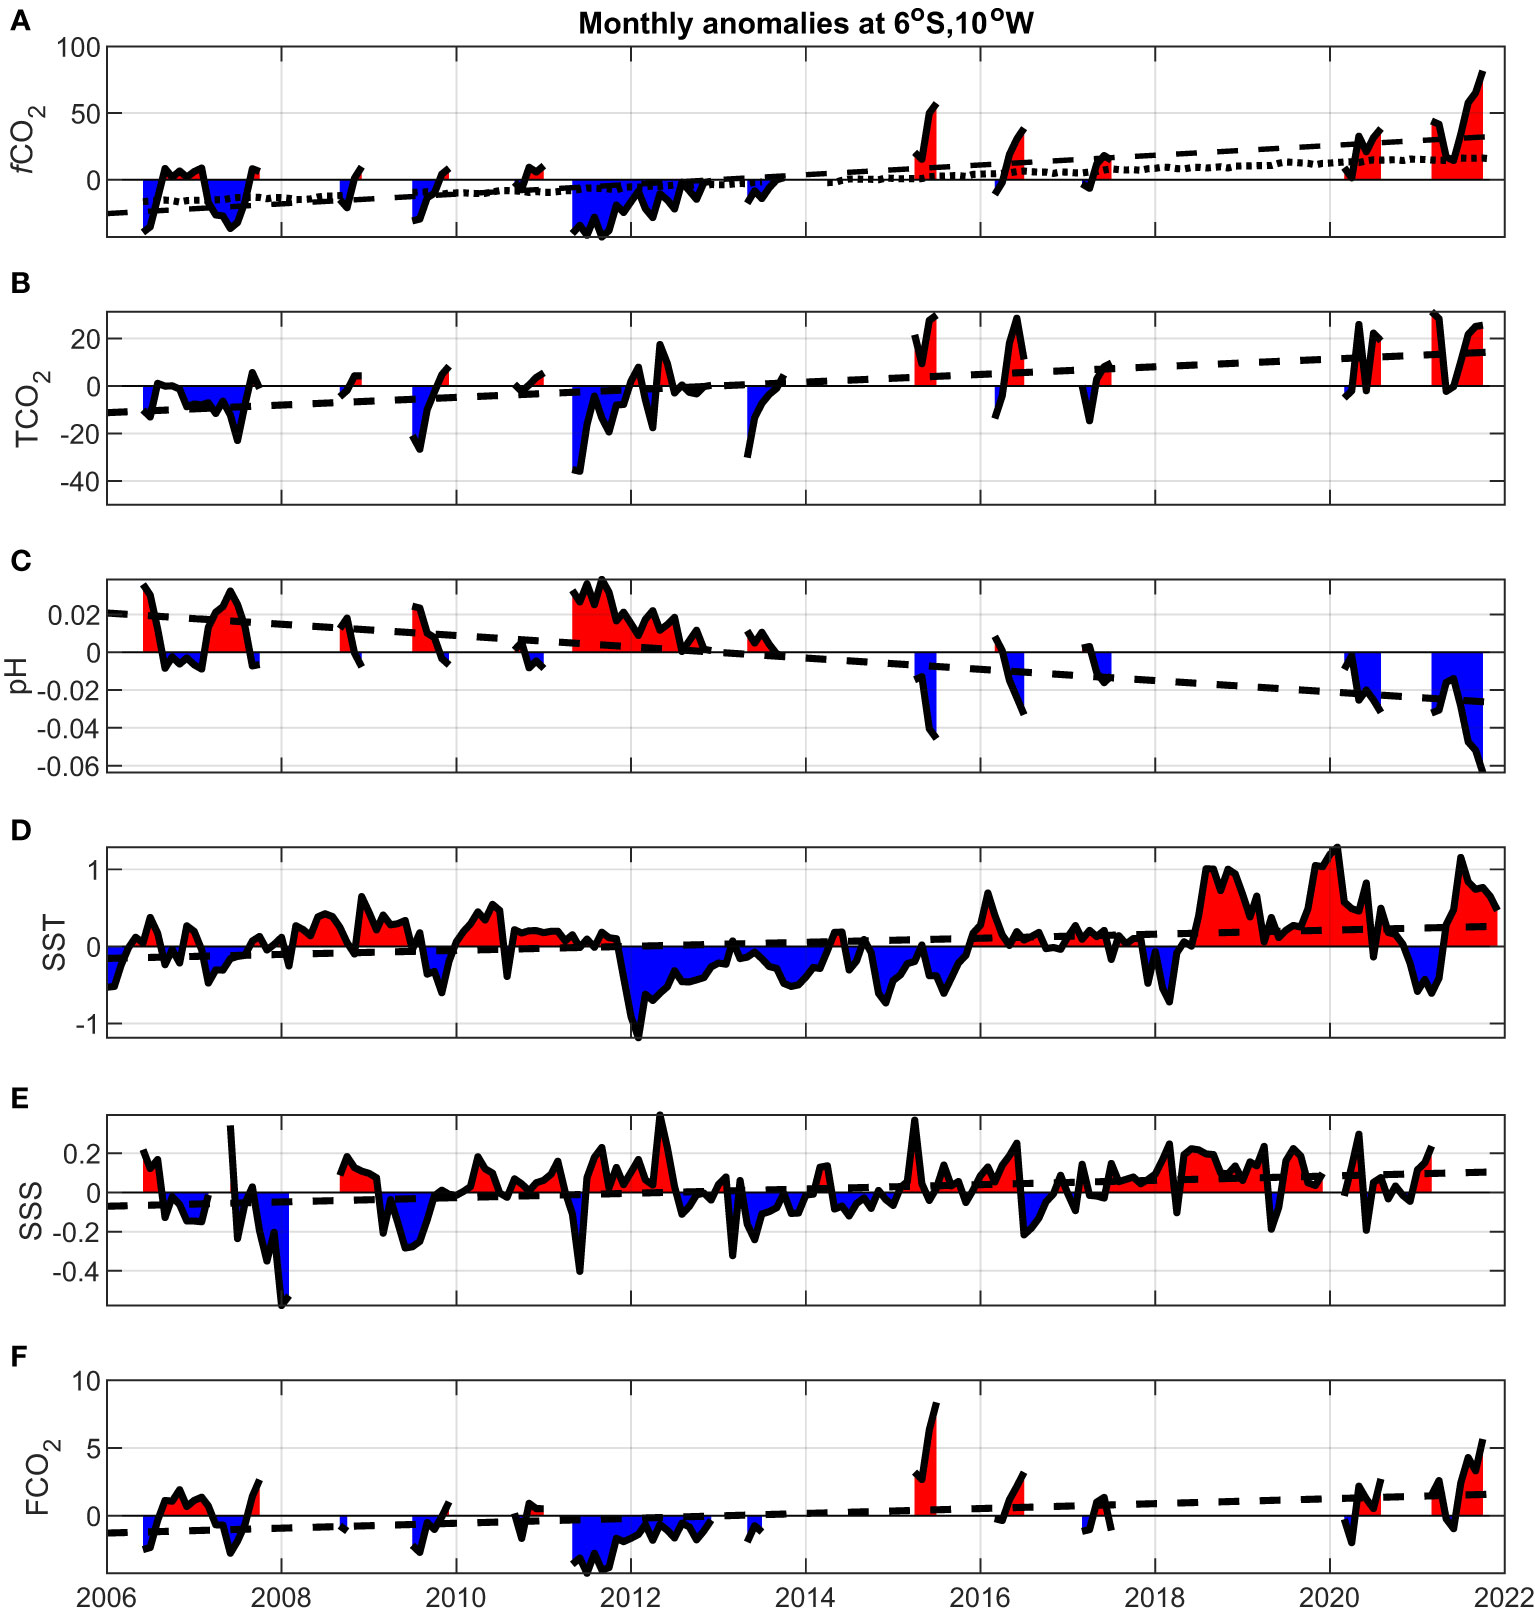
Figure 5 Monthly anomalies at 6°S, 10°W of (A) seawater fCO2 (in μatm) with the black dotted line corresponding to the atmospheric rate of increase, (B) TCO2 (in μmol kg-1), (C) pH, (D) SST (in °C), (E) SSS and (F) flux of CO2 (in mmol m-2d-1). The black dashed line in each panel corresponds to the trend line. The red and blue shadings correspond to positive and negative anomalies respectively.
When the time-series is split in two periods, no significant trend in seawater fCO2 is detected over both 2006-2014 and 2014-2021 periods. Using the data of the SST sensor at the mooring (SST time-series in Figure 3A), an increase of SST, at a rate of 0.095 ± 0.023°C yr-1, is detected from 2014 to 2021 only (p< 0.0001). This is higher than the overall trend over 2006-2021. Positive SSTA over 1°C are encountered in recent years, from 2018, whereas negative SSTA are found around 2014 (Figure 5D), which contributes to the higher slope of the regression line.
Calculated TCO2 increases at 6°S, 10°W over 2006-2021 but the trend of 1.61 ± 0.29 μmol kg-1 yr-1 is lower than the year coefficient of Equation 2, 2.49 ± 0.19 μmol kg-1 yr-1. This equation was determined in an area including the region of the cold tongue and the year coefficient of Equation 2 also reflects the variations in upwelling intensity. However, it is difficult to assess the evolution of the upwelling over 2006-2021 from the surface parameters measured in this region.
The SSS increases over the same period (Figure 5E), which leads to an increase of total alkalinity as total alkalinity is expressed as a function of SSS.
The CO2 flux depends on both the difference of fCO2 between the ocean and the atmosphere (ΔfCO2) and the wind speed. Overall the CO2 flux is increasing significantly over 2006-2021 (Figure 5F).
4 Discussion
4.1 Drivers of the CO2 trends
The oceanic fCO2 trend depends on several factors and can be attributed to changes of SST, SSS, TCO2 and TA. An increase of total alkalinity would contribute to decrease seawater fCO2 whereas an increasing TCO2 would increase seawater fCO2. This suggests that TCO2 dominates over total alkalinity, which results in an increasing trend of seawater fCO2. The rate of increase of seawater fCO2 is faster than the atmospheric one, as shown by the increase of ΔfCO2 that is statistically significant (Table 2). The increasing trend of ΔfCO2 would tend to increase the CO2 flux whereas the decrease of the wind speed would act in the opposite direction. The increasing CO2 flux suggests that ΔfCO2 is the main driver of the trend. Using the mean values of seawater and atmospheric fCO2, SST and SSS averaged over 2006-2021, the decrease of the wind speed alone would decrease the CO2 flux by 9%.Each contribution of SST, SSS, TCO2 and TA on the seawater fCO2 trend can be calculated by assuming no variation of the other parameters using the equations of the carbonate system as described in section 2.4. Figure 6 shows the contribution of each parameter to the seawater fCO2 increase. Over the full length of the time-series, the increase of TCO2 amounts to 25 μmol kg-1 given its yearly trend (Table 2). TCO2 contributes to about 98% of the observed fCO2 making it the main contributor to the fCO2 increase. The surface warming and its effect of 4%/°C increase on seawater fCO2 (Takahashi et al., 1993) contributes to an increase of 13%. The SSS has a minor effect (about 3%). The total alkalinity, expressed as a function of SSS, contributes to a decrease in the fCO2 trend by 14% but its effect is not strong enough to counteract the impact of TCO2.
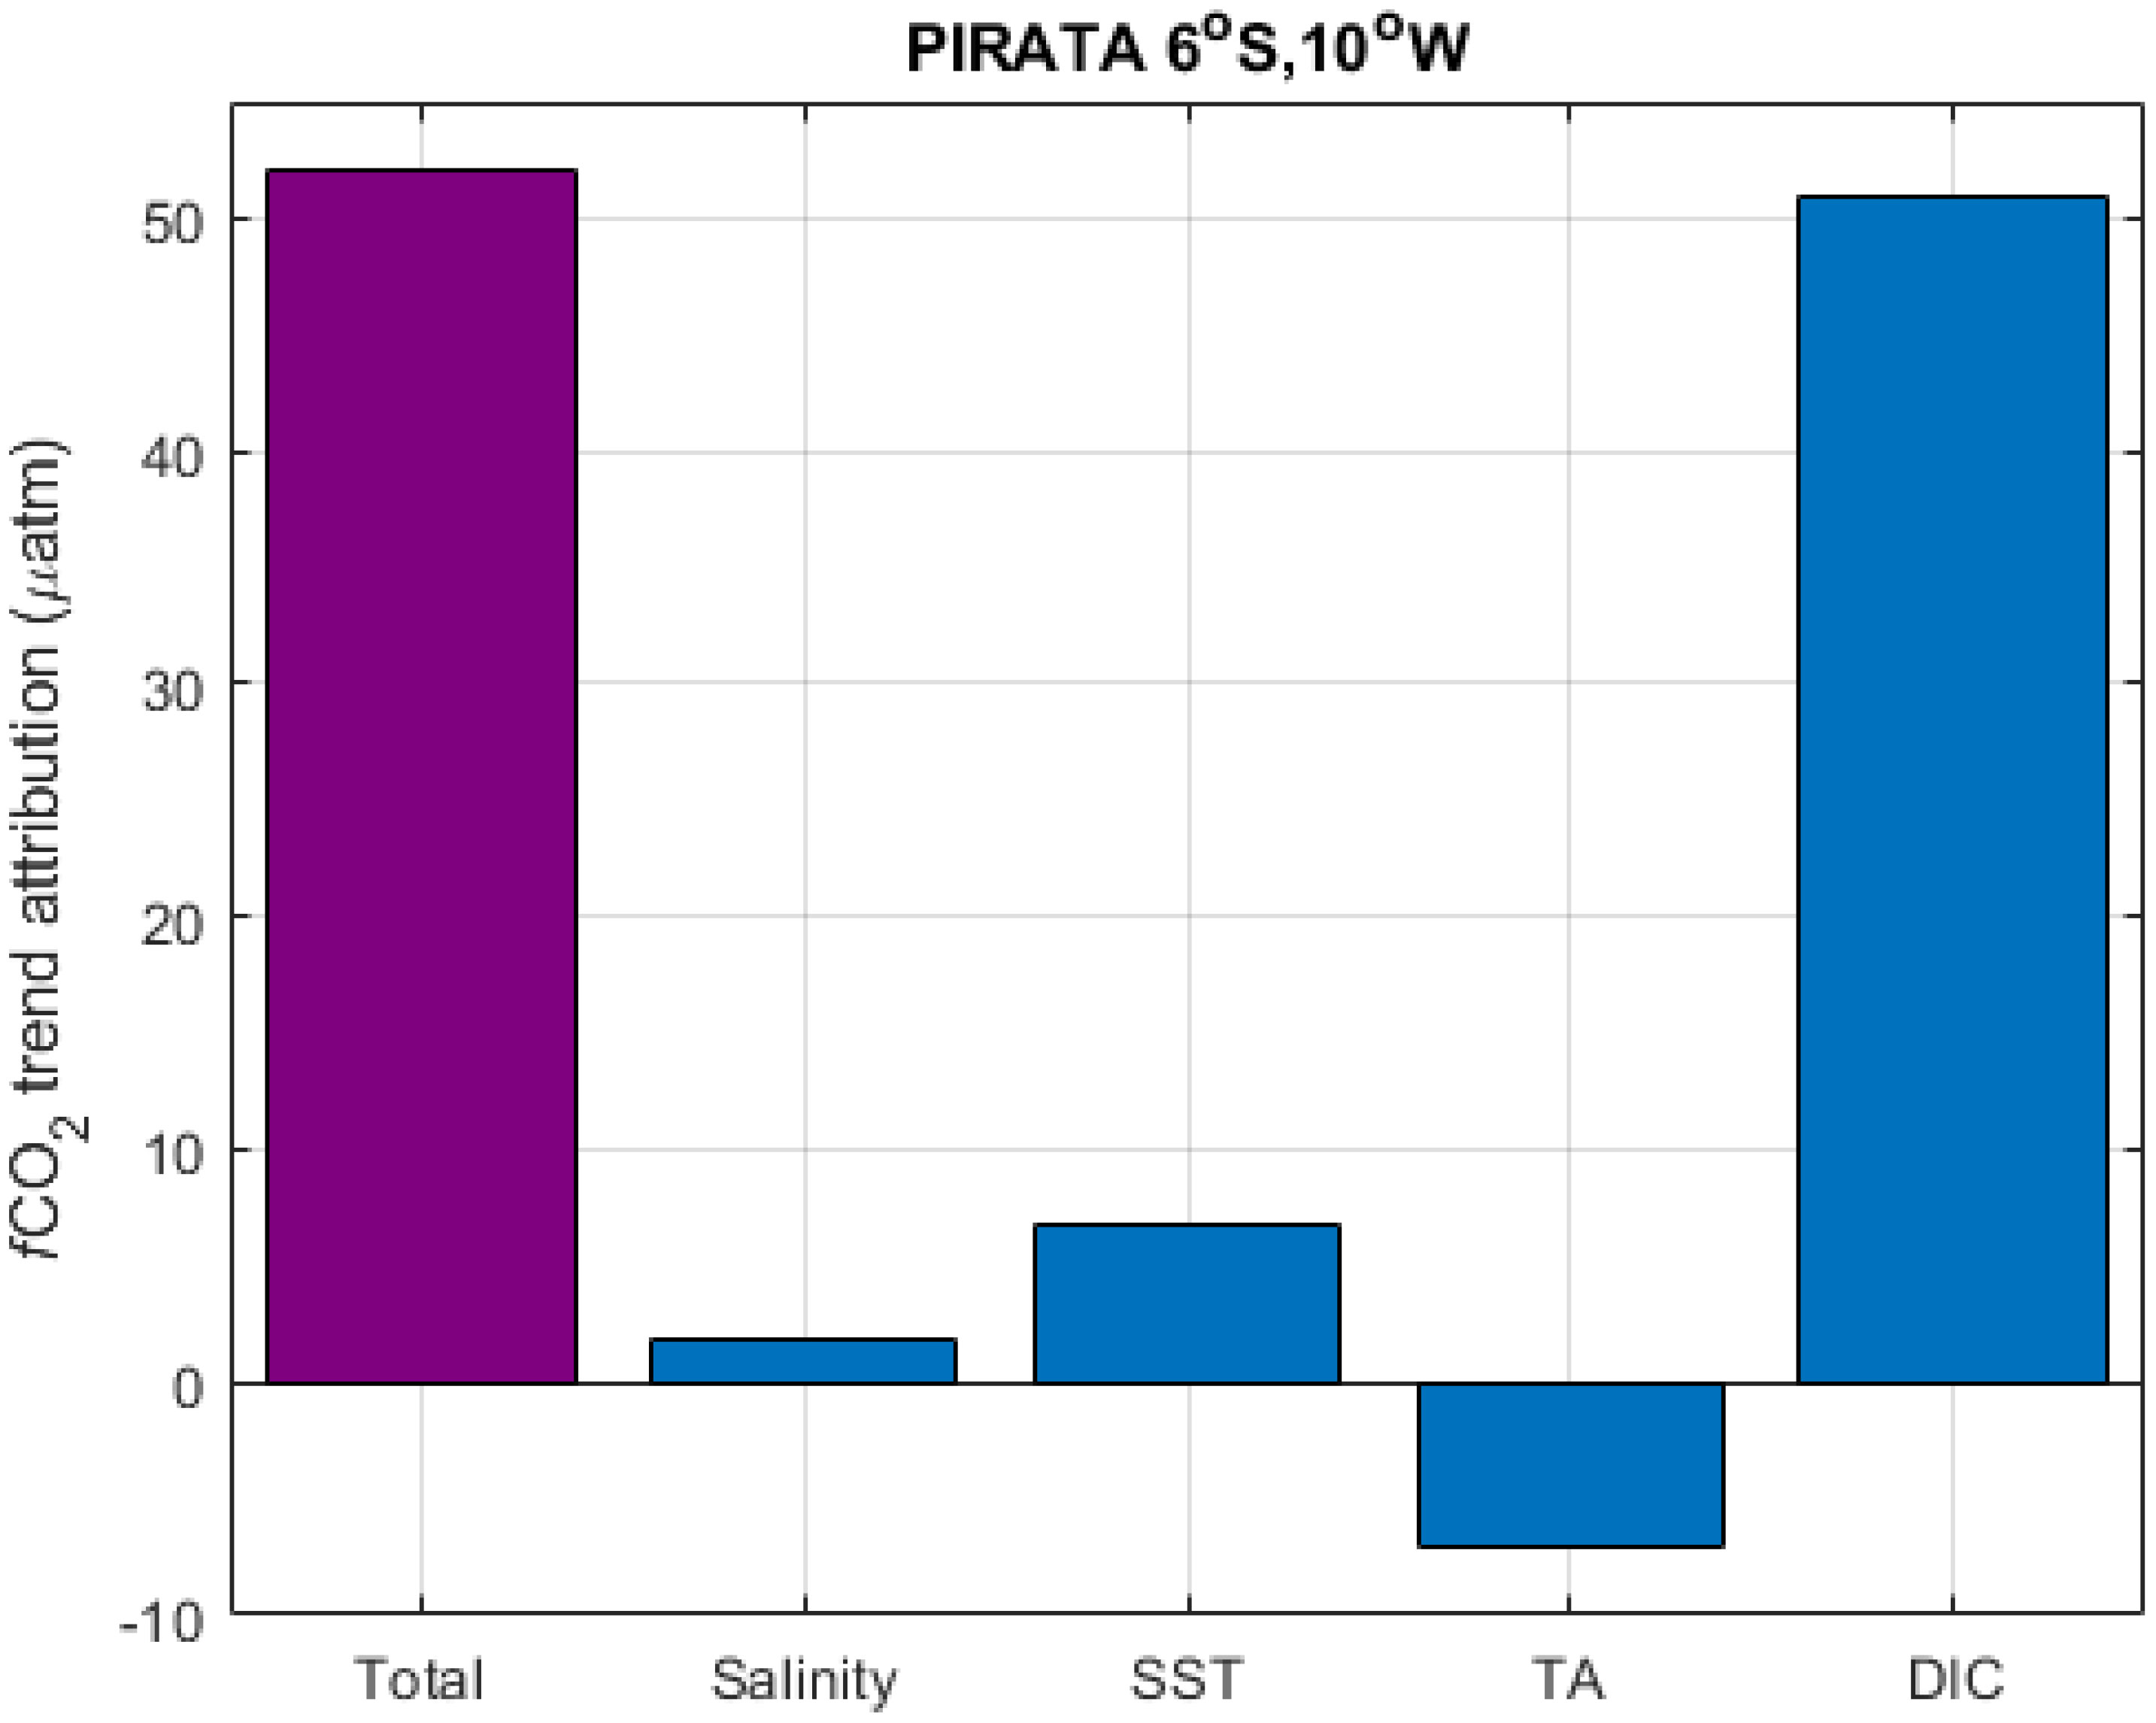
Figure 6 Increase of seawater fCO2 (in μatm) from 2006 to 2021 and the attribution to changes in SSS, SST, TA and TCO2 over the same period. This corresponds to a contribution of +3%, +13%, -14% and +98% of SSS, SST, TA and TCO2 respectively to the fCO2 trend.
We have compared our results to different oceanic time-series stations to determine whether the trends observed here are similar to what is found at other sites, and to explain any difference that may arise. Table 3 lists the main time-series stations considered and reported the trends observed in seawater fCO2 and pH, when available, with the period chosen for the calculation of the trend.
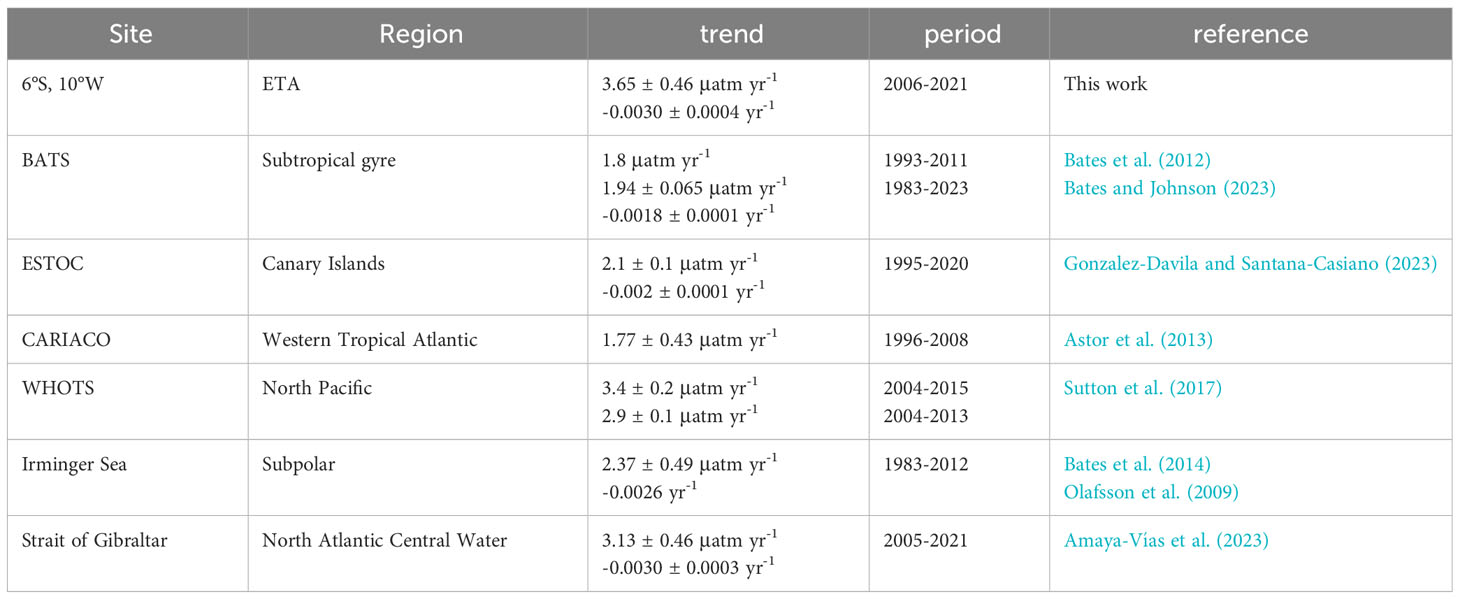
Table 3 Trends of seawater fCO2/pCO2 (in μatm yr-1) and pH (in yr-1) at different oceanic time-series stations and the period used for the calculation of the trend.
At the BATS (Bermuda Atlantic Time-Series Study, 31°40’N, 64°30’W) station, located in the subtropical Atlantic, the fCO2 trend from 1983 to 2011 is smaller than the one found at 6°S, 10°W (Table 3), and is similar to the atmospheric increase. At BATS, TCO2 was the main factor accounting for 122% of the fCO2 trend (Bates et al., 2012). For both BATS and the 6°S, 10°W site, the fCO2 trend is attributed to TCO2 first, followed by TA, SST and SSS.
In the North-East Atlantic, at the European Time-Series in the Ocean at the Canary Islands (ESTOC), the seawater fCO2 increase is mainly attributed to the atmospheric fCO2 increase (Gonzalez-Davila and Santana-Casiano, 2023). This location, further north of our site, exhibits different environmental conditions compared to the tropical region. Results obtained at ESTOC are similar to the BATS station further west. Both stations are situated in the North Subtropical Gyre and seawater fCO2 follows the rate of atmospheric increase.
In the tropical Atlantic, at the CARIACO time-series station, Astor et al. (2013) found a dominant role of surface warming explaining 72% of the fCO2 trend (1.77 ± 0.43 μatm yr-1) for 1996-2008. Their deseasonalized fCO2 trend is similar to the one observed at BATS but the main driver of the trend at CARIACO is SST.
Over 2006-2013, Lefèvre et al. (2016) could not observe any significant trend of seawater fCO2 but, due to the atmospheric CO2 increase, the CO2 outgassing was reduced. The longer time-series presented here enables us to detect a significant trend of seawater fCO2 over 2006-2021 with an increase at a rate of 3.65 ± 0.46 μatm yr-1 higher than the atmospheric increase.
The trends of seawater fCO2 and CO2 flux detected from 2006 to 2021 differ from those observed over the shorter 2006-2013 period. As noticed earlier, CO2 observations after 2014 exhibit higher values, which leads to an upward trend. In the North Pacific, at the WHOTS (Woods Hole Oceanographic Time-series Station, Hawaii, 22.7°N, 158°W), Sutton et al. (2017) reported a trend of 3.4 ± 0.2 μatm yr-1 from 2004 to 2015. This is a similar value as the one found at 6°S, 10°W. At both time-series stations, the warm anomalies, observed towards the end of the time-series, intensify the upward trend. After removing the warm Pacific anomaly, the pCO2 and pH trends become lower with a rate of 2.4 ± 0.2 μatm yr-1 and -0.002 ± 0.0003 yr-1 respectively. The CO2 increase is then closer to the atmospheric increase (Sutton et al., 2017). Given the high CO2 variability and the large data gaps, it is difficult to detect a trend at 6°S, 10°W over the 2006-2013 period. The trends are easier to detect over a longer period which explains the source of CO2 increasing over time observed from 2006 to 2021. This is also the case for the meridional component of the wind speed that becomes significant over 2000-2021 although the same rate of increase was not statistically significant over 2006-2021.
As the seawater fCO2 increases at a high rate at 6°S, 10°W, the pH is decreasing at a higher rate than most oceanic stations (e.g. Bates et al., 2014). Both high rates are likely caused by the warm anomalies observed at the end of the time-series. Anomalies affect the trends and are also observed at other oceanic time-series stations. For example, Bates et al. (2014) reported ocean acidification from 7 stations and the highest rate is observed in the Irminger Sea in a subpolar region (45.7°S, 171.5°E) with an increase of pCO2 of 2.37 ± 0.49 μatm yr-1 and a decrease of pH of -0.0026 yr-1 from 1983 to 2012. This rate is about twice as high as the rates observed at subtropical stations and is explained by strengthening of winter mixing (Olafsson et al., 2009).
Nevertheless, Amaya-Vías et al. (2023) reported different rates of increase of fCO2 for the Strait of Gibraltar, depending on water masses. In particular, the rates observed in the North Atlantic Central Water (NACW) are similar to our observations.
4.2 Impact of climate variability on the CO2 trends
Over the 2006-2021 period, the SST time-series presents several strong positive and negative anomalies. In early 2012, the negative SSTA is the strongest, with a value below -1°C. This anomaly affects the fCO2 distribution. Lower fCO2 associated with the negative SSTA led to a lower CO2 flux (Lefèvre et al., 2016). The strongest positive SSTA (>1°C) have been observed in recent years. Over the whole time-series the fCO2 shows the strongest values at the end, in 2021.
Unfortunately, some CO2 data gaps occurred during strong SSTA, which did not enable us to determine the impact of these anomalies on the CO2 flux. Given the gaps in the CO2 time-series and the complexity of the CO2 dynamics at 6°S, 10°W, there is no correlation between SSTA and the CO2 flux anomalies. However, seawater fCO2 anomalies are weakly but significantly correlated with SSTA (r = 0.33, p<0.005), and ATL3 and TSA indices shown in Figure 7 (r = 0.35, p<0.005). The wind speed modulates the CO2 flux, and its weakening might counterbalance the impact of the anomalies, which would explain the lack of correlation between the flux anomalies and the climate indices. Nevertheless, the link between fCO2 and the SSTA is evidenced in some years when strong SST anomalies occur. For example, in early 2012, negative SSTA close to -1°C (Figure 5D) are associated with negative fCO2 anomalies (Figure 5A). In 2021, SSTA over 1°C are associated with high seawater fCO2 values.
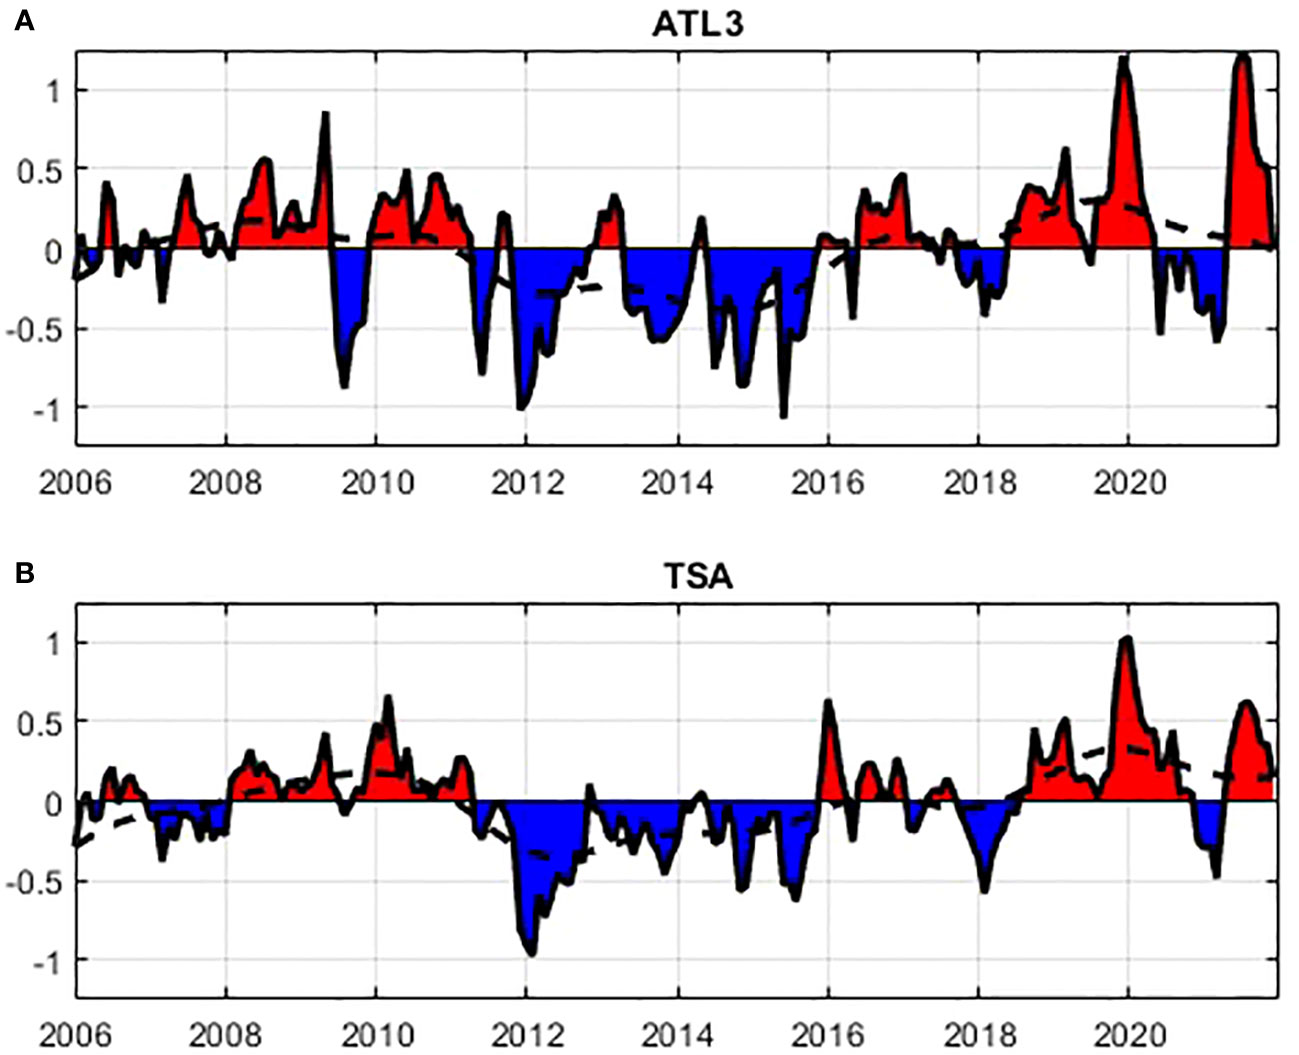
Figure 7 (A) ATL3 index and (B) TSA index from 2006 to 2023. ATL3 is an index of equatorial variability (20°W-0°, 3°S-3°N) and the TSA index is an indicator of the tropical southern Atlantic variability (30°W-10°E, 20°S-0°S). The dashed line corresponds to a 36-month low pass filter. The red and blue shadings correspond to positive and negative anomalies respectively.
The SSTA at 6°S, 10°W vary like the ATL3 and TSA indices (Figure 8). The main positive and negative SSTA are observed on both climatic indices and SSTA at the mooring. In particular, the negative SSTA in 2012 and the positive SSTA of 2020 of about 1°C appear clearly on all signals. The SSTA at 6°S, 10°W follow more closely the TSA variations. Overall, the correlations of the SSTA at 6°S, 10°W with ATL3 and TSA are 0.76 and 0.81 respectively. The AMM index presented low correlation (0.16) with the SSTA at the mooring. Both ATL3 and TSA exhibit low frequency variations, as highlighted by the 36 months low pass filter (dashed line in Figure 7). In recent years, both ATL3 and TSA indices are in a strong positive phase. This corresponds to the strong positive SSTA (Figure 5D) and the high fCO2 values (Figure 5A) observed towards the end of the time-series.
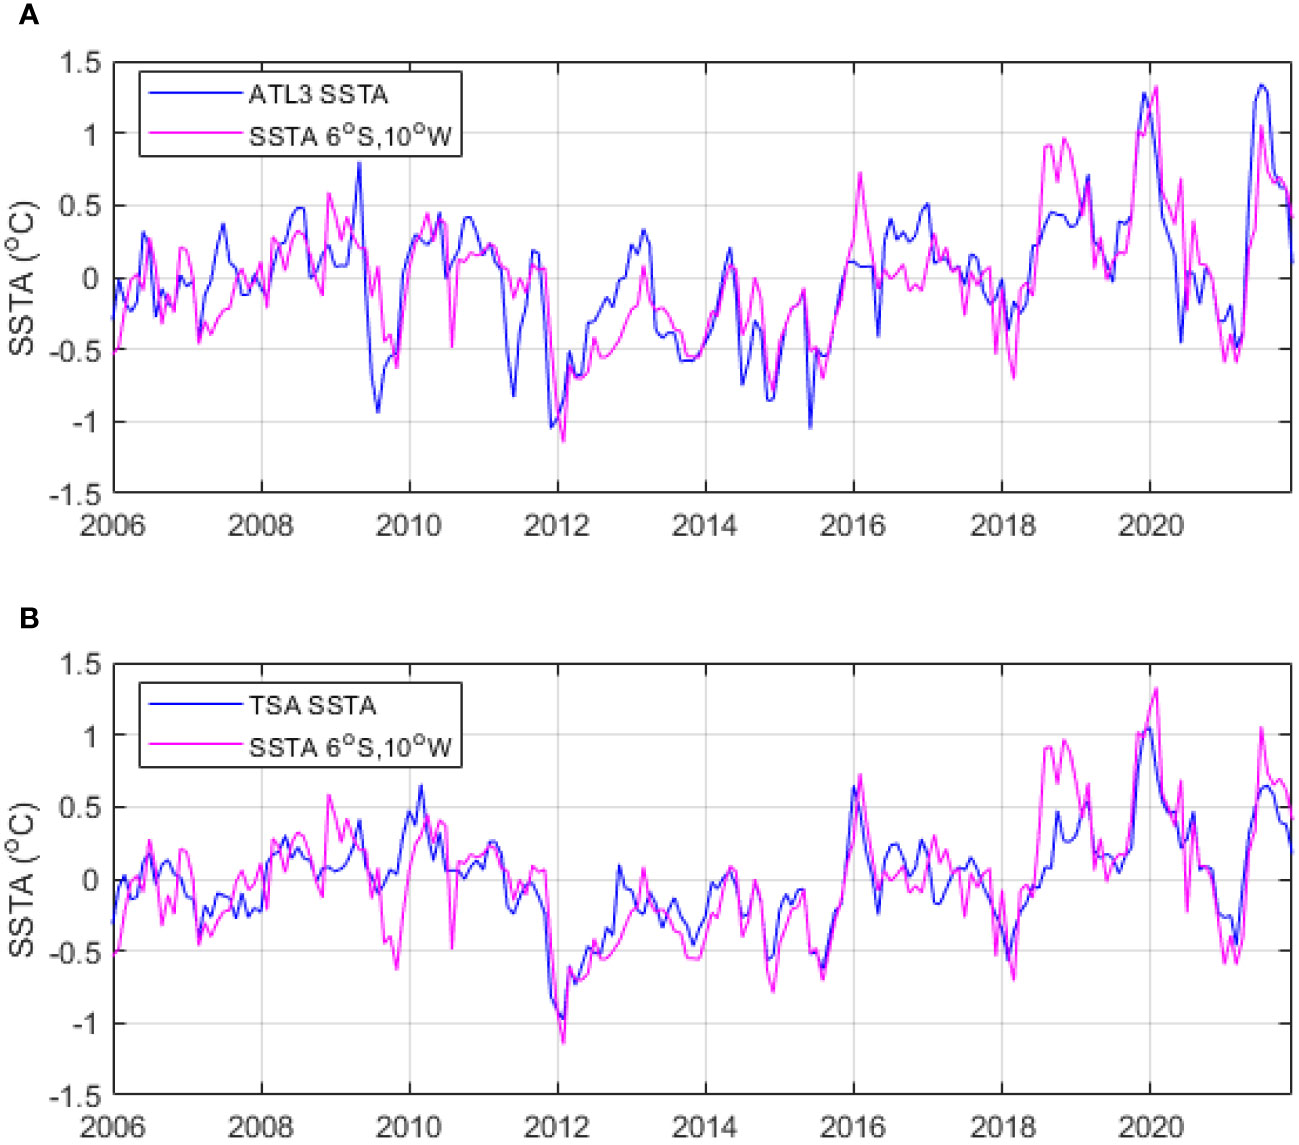
Figure 8 (A) ATL3 SSTA and monthly SSTA measured at 6°S, 10°W (correlation of 0.76) and (B) TSA SSTA and SSTA at 6°S, 10°W (correlation of 0.81) from 2006 to 2021. Both ATL3 and TSA SSTA are calculated using monthly MODIS SST.
Lately, SST values were often over 30°C in the ETA during the PIRATA cruises. In late 2019, Richter et al. (2022) reported a strong equatorial warming as shown by positive ATL3 SSTA calculated over 1988-2017, and a decrease in the meridional wind stress in the ATL3 region. Li et al. (2023) reported two strong Atlantic El Niños in January 2020 and July 2021.
In boreal spring-summer 2021, the Atlantic El Nino was the warmest equatorial event since 1982 (Illig and Bachèlery, 2023). These events are evidenced by the ATL3 index and the positive SSTA. As shown in section 3, there is a strong correlation between this index and the warming at 6°S, 10°W.
As the time-series at 6°S, 10°W ends in 2021, the high values measured in this year tend to increase the slope of the regression line. The method proposed by Sutton et al. (2022) consists of calculating statistically the number of years of observations that are needed to detect a significant trend. The result is called the time of trend emergence or the trend detection time. This calculation applied to our dataset gives a length of 15 years to detect the seawater fCO2 trend at 6°S, 10°W. Based on 40 moored time-series, Sutton et al. (2019) calculated a time of emergence ranging from 8 to 15 years for seawater pCO2 and pH at open ocean sites. However, as the time-series at 6°S, 10°W presents large data gaps and includes warm events, a longer record is required to provide a more robust estimate of the acidification rate at this site. This would allow us to filter the anomalous events as was done in the Pacific Ocean where El Niños were removed from the calculation of the trends (e.g. Sutton et al., 2014). It is therefore crucial to continue the CO2 monitoring at this site, especially as there is no other CO2 long time record in the equatorial Atlantic after the end of the CARIACO time-series.
5 Conclusions
The hourly fCO2 monitoring at the time-series station 6°S, 10°W highlights the strong CO2 variability in the ETA. Over the 2006-2021 period, despite the CO2 data gaps and the variability observed at this site, an increasing trend of seawater fCO2 emerges that is stronger than the atmospheric CO2 increase. An increasing trend of the CO2 flux is also detected as the effect of increasing ΔfCO2 is stronger than the effect of the decreasing wind speed. Despite lower fCO2 values measured at the beginning of the time-series in 2006, this site is a source of CO2 to the atmosphere throughout the period, averaging 4.7 ± 2.4 mmol m-2d-1. Due to the high values of seawater fCO2 (mean of 428 ± 28 μatm), the pH averages 8.026 ± 0.023 at this site.
Recent observations suggest that Atlantic El Niño, characterized by a strong positive phase of the ATL3 index, is a climatic driver that accelerates the CO2 outgassing in the ETA. The upward trend of fCO2 is likely affected by the positive phase of both ATL3 and TSA indices. Over the 2006-2014 period, seawater fCO2 values are significantly lower than over 2014-2021. The acidification and fCO2 rates (-0.0030 ± 0.0004 yr-1 and 3.65 ± 0.46 μatm y-1, respectively) are among the highest of the Atlantic ocean time-series, which is explained by the warm anomalies observed towards the end of the time-series, and associated to Atlantic El Niño events.
Pursuing the CO2 monitoring will give more confidence in detecting trends and enable us to remove events such as Atlantic El Niños. In addition, a longer CO2 record with more reliable data would allow the analysis of SSTA and their impact on the CO2 flux. Although statistically significant, the correlation between SSTA and fCO2 anomalies remains quite low, with a value of 0.33. Presently, it is difficult to determine the contribution of SSTA to the evolution of the CO2 flux.
Data availability statement
The datasets presented in this study can be found in online repositories. The names of the repository/repositories and accession number(s) can be found below: https://socat.info.
Author contributions
NL: Conceptualization, Data curation, Formal Analysis, Funding acquisition, Methodology, Project administration, Writing – original draft, Writing – review & editing. DV: Formal Analysis, Methodology, Writing – review & editing. LB: Methodology, Resources, Writing – review & editing.
Funding
The author(s) declare financial support was received for the research, authorship, and/or publication of this article. The work was funded by the Institut de Recherche pour le Développement (IRD) and the research infrastructure ICOS (Integrated Carbon Observation System) France. DV is grateful to Brazilian National Research Council (CNPq) Research Fellowship PQ2, Grant number: 314879/2020-0. DV also thanks to the SIMOPEC Project - funding from the CNPq Grant 406707/2022, and the TRIATLAS project, which has received funding from the European Union's Horizon 2020 research and innovation program under Grant Agreement Number 817578.
Acknowledgments
NCEP-NCAR Reanalysis 1 data provided by the NOAA PSL, Boulder, Colorado, USA, from their website at https://psl.noaa.gov. CCMP wind analyses are produced by Remote Sensing Systems. Data are available at www.remss.com. Chlorophyll-a and SST from MODIS Aqua were downloaded from the Giovanni online data system, developed and maintained by NASA Goddard Earth Sciences (GES) Data and Information Services Center (DISC). We thank the GTMBA Project Office of NOAAPMEL to provide TAO/TRITON mooring data. We are very grateful to US IMAGO from IRD, in particular Pierre Rousselot and Fabrice Roubaut, for the deployment of the CO2 sensors during the annual French PIRATA cruises.
Conflict of interest
The authors declare that the research was conducted in the absence of any commercial or financial relationships that could be construed as a potential conflict of interest.
Publisher’s note
All claims expressed in this article are solely those of the authors and do not necessarily represent those of their affiliated organizations, or those of the publisher, the editors and the reviewers. Any product that may be evaluated in this article, or claim that may be made by its manufacturer, is not guaranteed or endorsed by the publisher.
References
Amaya D. J., DeFlorio M. J., Miller A. J., Xie S.-P. (2017). WES feedback and the Atlantic meridional mode: Observations and CMIP5 comparisons. Climate Dyn. 49, 1665–1679. doi: 10.1007/s00382-016-3411-1.
Amaya-Vías S., Flecha S., Pérez F. F., Navarro G., García-Lafuente J., Makaoui A., et al. (2023). The time series at the Strait of Gibraltar as a baseline for long-term assessment of vulnerability of calcifiers to ocean acidification. Front. Mar. Sci. 10. doi: 10.3389/fmars.2023.1196938
Astor Y. M., Lorenzoni L., Thunell R., Varela R., Muller-Karger F., Troccoli L., et al. (2013). Interannual variability in sea surface temperature and fCO2 changes in the CARIACO basin. Deep-Sea Res. II. 93, 33–43. doi: 10.1016/j.dsr2.2013.01.002
Azetsu-Scott K., Starr M., Mei Z.-P., Granskog M. (2014). Low calcium carbonate saturation state in an Arctic inland sea having large and varying fluvial inputs: The Hudson Bay system. J. Geophys. Res.: Oceans 119, 6210–6220. doi: 10.1002/2014JC009948
Bates N. R. (2017). Twenty Years of Marine Carbon Cycle Observations at Devils Hole Bermuda Provide Insights into Seasonal Hypoxia, Coral Reef Calcification, and Ocean Acidification. Front. Mar. Sci. 4. doi: 10.3389/fmars.2017.00036
Bates N., Astor Y. M., Church M. J., Currie K., Dore J. E., Gonzalez-Dávila M., et al. (2014). A time-series view of changing ocean chemistry due to ocean uptake of anthropogenic CO2 and acidification. Oceanography 27, 126–141. doi: 10.5670/oceanog.2014.5616
Bates N. R., Best M. H. P., Neely K., Garley R., Dickson A. G., Johnson R. J. (2012). Detecting anthropogenic carbon dioxide uptake and ocean acidification in the North Atlantic Ocean. Biogeosciences 9, 2509–2522. doi: 10.5194/bg-9-2509-2012
Bates N. R., Johnson R. J. (2023). Forty years of ocean acidification observations, (1983–2023) in the Sargasso Sea at the Bermuda Atlantic Time-series Study site. Front. Mar. Sci. 10. doi: 10.3389/fmars.2023.1289931
Bourlès B., Araujo M., McPhaden M. J., Brandt P., Foltz G. R., Lumpkin R., et al. (2019). PIRATA: A sustained observing system for tropical Atlantic climate research and forecasting. Earth Space Sci. 6, 577–616. doi: 10.1029/2018EA000428
Brierley C., Wainer I. (2018). Inter-annual variability in the tropical Atlantic from the Last Glacial Maximum into future climate projections simulated by CMIP5/PMIP3. Climate Past 14, 1377–1390. doi: 10.5194/cp-14-1377-2018
Caniaux G., Giordani H., Redelsperger J.-L., Guichard F., Key E., Wade M. (2011). Coupling between the Atlantic cold tongue and the West African monsoon in boreal spring and summer. J. Geophys. Res. 116, 1–17. doi: 10.1029/2010JC006570
Deppenmeier A.-L., Haarsma R. J., Hazeleger W. (2016). The Bjerknes feedback in the tropical Atlantic in CMIP5 models. Climate Dyn. 47, 2691–2707. doi: 10.1007/s00382-016-2992-z.
Dickson A. G. (1990). Standard potential of the reaction: AgCl(s) + 12H2(g) = Ag(s) + HCl(aq), and and the standard acidity constant of the ion HSO4– in synthetic sea water from 273.15 to 318.15 K. J. Chem. Thermodyn. 22, 113–127. doi: 10.1016/0021-9614(90)90074-Z
Dickson A. G., Millero F. J. (1987). A comparison of the equilibrium constants for the dissociation of carbonic acid in seawater media. Deep Sea Res. 34, 1733–1743. doi: 10.1016/0198-0149(87)90021-5.
Doney S. C., Fabry V. J., Feely R. A., Kleypas J. A. (2009). Ocean Acidification: the other CO2 problem. Annu. Rev. Mar. Sci. 1, 169–192. doi: 10.1146/annurev.marine.010908.163834
Edmond J. M. (1970). High precision determination of titration alkalinity and total carbon dioxide content of seawater by potentiometric titration. Deep Sea Res. 17, 737–750. doi: 10.1016/0011-7471(70)90038-0
Enfield D. B., Mestas A. M., Mayer D. A., Cid-Serrano L. (1999). How ubiquitous is the dipole relationship in tropical Atlantic sea surface temperatures? J. Geophys. Res. 104, 7841–7848. doi: 10.1029/1998JC900109.
Fassbender A. J., Sabine C. L., Palevsky H. I. (2017). Nonuniform ocean acidification and attenuation of the ocean carbon sink. Geophys. Res. Lett. 44, 8404–8413. doi: 10.1002/2017GL074389
Gonzalez-Davila M., Santana-Casiano J. M. (2023). Long-term trends of pH and inorganic carbon in the Eastern North Atlantic: the ESTOC site. Front. Mar. Sci. 10, 1236214. doi: 10.3389/fmars.2023.1236214.
Hood E. M., Merlivat L. (2001). Annual to interannual variations of fCO2 in the northwestern Mediterranean Sea: Results from hourly measurements made by CARIOCA buoys 1995-1997. J. Mar. Res. 59, 113–131. doi: 10.1357/002224001321237399.
Hood E. M., Wanninkhof R., Merlivat L. (2001). Short timescale variations of fCO2 in a North Atlantic warm-core eddy: Results from the Gas-Ex 98 carbon interface ocean atmosphere (CARIOCA) buoy data. J. Geophys. Res. 106, 2561–2572. doi: 10.1029/1999JC000278.
Illig S., Bachèlery M.-L. (2024). The 2021 Atlantic Niño and Benguela Niño Events: external forcings and air–sea interactions. Climate Dyn. 62, 679–702. doi: 10.1007/s00382-023-06934-0
Kalnay E., Kanamitsu M., Kistler R., Collins W., Deaven D., Gandin L., et al. (1996). The NCEP/NCAR 40-year reanalysis project. Bull. Am. Meteorol. Soc. 77, 437–471. doi: 10.1175/1520-0477(1996)072.0.CO;2.
Koffi U., Lefèvre N., Kouadio G., Boutin J. (2010). Surface CO2 parameters and air-sea CO2 flux distribution in the eastern equatorial Atlantic Ocean. J. Mar. Syst. 82, 135–144. doi: 10.1016/j.jmarsys.2010.04.010.
Koseki S., Tjiputra J., Fransner F., Crespo L. R., Keenlyside N. S. (2023). Disentangling the impact of Atlantic Niño on sea-air CO2 flux. Nat. Commun. 14, 3649. doi: 10.1038/s41467-023-38718-9
Lan X., Dlugokencky E. J., Mund J. W., Crotwell A. M., Crotwell M. J., Moglia E., et al. (2022). Atmospheric Carbon Dioxide Dry Air Mole Fractions from the NOAA GML Carbon Cycle Cooperative Global Air Sampling Network 1968-2021, Version: 2022-11-21. (NOAA, USA). doi: 10.15138/wkgj-f15215
Lauvset S. K., Gruber N. (2014). Long-term trends in surface ocean pH in the North Atlantic. Mar. Chem. 162, 71–76. doi: 10.1016/j.marchem.2014.03.009.
Lauvset S. K., Gruber N., Landschützer P., Olsen A., Tjiputra J. (2015). Trends and drivers in global surface ocean pH over the past 3 decades. Biogeosciences 12, 1285–1298. doi: 10.5194/bg-12-1285-2015
Lee K., Kim T.-W., Byrne R. H., Millero F. J., Feely R. A., Liu Y.-M. (2010). The universal ratio of boron to chlorinity for the North Pacific and North Atlantic oceans. Geochim. Cosmochim. Acta 74, 1801–1811. doi: 10.1016/j.gca.2009.12.027
Lefèvre N., Guillot A., Beaumont L., Danguy T. (2008). Variability of fCO2 in the Eastern Tropical Atlantic from a moored buoy. J. Geophys. Res. 113, C01015. doi: 10.1029/2007JC004146
Lefèvre N., Mejia C., Khvorostyanov D., Beaumont L., Koffi U. (2021). Ocean circulation drives the variability of the carbon system in the eastern tropical Atlantic. Oceans 2, 126–148. doi: 10.3390/oceans2010008.
Lefèvre N., Veleda D., Araujo M., Caniaux G. (2016). Variability and trends of carbon parameters at a time series in the eastern tropical Atlantic. Tellus B 68, 1–16. doi: 10.3402/tellusb.v3468.30305
Liu C., Liao X., Qiu J., Yang Y., Feng X., Allan R. P., et al. (2020). Observed variability of intertropical convergence zone over 1998—2018. Environ. Res. Lett. 15, 104011. doi: 10.1088/1748-9326/aba033.
Li X., Tan W., Hu Z. Z., Johnson N. C. (2023). Evolution and Prediction of Two Extremely Strong Atlantic Niños in 2019–2021: Impact of Benguela Warming. Geophysical Res Letters 50, e2023GL104215
Lübbecke J. F., Burls N. J., Reason C. J., McPhaden M. J. (2014). Variability in the South Atlantic anticyclone and the Atlantic Niño mode. J. Climate 27, 8135–8150. doi: 10.1175/JCLI-D-14-00202.1
Lübbecke J. F., McPhaden M. J. (2017). Symmetry of the Atlantic Niño mode. Geophys. Res. Lett. 44, 965–973. doi: 10.1002/2016GL071829
Mehrbach C., Culberson C. H., Hawley J. E., Pytkowicz R. M. (1973). Measurement of the apparent dissociation constants of carbonic acid in seawater at atmospheric pressure. Limnol. Oceanogr. 18, 897–907. doi: 10.4319/lo.1973.18.6.0897.
Muller-Karger F. E., Astor Y. M., Benitez-Nelson C. R., Buck K. N., Fanning K. A., Lorenzoni L., et al. (2019). The scientific legacy of the CARIACO ocean time-series program. Annu. Rev. Mar. Sci. 11, 413–437. doi: 10.1146/annurev-marine-010318-095150
Newton J. A., Feely R. A., Jewett E. B., Williamson P., Mathis J. T. (2015). Global Ocean Acidification Observing Network: Requirements and Governance Plan. 2nd ed. (USA: GOA-ON). Available at: http://www.goa-on.org/docs/GOA-ON_plan_print.pdf.
Olafsson J., Olafsdottir S. R., Benoit-Cattin A., Danielsen M., Arnason T. S., Takahashi T. (2009). Rate of Icealnd Sea acidification from time series measurements. Biogeosciences 6, 2661–2668. doi: 10.5194/bg-6-2661-2009.
Orr J. C., Epitalon J.-M., Dickson A. G., Gattuso J.-P. (2018). Routine uncertainty propagation for the marine carbon dioxide system. Mar. Chem. 207, 84–107. doi: 10.1016/j.marchem.2018.10.006
Pérez V., Fernández E., Marañon E., Serret P., Varela R., Bode A., et al. (2005). Latitudinal distribution of microbial plankton abundance, production, and respiration in the Equatorial Atlantic in autumn 2000. Deep-Sea Res. I 52, 861–880. doi: 10.1016/j.dsr.2005.01.002.
Perez F. F., Fraga F. (1987). Association constant of fluoride and hydrogen ions in seawater. Mar. Chem. 21, 161–168. doi: 10.1016/0304-4203(87)90036-3
Radenac M. H., Jouanno J., Tchamabi C. C., Awo M., Bourlès B., Arnault S., et al. (2020). Physical drivers of the nitrate seasonal variability in the Atlantic cold tongue. Biogeosciences 17, 529–545. doi: 10.5194/bg-17-529-2020
Richter I., Tokinaga H., Okumura Y. M. (2022). The extraordinary equatorial Atlantic warming in late 2019. Geophys. Res. Lett. 49, e2021GL095918. doi: 10.1029/2021GL095918
Sharp J. D., Pierrot D., Humphreys M. P., Epitalon J.-M., Orr J. C., Lewis E. R., et al. (2021). CO2SYSv3 for MATLAB. doi: 10.5281/ZENODO.7552554.:Zenodo
Sutton A. J., Battisti R., Carter B., Evans W., Newton J., Alin S., et al. (2022). Advancing best practices for assessing trends of ocean acidification time series. Front. Mar. Sci. 9. doi: 10.3389/fmars.2022.1045667
Sutton A. J., Feely R. A., Maenner-Jones S., Musielwicz S., Osborne J., Dietrich C., et al. (2019). Autonomous seawater pCO2 and pH time series from 40 surface buoys and the emergence of anthropogenic trends. Earth Syst. Sci. Data 11, 421–439. doi: 10.5194/essd-11-421-2019
Sutton A. J., Feely R. A., Sabine C. L., McPhaden M. J., Takahashi T., Chavez F. P., et al. (2014). Natural variability and anthropogenic change in equatorial Pacific surface ocean pCO2 and pH. Global Biogeochem. Cycles 28, 131–145. doi: 10.1002/2013GB004679
Sutton A. J., Wanninkhof R., Sabine C. L., Feely R. A., Cronin M. F., Weller R. A. (2017). Variability and trends in surface seawater pCO2 and CO2 flux in the Pacific Ocean. Geophys. Res. Lett. 44, 5627–5636. doi: 10.1002/2017GL073814
Takahashi T., Olafsson J., Goddard J. G., Chipman D. W. (1993). Seasonal variation of CO2 and nutrients in the high-latitude surface oceans: A comparative study. Global Biogeochem. Cycles 7, 843–878. doi: 10.1029/93GB02263.
Tilbrook B., Jewett E. B., DeGrandpre M. D., Hernandez-Ayon J. M., Feely R. A., Gledhill D. K., et al. (2019). An enhanced ocean acidification observing network: from people to technology to data synthesis and information exchange. Front. Mar. Sci. 6. doi: 10.3389/fmars.2019.00337
Vallès-Casanova I., Lee S. K., Foltz G. R., Pelegrí J. L. (2020). On the spatiotemporal diversity of Atlantic Niño and associated rainfall variability over West Africa and South America. Geophys. Res. Lett. 47, e2020GL087108. doi: 10.1029/2020GL087108
Van Heuven S., Pierrot D., Rae J. W. B., Lewis E., Wallace D. W. R. (2011). MATLAB Program Developed for CO2 System Calculations (Oak Ridge, Tenn: Carbon dioxide information analysis center).
Wang X., Murtugudde R., Hackert E., Wang J., Beauchamp J. (2015). Seasonal to decadal variations of sea surface pCO2 and sea-air CO2 flux in the equatorial oceans over 1984–2013: A basin-scale comparison of the Pacific and Atlantic Oceans. Global Biogeochem. Cycles 29, 597–609. doi: 10.1002/2014GB005031
Wanninkhof R. (2014). Relationship between wind speed and gas exchange over the ocean revisited. Limnol. Oceanogr.: Methods 12, 351–362. doi: 10.4319/lom.2014.12.351
Weiss R. F. (1974). CO2 in water and seawater: the solubility of a non-ideal gas. Mar. Chem. 2, 203–215. doi: 10.1016/0304-4203(74)90015-2.
Xie S.-P., Carton J. A. (2004). Tropical Atlantic variability: Patterns, mechanisms, and impacts. Earth’s Clim.: Ocean Atmos. Interact. Geophys. Monogr. 147, 121–142. doi: 10.1029/GM147
Keywords: acidification, fugacity of CO2, carbon cycle, tropical Southern Atlantic index, PIRATA mooring
Citation: Lefèvre N, Veleda D and Beaumont L (2024) Trends and drivers of CO2 parameters, from 2006 to 2021, at a time-series station in the Eastern Tropical Atlantic (6°S, 10°W). Front. Mar. Sci. 11:1299071. doi: 10.3389/fmars.2024.1299071
Received: 22 September 2023; Accepted: 05 February 2024;
Published: 19 February 2024.
Edited by:
Xianghui Guo, Xiamen University, ChinaReviewed by:
Tobias Steinhoff, Helmholtz Association of German Research Centres (HZ), GermanyMaribel I. García-Ibáñez, Spanish Institute of Oceanography (IEO), Spain
Copyright © 2024 Lefèvre, Veleda and Beaumont. This is an open-access article distributed under the terms of the Creative Commons Attribution License (CC BY). The use, distribution or reproduction in other forums is permitted, provided the original author(s) and the copyright owner(s) are credited and that the original publication in this journal is cited, in accordance with accepted academic practice. No use, distribution or reproduction is permitted which does not comply with these terms.
*Correspondence: Nathalie Lefèvre, nathalie.lefevre@locean.ipsl.fr