Modulation of regional carbon uptake by AMOC and alkalinity changes in the subpolar North Atlantic under a warming climate
 Qi Zhang
 Takamitsu Ito
 Annalisa Bracco
- Earth and Atmospheric Sciences, Georgia Institute of Technology, Atlanta, GA, United States
The slowdown of the Atlantic Meridional Overturning Circulation (AMOC) and associated consequences on ocean carbon uptake could have large implications for the Earth's climate system and its global carbon cycle. This study analyzes ten Earth System Models from the Coupled Model Intercomparison Project Phase 6 (CMIP6) and reveals that the regional carbon uptake in the subpolar North Atlantic under a high CO2 emission scenario moderately correlates with the decline in AMOC at 40°N. AMOC transports warm and salty subtropical waters to the subpolar regions. Models with stronger AMOC slowdown generally exhibit weaker surface warming and larger decline of surface salinity and alkalinity. We consider two plausible mechanisms linking the AMOC slowdown to the decline of regional CO2 uptake: the reduction in surface alkalinity and diminished subduction. The decline of surface salinity and alkalinity reduces the ocean's capacity to buffer acids leading to a reduced CO2 uptake. This important contribution is unique to the North Atlantic. Diminished convective mixing and subduction of surface water can further decrease the downward transport of anthropogenic carbon, as also shown in previous research. The centennial trends of pCO2 are decomposed into four components driven by temperature, salinity, alkalinity and dissolved inorganic carbon, revealing that alkalinity and dissolved inorganic carbon are both significant contributors. The alkalinity-driven pCO2 essentially follows surface salinity, establishing the linkage between AMOC slowdown and alkalinity decline. Our results indicate that alkalinity changes are important for the interplay between AMOC and the regional carbon sequestration ability across the late 20th and the entirety of the 21st century in the subpolar North Atlantic.
1 Introduction
The Atlantic Meridional Overturning Circulation (AMOC) plays a significant role in the climate system, by transporting oceanic heat northward from the South Atlantic to the North Atlantic (Trenberth et al., 2019; Weijer et al., 2020). It also transports heat and carbon from the surface to the deep ocean in the North Atlantic and helps redistribute ocean heat vertically (Kostov et al., 2014; Buckley and Marshall, 2016; Bronselaer and Zanna, 2020). Its contribution is key to the ocean’s ability to absorb the excess heat and carbon from greenhouse gas emissions and its evolution will be fundamental to the overall response of the climate system moving forward (Bellomo et al., 2021; Schwinger et al., 2022). The analysis of both observational and modeling datasets suggests that AMOC may have weakened after the 1980s (Menary et al., 2020; Zhu et al., 2023), and models indicate that it will further decline in the future (Drijfhout, 2015; Caesar et al., 2018; Latif et al., 2019; Liu et al., 2020). The AMOC weakening impacts regional and global climate by changing surface temperature, precipitation patterns and teleconnections (Bellomo et al., 2021; Orihuela-Pinto et al., 2022). While a reduction in the AMOC may have mitigated the rate of historical global warming (Bonnet et al., 2021), it also modifies the distribution of heat within the climate system, potentially retaining excess heat in the tropical South Atlantic (Orihuela-Pinto et al., 2022). This underscores the intricate role of the AMOC in the Earth’s climate system and its potential influence on climate tipping points. Under greenhouse gas (GHG) forcing, the weakening of the AMOC can be caused by a combination of surface warming and increasing freshwater fluxes at high latitudes, both contributing towards increasing stratification in the upper ocean (Thorpe et al., 2001; Stouffer et al., 2006; Marshall et al., 2014; Buckley and Marshall, 2016; Yang et al., 2016) which can suppress deep convection (Zhang, 2010). In observational reanalyses, however, the trend in AMOC was positive between the 1960s and 1975 (Balmaseda et al., 2013) likely due to the increase in anthropogenic aerosol forcing which counteracted the effect of GHGs (Cai et al., 2006; Delworth and Dixon, 2006; Hassan et al., 2021; Robson et al., 2022). As a note of caution, the attribution of AMOC changes remains subject to intense scrutiny and conclusive statements are hard to make given the underestimation of decadal-scale variability by climate models (Yan et al., 2018) and the short time-span of the direct observational records (Buckley and Marshall, 2016).
Changes in sea surface temperature (SST) and sea surface salinity (SSS) in the North Atlantic are linked to fluctuations in AMOC (Deser et al., 2010; Estella-Perez et al., 2020). Carbon uptake, on the other hand, is primarily driven by the rate of increase in the atmospheric CO2 levels, thus depends on the trajectory of anthropogenic carbon emission. A significant fraction of anthropogenic CO2 emissions is absorbed by oceans, increasing the concentrations of dissolved inorganic carbon (DIC) and thus causing acidification (Perez et al., 2021; Jiang et al., 2023; Ma et al., 2023). The increase in DIC affects the ability of the ocean to continue absorbing CO2 from the atmosphere, as the ocean becomes more saturated with CO2 (Le Quéré et al., 2007; Keppler et al., 2023). AMOC contributes to the vertical transport of DIC from the surface to interior ocean, which modulates the air-sea difference in partial pressure of CO2 (pCO2) (Riebesell et al., 2009; Brix et al., 2013; Tjiputra et al., 2014; Goris et al., 2018). Goris et al. (2018) found that simulated anthropogenic carbon uptake in the North Atlantic is significantly correlated to seasonal pCO2 amplitude, reflecting the role of vertical DIC transport and deep mixing (DeGrandpre et al., 2006) in the sequestration of anthropogenic carbon. Using this correlation, they were able to constrain the regional carbon uptake from the 1990s to 2100. However, the application of this approach to constrain future North Atlantic carbon uptake included large uncertainties by 2100 (Goris et al., 2023). Using model selection based on observational constraints of AMOC, previous studies narrow down the projected spread in ocean carbon uptake by CMIP5/CMIP6 models for the 21st century, leading to an increased and more precise projection of the global ocean’s carbon uptake and acidification over the 21st century (Wang et al., 2016; Terhaar et al., 2022).
There are other factors that modulate the surface ocean pCO2 and regional carbon uptake such as SST and alkalinity (ALK). Earlier work suggested that the weakening of AMOC can cause a decrease in ocean carbon uptake due to the reduced biological activity and altered ventilation (Schmittner and Galbraith, 2008; Nielsen et al., 2019; Katavouta and Williams, 2021). Moreover, alkalinity’s role in CO2 uptake and its contribution to the long-term buffering capacity of oceans have been highlighted in recent studies (Takahashi et al., 2014; Middelburg et al., 2020; Chikamoto et al., 2023). A decrease in ocean ALK negatively impacts the ocean’s capacity to absorb CO2, thereby affecting its role as a carbon sink. The reduction of surface ALK accelerates the acidification of seawater, which in turn affects the marine ecosystem. The amount of CO2 uptake reduction contributed by the above processes, however, remains highly uncertain.
In this study, we investigate the sources of this carbon uptake uncertainty focusing on the subpolar North Atlantic using simulations from the Coupled Model Intercomparison Project Phase 6 (CMIP6). Model outputs for various physical and biogeochemical variables are examined in their relationships with AMOC in the historical period as well as in future scenarios. Regarding AMOC, several studies examined how its representation in IPCC-class models has evolved across successive model generations (Jackson et al., 2020; Roberts et al., 2020; Weijer et al., 2020). On average, the CMIP6 multi-model ensemble exhibits a stronger AMOC decline after the 1980s than Phase 5 of CMIP (CMIP5) in all future CO2 emission scenarios (Menary et al., 2020; Weijer et al., 2020). The decline between 1980 and 2015 compares reasonably well with observations of the Rapid Climate Change-Meridional Overturning Circulation (RAPID) array, the Overturning in the Subpolar North Atlantic Program (OSNAP), and the South Atlantic MOC Basin-wide Array (SAMBA), notwithstanding their limited time coverage (Frajka-Williams et al., 2019; Lozier et al., 2019; Smeed et al., 2019).
First, we provide an overview of the trends in AMOC, ALK, and ocean carbon uptake in the subpolar North Atlantic region, and then we discuss how they relate to physical variables from the late 20th century to the end of the 21st century. An essential aspect of our investigation involves probing the relationships between the factors that control the representation of carbon uptake and the weakening of the AMOC and ALK in ten CMIP6 Earth System Models under a high CO2 emissions scenario (the Shared Socio-economic Pathways SSP5-8.5). Additionally, we seek to identify key processes and metrics that may effectively reduce uncertainty in future model projections. By exploring the relationships among AMOC trends, ALK, ocean carbon uptake, and various other physical variables, our study provides insights that are crucial for improving projections of the future global climate system and for identifying key variables to monitor to reduce uncertainty in carbon cycle feedbacks and their role in shaping the transient climate response to cumulative carbon emissions (TCRE).
2 Materials and methods
2.1 The ten CMIP6 Earth System Models and variables analyzed
We analyze four CMIP6 Earth System Models in the historical scenario (Eyring et al., 2016) and in the high CO2 emission scenario, SSP5-8.5 (Wilbanks and Ebi, 2013; Riahi et al., 2017). These ten Earth System Models are listed in Table 1 and includes CESM2 (Danabasoglu et al., 2020), NorESM2-LM (Seland et al., 2020), ACCESS-ESM1-5 (Ziehn et al., 2020), MPI-ESM1-2-LR (Mauritsen et al., 2019), CMCC-ESM2 (Cherchi et al., 2019), CNRM-ESM2-1 (Séférian et al., 2019), UKESM1-0-LL (Sellar et al., 2019), MIROC-ES2L (Hajima et al., 2020), CanESM5 (Swart et al., 2019), and IPSL-CM6A-LR (Boucher et al., 2020). They have been selected for the availability of the physical and chemical variables (Table 2) necessary for our analysis under future scenarios. The climate model simulations are obtained via the Earth System Grid Federation (ESGF) archive of CMIP6 data (https://esgf-node.llnl.gov). The partial pressure of atmospheric CO2 is obtained from the input and forcing datasets for the Model Intercomparison Projects (input4MIPs, https://esgf-node.llnl.gov/search/input4mips/) in CMIP6 (Eyring et al., 2016; Meinshausen et al., 2017, 2020). The historical simulations cover the 1850 to 2014 period, and the future scenario simulation covers the period 2015 to 2100 with high radiative forcing under SSP5-8.5 (Meinshausen et al., 2020). Under the historical simulations, our analysis focuses on the period from 1950 to 2014. For all spatially-varying variables in Table 2, the time series are computed as the area-weighted means within the defined sector of the subpolar North Atlantic basin, which encompasses the area from 40°N to 65°N latitude and from 55°W to 15°W longitude (Figure 1).
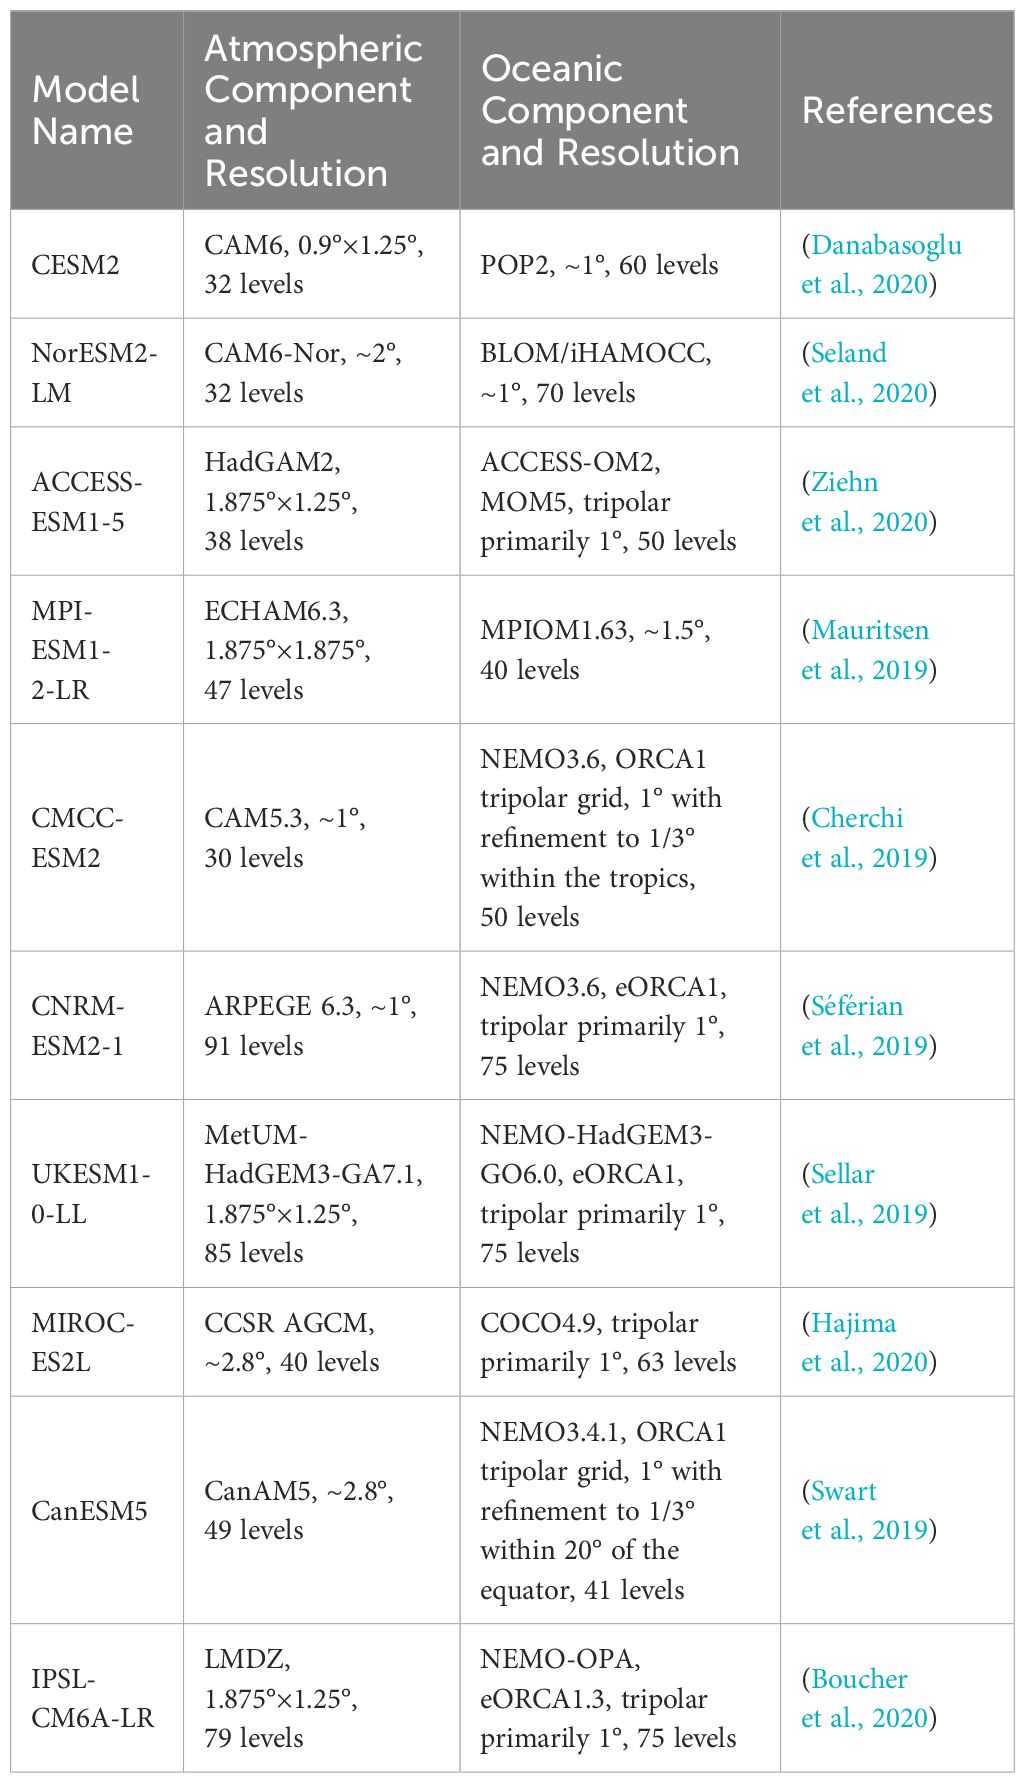
Table 1 Model components and resolution.
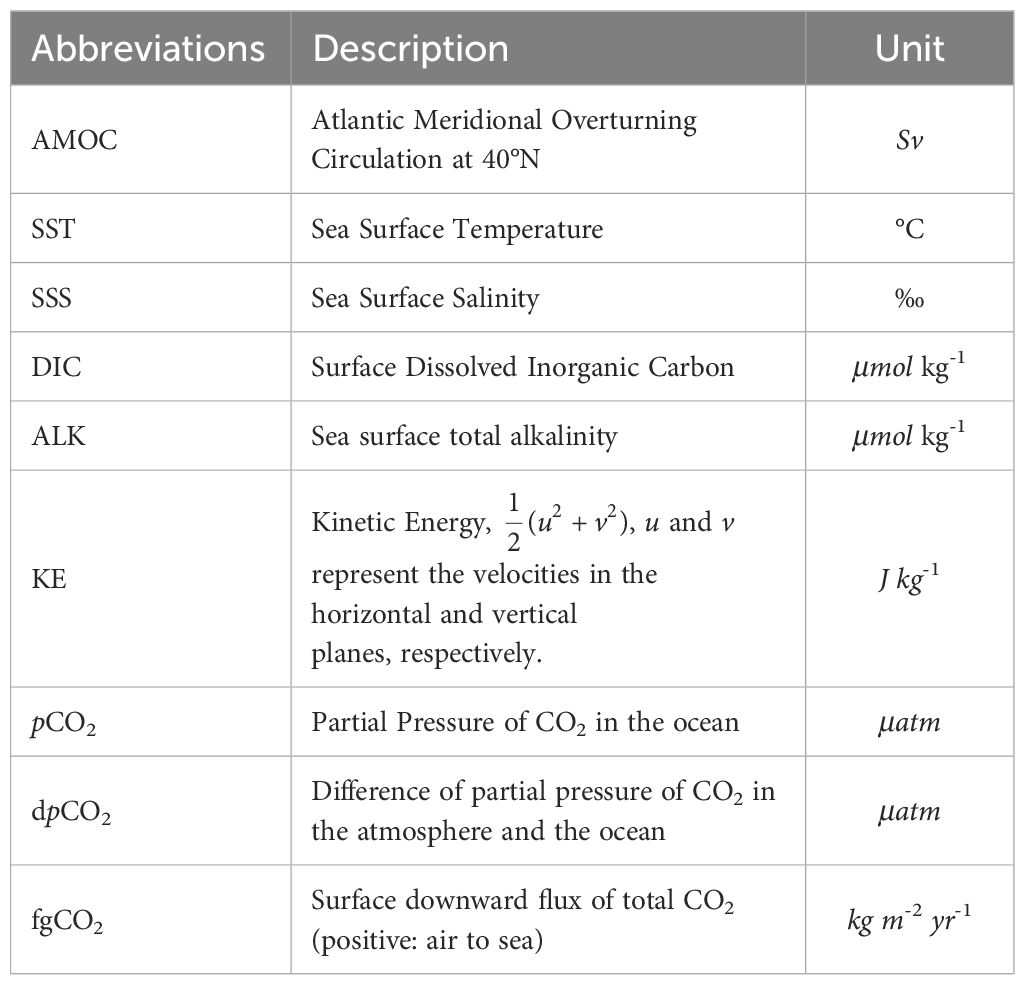
Table 2 Model variables and description.
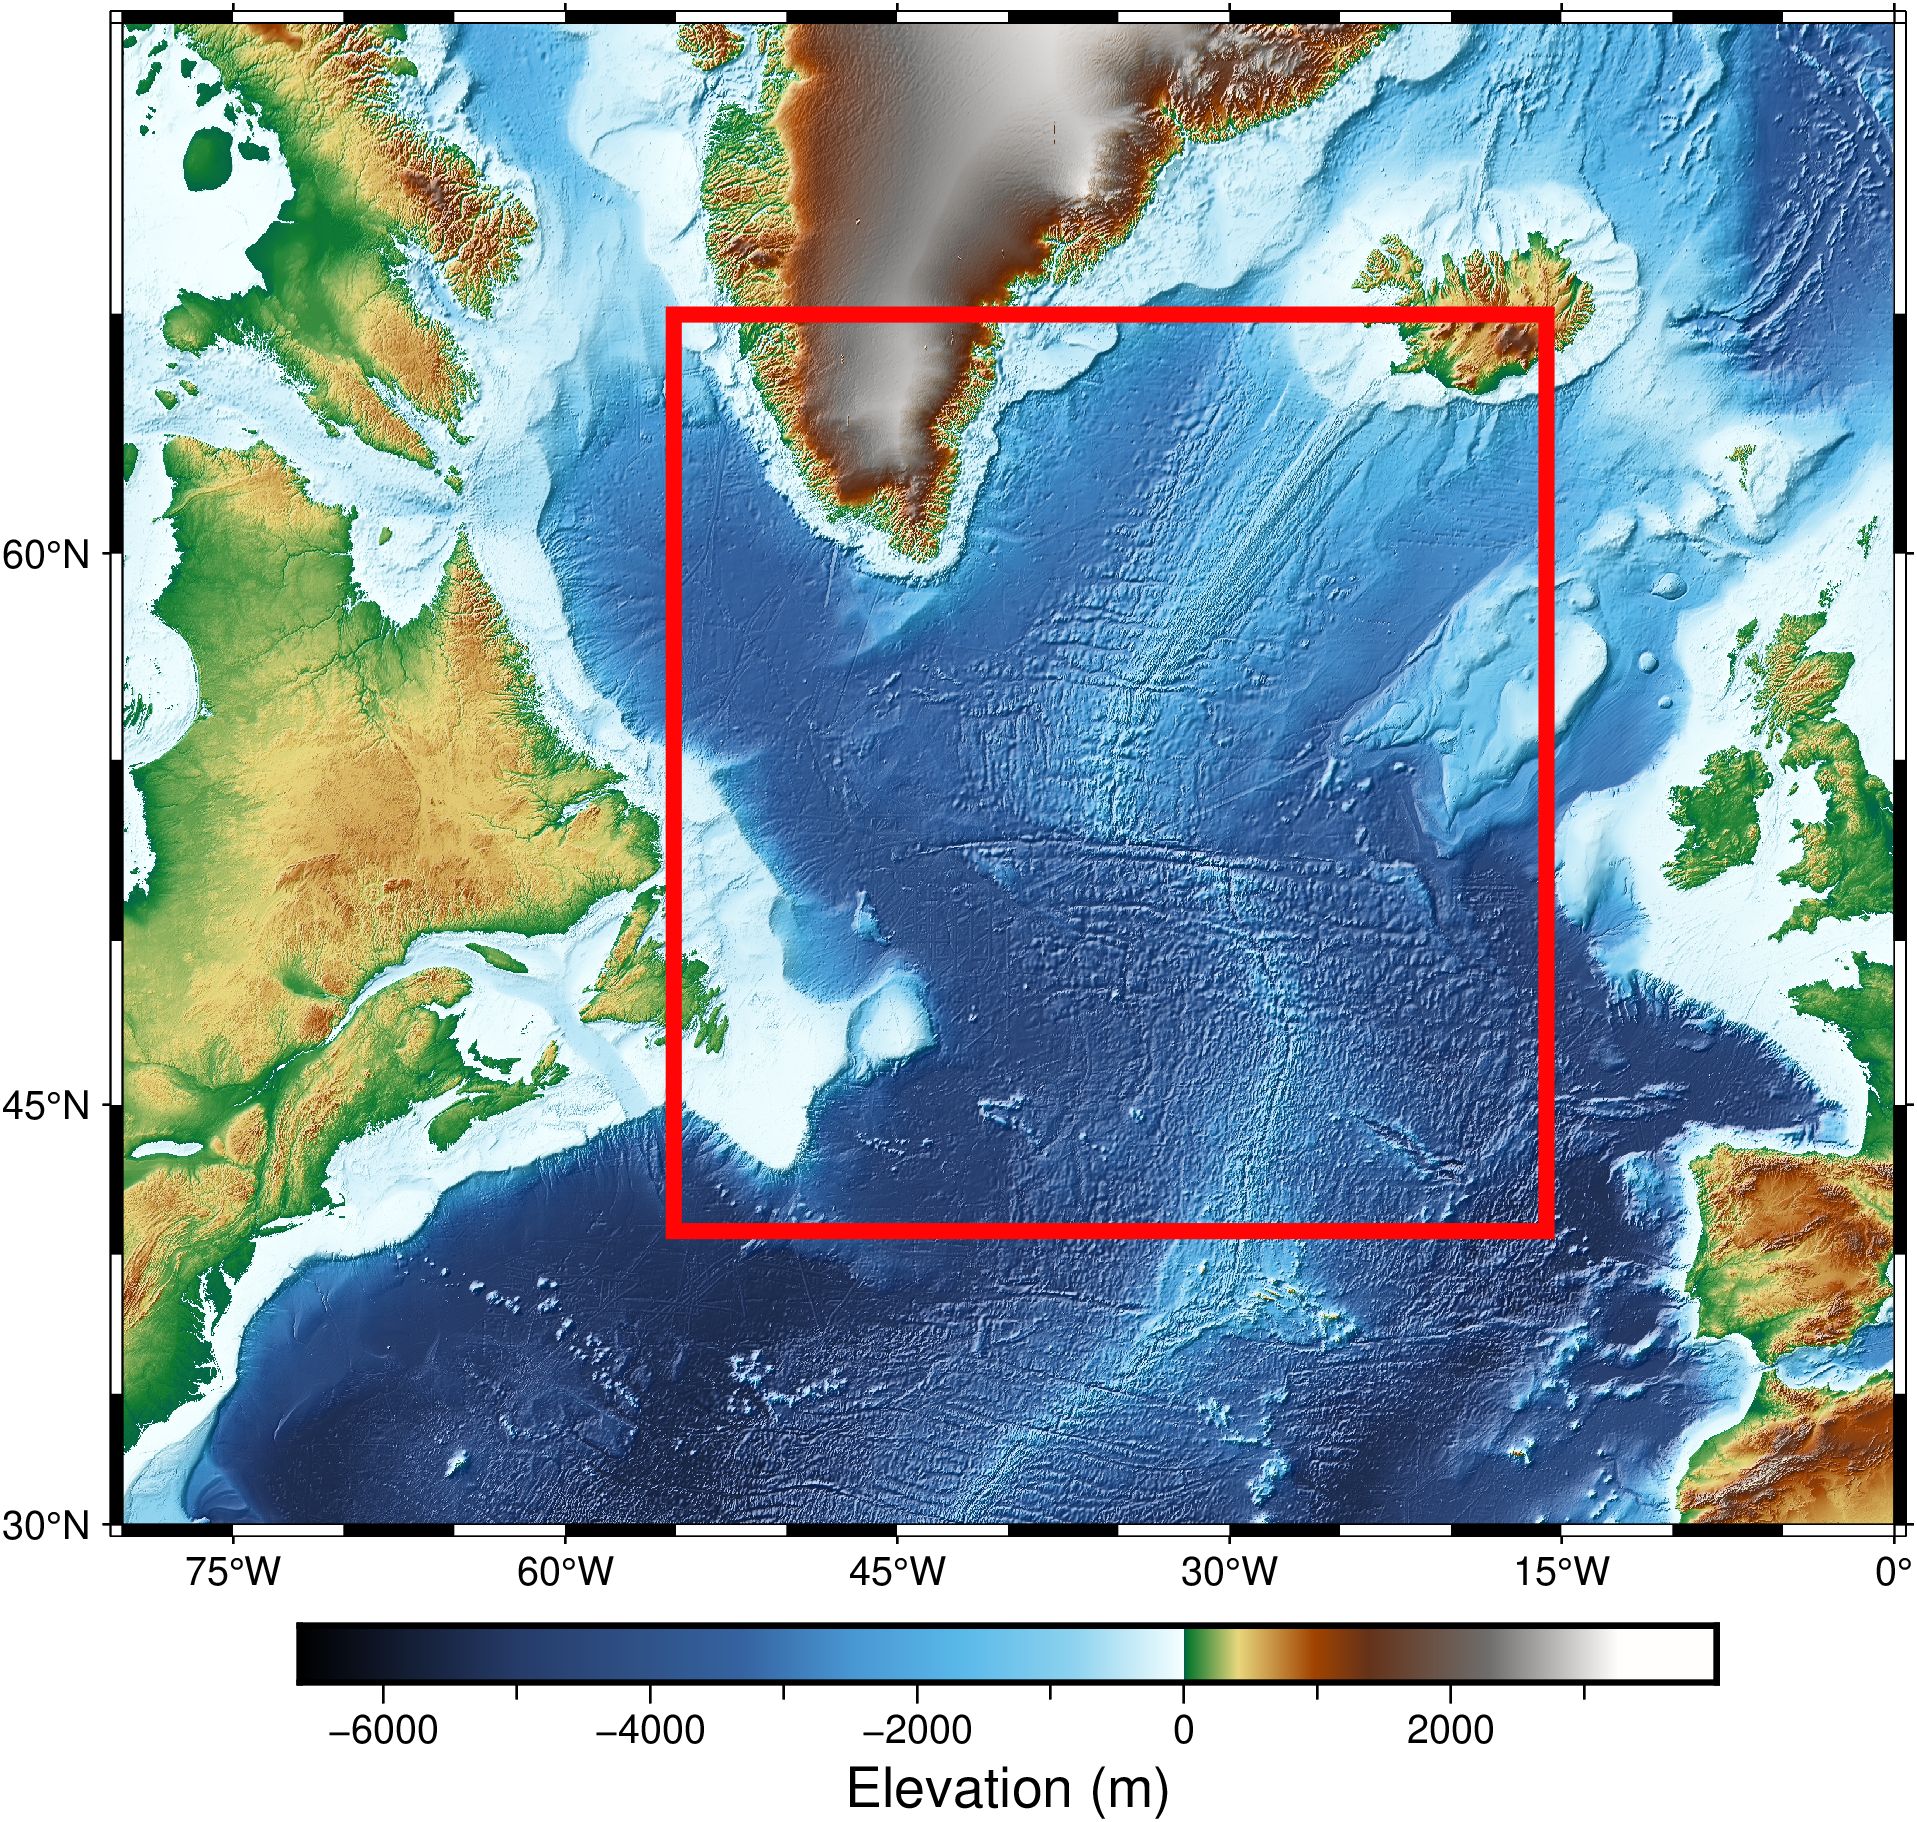
Figure 1 Map of the subpolar North Atlantic with major topographic features. The red box delimits the region where the analysis in this study is performed.
As an indicator of simulated AMOC intensity, we use the definition of maximum meridional overturning stream function at 40°N and analyze its evolution over time, as commonly done in modeling studies (Knight et al., 2005; Zhang, 2008). The choice of 40° N is based on the fact that variations in AMOC exhibit their highest anomalies near this latitude (Buckley and Marshall, 2016). We verified that this is indeed the case in all models considered (Supplementary Figure 1). Kinetic Energy is calculated based on velocities in the horizontal and vertical planes (Table 2).
2.2 pCO2 decomposition
Variations in the ocean surface pCO2 can be described as a combined effect of alterations in sea surface DIC, and alkalinity, as well as changes in SST and SSS (Sarmiento and Gruber, 2006), as follows:
where δ represents change over time and X are partial derivative of surface ocean pCO2 with respect to X. SST is sea surface temperature (°C), SSS is sea surface salinity (‰), DIC and ALK are ocean surface DIC and alkalinity (µmol kg-1), respectively. This decomposition can be applied to understand the trends of surface ocean pCO2. The temporal change of air-sea CO2 flux critically depends on the air-sea difference in pCO2. There would be a decline (increase) in air-sea CO2 flux if ocean pCO2 increases faster (slower) than atmospheric pCO2. This analysis uses the CO2SYS program (Lewis and Wallace, 1998) to calculate each term in Equations 1, 2. The partial derivatives are calculated by making finite perturbations, and they quantify the sensitivity of ocean pCO2 to SST, SSS, DIC or ALK, while the terms are the contributions of SST, SSS, DIC or ALK to pCO2 changes.
In order to emphasize the salinity impact on ALK and DIC, we separate ALK and DIC into salinity normalized (sALK and sDIC, affected by dynamics, biology and air-sea exchange), and diluted parts (dALK and dDIC, affected by freshwater) (Brix et al., 2013; Chikamoto and DiNezio, 2021; Chikamoto et al., 2023):
where 35 is the standard salinity value which normalizes DIC and ALK. Equation 2 includes three terms multiplied by δSSS. The first term is the direct effect of salinity, and the second and third terms are the dilution components for DIC and ALK. By design, these two terms tend to cancel out each other. In this study we pay attention to sALK and dALK terms to assess their relative importance in driving pCO2 changes.
3 Results
3.1 The CO2 uptake and AMOC change in the subpolar North Atlantic
We investigate the difference between the CO2 flux (positive from air to sea) among models by considering the spatial patterns of two 31-year periods: 1970-2000 within the historical time and 2070-2100 in the SSP5-8.5 scenario as representative for a high emission future (Figure 2). In most models, the CO2 flux shows a decrease in the western part of the SPNA while increasing in the eastern and northern parts (Figure 2). One primary factor is the weakening of the AMOC (Figure 3), which has been linked to strengthening stratification and shoaling mixing between density layers, both observed in recent decades and predicted for the future (Kim et al., 2023). There are, however, significant inter-model differences in the pattern of air-sea CO2 flux change, some of which may be driven by the thermodynamic change due to the different SST responses to climate warming and AMOC slowdown. In the eastern and northern parts of SPNA, there are patches of cooling known as the North Atlantic Warming Hole (NAWH) (Drijfhout et al., 2012; Rahmstorf et al., 2015; Gervais et al., 2018; Menary et al., 2018; Keil et al., 2020; Oudar et al., 2020; Bellomo et al., 2021). AMOC weakening changes the relative proportions of warm subtropical waters and cold subpolar waters being transported into the eastern and western SPNA respectively. The weakening Labrador Current and the shift of the Gulf Stream result in colder and fresher waters south of Greenland due to the reduced transport of warm, salty water from the tropics and much lower SSS and higher sea surface height in the subpolar region (Claret et al., 2018; Bellomo et al., 2021; Gonçalves Neto et al., 2021). This alteration in water mass distribution can lead to significant CO2 uptake changes.
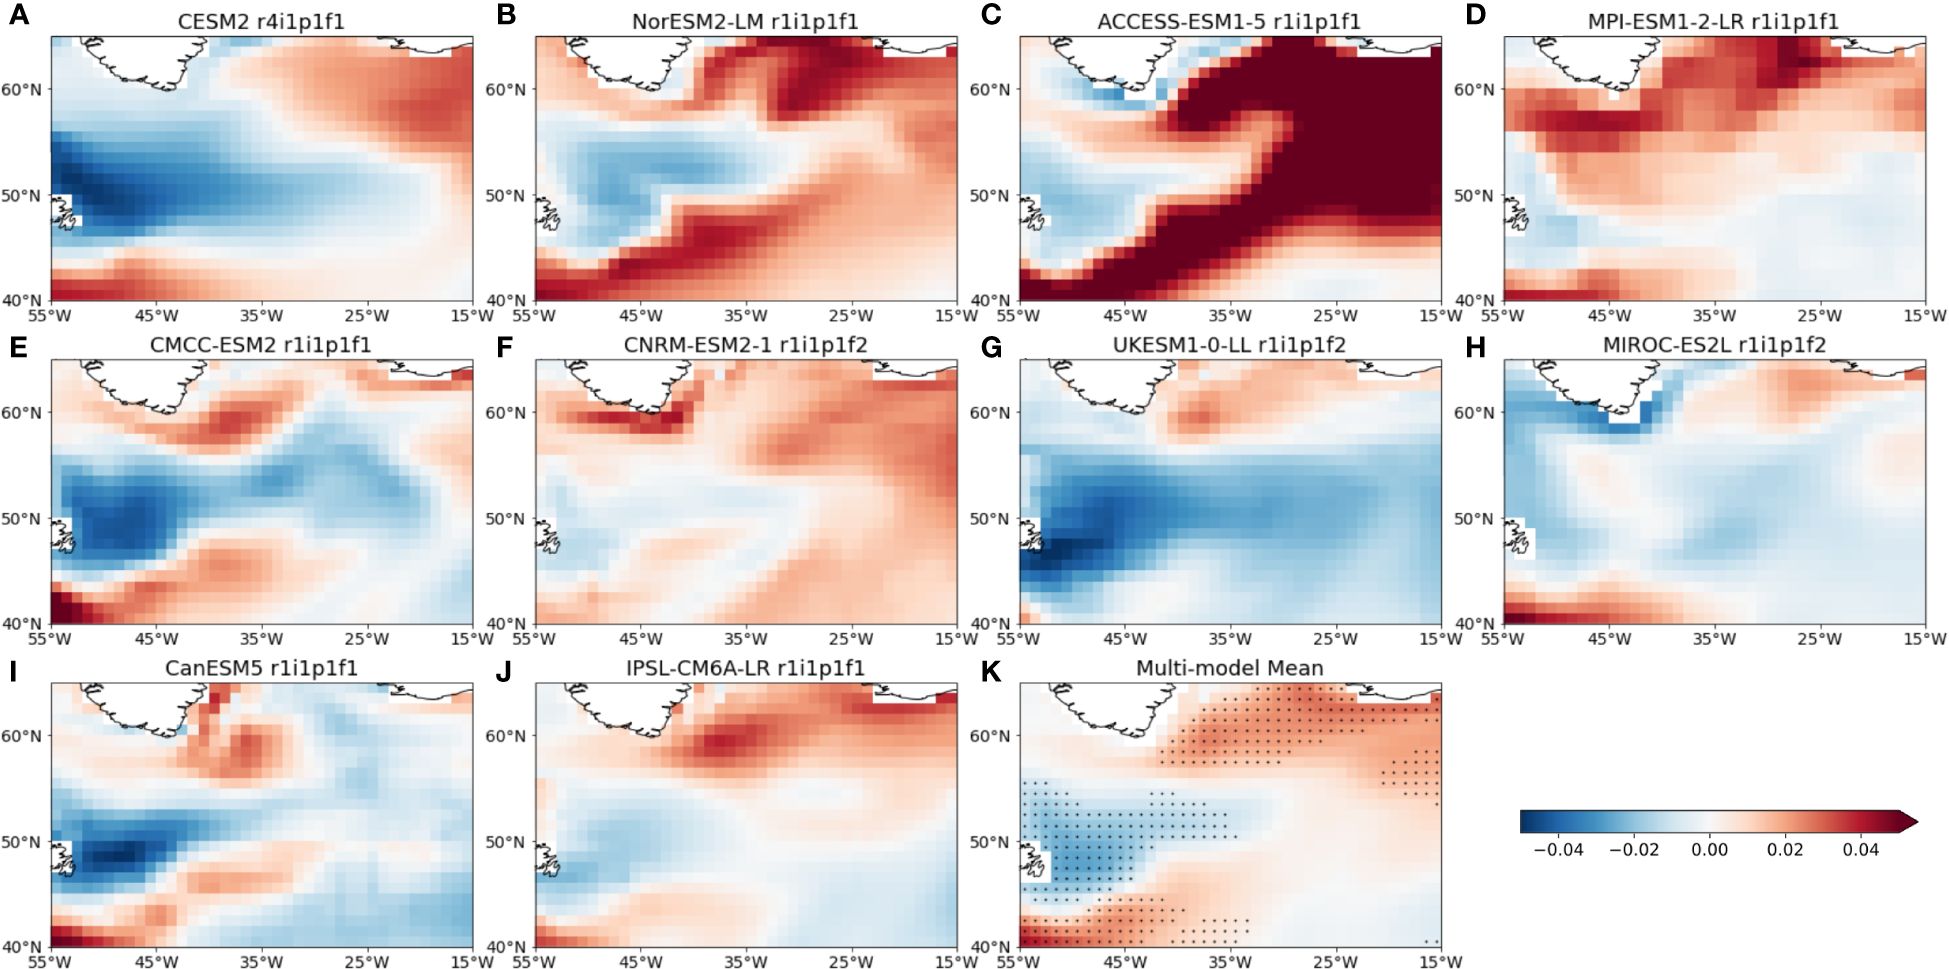
Figure 2 Maps of fgCO2 (kg m-2 yr-1) difference between 31-year averages over 2070-2100 in the SSP585 scenario and that of 1970-2000 in the historical run for ten models (A-J), and in the multi-model mean (K) in the SPNA. In (K) dots indicate whenever changes in at least 8 out of the 10 models agree in the sign.
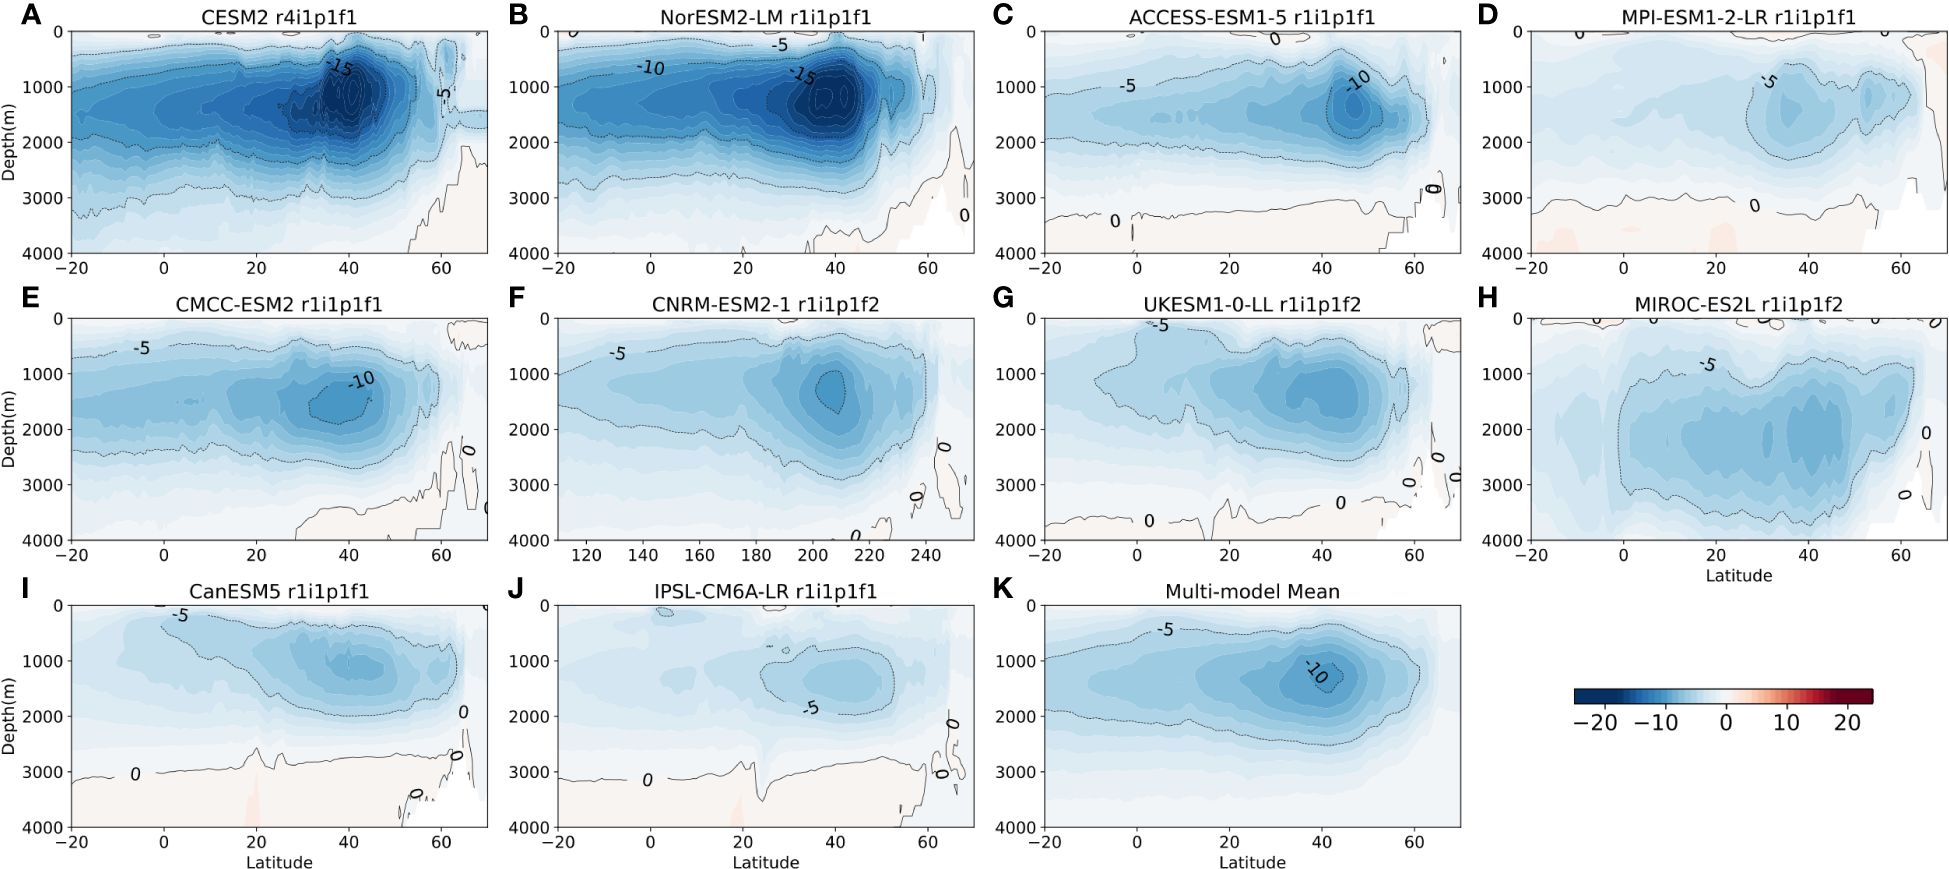
Figure 3 Maps of AMOC difference (in Sv) between 31-year averages over 2070-2100 in the SSP585 scenario and 1970-2000 in the historical runs for ten models (A-J) and the the multi-model mean (K), visualized as basin-wide zonal-and time-integrated stream function.
Figure 3 presents the differences in AMOC stream functions from the CMIP6 models. Here we provide a comparative analysis of the mean AMOC magnitude between two timeframes: the historical period of 1970-2000 and the projected period of 2070-2100 in SSP5-8.5. All models exhibit a weakening of the AMOC by the end of the 21st century. The magnitudes of AMOC decrease vary among the models, but broadly correlates with the initial AMOC strength (Supplementary Figure 1): models with a stronger AMOC in historical times show a more pronounced decrease in the projections, especially in CESM2 and NorESM2-LM (Figures 3A,B; Supplementary Figures 1A, B). While in models with a weak AMOC in the historical period, such as in IPSL-CM6A-LR (Supplementary Figure 1J), the reduction is moderate in the future (Figure 3J). The AMOC exhibits its maximum strength at around 40°N both during the historical period (1970-2000) (Supplementary Figure 1) and in the projected future period (2070-2100), and the greatest reduction in AMOC strength occurs at this latitude according to the model simulations (Figure 3). These findings about the AMOC trends in CMIP6 are consistent with the earlier study by Weijer et al. (2020).
3.2 Time series of physical and chemical variables
Temporal trajectories of the physical variables from the ten CMIP6 Earth System Models are displayed in Figure 4. Robust changes across all ten models in the high CO2 emission scenario include AMOC weakening, surface freshening, and increasing SST, DIC and sea surface pCO2 (Figures 4A–E, G). These changes can be attributed to the increasing atmospheric pCO2 and the greenhouse effect but the rates of warming and DIC increases are model-dependent. Surface DIC generally increases due to the absorption of anthropogenic CO2, but this is not the only factor controlling its growth. Warming can reduce the solubility of gases, leading to higher pCO2 at the sea surface. Additionally, increased ocean stratification can impact the circulation, contributing to AMOC weakening.
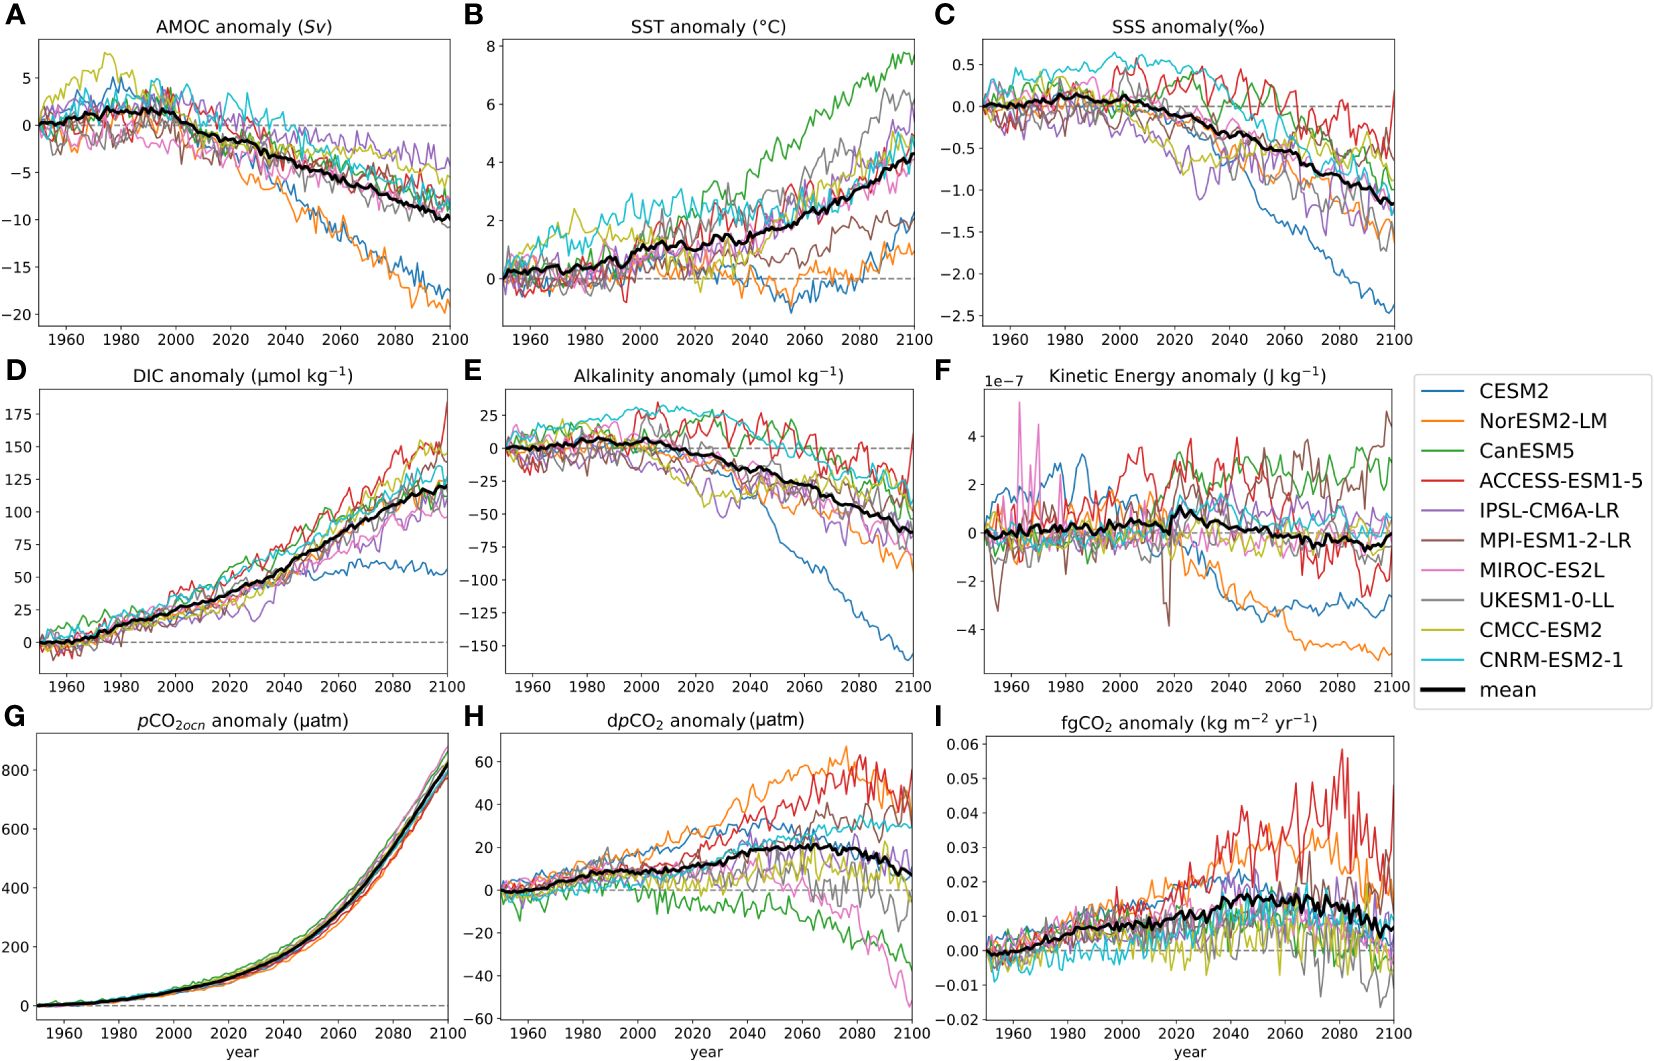
Figure 4 Annual time series of anomalies of physical and chemical variables in the SPNA. (A) AMOC anomaly at 40°N in units of Sv. (B) SST anomaly in °C. (C) SSS anomaly in units of ‰. (D) DIC anomaly in units of μmol kg-1. (E) ALK anomaly in units of μmol kg-1. (F) KE anomaly in units of J kg-1. (G) pCO2 anomaly in units of μatm. (H) dpCO2 anomaly in units of μatm. (I) fgCO2 anomaly in units of kg m-2 yr-1. The time series include two periods - the historical period (1950-2014) and the future scenario (2015-2100, SSP5-8.5). The colored lines represent each model while the thick black line represents the ten models ensemble average.
In terms of AMOC, all models but MIROC-ES2L show a moderate increase in AMOC strength in the ~1950-1980 period, likely due to the aerosol forcing (Menary et al., 2020), followed by a decrease after the 1980s (Figure 4A). In the multi-model mean sense, AMOC weakens by about 9 Sv by the end of the 21st century (Figure 4A). Surface freshening (salinity decrease) may be driven by the freshwater fluxes including precipitation, ice melt, and runoff as well as internal dynamics including changing transport of salty subtropical waters to the SPNA by the weakened AMOC. A significant decline of surface alkalinity (Figure 4E) is linked to the reduction in SSS and AMOC (Figures 4A, C) in all models. The reduction in alkalinity accelerates the acidification of the surface water and decrease the buffering capacity. In the SPNA, all models show some decline of surface alkalinity associated with freshening (Figures 4C, E). Under the warming climate, the reduction in AMOC transport and the stronger freshwater fluxes together act to decrease the surface alkalinity by freshening or dilution, which tends to increase surface ocean pCO2. On interannual and longer timescale, surface ocean pCO2 increases, following the rising atmospheric pCO2. All models exhibit increasing ocean pCO2 of about 800 µatm at the end of the 21st century in SSP5-8.5 (Figure 4G). Air-sea CO2 exchange adjusts surface ocean pCO2 to the atmospheric pCO2 with some lag as determined by the air-sea equilibration timescale. Carbonate chemistry dictates that the increase must be achieved by the combination of the four factors in Equation 2. The increase in surface ocean pCO2 induced by alkalinity decrease reduces the regional carbon sink by limiting the ocean pCO2 growth by the air-sea equilibration and resultant DIC increase. This effect is especially strong in models with significant freshening (SSS decline) which is mechanistically linked to the AMOC slowdown. The pattern of temporal changes in the air-sea pCO2 difference (dpCO2) generally matches that of air-sea CO2 flux (fgCO2) because dpCO2 drives fgCO2 (Figures 4H, I). Thus, any factor that increases the dpCO2 gradient can also increase the magnitude of fgCO2, assuming other conditions remain the same. The trends in fgCO2 are influenced by several factors beyond the dpCO2 due to the dependence of air-sea gas transfer on wind speed and seaice cover in polar regions. Hence, there are some small discrepancies between the trends and variability of fgCO2 and that of dpCO2 (Jing et al., 2022).
CESM2 and NorESM2-LM exhibit similar trends in terms of AMOC and SST (Figures 4A, B). The strong AMOC weakening (~18 Sv) in CESM2 and NorESM2-LM is associated with the formation of a strong NAWH by the end of 2050. However, despite their similar model components, trends in SSS, DIC, and alkalinity differ between CESM2 and NorESM2-LM. Those differences could be attributed to how each model simulates ocean biogeochemical processes, freshwater inputs, and atmospheric CO2 exchange dynamics (Figure 4). The less pronounced increase in DIC and the strong decrease in alkalinity in CESM2 might suggest a different representation of the freshwater fluxes, ocean circulation and mixing patterns, which can affect the regional carbon cycle. Even with the similar SST trends, the stronger freshening and alkalinity loss would weaken the regional carbon uptake, explaining the relatively weaker growth of surface simulated DIC and weaker carbon uptake (fgCO2) in CESM2 compared to NorESM2-LM (Figures 4B–E, I). Differences in precipitation, evaporation, river runoff, and ice melt could cause variations in SSS and consequently influence CO2 uptake and alkalinity levels. While CESM2 and NorESM2-LM exhibit similar AMOC and kinetic energy (KE) changes, there are indeed some minor differences in the evolution of kinetic energy (Figures 4A, F). Here, the KE is calculated as a measure of ocean transport strength in addition to AMOC intensity, and it includes other aspects of the ocean circulation system such as boundary currents (Irminger and Labrador Current), wind-driven subpolar gyre, as well as AMOC. The KE decrease in CESM2 is less pronounced after 2060s in comparison to NorESM2-LM indicating somewhat different circulation changes in the late 21st century. This could reflect the potential regional variations in freshwater fluxes and wind stress, and different parameterizations choices in the two models.
CanESM5 exhibits both the lowest dpCO2 trend for most of the 21st century, and the most significant SST rise (Figures 4B, H) thus reduced CO2 solubility. This model exhibits some reduction in fgCO2, though it is not the most substantial, and the fgCO2 decrease occurs in conjunction with an increase in KE in the projections (Figures 4F, I).
Conversely, ACCESS-ESM1-5 shows the most considerable increase in fgCO2, consistent with minimal projected change in SSS (Figures 4C, I). This model’s moderate AMOC attenuation (~7 Sv) and limited ocean freshening suggest that atmospheric pCO2 increase predominantly drives the ocean CO2 uptake with no opposing effects from alkalinity.
3.3 ALK contribution to pCO2 change
So far, our discussion focused on interpreting different evolution of physical and biogeochemical variables. Here we decompose ocean pCO2 and quantify the effect of SST, SSS, DIC and ALK on the change of dpCO2 with the purpose of quantitatively assessing different drivers of pCO2 increase on centennial timescale (Figure 5F). pCO2 decomposition indicates that the overall change in pCO2 can be expressed as the sum of four factors (SST, SSS, DIC, ALK) where each factor is multiplied by its respective sensitivity (Equations 1, 2). Figure 6A shows the trends in oceanic pCO2 over time in the SPNA, alongside contributions from various factors that influence pCO2 levels. The increasing trend in pCO2 signifies a growing partial pressure of CO2 in the ocean’s surface. ALK contributes to this increasing trend and, by the end of the 21st century, ALK becomes the most important contributor to pCO2 change in the multi-model mean sense. The influence of sALK is close to zero, suggesting that changes in salinity-normalized ALK alone do not account for the change in pCO2 trend. ALK affects pCO2 due to dilution effects from freshwater fluxes and the weakened ocean salinity transport. The SST contribution to the increasing pCO2 trend shows a moderate contribution by the warming-induced solubility decrease. The DIC contribution indicates that increases in DIC are driving pCO2 upward, as more CO2 is being added to the ocean. The SSS contribution is less significant but slightly negative, implying that a decrease in salinity impacts carbonate chemistry and CO2 solubility. Overall, the increasing pCO2 trend appears to be driven by ALK, DIC and SST changes, with SSS playing a minimal role.
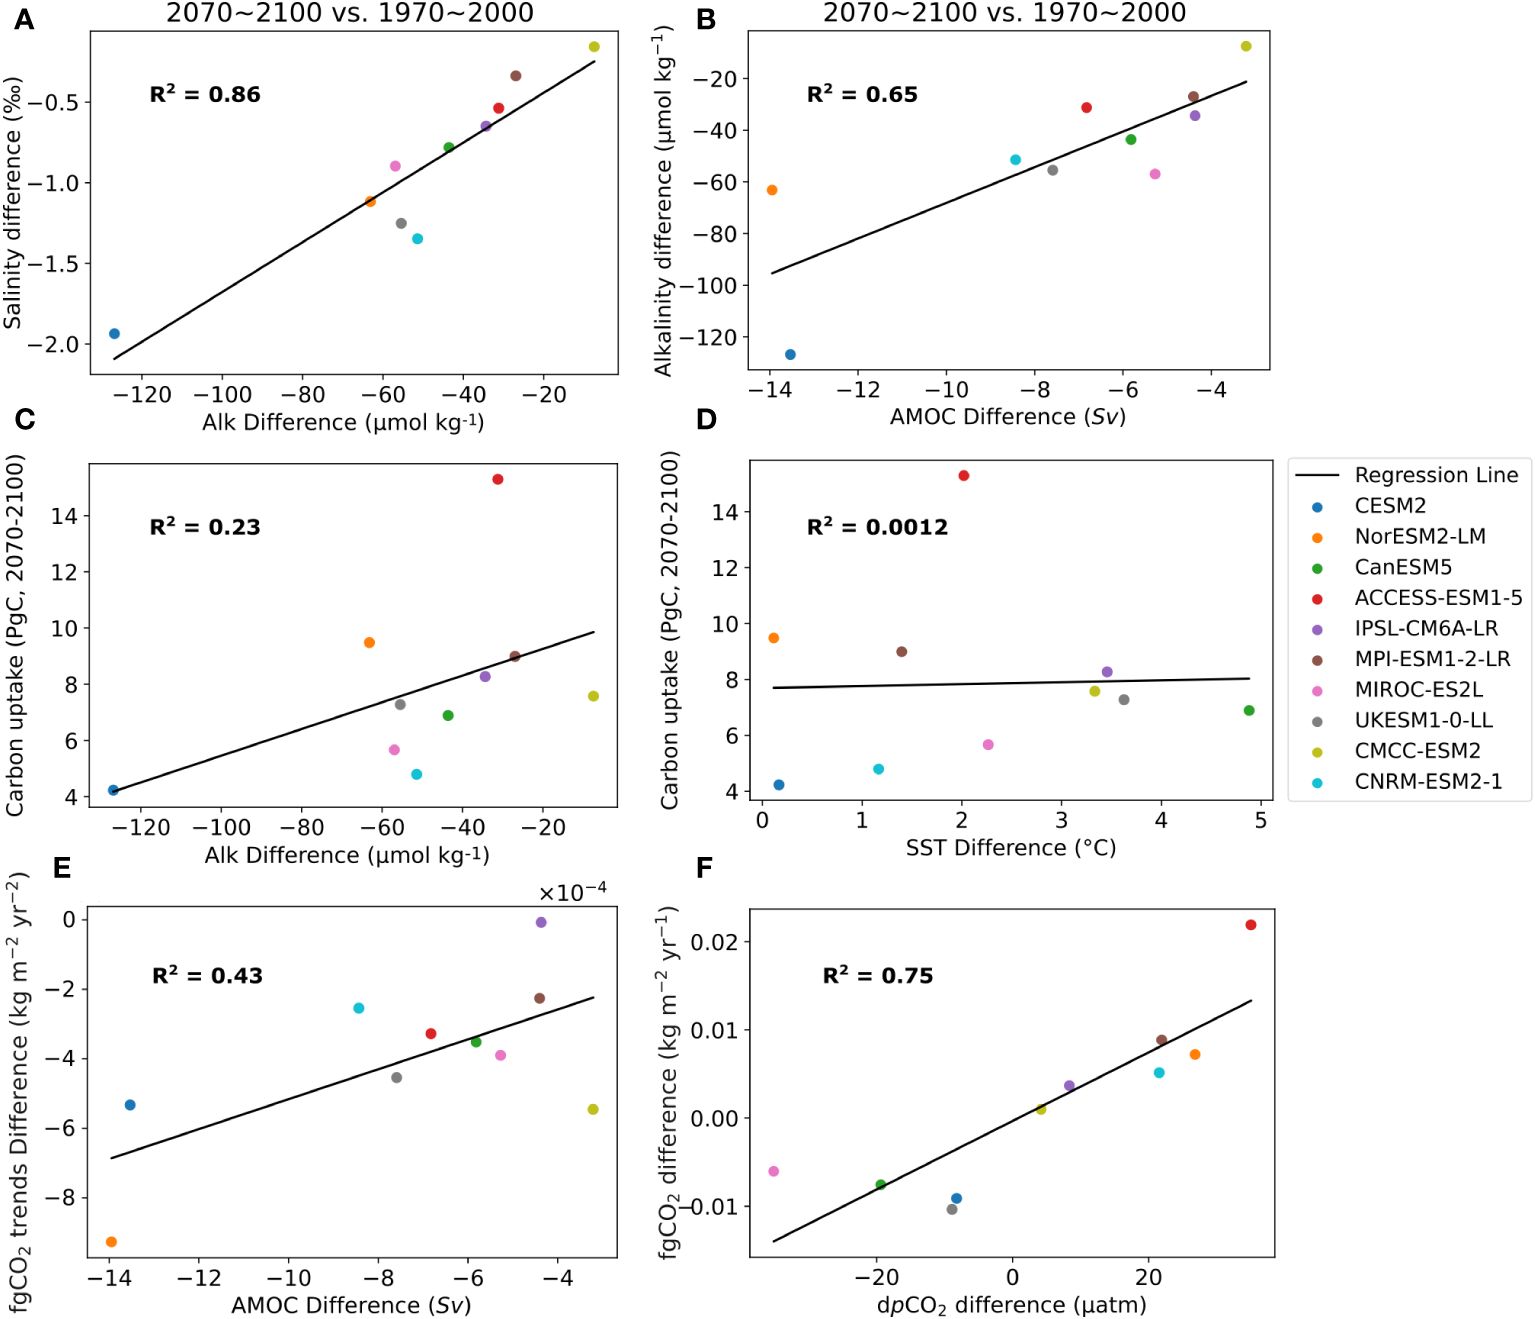
Figure 5 Correlation among various variables in the CMPI6 models analyzed. Differences are computed based on annual means over the region within the red box in Figure 1 (poleward of 40°N to 65°N and eastward of 55°W to 15°W) and calculated between 31-year average in SSP5-8.5 (2070-2100) and corresponding in the historical period (1970-2000) (A) Correlation of SSS (‰) and ALK (μmol kg-1) difference. (B) Correlation of ALK (μmol kg-1) and AMOC difference. (C) Correlation of carbon uptake (PgC) in future projections (2070-2100) and ALK (μmol kg-1) difference. (D) Correlation of carbon uptake (PgC) in future projections (2070-2100) and SST (°C) difference. (E) Correlation of fgCO2 trend difference (kg m-2 yr-2) and AMOC (Sv). (F) Correlation of fgCO2 difference (kg m-2 yr-1) and dpCO2 (μatm).
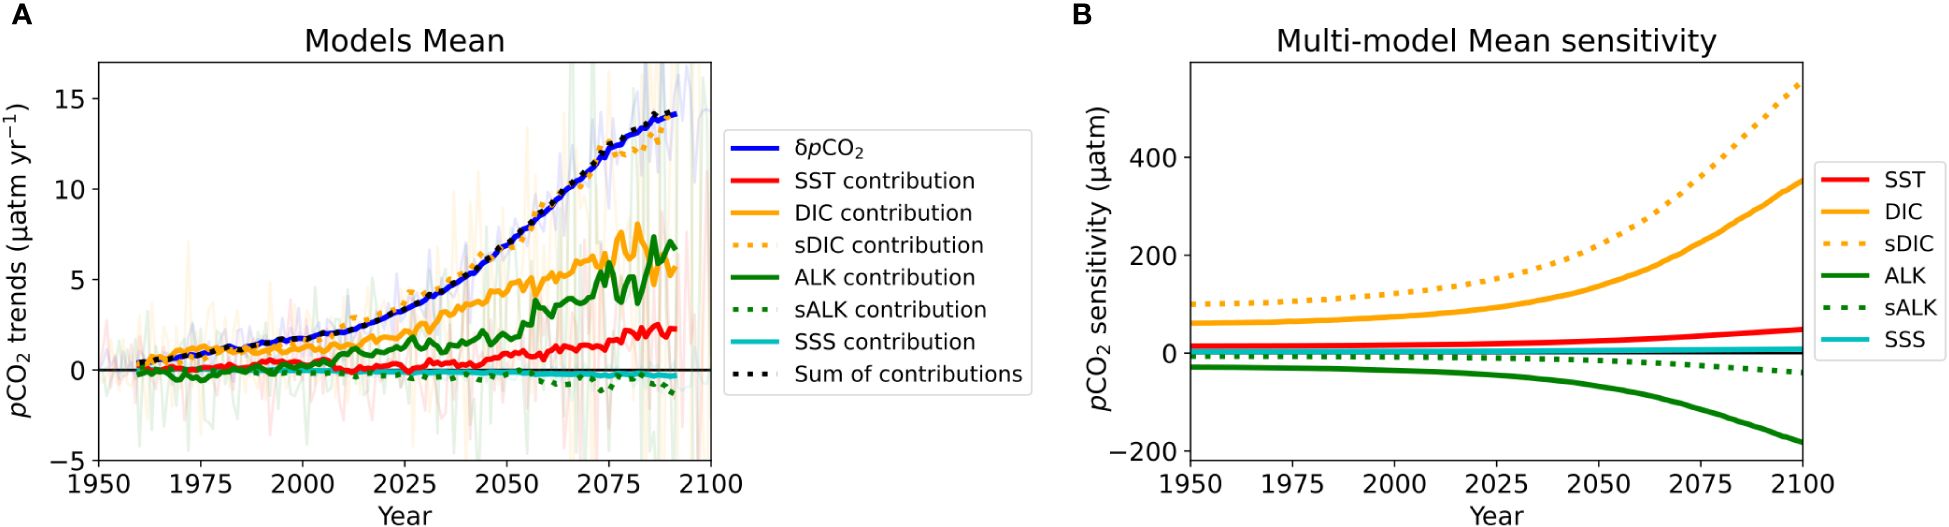
Figure 6 Drivers of ocean surface pCO2 trends and pCO2 sensitivity. (A) Drivers of pCO2 trends, calculated by , where X = SST, DIC, sDIC, ALK, sALK or SSS. The color lines show the ocean surface pCO2 trend (blue solid), and the contributions of changes in SST (red solid), DIC (orange solid), sDIC(orange dotted), ALK (green solid), sALK (green dotted) and SSS (light blue) to the ocean pCO2 trends, in addition to the sum of the four drivers (dark grey dotted). The transparent lines indicate the annual trends and the solid lines are the 20-year running average. (B) pCO2 sensitivity, calculated by , where X_stdev is the standard deviation of each variable over 1950-2100. The color lines show the ocean surface pCO2 sensitivity to SST (red solid), DIC (orange solid), sDIC(orange dotted), ALK (green solid), sALK (green dotted) and SSS (light blue). The standard deviation of SST, DIC, sDIC, ALK, sALK or SSS are 1.14 °C, 38.78 μmol kg-1, 64.54 μmol kg-1, 21.41 μmol kg-1, 4.92 μmol kg-1 and 0.40 ‰, respectively.
By examining the temporal evolution of pCO2 sensitivity to all components, the sensitivity increases over time due to the changing background states of carbonate chemistry over the centennial timescale considered (Figure 6B). The nearly opposite sensitivities to DIC and ALK indicate that mutually compensating pCO2 response for synchronous changes in DIC and ALK. This can be easily understood considering the changes induced by a pulse of freshwater flux. An input of freshwater can decrease DIC and ALK at similar rates, leading to a muted response of surface ocean pCO2 over a relatively short timescale. On the interannual and longer timescales, the gradual increase in atmospheric pCO2 and the resultant ocean carbon uptake increase DIC but not ALK (Figure 6B). Thus, increasing DIC and decreasing ALK together increase the surface ocean pCO2 on longer timescales. The increasing acidity of seawater increases the buffer factor which is approximately equal to [H+]/K2 where K2 is the equilibrium constant for the dissolution reaction of bicarbonate ion into carbonate ion. The acidification of seawater (increase in [H+]) directly causes the increase in buffer factor and the sensitivity of pCO2 to DIC on centennial timescales.
We further investigate the difference of pCO2 components between two 31-year periods: 1970-2000 as representative of the late 20th century and 2070-2100 in the SSP5-8.5 scenario as representative of the future towards the end of the 21st century (Figure 7). Over these two periods, all models show AMOC slowdown in the future scenario, together with increasing pCO2 in the atmosphere and in the surface ocean (Figure 7). The contribution of SST to the surface ocean pCO2 change is relatively small in comparison to alkalinity and DIC. ALK contributes the most to pCO2 increase in CESM2, NorESM2-LM, CanESM5, MIROC-ES2L, UKESM1-0-LL, and CNRM-ESM2-1 while in the other four models’ the pCO2 increase is mainly driven by DIC contributions (Figure 7A).
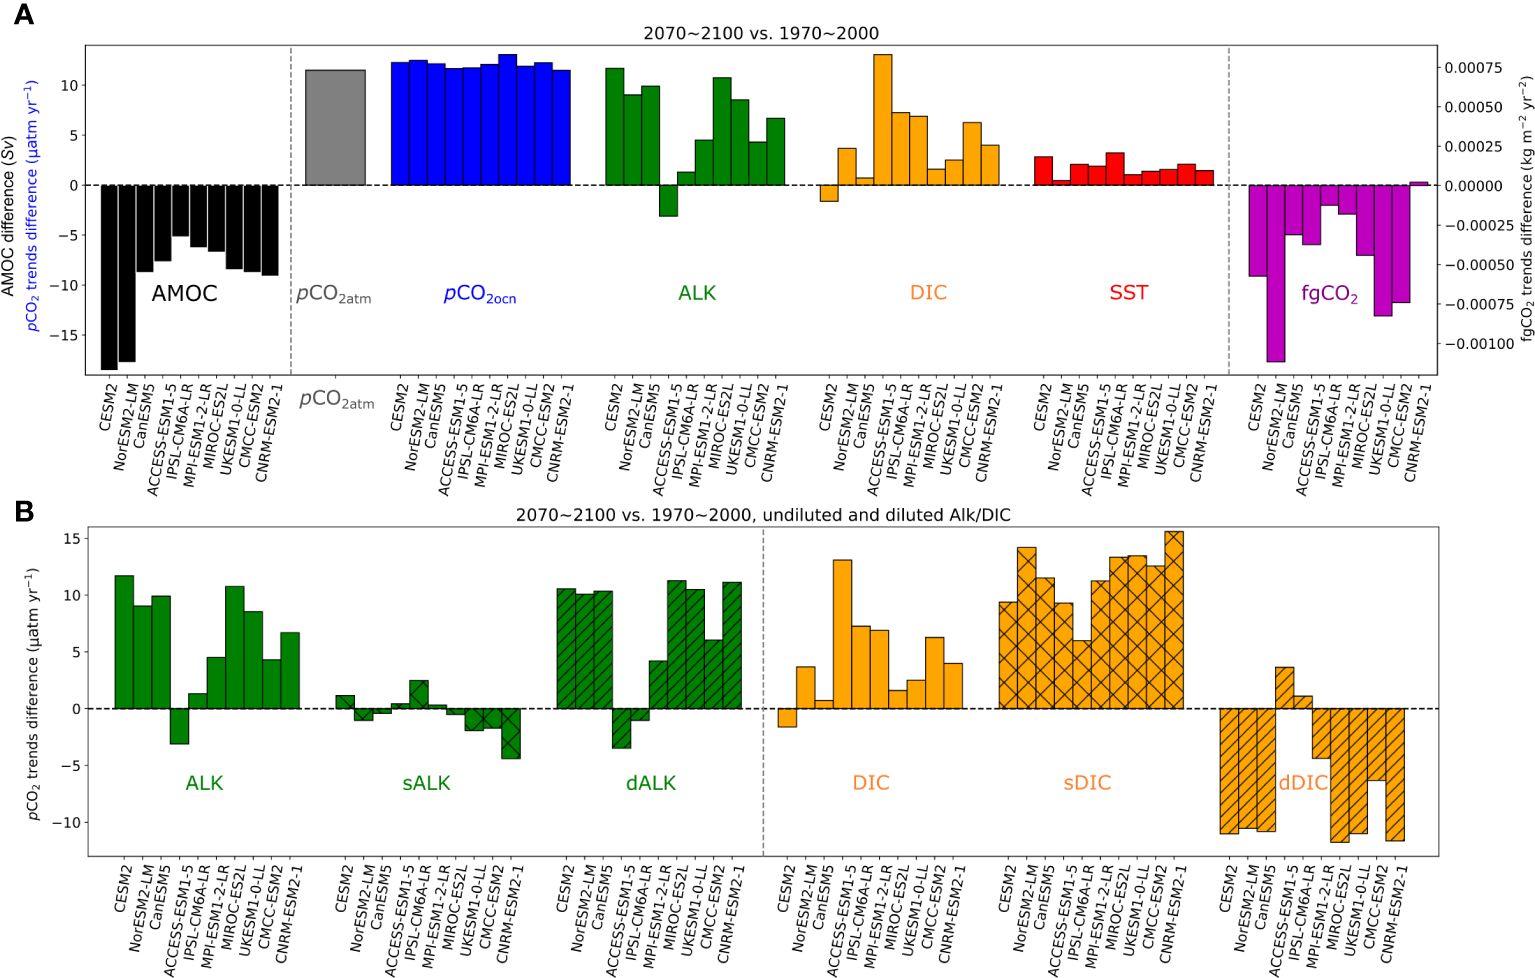
Figure 7 (A) Differences in ocean surface pCO2 trends (blue) and its drivers, and differences in AMOC (black) and fgCO2 trends (purple) between the average over 2070-2100 and the average over 1970-2000. The ocean pCO2 drivers include ALK (green), sALK (B, green plaid), dALK (B, green strip), DIC (orange), sDIC (B, orange plaid), dDIC (B, orange strip) and SST (red).
The pCO2 trends associated with DIC and ALK are further decomposed using the salinity-normalized and the dilution (freshwater) components. The DIC contribution of pCO2 trends can be understood as a residual between the increase in salinity-normalized DIC (affected by air-sea CO2 exchange, dynamics and biology) and the decrease in the dilution component. For most models, the salinity-normalized DIC dominates except for CESM2 (Figure 7B).
ALK contribution to pCO2 changes relies on the freshwater (dilution) component of ALK decrease except for IPSL-CM6A-LR. In models with stronger SSS decrease, ALK contributes more to increased surface ocean pCO2 and weakened ocean CO2 uptake. Thus, the mechanisms behind the representation of weakened CO2 uptake in the late 21st century are model dependent. In ACCESS-ESM1-5, the ALK and dALK contributions are lower in 2070-2100 than that in 1970-2000. In this particular model, ALK makes a small contribution to pCO2 change due to the sudden shift in SSS, DIC and ALK in the last 5 years of the 21st century (2096-2100, Figures 4C–E). If we exclude this event by adjusting the analysis window to 2065-2095 in ACCESS-ESM1-5, the dilution component (dALK) clearly controls the pCO2 change in this model, and its fgCO2 decreases significantly (Supplementary Figure 3). CESM2 and NorESM2-LM both exhibit a pronounced AMOC slowdown, consistent with strong fgCO2 decreasing trends (Figure 7A). What distinguish CESM2 and NorESM2-LM are the magnitude of the AMOC reduction, and the resultant ALK-driven pCO2 increase is much greater than that of DIC in comparison to other models (Figure 7). IPSL-CM6A-LR and MPI-ESM1-2-LR, on the other hand, show the weakest AMOC slowdown associated with the least fgCO2 decrease (Figure 7A). In these models, the ALK contributions to pCO2 trend are also the weakest (Figure 7B, Supplementary Figure 3). The correlation between AMOC changes and ALK contribution to the fgCO2 trends can be explained through salinity changes.
3.4 Correlations among ALK, AMOC and carbon uptake
To understand the relationship between ALK and AMOC with carbon uptake, we examine the differences between the two 31-year periods (1970-2000 vs 2070-2100) among the ten models. Figure 5A illustrates a strong positive correlation between changes in ALK and SSS across climate models, indicating that a decrease in ocean SSS is typically accompanied by a decrease in ALK. This means that the ALK change is mainly caused by the freshwater effect and by changes in the northward transport of salinity by the AMOC. This is reinforced by a notable positive correlation between ALK differences and changes in AMOC strength, suggesting that the decrease in ALK is associated with the reduction in AMOC (Figure 5B). Furthermore, a moderate positive correlation is observed between ALK differences and oceanic carbon uptake, implying that an increase (or less dilution) in ALK could increase the ocean’s capacity to sequester carbon (Figure 5C). However, this correlation is relatively small (R2 = 0.23) indicating that there are other mechanisms at play. Indeed, Goris et al. (2018) demonstrated that the vertical transport of DIC plays an important role, which is reflected in the seasonal amplitude of surface ocean pCO2. This factor alone, however, cannot explain the future evolution of carbon uptake in the North Atlantic in the models. Furthermore, the relationship between SST differences and carbon uptake is weak in the models considered, indicating that SST variations unlikely control carbon uptake changes (Figure 5D).
Our analysis identified the inter-model relationship modulating the centennial changes in ALK and AMOC, which are quite strongly correlated (R2 = 0.65). AMOC changes may have a profound impact on ALK in the SPNA, through changes in freshwater fluxes and in the transport of subtropical water masses to SPNA (Figure 5B). AMOC-induced changes in ALK in turn influence the ocean’s ability to absorb CO2, despite the moderate direct correlation between ALK and carbon uptake. Considering the above pCO2 decomposition analysis, ALK changes can affect the regional pCO2 significantly, and more so in the future than in historical times (Figure 7). Furthermore, the AMOC changes are moderately correlated (R2 = 0.43) with trend in fgCO2 indicating that a diminished convective mixing further decreases the carbon uptake (Figure 5E). This analysis highlights the importance of ALK reduction, which increases surface ocean pCO2 and reduces the ocean’s capacity to absorb CO2. These correlations underscore the interconnectedness of ocean circulation, chemical composition, and the carbon cycle in the Earth’s climate system.
4 Discussion
4.1 AMOC, ALK and carbon uptake
This study examined how the representation of the AMOC and its future evolution modulates ocean carbon uptake in the SPNA in ten of the CMIP6 Earth System Models through the analysis of physical and biogeochemical changes on centennial timescales. The AMOC slowdown is generally associated with SSS and ALK decrease, along with increased DIC in the multi-model mean sense, consistent with previous studies (Jackson et al., 2015; Schmittner and Lund, 2015; Zhang et al., 2019; Chikamoto et al., 2023; Sinet et al., 2023; van Westen and Dijkstra, 2023). The extent of these changes can vary across models. For example, CESM2 and NorESM2-LM project pronounced AMOC reductions, which are correlated with modest SST increases due to an intense NAWH (Keil et al., 2020; Bellomo et al., 2021; Swingedouw et al., 2021; Noël et al., 2022; Iversen et al., 2023) and more significant reductions in SSS and ALK (Figure 4). Upper ocean currents weaken in these models, and these changes are aligned with a strong decrease in KE (Figure 4F) (Gregory and Tailleux, 2010). In contrast, CanESM5 displays weaker AMOC slowdown, notable SST increases and moderate reduction in SSS and ALK (Figure 4). This model shows a drop in dpCO2, suggesting that the intensified warming raises ocean pCO2 (Figure 4H). The SPNA in CanESM5 continues to absorb CO2 until the late 21st century while affected by strong warming, moderate reduction in ALK and moderate AMOC weakening (Figure 4).
The models characterized by strong AMOC mean states in the historical period exhibit both a more pronounced slowdown of AMOC (CESM2/NorESM2-LM) (Supplementary Figure 1) (Gregory et al., 2005; Weijer et al., 2020; Bellomo et al., 2021) and a considerably weaker cumulative CO2 uptake compared to the models with weaker AMOC slowdown (IPSL-CM6A-LR/MPI-ESM1-2-LR) (Figure 7A). A recent study suggests that under high CO2-emission scenarios, the area to the southeast of Greenland is expected to reach the point of anthropogenic CO2 uptake saturation earlier in the 21st century, while under low CO2-emission scenarios, it will transit from a carbon sink to a carbon source for the atmosphere around 2080 (Ridge and McKinley, 2021). Two mechanisms that link AMOC weakening and reduced CO2 uptake include weakened subduction of surface water (DeGrandpre et al., 2006; Goris et al., 2018) and alkalinity decrease due to freshening of surface waters in the SPNA. These two mechanisms are not exclusive to one another, and both affect the air-sea CO2 transfer. Their relative importance is model-dependent. Having said this, we can point to the most plausible explanation in the model context considering CESM2, which has the strongest AMOC of the ten models in the historical period, and displays the strongest decline as well. The high correlations between AMOC, SSS and ALK link the AMOC slowdown to the alkalinity decline and resultant weakened ocean carbon uptake (Figure 5), while also explaining the reduced rate of increase or even decline in surface DIC concentrations (Figure 4D). Warming-induced solubility decline is also sensitive to the magnitude of AMOC slowdown, but the SST difference has little correlation with carbon uptake in the future scenario (Figure 5D). In CESM2 (or NorESM2-LM), the strong AMOC slowdown causes the SPNA to reach the maximum rate of CO2 uptake earlier than the inflection point of the transient atmospheric CO2 levels (Figure 4I) (Terhaar et al., 2022). In the SSP5-8.5 scenario, where the global CO2 emission is assumed to increase through the 2080s, their regional ocean carbon sink reaches its peak and then becomes less effective by ~ 2040-2060 (Figure 4I). The increasing contribution of ALK changes to the pCO2 in the SPNA (Figure 6A) is unique to this region. The ALK contribution to pCO2 increase is relatively modest both globally and in the Southern Ocean (Supplementary Figure 3), suggesting a distinct influence to the North Atlantic that may warrant further investigation.
Ocean carbon uptake can reach its peak at an earlier period when the biogeochemical response to physical climate changes (including the AMOC slowdown) further reduces the ocean’s ability to absorb atmospheric CO2 (Maier-Reimer et al., 1996; Humphreys et al., 2018; Stock et al., 2020). The surface ocean DIC concentrations increased during the 20th century due to the uptake of anthropogenic carbon (Figure 4D) (Wanninkhof et al., 2010; Jiang et al., 2023; Keppler et al., 2023; Ma et al., 2023). In the high emission scenario, the atmospheric pCO2 levels continue to increase and the surface ocean DIC generally follows the atmospheric forcing trend (Figures 4D, G). However, there are significant model differences in the surface DIC future trajectories. CESM2, for example, stands out for its weak DIC increase even in the highest emission scenario during the late 21st century (Figure 4D). A weakened biological pump may potentially explain the reduced ocean carbon uptake (Passow and Carlson, 2012; Barange et al., 2017), as a weakened export of organic matter from the surface ocean would leave behind higher DIC concentrations (Tian et al., 2015).
We complete this work by presenting the inter-model correlations of variables which reveal diverging behaviors among the ten models (Figure 5). There is generally a strong positive correlation between changes in ALK and SSS which are both declining in tandem, due to freshwater influences and weakened transport of saline subtropical waters to the SPNA region (Figure 5A) (Lauvset and Gruber, 2014). The ALK dependence extends to the AMOC, as a decrease in AMOC strength is associated with a reduction in ALK (Figure 5B). These alterations in ALK appear to moderately affect the ocean’s capacity for carbon uptake (Takahashi et al., 2014; Middelburg et al., 2020; Chikamoto et al., 2023). The findings suggest that the interplay between AMOC and ALK is significant, as AMOC’s role in transporting chemically distinct water masses directly impacts ALK levels, which in turn, indirectly influence the CO2 sequestration capabilities of the ocean. Consistent with our work, previous studies have established that models simulating lower present-day SSS in the SPNA tend to reduce future carbon absorption (Estella-Perez et al., 2020; Park et al., 2023). As our results indicate, the likelihood that SSS and ALK will diminish in the future is very high, and consequently, the SPNA will not help mitigate global warming given the substantial reduction in its ability to uptake CO2.
4.2 Modal prediction reliability
This work analyzed CMIP6 models with the goal of identifying processes or quantities that could help us distinguish among behaviors that are indicative of the future evolution of ocean circulation and carbon cycling in the SPNA. There is indeed an urgent need to better quantify the carbon dioxide removal potential in the ocean.
In summary, this study underscores the complex relationship among AMOC dynamics, ALK, surface ocean salinity and the ocean’s capacity to uptake atmospheric carbon, offering insights into the intricate interactions between physical variables in SPNA. Despite the different extent of the decline in AMOC in the ten of the CMIP6 models considered, all models agree on the trend direction (Figure 4A). A stronger AMOC slowdown correlates with less ocean carbon uptake (Schmittner and Galbraith, 2008; Nielsen et al., 2019; Katavouta and Williams, 2021). This study emphasized the relatively underappreciated role of diminishing ALK and its impact on regional carbon uptake. Despite the complexity of the relationships among the variables analyzed, it clearly emerges that changes in ALK are an important factor in the oceanic absorption of CO2 (Takahashi et al., 2014; Middelburg et al., 2020; Chikamoto et al., 2023). Moving forward, a deeper dive into the mechanistic links between these variables is imperative to enhance our understanding of their collective impact on the carbon cycle within the Earth’s climate system.
Observations are still limited, while being the best tool to identify specific quantities and relationships in both physics and biogeochemistry. Model simulations will continue to serve as a key tool to understand ocean physics and biogeochemistry under changing climate (Menary et al., 2020; Stock et al., 2020; Weijer et al., 2020; Swingedouw et al., 2021; Robson et al., 2022). The role of the biological pump on carbon uptake and its future evolution remains largely uncertain (Middelburg et al., 2020; Seferian et al., 2020). More work is needed to better understand what drives the observed export of particle organic carbon and why models generally misrepresent both mean and variability. A better characterization of the biological pump and of carbon export will enhance our ability to predict the evolution of the marine ecosystem in the SPNA and is especially important considering the monitoring, reporting, and verification (MRV) required for the deployment of carbon removal technologies.
As final note of caution, we should keep in mind that all climate models present biases that limit their reliability, and the robustness of common behaviors could be tested paying attention to the outliers. For instance, in our analysis ACCESS-ESM1-5 stands out for its strong correlation of carbon uptake with ALK or SST (Figures 5C, D), possibly indicating an anomaly or significant deviation in the model’s simulation relative to others. This could be due to unique model parameterizations, sensitivities to specific inputs, or how ACCESS-ESM1-5 simulates the interactions between oceanic processes and the carbon cycle (Ziehn et al., 2020). To understand the cause of this outlier behavior, a detailed examination of the model’s internal processes and assumptions is necessary, which may involve a closer look at the representation of ocean chemistry, circulation patterns, and their response to changing climatic conditions. Further diagnostic studies comparing ACCESS-ESM1-5 with other models and observational data would be beneficial to determine the reasons behind its distinctive response.
Data availability statement
The original contributions presented in the study are included in the article/Supplementary Material. Further inquiries can be directed to the corresponding author.
Author contributions
QZ: Conceptualization, Data curation, Software, Validation, Visualization, Writing – original draft, Writing – review & editing, Methodology. TI: Conceptualization, Formal analysis, Funding acquisition, Methodology, Software, Supervision, Validation, Writing – review & editing. AB: Conceptualization, Formal analysis, Funding acquisition, Methodology, Supervision, Validation, Writing – review & editing.
Funding
The author(s) declare financial support was received for the research, authorship, and/or publication of this article. The study was funded by the U.S. Department of Energy (DE-SC0021300).
Acknowledgments
We acknowledge the World Climate Research Programme, which, through its Working Group on Coupled Modelling, coordinated and promoted CMIP6. We thank the climate modeling groups for producing and making available their model output, the Earth System Grid Federation (ESGF) for archiving the data and providing access, and the multiple funding agencies who support CMIP6 and ESGF. We acknowledge the support by the U.S. Department of Energy, through grant DE-SC0021300. The Generic Mapping Tools open-access software was used to produce the map in this paper.
Conflict of interest
The authors declare that the research was conducted in the absence of any commercial or financial relationships that could be construed as a potential conflict of interest.
Publisher’s note
All claims expressed in this article are solely those of the authors and do not necessarily represent those of their affiliated organizations, or those of the publisher, the editors and the reviewers. Any product that may be evaluated in this article, or claim that may be made by its manufacturer, is not guaranteed or endorsed by the publisher.
Supplementary material
The Supplementary Material for this article can be found online at: https://www.frontiersin.org/articles/10.3389/fmars.2024.1304193/full#supplementary-material
References
Balmaseda M. A., Mogensen K., Weaver A. T. (2013). Evaluation of the ECMWF ocean reanalysis system ORAS4. Q. J. R. Meteorol. Soc. 139, 1132–1161. doi: 10.1002/qj.2063
Barange M., Butenschön M., Yool A., Beaumont N., Fernandes J. A., Martin A. P., et al. (2017). The cost of reducing the north atlantic ocean biological carbon pump. Front. Mar. Sci. 3. doi: 10.3389/fmars.2016.00290
Bellomo K., Angeloni M., Corti S., von Hardenberg J. (2021). Future climate change shaped by inter-model differences in Atlantic meridional overturning circulation response. Nat. Commun. 12, 3659. doi: 10.1038/s41467-021-24015-w
Bonnet R., Swingedouw D., Gastineau G., Boucher O., Deshayes J., Hourdin F., et al. (2021). Increased risk of near term global warming due to a recent AMOC weakening. Nat. Commun. 12, 6108. doi: 10.1038/s41467-021-26370-0
Boucher O., Servonnat J., Albright A. L., Aumont O., Balkanski Y., Bastrikov V., et al. (2020). Presentation and evaluation of the IPSL-CM6A-LR climate model. J. Adv. Modeling. Earth Syst. 12, e2019MS002010. doi: 10.1029/2019ms002010
Brix H., Currie K. I., Mikaloff Fletcher S. E. (2013). Seasonal variability of the carbon cycle in subantarctic surface water in the South West Pacific. Global Biogeochem. Cycles. 27, 200–211. doi: 10.1002/gbc.20023
Bronselaer B., Zanna L. (2020). Heat and carbon coupling reveals ocean warming due to circulation changes. Nature 584, 227–233. doi: 10.1038/s41586-020-2573-5
Buckley M. W., Marshall J. (2016). Observations, inferences, and mechanisms of the Atlantic Meridional Overturning Circulation: A review. Rev. Geophys. 54, 5–63. doi: 10.1002/2015rg000493
Caesar L., Rahmstorf S., Robinson A., Feulner G., Saba V. (2018). Observed fingerprint of a weakening Atlantic Ocean overturning circulation. Nature 556, 191–196. doi: 10.1038/s41586-018-0006-5
Cai W., Bi D., Church J., Cowan T., Dix M., Rotstayn L. (2006). Pan-oceanic response to increasing anthropogenic aerosols: Impacts on the Southern Hemisphere oceanic circulation. Geophys. Res. Lett. 33, L21707. doi: 10.1029/2006gl027513
Cherchi A., Fogli P. G., Lovato T., Peano D., Iovino D., Gualdi S., et al. (2019). Global mean climate and main patterns of variability in the CMCC-CM2 coupled model. J. Adv. Modeling. Earth Syst. 11, 185–209. doi: 10.1029/2018ms001369
Chikamoto M. O., DiNezio P. (2021). Multi-century changes in the ocean carbon cycle controlled by the tropical oceans and the southern ocean. Global Biogeochem. Cycles. 35, e2021GB007090. doi: 10.1029/2021gb007090
Chikamoto M. O., DiNezio P., Lovenduski N. (2023). Long-term slowdown of ocean carbon uptake by alkalinity dynamics. Geophys. Res. Lett. 50, e2022GL101954. doi: 10.1029/2022gl101954
Claret M., Galbraith E. D., Palter J. B., Bianchi D., Fennel K., Gilbert D., et al. (2018). Rapid coastal deoxygenation due to ocean circulation shift in the NW Atlantic. Nat. Clim. Chang. 8, 866–872. doi: 10.1038/s41558-018-0263-1
Danabasoglu G., Lamarque J. F., Bacmeister J., Bailey D. A., DuVivier A. K., Edwards J., et al. (2020). The community earth system model version 2 (CESM2). J. Adv. Modeling. Earth Syst. 12, e2019MS001916. doi: 10.1029/2019ms001916
DeGrandpre M. D., Körtzinger A., Send U., Wallace D. W. R., Bellerby R. G. J. (2006). Uptake and sequestration of atmospheric CO2 in the Labrador Sea deep convection region. Geophys. Res. Lett. 33, L12S03. doi: 10.1029/2006gl026881
Delworth T. L., Dixon K. W. (2006). Have anthropogenic aerosols delayed a greenhouse gas-induced weakening of the North Atlantic thermohaline circulation? Geophys. Res. Lett. 33, L02606. doi: 10.1029/2005gl024980
Deser C., Alexander M. A., Xie S. P., Phillips A. S. (2010). Sea surface temperature variability: patterns and mechanisms. Ann. Rev. Mar. Sci. 2, 115–143. doi: 10.1146/annurev-marine-120408-151453
Drijfhout S. (2015). Competition between global warming and an abrupt collapse of the AMOC in Earth’s energy imbalance. Sci. Rep. 5, 14877. doi: 10.1038/srep14877
Drijfhout S., Van Oldenborgh G. J., Cimatoribus A. (2012). Is a decline of AMOC causing the warming hole above the north atlantic in observed and modeled warming patterns? J. Climate 25, 8373–8379. doi: 10.1175/jcli-d-12-00490.1
Estella-Perez V., Mignot J., Guilyardi E., Swingedouw D., Reverdin G. (2020). Advances in reconstructing the AMOC using sea surface observations of salinity. Climate Dynamics. 55, 975–992. doi: 10.1007/s00382-020-05304-4
Eyring V., Bony S., Meehl G. A., Senior C. A., Stevens B., Stouffer R. J., et al. (2016). Overview of the Coupled Model Intercomparison Project Phase 6 (CMIP6) experimental design and organization. Geosci. Model. Dev. 9, 1937–1958. doi: 10.5194/gmd-9-1937-2016
Frajka-Williams E., Ansorge I. J., Baehr J., Bryden H. L., Chidichimo M. P., Cunningham S. A., et al. (2019). Atlantic meridional overturning circulation: observed transport and variability. Front. Mar. Sci. 6. doi: 10.3389/fmars.2019.00260
Gervais M., Shaman J., Kushnir Y. (2018). Mechanisms governing the development of the north atlantic warming hole in the CESM-LE future climate simulations. J. Climate 31, 5927–5946. doi: 10.1175/jcli-d-17-0635.1
Gonçalves Neto A., Langan J. A., Palter J. B. (2021). Changes in the Gulf Stream preceded rapid warming of the Northwest Atlantic Shelf. Commun. Earth Environ. 2, 74. doi: 10.1038/s43247-021-00143-5
Goris N., Johannsen K., Tjiputra J. (2023). The emergence of the Gulf Stream and interior western boundary as key regions to constrain the future North Atlantic carbon uptake. Geosci. Model. Dev. 16, 2095–2117. doi: 10.5194/gmd-16-2095-2023
Goris N., Tjiputra J. F., Olsen A., Schwinger J., Lauvset S. K., Jeansson E. (2018). Constraining projection-based estimates of the future north atlantic carbon uptake. J. Climate 31, 3959–3978. doi: 10.1175/jcli-d-17-0564.1
Gregory J. M., Dixon K. W., Stouffer R. J., Weaver A. J., Driesschaert E., Eby M., et al. (2005). A model intercomparison of changes in the Atlantic thermohaline circulation in response to increasing atmospheric CO2 concentration. Geophys. Res. Lett. 32, L12703. doi: 10.1029/2005gl023209
Gregory J. M., Tailleux R. (2010). Kinetic energy analysis of the response of the Atlantic meridional overturning circulation to CO2-forced climate change. Climate Dynamics. 37, 893–914. doi: 10.1007/s00382-010-0847-6
Hajima T., Watanabe M., Yamamoto A., Tatebe H., Noguchi M. A., Abe M., et al. (2020). Development of the MIROC-ES2L Earth system model and the evaluation of biogeochemical processes and feedbacks. Geosci. Model. Dev. 13, 2197–2244. doi: 10.5194/gmd-13-2197-2020
Hassan T., Allen R. J., Liu W., Randles C. A. (2021). Anthropogenic aerosol forcing of the Atlantic meridional overturning circulation and the associated mechanisms in CMIP6 models. Atmospheric. Chem. Phys. 21, 5821–5846. doi: 10.5194/acp-21-5821-2021
Humphreys M. P., Daniels C. J., Wolf-Gladrow D. A., Tyrrell T., Achterberg E. P. (2018). On the influence of marine biogeochemical processes over CO2 exchange between the atmosphere and ocean. Mar. Chem. 199, 1–11. doi: 10.1016/j.marchem.2017.12.006
Iversen E. C., Hodnebrog Ø., Seland Graff L., Nygaard B. E., Iversen T. (2023). Future winter precipitation decreases associated with the north atlantic warming hole and reduced convection. J. Geophys. Res.: Atmospheres. 128, e2022JD038374. doi: 10.1029/2022jd038374
Jackson L. C., Kahana R., Graham T., Ringer M. A., Woollings T., Mecking J. V., et al. (2015). Global and European climate impacts of a slowdown of the AMOC in a high resolution GCM. Climate Dynamics. 45, 3299–3316. doi: 10.1007/s00382-015-2540-2
Jackson L. C., Roberts M. J., Hewitt H. T., Iovino D., Koenigk T., Meccia V. L., et al. (2020). Impact of ocean resolution and mean state on the rate of AMOC weakening. Climate Dynamics. 55, 1711–1732. doi: 10.1007/s00382-020-05345-9
Jiang L. Q., Dunne J., Carter B. R., Tjiputra J. F., Terhaar J., Sharp J. D., et al. (2023). Global surface ocean acidification indicators from 1750 to 2100. J. Adv. Modeling. Earth Syst. 15, e2022MS003563. doi: 10.1029/2022ms003563
Jing Y., Li Y., Xu Y. (2022). An assessment of the North Atlantic (25–75°N) air-sea CO2 flux in 12 CMIP6 models. Deep. Sea. Res. Part I.: Oceanographic. Res. Papers. 180, 103682. doi: 10.1016/j.dsr.2021.103682
Katavouta A., Williams R. G. (2021). Ocean carbon cycle feedbacks in CMIP6 models: contributions from different basins. Biogeosciences 18, 3189–3218. doi: 10.5194/bg-18-3189-2021
Keil P., Mauritsen T., Jungclaus J., Hedemann C., Olonscheck D., Ghosh R. (2020). Multiple drivers of the North Atlantic warming hole. Nat. Climate Change 10, 667–671. doi: 10.1038/s41558-020-0819-8
Keppler L., Landschützer P., Lauvset S. K., Gruber N. (2023). Recent trends and variability in the oceanic storage of dissolved inorganic carbon. Global Biogeochem. Cycles. 37, e2022GB007677. doi: 10.1029/2022gb007677
Kim H.-J., An S.-I., Park J.-H., Sung M.-K., Kim D., Choi Y., et al. (2023). North Atlantic Oscillation impact on the Atlantic Meridional Overturning Circulation shaped by the mean state. NPJ Climate Atmospheric. Sci. 6, 25. doi: 10.1038/s41612-023-00354-x
Knight J. R., Allan R. J., Folland C. K., Vellinga M., Mann M. E. (2005). A signature of persistent natural thermohaline circulation cycles in observed climate. Geophys. Res. Lett. 32, L20708. doi: 10.1029/2005gl024233
Kostov Y., Armour K. C., Marshall J. (2014). Impact of the Atlantic meridional overturning circulation on ocean heat storage and transient climate change. Geophys. Res. Lett. 41, 2108–2116. doi: 10.1002/2013gl058998
Latif M., Park T., Park W. (2019). Decadal Atlantic Meridional Overturning Circulation slowing events in a climate model. Climate Dynamics. 53, 1111–1124. doi: 10.1007/s00382-019-04772-7
Lauvset S. K., Gruber N. (2014). Long-term trends in surface ocean pH in the North Atlantic. Mar. Chem. 162, 71–76. doi: 10.1016/j.marchem.2014.03.009
Le Quéré C., Rödenbeck C., Buitenhuis E. T., Conway T. J., Langenfelds R., Gomez A., et al. (2007). Saturation of the southern ocean CO2 sink due to recent climate change. Science 316, 1735–1738. doi: 10.1126/science.1136188
Lewis E., Wallace D. W. (1998). Program developed for CO2 system calculations (Oak Ridge, Tennessee: Carbon Dioxide Information Analysis Center, Oak Ridge National Laboratory, U.S. Department of Energy).
Liu W., Fedorov A. V., Xie S. P., Hu S. (2020). Climate impacts of a weakened Atlantic Meridional Overturning Circulation in a warming climate. Sci. Adv. 6, eaaz4876. doi: 10.1126/sciadv.aaz4876
Lozier M. S., Li F., Bacon S., Bahr F., Bower A. S., Cunningham S. A., et al. (2019). A sea change in our view of overturning in the subpolar North Atlantic. Science 363, 516–521. doi: 10.1126/science.aau6592
Ma D., Gregor L., Gruber N. (2023). Four decades of trends and drivers of global surface ocean acidification. Global Biogeochem. Cycles. 37, e2023GB007765. doi: 10.1029/2023gb007765
Maier-Reimer E., Mikolajewicz U., Winguth A. (1996). Future ocean uptake of CO2: interaction between ocean circulation and biology. Climate Dynamics. 12, 711–722. doi: 10.1007/s003820050138
Marshall J., Scott J. R., Armour K. C., Campin J. M., Kelley M., Romanou A. (2014). The ocean’s role in the transient response of climate to abrupt greenhouse gas forcing. Climate Dynamics. 44, 2287–2299. doi: 10.1007/s00382-014-2308-0
Mauritsen T., Bader J., Becker T., Behrens J., Bittner M., Brokopf R., et al. (2019). Developments in the MPI-M earth system model version 1.2 (MPI-ESM1.2) and its response to increasing CO2. J. Adv. Model. Earth Syst. 11, 998–1038. doi: 10.1029/2018MS001400
Meinshausen M., Nicholls Z. R. J., Lewis J., Gidden M. J., Vogel E., Freund M., et al. (2020). The shared socio-economic pathway (SSP) greenhouse gas concentrations and their extensions to 2500. Geosci. Model. Dev. 13, 3571–3605. doi: 10.5194/gmd-13-3571-2020
Meinshausen M., Vogel E., Nauels A., Lorbacher K., Meinshausen N., Etheridge D. M., et al. (2017). Historical greenhouse gas concentrations for climate modelling (CMIP6). Geosci. Model. Dev. 10, 2057–2116. doi: 10.5194/gmd-10-2057-2017
Menary M. B., Kuhlbrodt T., Ridley J., Andrews M. B., Dimdore-Miles O. B., Deshayes J., et al. (2018). Preindustrial control simulations with hadGEM3-GC3.1 for CMIP6. J. Adv. Modeling. Earth Syst. 10, 3049–3075. doi: 10.1029/2018ms001495
Menary M. B., Robson J., Allan R. P., Booth B. B. B., Cassou C., Gastineau G., et al. (2020). Aerosol-forced AMOC changes in CMIP6 historical simulations. Geophys. Res. Lett. 47, e2020GL088166. doi: 10.1029/2020gl088166
Middelburg J. J., Soetaert K., Hagens M. (2020). Ocean alkalinity, buffering and biogeochemical processes. Rev. Geophys. 58, e2019RG000681. doi: 10.1029/2019RG000681
Nielsen S. B., Jochum M., Pedro J. B., Eden C., Nuterman R. (2019). Two-timescale carbon cycle response to an AMOC collapse. Paleoceanogr. Paleoclimatol. 34, 511–523. doi: 10.1029/2018pa003481
Noël B., Aðalgeirsdóttir G., Pálsson F., Wouters B., Lhermitte S., Haacker J. M., et al. (2022). North atlantic cooling is slowing down mass loss of Icelandic glaciers. Geophys. Res. Lett. 49, e2021GL095697. doi: 10.1029/2021gl095697
Orihuela-Pinto B., England M. H., Taschetto A. S. (2022). Interbasin and interhemispheric impacts of a collapsed Atlantic Overturning Circulation. Nat. Climate Change 12, 558–565. doi: 10.1038/s41558-022-01380-y
Oudar T., Cattiaux J., Douville H. (2020). Drivers of the northern extratropical eddy-driven jet change in CMIP5 and CMIP6 models. Geophys. Res. Lett. 47, e2019GL086695. doi: 10.1029/2019gl086695
Park I.-H., Yeh S.-W., Cai W., Wang G., Min S.-K., Lee S.-K. (2023). Present-day North Atlantic salinity constrains future warming of the Northern Hemisphere. Nat. Climate Change 13, 816–822. doi: 10.1038/s41558-023-01728-y
Passow U., Carlson C. A. (2012). The biological pump in a high CO2 world. Mar. Ecol. Prog. Ser. 470, 249–271. doi: 10.3354/meps09985
Perez F. F., Olafsson J., Olafsdottir S. R., Fontela M., Takahashi T. (2021). Contrasting drivers and trends of ocean acidification in the subarctic Atlantic. Sci. Rep. 11, 13991. doi: 10.1038/s41598-021-93324-3
Rahmstorf S., Box J. E., Feulner G., Mann M. E., Robinson A., Rutherford S., et al. (2015). Exceptional twentieth-century slowdown in Atlantic Ocean overturning circulation. Nat. Climate Change 5, 475–480. doi: 10.1038/nclimate2554
Riahi K., van Vuuren D. P., Kriegler E., Edmonds J., O’Neill B. C., Fujimori S., et al. (2017). The Shared Socioeconomic Pathways and their energy, land use, and greenhouse gas emissions implications: An overview. Global Environ. Change 42, 153–168. doi: 10.1016/j.gloenvcha.2016.05.009
Ridge S. M., McKinley G. A. (2021). Ocean carbon uptake under aggressive emission mitigation. Biogeosciences 18, 2711–2725. doi: 10.5194/bg-18-2711-2021
Riebesell U., Körtzinger A., Oschlies A. (2009). Sensitivities of marine carbon fluxes to ocean change. Proc. Natl. Acad. Sci. 106, 20602–20609. doi: 10.1073/pnas.0813291106
Roberts M. J., Jackson L. C., Roberts C. D., Meccia V., Docquier D., Koenigk T., et al. (2020). Sensitivity of the atlantic meridional overturning circulation to model resolution in CMIP6 highResMIP simulations and implications for future changes. J. Adv. Modeling. Earth Syst. 12, e2019MS002014. doi: 10.1029/2019ms002014
Robson J., Menary M. B., Sutton R. T., Mecking J., Gregory J. M., Jones C., et al. (2022). The role of anthropogenic aerosol forcing in the 1850–1985 strengthening of the AMOC in CMIP6 historical simulations. J. Climate 35, 3243–3263. doi: 10.1175/jcli-d-22-0124.1
Sarmiento J. L., Gruber N. (2006). Ocean biogeochemical dynamics. Geol. Magazine. 144, 1034–1034. doi: 10.1017/s0016756807003755
Schmittner A., Galbraith E. D. (2008). Glacial greenhouse-gas fluctuations controlled by ocean circulation changes. Nature 456, 373–376. doi: 10.1038/nature07531
Schmittner A., Lund D. C. (2015). Early deglacial Atlantic overturning decline and its role in atmospheric CO2 rise inferred from carbon isotopes (δ13C). Climate Past. 11, 135–152. doi: 10.5194/cp-11-135-2015
Schwinger J., Asaadi A., Goris N., Lee H. (2022). Possibility for strong northern hemisphere high-latitude cooling under negative emissions. Nat. Commun. 13, 1095. doi: 10.1038/s41467-022-28573-5
Seferian R., Berthet S., Yool A., Palmieri J., Bopp L., Tagliabue A., et al. (2020). Tracking improvement in simulated marine biogeochemistry between CMIP5 and CMIP6. Curr. Clim. Change Rep. 6, 95–119. doi: 10.1007/s40641-020-00160-0
Séférian R., Nabat P., Michou M., Saint-Martin D., Voldoire A., Colin J., et al. (2019). Evaluation of CNRM earth system model, CNRM-ESM2-1: role of earth system processes in present-day and future climate. J. Adv. Modeling. Earth Syst. 11, 4182–4227. doi: 10.1029/2019ms001791
Seland Ø., Bentsen M., Olivié D., Toniazzo T., Gjermundsen A., Graff L. S., et al. (2020). Overview of the Norwegian Earth System Model (NorESM2) and key climate response of CMIP6 DECK, historical, and scenario simulations. Geosci. Model. Dev. 13, 6165–6200. doi: 10.5194/gmd-13-6165-2020
Sellar A. A., Jones C. G., Mulcahy J. P., Tang Y., Yool A., Wiltshire A., et al. (2019). UKESM1: description and evaluation of the U.K. Earth system model. J. Adv. Modeling. Earth Syst. 11, 4513–4558. doi: 10.1029/2019ms001739
Sinet S., von der Heydt A. S., Dijkstra H. A. (2023). AMOC stabilization under the interaction with tipping polar ice sheets. Geophys. Res. Lett. 50, e2022GL100305. doi: 10.1029/2022gl100305
Smeed D., Moat B., Rayner D., Johns W., Baringer M., Volkov D., et al. (2019). Atlantic meridional overturning circulation observed by the RAPID-MOCHA-WBTS (RAPID-Meridional Overturning Circulation and Heatflux Array-Western Boundary Time Series) array at 26N from 2004 to 2018. doi: 10.5285/8cd7e7bb-9a20-05d8-e053-6c86abc012c2
Stock C. A., Dunne J. P., Fan S., Ginoux P., John J., Krasting J. P., et al. (2020). Ocean biogeochemistry in GFDL’s earth system model 4.1 and its response to increasing atmospheric CO2. J. Adv. Modeling. Earth Syst. 12, e2019MS002043. doi: 10.1029/2019ms002043
Stouffer R. J., Yin J., Gregory J. M., Dixon K. W., Spelman M. J., Hurlin W., et al. (2006). Investigating the causes of the response of the thermohaline circulation to past and future climate changes. J. Climate 19, 1365–1387. doi: 10.1175/Jcli3689.1
Swart N. C., Cole J. N. S., Kharin V. V., Lazare M., Scinocca J. F., Gillett N. P., et al. (2019). The canadian earth system model version 5 (CanESM5.0.3). Geosci. Model. Dev. 12, 4823–4873. doi: 10.5194/gmd-12-4823-2019
Swingedouw D., Bily A., Esquerdo C., Borchert L. F., Sgubin G., Mignot J., et al. (2021). On the risk of abrupt changes in the North Atlantic subpolar gyre in CMIP6 models. Ann. N. Y. Acad. Sci. 1504, 187–201. doi: 10.1111/nyas.14659
Takahashi T., Sutherland S. C., Chipman D. W., Goddard J. G., Ho C., Newberger T., et al. (2014). Climatological distributions of pH, pCO2, total CO2, alkalinity, and CaCO3 saturation in the global surface ocean, and temporal changes at selected locations. Mar. Chem. 164, 95–125. doi: 10.1016/j.marchem.2014.06.004
Terhaar J., Frölicher T. L., Joos F. (2022). Observation-constrained estimates of the global ocean carbon sink from Earth system models. Biogeosciences 19, 4431–4457. doi: 10.5194/bg-19-4431-2022
Thorpe R. B., Gregory J. M., Johns T. C., Wood R. A., Mitchell J. F. B. (2001). Mechanisms determining the Atlantic thermohaline circulation response to greenhouse gas forcing in a non-flux-adjusted coupled climate model. J. Climate 14, 3102–3116. doi: 10.1175/1520-0442(2001)014<3102:Mdtatc>2.0.Co;2
Tian H., Yang Q., Najjar R. G., Ren W., Friedrichs M. A. M., Hopkinson C. S., et al. (2015). Anthropogenic and climatic influences on carbon fluxes from eastern North America to the Atlantic Ocean: A process-based modeling study. J. Geophys. Res.: Biogeosci. 120, 757–772. doi: 10.1002/2014jg002760
Tjiputra J. F., Olsen A., Bopp L., Lenton A., Pfeil B., Roy T., et al. (2014). Long-term surface pCO2 trends from observations and models. Tellus. B.: Chem. Phys. Meteorol. 66, 23083. doi: 10.3402/tellusb.v66.23083
Trenberth K. E., Zhang Y., Fasullo J. T., Cheng L. (2019). Observation-based estimates of global and basin ocean meridional heat transport time series. J. Climate 32, 4567–4583. doi: 10.1175/jcli-d-18-0872.1
van Westen R. M., Dijkstra H. A. (2023). Persistent climate model biases in the atlantic ocean’s freshwater transport. EGUsphere [preprint]. Available at: https://doi.org/10.5194/egusphere-2023-1502,2023.
Wang L., Huang J., Luo Y., Zhao Z. (2016). Narrowing the spread in CMIP5 model projections of air-sea CO(2) fluxes. Sci. Rep. 6, 37548. doi: 10.1038/srep37548
Wanninkhof R., Doney S. C., Bullister J. L., Levine N. M., Warner M., Gruber N. (2010). Detecting anthropogenic CO2 changes in the interior Atlantic Ocean between 1989 and 2005. J. Geophys. Res.: Oceans. 115, C11028. doi: 10.1029/2010jc006251
Weijer W., Cheng W., GAruba O. A., Hu A., Nadiga B. T. (2020). CMIP6 models predict significant 21st century decline of the atlantic meridional overturning circulation. Geophys. Res. Lett. 47, e2019GL086075. doi: 10.1029/2019GL086075
Wilbanks T. J., Ebi K. L. (2013). SSPs from an impact and adaptation perspective. Climatic. Change 122, 473–479. doi: 10.1007/s10584-013-0903-4
Yan X., Zhang R., Knutson T. R. (2018). Underestimated AMOC variability and implications for AMV and predictability in CMIP models. Geophys. Res. Lett. 45, 4319–4328. doi: 10.1029/2018gl077378
Yang Q., Dixon T. H., Myers P. G., Bonin J., Chambers D., van den Broeke M. R., et al. (2016). Recent increases in Arctic freshwater flux affects Labrador Sea convection and Atlantic overturning circulation. Nat. Commun. 7, 10525. doi: 10.1038/ncomms10525
Zhang R. (2008). Coherent surface-subsurface fingerprint of the Atlantic meridional overturning circulation. Geophys. Res. Lett. 35, L20705. doi: 10.1029/2008gl035463
Zhang R. (2010). Latitudinal dependence of Atlantic meridional overturning circulation (AMOC) variations. Geophys. Res. Lett. 37, L16703. doi: 10.1029/2010gl044474
Zhang R., Sutton R., Danabasoglu G., Kwon Y. O., Marsh R., Yeager S. G., et al. (2019). A review of the role of the atlantic meridional overturning circulation in atlantic multidecadal variability and associated climate impacts. Rev. Geophys. 57, 316–375. doi: 10.1029/2019rg000644
Zhu C., Liu Z., Zhang S., Wu L. (2023). Likely accelerated weakening of Atlantic overturning circulation emerges in optimal salinity fingerprint. Nat. Commun. 14, 1245. doi: 10.1038/s41467-023-36288-4
Keywords: AMOC, alkalinity, carbon uptake, CMIP6, climate change, subpolar North Atlantic
Citation: Zhang Q, Ito T and Bracco A (2024) Modulation of regional carbon uptake by AMOC and alkalinity changes in the subpolar North Atlantic under a warming climate. Front. Mar. Sci. 11:1304193. doi: 10.3389/fmars.2024.1304193
Received: 29 September 2023; Accepted: 25 March 2024;
Published: 08 April 2024.
Edited by:
Matthias Gröger, Leibniz Institute for Baltic Sea Research (LG), GermanyReviewed by:
Jörg Schwinger, Bjerknes Centre for Climate Research, NorwayJinlin Liu, Tongji University, China
Copyright © 2024 Zhang, Ito and Bracco. This is an open-access article distributed under the terms of the Creative Commons Attribution License (CC BY). The use, distribution or reproduction in other forums is permitted, provided the original author(s) and the copyright owner(s) are credited and that the original publication in this journal is cited, in accordance with accepted academic practice. No use, distribution or reproduction is permitted which does not comply with these terms.
*Correspondence: Qi Zhang, qzhang459@gatech.edu