Brownification in the Eastern Mediterranean Sea: effect of simulated terrestrial input on the planktonic microbial food web in an oligotrophic sea
 Georgia Ktistaki1,2
  Iordanis Magiopoulos1,2
  Gianluca Corno3
  Justine Courboulès4
  Ester M. Eckert3
  Jose González5 Ioanna Kalantzi2
  Mathias Middelboe6
  Katerina Symiakaki2†
  Manolis Tsapakis2
  Francesca Vidussi4
  Paraskevi Pitta2*
- 1Department of Biology, University of Crete, Heraklion, Greece
- 2Institute of Oceanography, Hellenic Centre for Marine Research, Heraklion, Greece
- 3National Research Council of Italy – Water Research Institute (CNR-IRSA) Molecular Ecology Group (MEG), Verbania, Italy
- 4Université de Montpellier, Laboratoire MARine Biodiversity, Exploitation and Conservation(MARBEC), Sète, France
- 5Departamento de Ecoloxía e Bioloxía Animal, Universidade de Vigo, Vigo, Spain
- 6Department of Biology, University of Southern Denmark, Odense, Denmark
Terrestrial input to marine and freshwater ecosystems colors the water yellow-brown, causing a phenomenon called “brownification”. The effect of brownification on the marine pelagic microbial food web was studied in the oligotrophic eastern Mediterranean in June 2021 by adding HuminFeed in a 15-day mesocosm experiment with 2 treatments: Control (C, no addition) and HuminFeed (HF, single dose of HuminFeed, 2 mg L-1); and 3 replicates per treatment. HuminFeed caused shading, leading to a decrease in the abundance of photo-autotrophic organisms (cyanobacteria Synechococcus and diatoms). Bacteria were positively affected by the HF addition (mainly in terms of production rather than abundance), benefiting either directly from the dissolved organic carbon (DOC) contained in HuminFeed or indirectly from the trophic cascade through the food web. Despite the decrease in HF bacterial abundance during the experiment, an increase in both the high nucleic acid containing bacteria% and heterotrophic bacterial production were observed, suggesting higher activity at the single cell level. In the HF treatment, the increased abundance of dinoflagellates observed could be due to either a dominance of mixotrophic species or a release from predation by copepods. Both ciliates and copepods were severely impacted by HuminFeed, showing lower abundance and distorted forms (ciliates) and reduced reproductive potential (copepods). In conclusion, in the ultraoligotrophic eastern Mediterranean, the simulated brownification negatively affected autotrophs and top predators while benefiting bacteria, thus indicating a shift in the structure of the plankton food web.
1 Introduction
Future climate change models predict that the intensity and frequency of extreme rainfall events in the Mediterranean Sea region would rise (Drobinski et al., 2018). Following such an extreme rainfall, large quantities of terrestrial organic matter can be exported into coastal aquatic environments through terrestrial runoff (Meunier et al., 2017).
The inflow of DOC, along with the humic organic substances and iron it contains, color the water yellow-brown; this phenomenon is called “brownification” (Kritzberg and Ekström, 2012; Lebret et al., 2018). Brownification leads to shading, thus affecting the light penetration in the water column. The chromatic aromatic substances, abundant in humic substances, mainly cause the shading because they absorb photosynthetically active radiation (PAR) (Nydahl et al., 2019). Consequently, through the reduction of available light for photosynthetic organisms, brownification affects the primary productivity as it is photo-dependent (Lebret et al., 2018). However, shading might also have an indirect positive effect on photo-autotrophic organisms as it protects them from ultraviolet (UV) radiation (Graneli, 2012). Moreover, shading is expected to favor mixotrophic organisms, compared to the strictly autotrophic ones, as mixotrophs are less reliant on light; they can turn to heterotrophy and do not directly compete for inorganic phosphorus with bacteria (Jones, 2000; Wilken et al., 2018; Fonseca et al., 2022).
In addition, by increasing the concentration of available carbon in the water, brownification may lead to an increase in heterotrophic bacterial production and biomass (Ask et al., 2009). The increase in DOC in the water may also result in increased bacterial respiration and thus to an O2 decrease in the water due to the biological DOC degradation (Fonseca et al., 2022). Moreover, in environments with humic DOC concentrations, heterotrophic bacteria might be more efficient at nutrient assimilation compared to phytoplankton. This may lead, apart from an increase in the secondary production, to an indirect decrease in the primary production too (Ask et al., 2009; Nydahl et al., 2019).
Also, the inflow of DOC, partly consisting of organic acids, might lead to a decrease in pH. This reduction indirectly leads to an increase in free carbon dioxide (CO2) as the balance of the carbon system shifts and the ratio between free CO2, bicarbonate (HCO-3) and carbonate (CO3 -2) in the water changes as well (Nydahl et al., 2019). At the same time, free CO2 is the preferred source of carbon for photosynthetic organisms, so increasing it in the water might boost photosynthesis, especially if combined with an increase in nutrient availability.
Brownification has been extensively studied in freshwater environments (Lebret et al., 2018; Wilken et al., 2018; Nydahl et al., 2019; Calderó-Pascual et al., 2022; Fonseca et al., 2022), and in brackish waters (Lefébure et al., 2013; Meunier et al., 2017; Traving et al., 2017; Paczkowska et al., 2020; Spilling et al., 2022); studies of brownification in marine environments are much fewer (Liess et al., 2016; Soulié et al., 2022; Courboulès et al., 2023). The interactions between brownification on one hand and biological, as well as physical and chemical, processes on the other make its effects difficult to predict, thus its impact may differ depending on the ecosystem and its initial state (Solomon et al., 2015; Spilling et al., 2022).
The Mediterranean Sea, one of the most oligotrophic marine bodies in the world and characterized by an anti-estuarine circulation, has been described as a marine “desert” (Powley et al., 2017). There is a gradient of increasing oligotrophy from the Western to the eastern Basin, the primary productivity being 37-475 gC m-2 y-1 in the western compared to 10-143 gC m-2 y-1 in the eastern part (Coll et al., 2010; Powley et al., 2017). The eastern Mediterranean Sea is P- limited, and the N:P ratio is high (Krom et al., 2005). Heterotrophic organisms tend to dominate the food web in oligotrophic systems while autotrophs are prevalent in more eutrophic environments (Biddanda et al., 2001). Mixotrophs are expected to reach maximum abundance in environments that allow them to be primarily autotrophic then fulfill their nutritional needs by consuming bacteria (Crane and Grover, 2010). In terms of size, oligotrophic systems are characterized by smaller organisms, with picoplankton and nanoplankton dominating the autotrophic biomass and production also in the eastern Mediterranean (Siokou-Frangou et al., 2002).
The goals of this study were to investigate the effect of water coloring and the addition of DOC and nutrients on different planktonic communities of the microbial food web in the oligotrophic environment of the eastern Mediterranean Sea using a mesocosm experimental approach mimicking terrestrial inputs. We hypothesized that: 1) brownification will reduce light and, therefore, negatively affect autotrophic organisms, and 2) brownification will increase the abundance and production of heterotrophic organisms, especially heterotrophic bacteria.
2 Material and methods
2.1 Mesocosm experimental design and sampling
The mesocosm experiment took place at the CretaCosmos) facility of HCMR (on the north coast of Crete, 15 km east of Heraklion, Greece) in June 2021 in the framework of the AQUACOSM project. This experiment was part of a series of several coordinated experiments performed along a salinity and latitudinal gradient (from 59.843N to 63.601N and from 22.969E to 9.550E) to investigate the effects of increasing DOC exports from terrestrial into aquatic systems. All these experiments followed a common experimental design where a pulse disturbance by HuminFeed addition was the only experimental manipulation (Fonseca et al., 2022; Soulié et al., 2022; Spilling et al., 2022).
To fill the mesocosms, water was collected from the north coast of Crete in front of HCMR. Sub-surface coastal water from 1.5 m depth was pumped into several 1 m3 high-density polyethylene (HDPE) barrels, which were transported by truck to the mesocosm facility. The equipment used in this experiment had been washed with HCl (5%) and rinsed three times with deionized water to avoid contamination in the highly oligotrophic conditions of this environment. The water from each of the barrels was evenly distributed among the mesocosms to ensure homogeneity of the initial conditions. Mesocosms were transparent polyethylene bags of 3 m3 each, with a diameter of 1.3 m, submerged in a large concrete tank with a volume of 150 m3, with running water to keep the temperature constant throughout the experiment. A HOBO sensor was installed in each mesocosm at 1 m depth to record temperature and average light intensity (sampling frequency every 10 minutes). All mesocosms were covered with a high transparency Plexiglas lid cover to allow light to pass through and protect it from atmospheric deposition. Mesocosms were filled on June 12th and 13th and then left overnight.
The experimental design comprised 3 x Controls (C) and 3 x HuminFeed (HF) mesocosms. No manipulation was performed in C, while in HF, HuminFeed® was added at a concentration of 2 mg L-1. HuminFeed® is an alkaline extract of the mineral leonardite, typically used as a livestock feed. In this experiment, HuminFeed was used as a source of humic substances (Lebret et al., 2018); however, it is not directly comparable to natural humic compounds (Scharnweber et al., 2021). It contains 7.8 mg g-1 nitrogen (Meinelt et al., 2007) and 0.265 μg phosphorus (mg of added C) -1 (Scharnweber et al., 2021).
The experiment started on the day after the filling (June 14th), and samplings took place from June 14th (day 0) until June 29th (day 15), 2021, between 08:30 and 09:00. On day 0, the first sampling was performed at 9:00 am (local time) to assess the initial experimental conditions. Three hours later, at 12:00 pm, HuminFeed was added to the HF mesocosms, followed by a second water sampling at 17:00 (day 0 + 5 hours). All mesocosms were sampled daily or every other day throughout the 15-day experiment. Samples were syphoned through a silicone tube placed in each mesocosm at 1.5 m depth. Prior to each sampling, a paddle was used to homogenize the water in each mesocosm bag. Also, aeration was achieved by using another silicone tube in each mesocosm.
2.2 Nutrient and chlorophyll analyses
2.2.1 Inorganic nutrients
Inorganic nutrient concentrations were determined spectrophotometrically in the 500 or 200 mL samples collected daily for phosphates, silicates, nitrates, nitrites, and ammonia. The measurement of orthophosphate concentration (PO4-3) was carried out using the MAGIC method (Rimmelin and Moutin, 2005); of silicates (SiO4-4), nitrites (NO2-) and nitrates (NO3-) according to Strickland and Parsons (1972); and of ammonia using the method of Ivančič and Degobbis (1984). Detection limits for phosphate were 0.8 nM, for nitrates and nitrites 0.017 μM, for ammonium 0.019 μM, and for silicate 0.025 μM. All inorganic nitrogen compounds are presented together as dissolved inorganic nitrogen (DIN).
2.2.2 Organic nutrients
Samples of 200 mL for total organic carbon (TOC) analysis were collected daily and transferred into pre-combusted amber glass bottles (480 C, 12 h), acidified with 2 N HCl and stored in the dark at +4 C until analysis. The TOC concentration was measured according to Sempere et al. (2002). For particulate organic carbon (POC) analysis, approximately 1 L of seawater was filtered through pre-combusted glass-fiber filters (Whatman GF/F, 0.7 µm pore size, 25 mm diameter) and analyzed using a Perkin Elmer 2400 CHN Elemental Analyzer following Hedges and Stern (1984). DOC was calculated by subtracting POC from TOC.
2.2.3 Chlorophyll-a
To determine chlorophyll-a concentration, samples of 1 L of seawater were collected during the experiment daily; after filtration through 0.2 µm pore-size polyethylene filters (47 mm diameter), chlorophyll-a (Chla) was extracted in 10 ml of 90% acetone. Its concentration was determined based on its fluorescence by using a fluorometer according to Holm-Hansen et al. (1965).
2.2.4 Photosynthetic pigments
Every other day, water was siphoned from each mesocosm into a 5 L carboy, then an average of two to three liters were filtered through Whatman glass-fiber filters (GF/F 25 mm diameter, 0.7 µm pore size). A low vacuum pump was used in a low light room. The filters were then immersed in liquid nitrogen (-196°C) before being stored in a freezer (-80°C) until their analysis. Due to technical preservation problems, all samples from days 11, 13 and 15, and samples from C1 and C2 from Day 1 were lost; thus, the pigment data of these samples are not considered in this study. Pigments were extracted in 2 mL of 95% MeOH following the protocol described in Vidussi et al. (2011). Extracted pigments were analyzed using a high-performance liquid chromatography (HPLC, Shimadzu) following the Zapata et al. (2000) method. Thirteen pigments are presented in this study. Some of them can be used as chemotaxonomic markers (Roy et al., 2011): chlorophyll-a is an index of total phytoplankton biomass; zeaxanthin is the main accessory pigment of cyanobacteria; fucoxanthin and chlorophyll c2 are contained in diatoms but can also be contained in other chromophytes as some prymnesiophytes and dinoflagellates; chlorophyll b is the main accessory pigment of green flagellates; 19’-Hexanoyloxyfucoxanthin (19HF), chlorophyll c3 and 19’-Butanoyloxyfucoxanthin (19BF) mainly indicate the presence of prymnesiophytes (notably 19HF and chlorophyll c3) and pelagophytes or crysophytes, respectively; alloxanthin is the main accessory pigment of cryptophytes; and peridinin and dinoxanthin are pigments of dinoflagellates. Other pigments, such as diadinoxanthin, β,β-carotene, are photoprotectants and indicate photoacclimation activities (Brunet et al., 2011).
2.3 Plankton analyses
2.3.1 Heterotrophic bacterial production
Heterotrophic bacterial production (HBP) was determined daily using 3H-leucine according to the method described by Kirchman et al. (1986) and modified by Smith and Azam (1992). For each mesocosm, C and HF (1.5 mL) samples in duplicate were mixed with a mixture of L-[4,5 3H]-leucine (Perkin Elmer, 115 Ci msol−1) and non-radioactive leucine up to a final concentration of 20 nM. Afterwards, the samples were incubated at in-situ temperature for 2 h in darkness, after which they were fixed and treated following the micro-centrifugation protocol (Smith and Azam, 1992) described by Van Wambeke et al. (2008). Briefly, after 2 h, the incubations were terminated by adding trichloroacetic acid (TCA). Then, the samples were centrifuged at 16,000 × g and the resulting cell pellet was washed twice using 5% TCA and 80% ethanol. The incorporation of 3H-leucine into the TCA-insoluble fraction was measured by liquid scintillation counting (Packard Tri-Carb 4000TR) after the resuspension of the cell pellet in a scintillation cocktail (Ultima-Gold). Heterotrophic bacterial production was calculated using 3H-leucine incorporation rates according to the Kirchman et al. (1986) method. An analytical error of <10% of duplicate incubations was estimated. Also, concentration kinetics optimization was performed to secure a linear uptake during the incubation time, and the bacterial leucine uptake was not limited by the concentration of leucine.
2.3.2 Picoplankton
Samples were collected daily during the experiment, and the cyanobacteria and heterotrophic bacteria were counted on a FACSCaliburTM flow cytometer (Becton Dickinson) with an air-cooled argon laser (488 nm) according to Marie et al. (2000). The flow rate of the instrument was measured daily, before and after the analysis of the samples. To calculate the abundance of organisms, the average of the two flow rates recorded for each day and the recorded number of cells were used. The counting software used was the CellQuest Pro package (Becton Dickinson).
Synechococcus cells were counted (5 minutes at high speed) without any manipulation (staining or fixation) of their natural fluorescence. The analysis was performed within a few hours after sampling. The abundance of Synechococcus was converted to biomass using the conversion factor of 250 fg C cell-1 (Kana and Glibert, 1987).
Heterotrophic bacteria were fixed with glutaraldehyde (25%, filtered through 0.2 μm pore filters, final concentration of 0.5%) and placed in 2 mL cryovials. They were then stirred and placed in the refrigerator (4°C) for 30 minutes and further immersed in liquid nitrogen (-196°C). The next day, the samples were transferred to the deep freezer (-80°C) until their analysis about 5 months after the end of the experiment. Prior to analysis, samples were thawed at room temperature, followed by vortex stirring and staining of the genetic material of heterotrophic bacteria with SYBR Green I at a final concentration of 5 × 10⁻⁴% of the solution. The samples were then incubated at room temperature in the dark for 10 minutes and stirred again using vortex; the counting of the samples took 1 minute at medium speed. Heterotrophic bacteria were then categorized into high nucleic acid (HNA) and low nucleic acid (LNA) bacteria. This grouping is based on the different fluorescence intensities of FL1 and the sideward scatter signals (SSC) detected by the cytometer in combination with their nucleic acid staining. Fluorescence intensity is used as an indicator of cellular nucleic acid content, and SSC is used as an indicator of their cell size (Lebaron et al., 2001). The abundance of heterotrophic bacteria was converted to biomass using the conversion factor of 20 fg C cell-1 (Lee and Fuhrman, 1987).
2.3.3 Nanoplankton
Samples (20 or 30 mL) intended for counting pigmented (PNF) and heterotrophic nanoflagellates (HNF) were collected every other day and fixed with formaldehyde at a final concentration of 5% then kept in the dark at 4°C. Flagellates were first concentrated in ca. 10 mL on 25 mm diameter, 0.8 μm pore-sized black polycarbonate filters, stained with 4′6- diamidino-2-phenylindole (DAPI: 1 μg mL−1) for 10 min, and finally collected on the filter (Porter and Feig, 1980). Afterwards, the filters were placed on microscope slides and stored frozen (−20°C). PNF and HNF were examined on at least 50 fields at 1,000× magnification, using UV and blue excitations under an Olympus BX60 epifluorescence microscope. All cells were sized using an ocular micrometer and divided into categories, depending on size: PNFs <1 μm and >1 μm and HNFs <3 μm, 3-5 μm, and >5 μm. Assuming approximate geometric shapes, the biovolume was calculated using the formula V = (π × W2 × L)/6, where L and W are the length and width of each cell in μm, respectively. The biovolume was converted to carbon biomass according to the factor proposed by Caron et al. (1995): 183 fg C μm−3.
2.3.4 Microplankton
Microplankton water samples were fixed with Lugol acid solution at a final concentration of 4% of the sample every other day. The samples were then stored in the refrigerator (4°C) until counting.
The organisms were counted using the method described by Utermöhl (1958). Initially, 100 mL of each sample was placed in the tube and left to sediment for at least 18 hours. The cells were then counted using an Olympus IX70 inverted microscope (at ×150 magnification) with a built-in BASLER camera. Diatoms, dinoflagellates, and ciliates were identified down to genus level, or species level where possible, and their abundance was measured.
2.3.5 Mesozooplankton
Every other day, zooplankton samples (9 to 10 L) were filtered through 200 µm to determine the zooplankton diversity and abundance.
All samples were fixed with buffered formaldehyde with a 4% final concentration (Postel et al., 2000). For the analysis, samples were rinsed well; copepods were identified to genus level, and copepods nauplii and eggs were counted using a ZEISS Stemi 305 Stereoscope.
2.4 Statistical analysis
A repeated measures ANOVA (RM-ANOVA) was used to compare the variable values between the C and HF mesocosms. The grouping factor was the “treatment” (HF and C), and “day” (days 0–15) was treated as a repeated measure, i.e., treatment was considered the between-subjects’ factor, and day the within-subjects factor. Assumptions for normality and sphericity were checked. When the normality assumption of the RM-ANOVA could not be met even after transforming the data, but the sphericity assumption was met, an RM-ANOVA was performed. RM-ANOVA was chosen as it is generally robust to non-normality when the sphericity assumption is met (Blanca Mena et al., 2023). The significance level was set at 0.05, and any p-value smaller or equal to this threshold was considered significant. All statistical analyses were performed using R.
3 Results
3.1 Temperature and light
The water temperature fluctuated between 20.69 and 21.92°C throughout the experiment, with no differences between the two treatments (R.M. ANOVA: F= 0.54, p>0.05, Figure 1A). Mean light intensity, on the other hand, was significantly lower (mean 26.1%) in the HF treatment compared to C (R.M. ANOVA: F=14.393, p<0.01) for the duration of the experiment (Figure 1B).
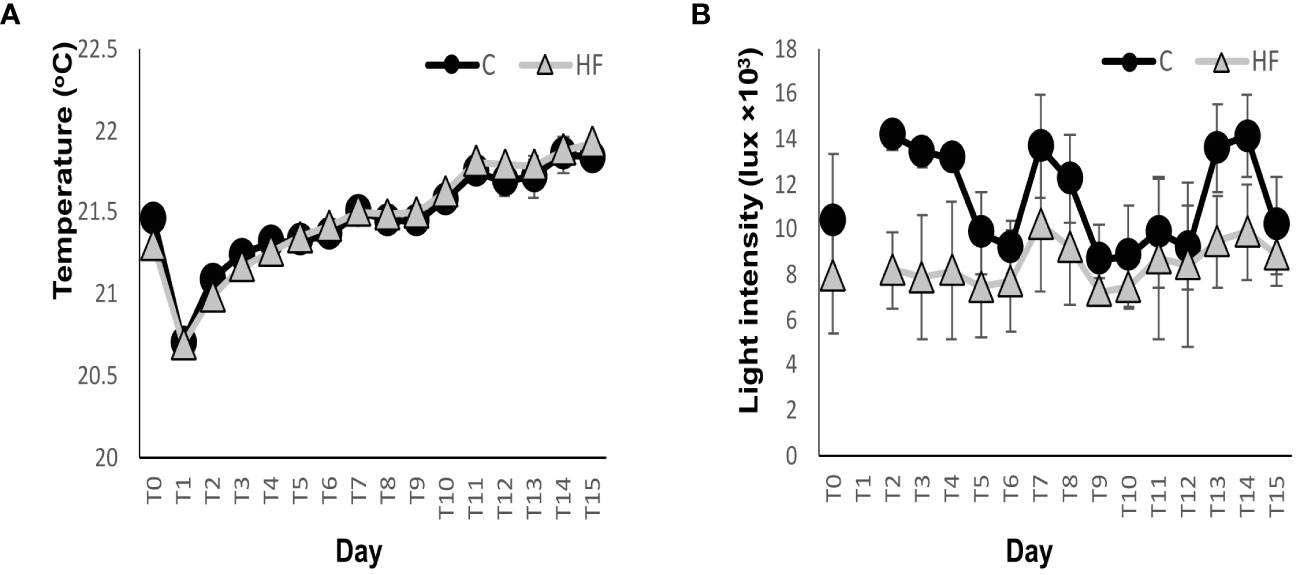
Figure 1 (A) Mean temperature and (B) average light intensity throughout the mesocosm experiment, data from day 1 were excluded from the graph since the mesocosms were covered that day. C = Control mesocosms (no addition), HF = mesocosms where HuminFeed was added once, on the first day of the experiment. Data are mean ± SD of three replicates.
3.2 Nutrient and photosynthetic pigment analyses
3.2.1 Inorganic nutrients
In the HF treatment, after the HuminFeed addition from day 1 to day 11, the concentration of DIN was significantly higher than in C. The DIN concentration initially increased slightly in HF on day 1 then gradually decreased until the end of the experiment with fluctuations (R.M. ANOVA: F=32.74, p<0.01, Figure 2A). In the control C, a sharp decrease of DIN concentration was recorded on day 1 (0.21 ± 0.01 Mμ), remained at low levels until day 7, and then gradually increased to levels similar to that of the HF treatment until the end of the experiment.
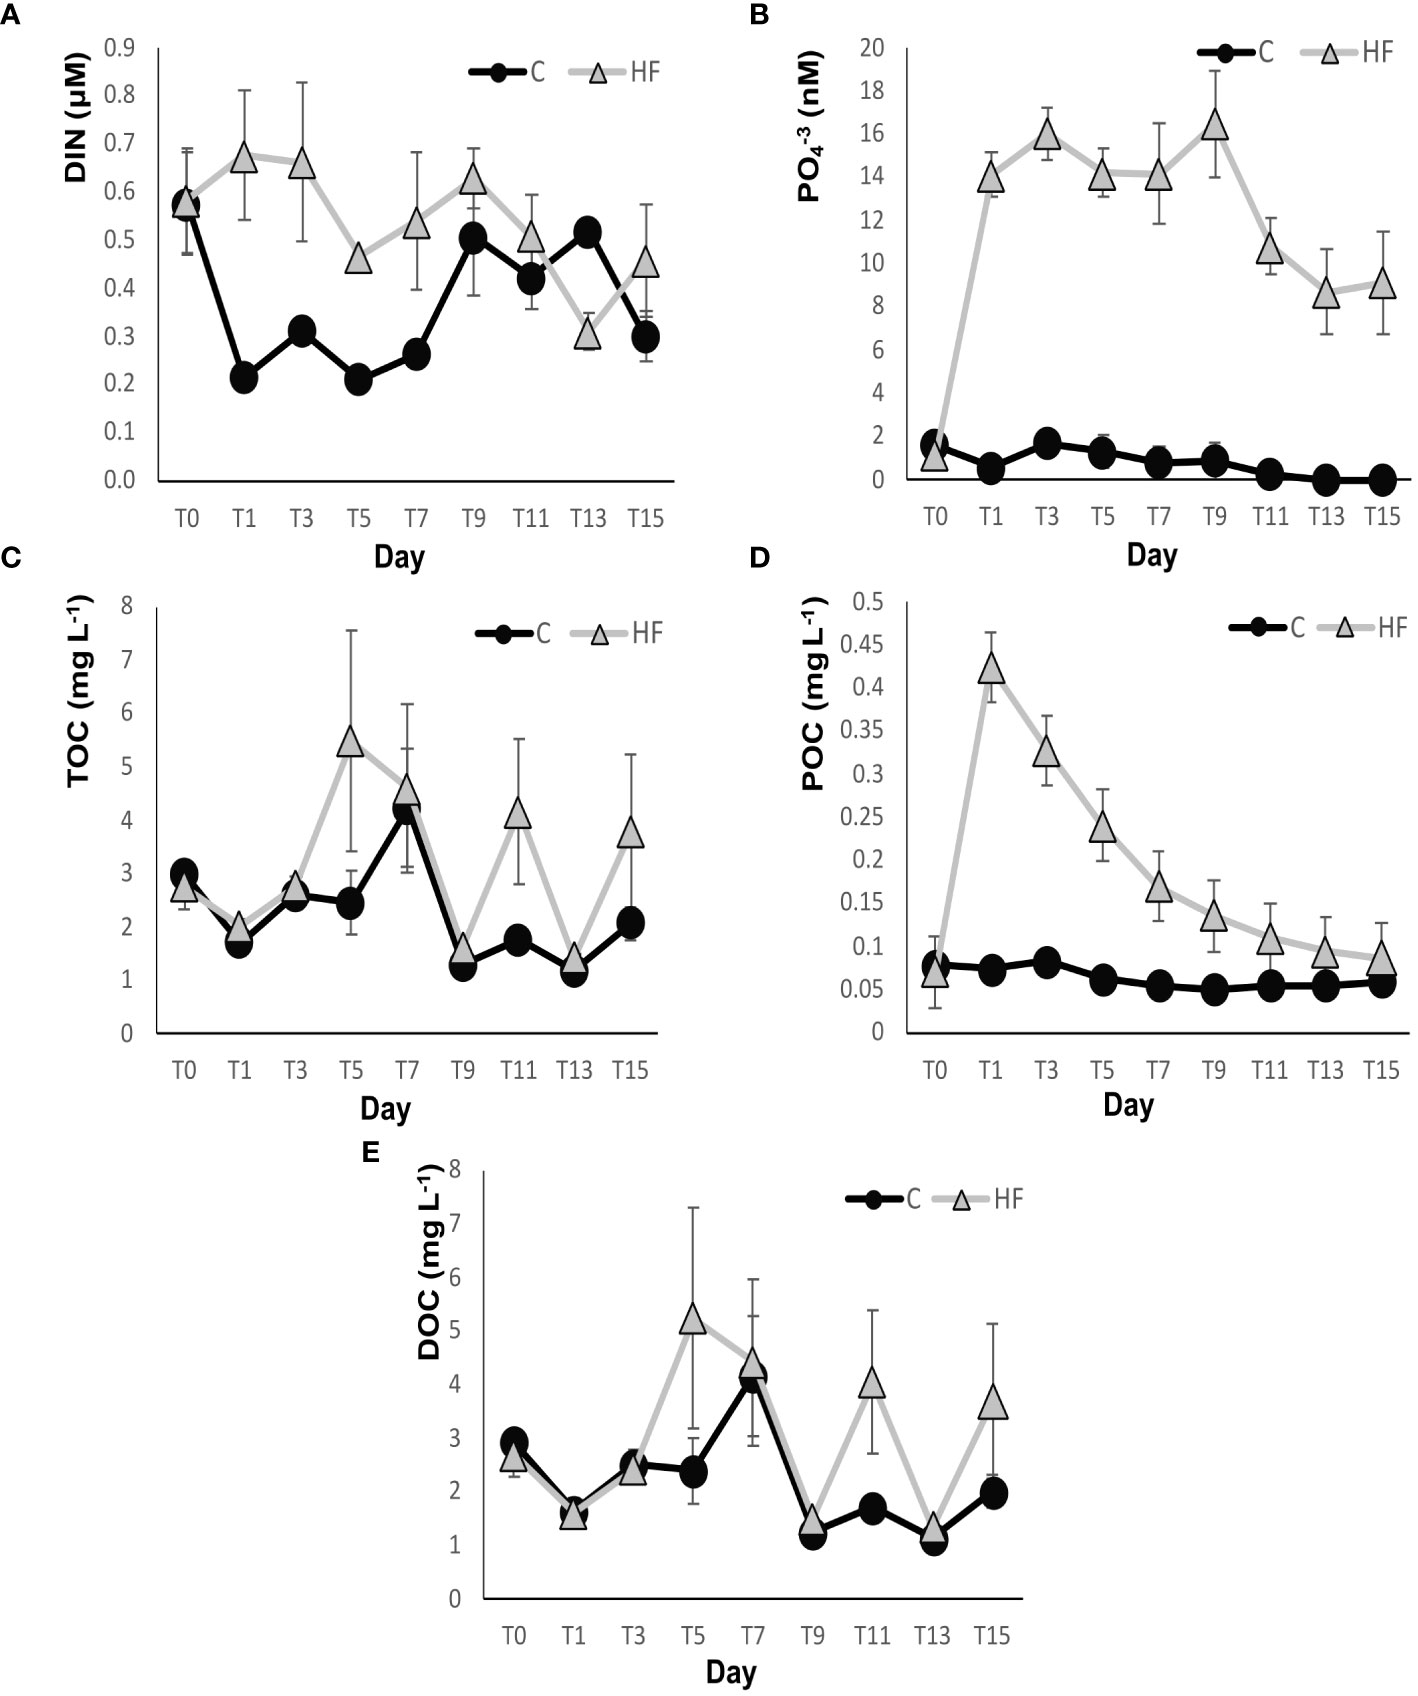
Figure 2 Concentrations of (A) DIN (dissolved inorganic nitrogen), (B) PO4-3, (C) TOC (total organic carbon), (D) POC (particulate organic carbon) and (E) DOC (dissolved organic carbon) throughout the experiment. C = Control mesocosms (no addition), HF = mesocosms where HuminFeed was added once, on the first day of the experiment. Data are mean ± SD of three replicates.
The phosphate concentration (PO4-3) was significantly higher in HF than in C from day 1 until the end of the experiment (R.M. ANOVA: F=657.1, p<0.01, Figure 2B). It showed a sharp increase in HF one day after the addition of HuminFeed in the water and remained high for the first 9 days of the experiment (the maximum value was detected on day 9, 16.47 ± 2.35 nM), then gradually decreased. In C, the PO4-3 concentration remained low throughout the experiment and did not change significantly until the last two days of the experiment, when it was below the detection limit. The maximum value recorded in the C treatment was 1.67 ± 0.41 nM on day 3.
3.2.2 Organic nutrients
TOC fluctuated in both experimental treatments during the mesocosm experiment (Figure 2C). Its concentration was different on specific days; e.g., on days 5 and 11, values were higher in HF (R.M. ANOVA: F=10,67, p<0.01). The highest concentration of TOC in the HF treatment was recorded on day 5 (5.48 ± 2.06 mg L-1), while in C on day 7 (4.23 ± 1.11 mg L-1). POC showed a sharp increase in the HF treatment (from 0.07 ± 0.01 to 0.42 ± 0.012 mg L-1) one day after the addition of HuminFeed to the mesocosms and had higher levels than in the control from day 1 until the end of the experiment (R.M. ANOVA: F=1235 p<0.01, Figure 2D). After day 1, a gradual decrease of POC was recorded in HF until the last day of the experiment, when its concentration was 0.09 ± 0.004 mg L-1. Finally, DOC dominated TOC; consequently it showed significant fluctuations similar to TOC in both experimental treatments throughout the experiment (R.M. ANOVA: F=8.11, p<0.01, Figure 2E). The highest DOC concentration in the HF treatment was recorded on day 5 (5.24 ± 2.04 mg L-1), while in the C, it was 4.17 ± 1.11 mg L- 1 on day 7.
3.2.3 Chlorophyll-a
In the HF treatment, chlorophyll-a concentration showed a slight decrease on day 1 and then increased again sharply, with a maximum value of 0.261 μg L-1 on day 2. A smaller decrease was recorded on day 3, followed by a small increase again on the next day (4), after which a sharp decrease was observed until day 11 and it remained relatively low until the end of the experiment. In the C treatment, chlorophyll-a concentration increased during the first two days of the experiment, reaching a maximum value of 0.251 μg L-1 on day 2 (Figure 3A). Subsequently, a sharp decrease was observed until day 7; it then remained stable but in relatively low levels until the end of the experiment. No significant differences were observed between the two experimental treatments HF and C (R.M. ANOVA: F= 0.378, p>0.05).
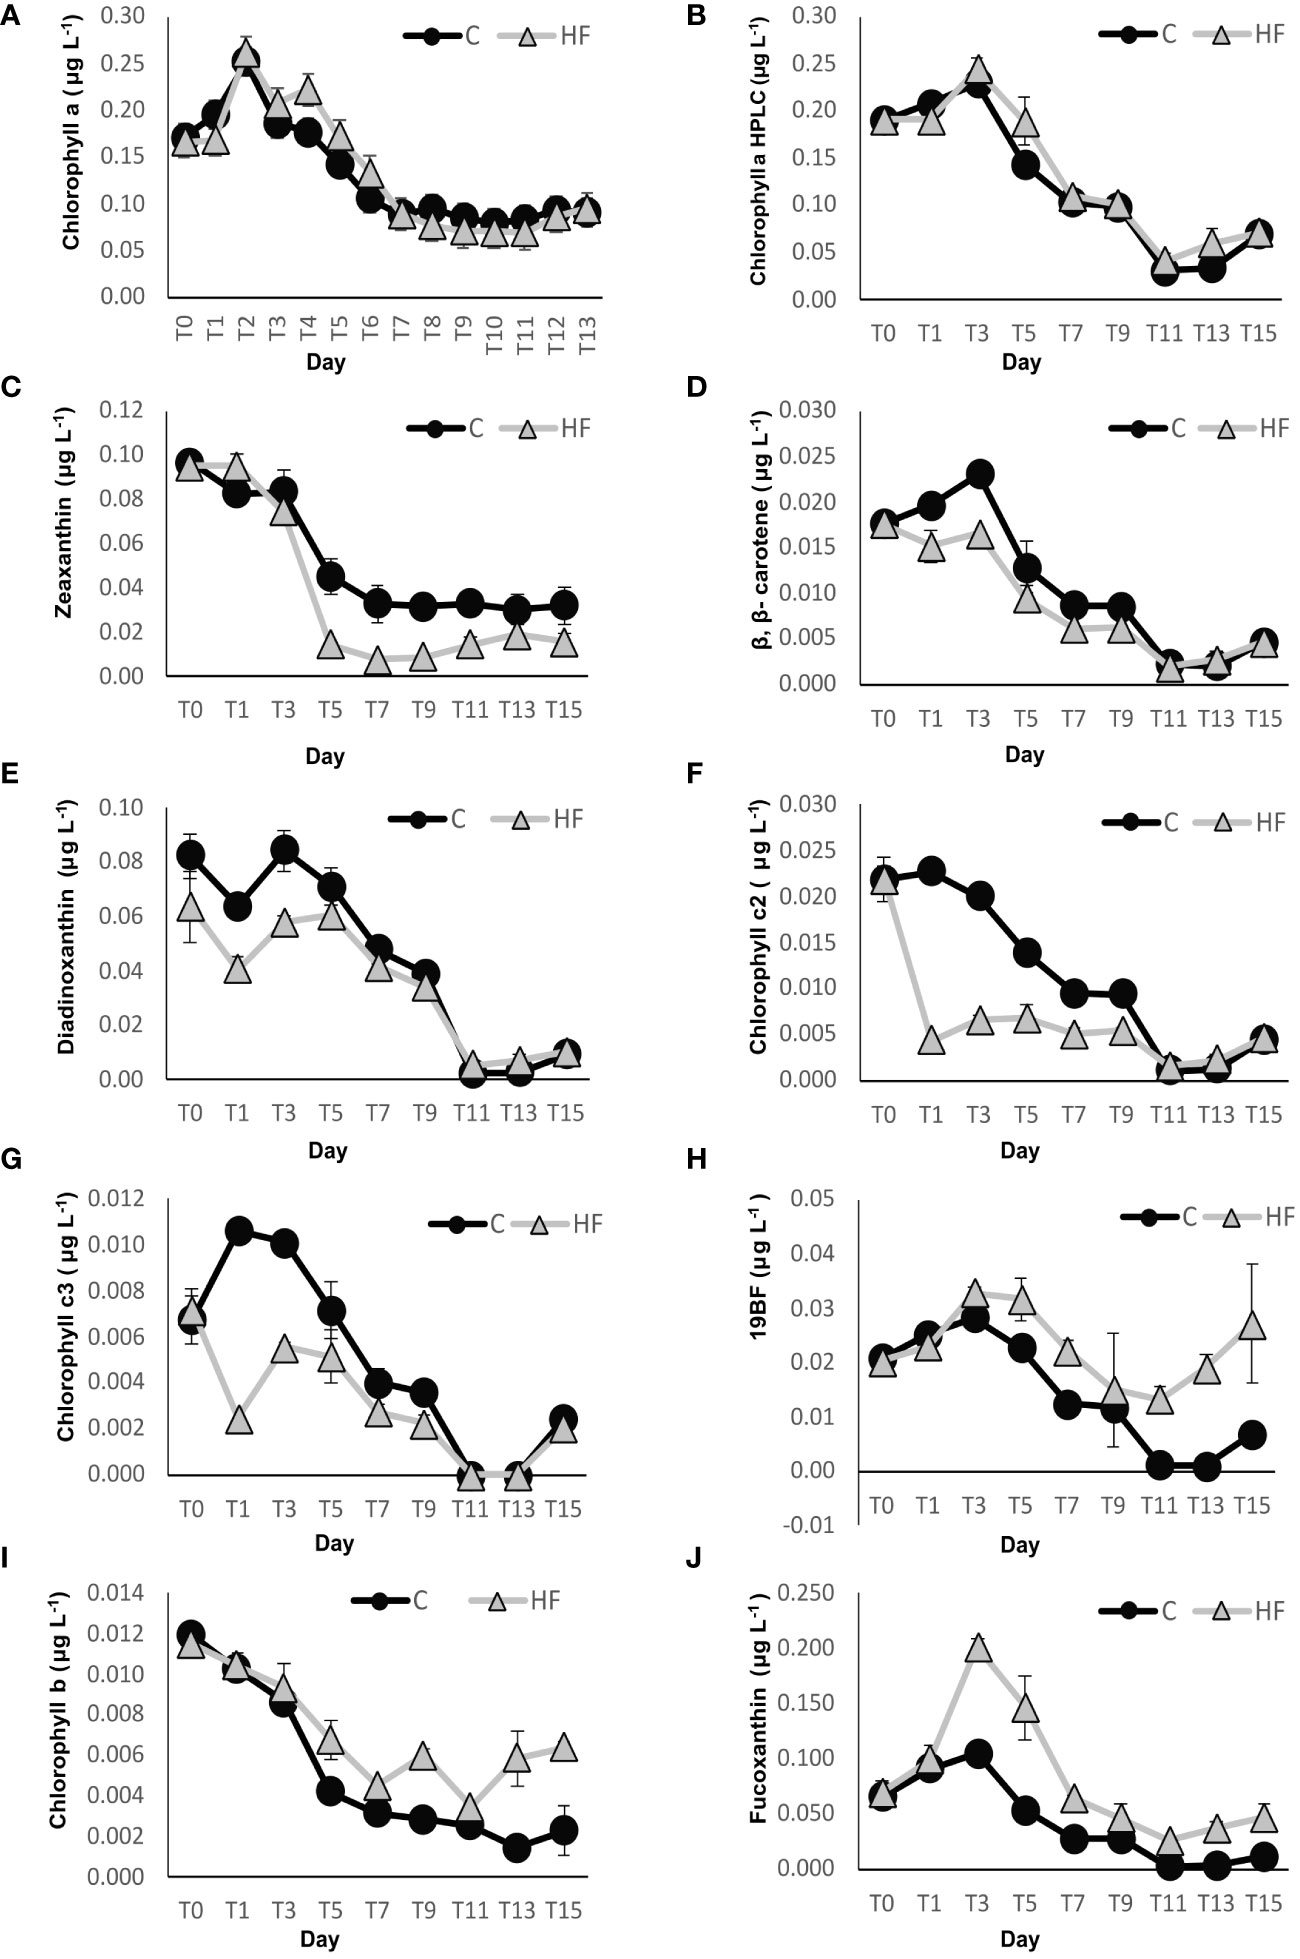
Figure 3 Concentration of (A) chlorophyll a (using the Holm-Hansen et al., 1965 method), (B) chlorophyll a (using the HPLC method), (C) zeaxanthin, (D) β,β-carotene, (E) diadinoxanthin, (F) chlorophyll c2, (G) chlorophyll c3, (H) 19’-Butanoyloxyfucoxanthin (19BF), (I) chlorophyll b, and (J) fucoxanthin throughout the experiment. C = Control mesocosms (no addition), HF = mesocosms where HuminFeed was added once, on the first day of the experiment. Data are mean ± SD of three replicates.
3.2.4 Photosynthetic pigments
During the present study, thirteen pigments were found (Figures 3B-J); among them, those that have a chemotaxinomic interest: chlorophyll-a, zeaxanthin, chlorophyll c3, chlorophyll c2, fucoxanthin, chlorophyll b, 19HF, alloxanthin, peridinin, 19BF, and dinoxanthin; and those that are photoprotectants – diadinoxanthin, β,β-carotene. Results showed that pigments responded in three ways: those showing the negative effect of the HuminFeed addition, those showing the positive one, and those that showed no clear effect.
Five pigments showed lower concentrations in the HF treatment compared to C during most days of the experiment: zeaxanthin, β,β-carotene, diadinoxanthin, chlorophyll c2 and chlorophyll c3. Among them, zeaxanthin (Figure 3C), β,β-carotene (Figure 3D) and diadinoxanthin (Figure 3E) concentrations followed a similar trend in both treatments during the entire experiment. However, over the whole experimental period (day 1 to day 15), the zeaxanthin concentrations were significantly lower in the HF treatment compared to C (R.M. ANOVA: F=64.64, p<0.01). B, β-carotene, and diadinoxanthin concentrations were lower in HF from day 1 to 9, after which their concentrations were similar in both treatments. The concentrations were significantly different (R.M. ANOVA: F=25.72, p<0.01 and R.M. ANOVA: F=11.58, p<0.01, respectively.) In the HF treatment, the concentration of chlorophyll c2 (Figure 3F) and c3 (Figure 3G) dropped sharply the day after the addition of HuminFeed then increased before decreasing again until day 11, and then increased again until the end of the experiment. The concentrations of chlorophyll c2 and c3 were significantly lower in the HF treatment than in the control (R.M. ANOVA: F=191.63, p<0.01 and R.M. ANOVA: F=42.35, p<0.01).
The pigments that showed a positive effect, i.e., concentrations higher in the HF treatment compared to C during most days of the experiment, were 19BF, chlorophyll b and fucoxanthin. The concentrations of 19BF (Figure 3H) for both treatments increased until day 3, then decreased until day 9; after which both concentrations started to increase again. HF’ concentrations were significantly higher in HuminFeed treatment throughout the experiment (R.M. ANOVA: F=39.89, p<0.01). In both HF and C, chlorophyll b concentration (Figure 3I) showed a similar trend during the first 7 days of the experiment. However, in the HF treatment, it increased at the end of the experiment (day 9 to 15), while in the control, it decreased until day 15. Specifically, over the whole experimental period, chlorophyll b concentrations were significantly different between the treatments (R.M. ANOVA: F=75.38, p<0.01). Fucoxanthin concentrations (Figure 3J) followed the same trend in the two treatments –an increase during the first three days followed by a decrease until the end of the experiment. However, the increase of fucoxanthin concentrations in the HF treatment were statistically higher than in the C treatment (R.M. ANOVA: F=130.41, p<0.01). The maximum concentration of fucoxanthin attained was 0.202 ± 0.006 μg L-1 on day 3 in the HF treatment and on that day, it was the most concentrated accessory pigment observed, while the minimum fucoxanthin concentration was 0.011 ± 0.001 μg L-1 on day 15 in C.
Lastly, the other pigments – peridinin, dinoxanthin, 19HF, and alloxanthin – were not significantly different between HF and the control over the entire experimental period, and no clear effect of the HuminFeed addition was observed (Supplementary Figures S2A-D).
3.3 Plankton analyses
3.3.1 Heterotrophic bacterial production and picoplankton abundance
Heterotrophic bacterial production (HBP) fluctuated a lot with time in both experimental treatments (Figure 4). Throughout the experiment, HBP was statistically higher in HF compared to C (R.M. ANOVA: F=326.81, p<0.01). In both treatments, there was a HBP increase after the addition of HuminFeed followed by an important decrease until day 5. Subsequently, values remained stable in the control, while in HF there was a gradual increase until days 9-10 with some fluctuations.
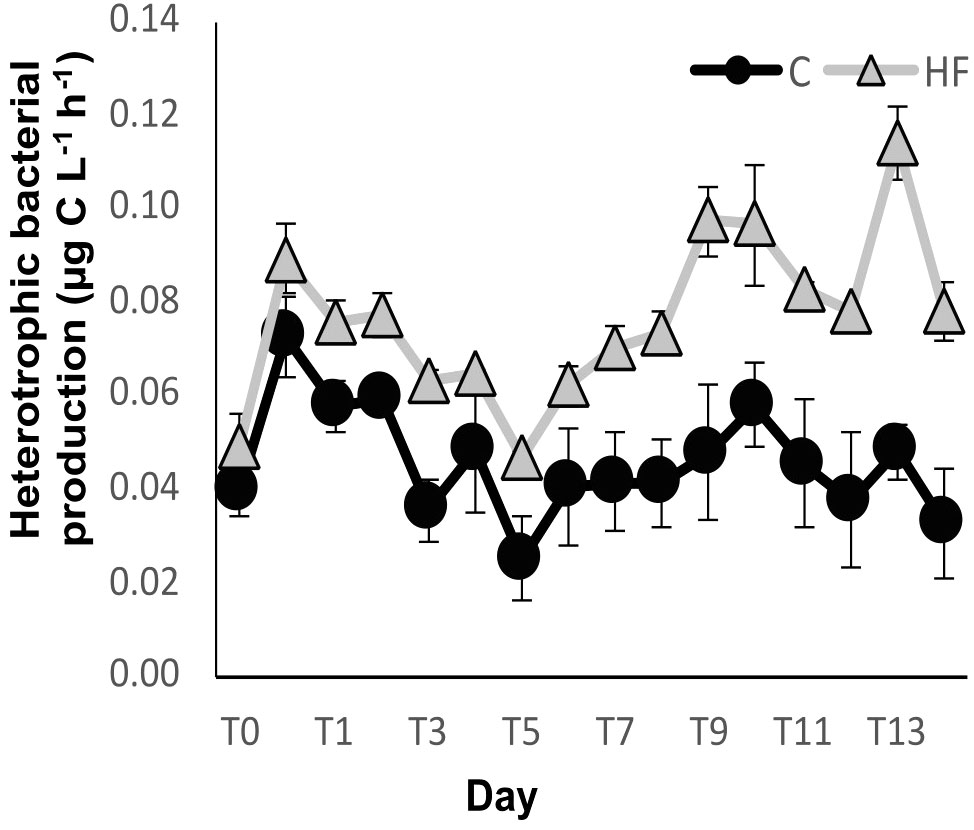
Figure 4 Heterotrophic bacterial production during the mesocosm experiment. C = Control mesocosms (no addition), HF = mesocosms where HuminFeed was added once, on the first day of the experiment. Data are mean ± SD of three replicates.
In the HF treatment, the abundance of heterotrophic bacteria was significantly higher compared to C until day 5, followed by similar abundances in the two treatments until the end of the experiment (R.M. ANOVA: F=13.54, p<0.01, Figure 5A). Their abundance gradually decreased in both experimental treatments by day 5 then increased until day 8, followed by a slight decrease until the end of the experiment. The percentage of HNA heterotrophic bacteria was higher in the HF treatment from day 2 to the end of the experiment, and significantly higher than in the control from day 3 onwards (R.M. ANOVA: F=1239.4, p<0.01, Figure 5B). Initially, the percentage in HF was stable until day 3 and then increased until day 9, after which it remained stable. In C, a moderate decrease in percentages was observed until day 8, followed by a sharp increase on day 9 and steady values until the end of the experiment.
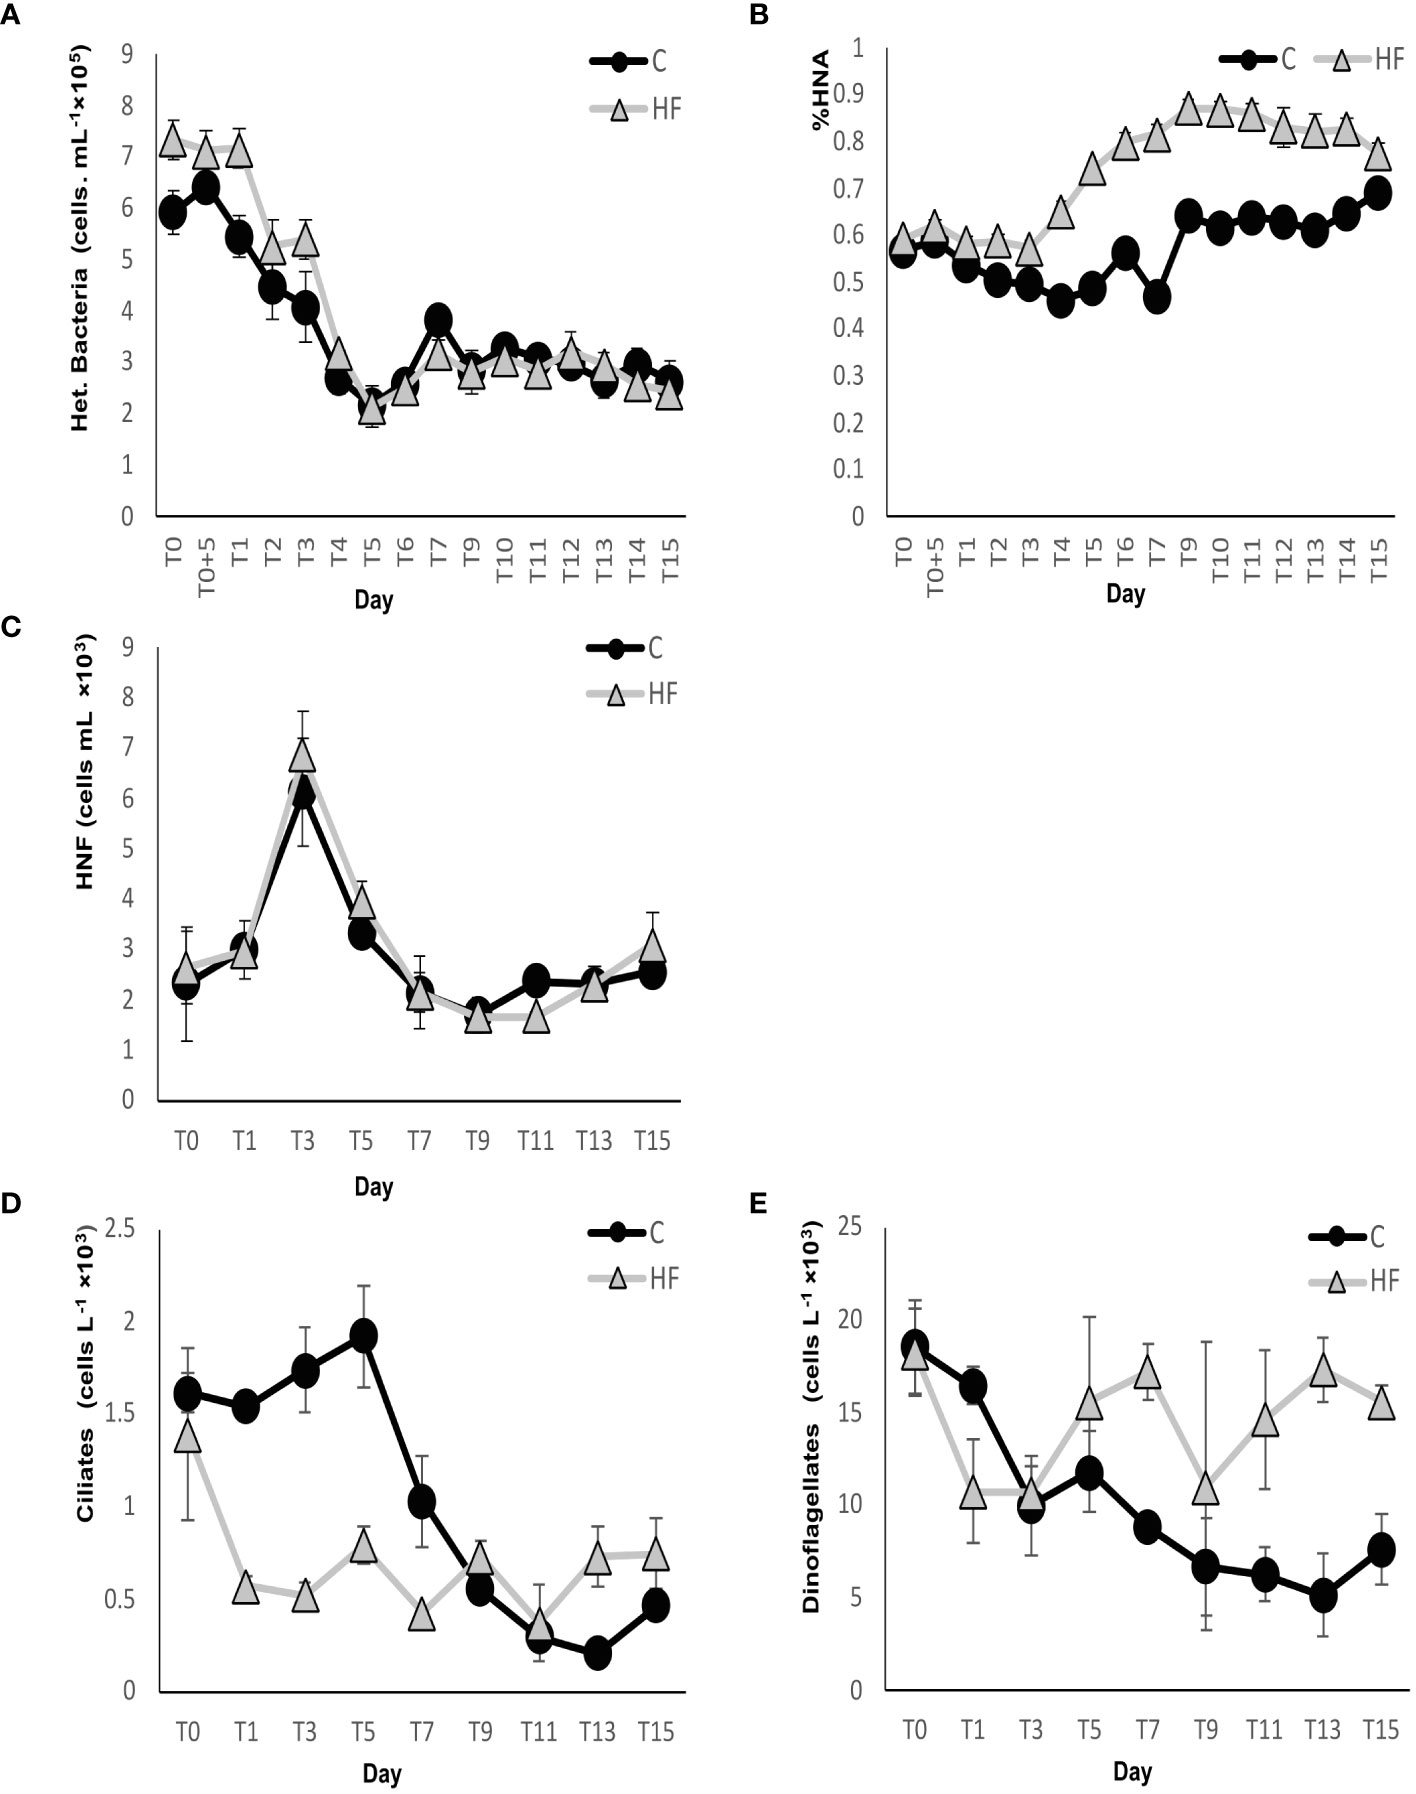
Figure 5 (A) Heterotrophic bacterial abundance, (B) percentage of High bacteria (HNA), (C) heterotrophic (HNF) nanoFlagellates, (D) ciliate abundance and (E) dinoflagellate abundance during the mesocosm experiment. C = Control mesocosms (no addition), HF = mesocosms where HuminFeed was added once, on the first day of the experiment. Data are mean ± SD of three replicates.
Synechococcus cyanobacteria were significantly less abundant in HF compared to C from day 1 to day 3 (R.M. ANOVA: F=8.66, p<0.01, Figure 6A), but did not show significant differences in the two treatments until the end of the experiment. In the C treatment, Synechococcus abundance increased in the first days of the experiment (maximum value on day T0 + 5h, 4 × 10⁴ ± 2227 cells mL-1) then a gradual decrease was observed until day 6, after which the abundance remained at very low values until the end of the experiment. In contrast, in the HF treatment, a gradual decrease was recorded immediately after the start of the experiment until day 6 and remained very low until the end of the experiment.
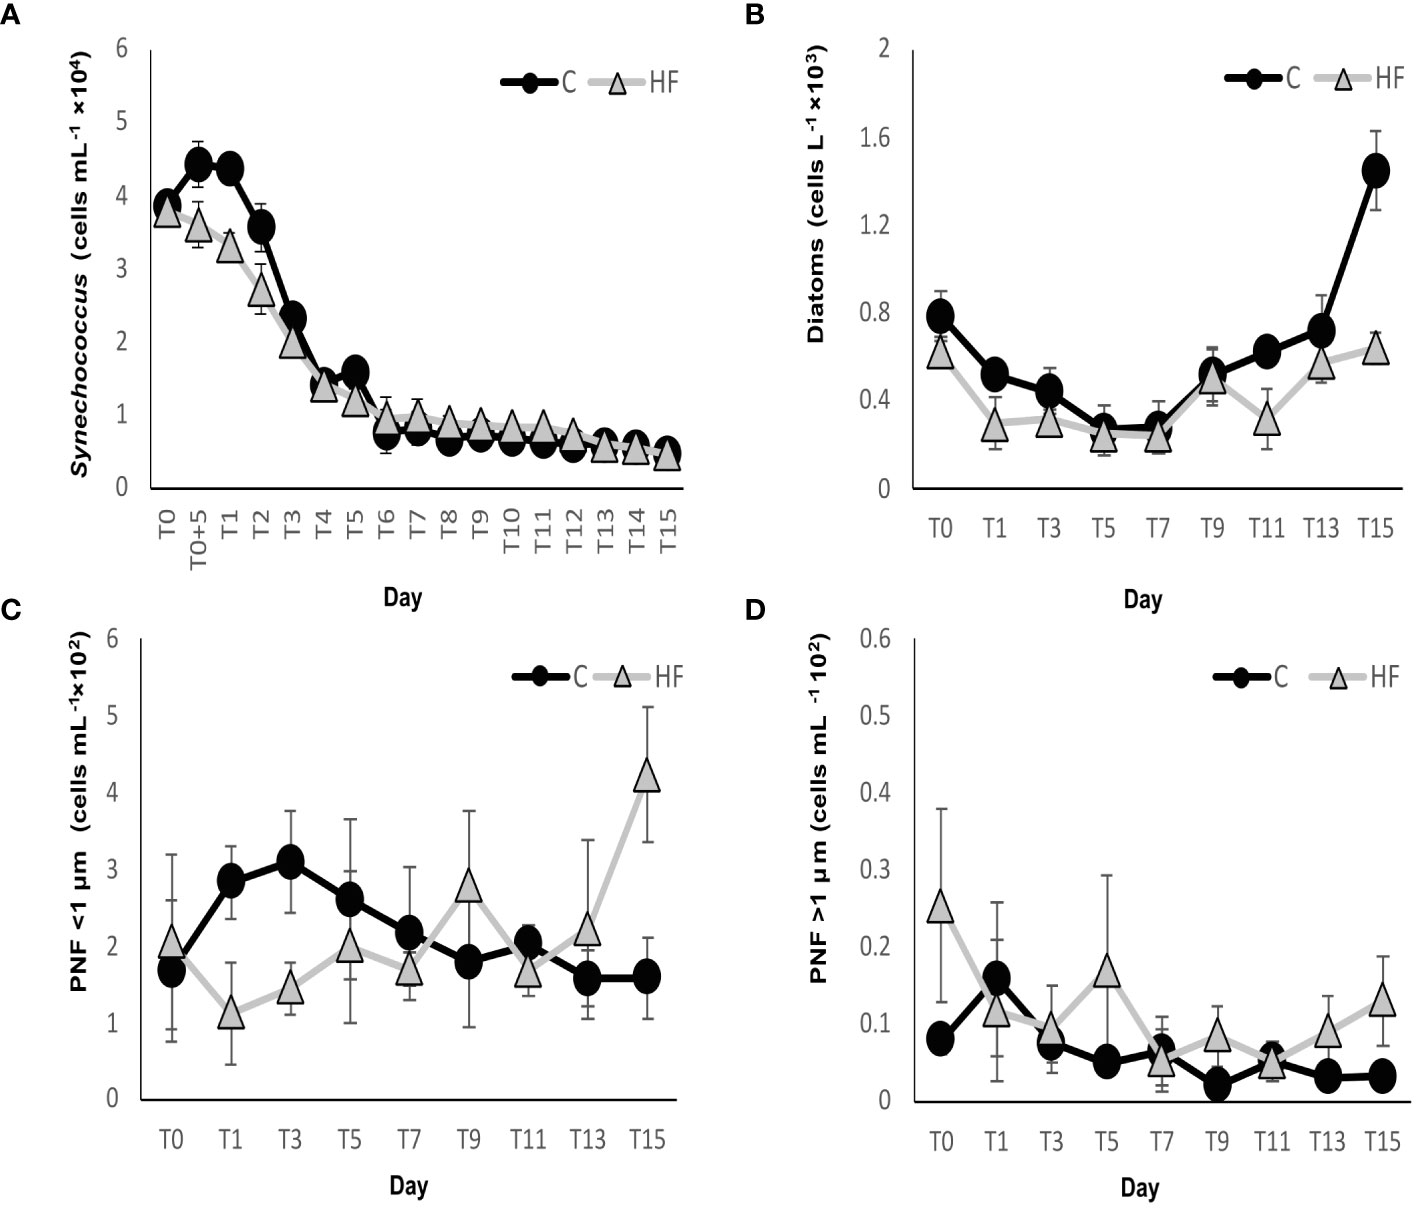
Figure 6 (A) Synechococcus, (B) diatom, (C) pigmented (PNF) nanoFlagellates <1 μm and (D) pigmented (PNF) nanoFlagellates >1 μm abundances during the mesocosm experiment. C = Control mesocosms (no addition), HF = mesocosms where HuminFeed was added once, on the first day of the experiment. Data are mean ± SD of three replicates.
3.3.2 Nanoplankton
Small size (<1 μm) PNFs had a lower abundance in HF compared to C until day 7, but then, on days 9, 13 and 15, a higher abundance was observed in the HF treatment (R.M. ANOVA: F=0.02, p>0.05, Figure 6C). In C, a gradual increase was observed until day 3 (max abundance of 309 ± 66 cells mL-1), followed by a decrease until the end of the experiment. In HF, PNF <1 μm abundance slightly decreased on the first day of the experiment, after the HuminFeed addition, followed by a gradual increase until day 9, a second small decrease on day 11, and a final increase towards the last days of the experiment (max value on day 15, 423 ± 88 cells mL-1). The abundance of PNFs larger than 1 μm was significantly higher in HF on most days of the experiment (R.M. ANOVA: F = 9.32, p<0.01, Figure 6D). In C, they increased on day 1 (max value, 16 ± 10 cells mL-1), and then gradually decreased and remained at low levels until the end of the experiment. In HF, their abundance fluctuated during the experiment. Their maximum abundance was recorded on day 0 (25 cells ±12 mL-1).
HNFs showed no significant differences in the two experimental treatments (R.M. ANOVA: F = 0.88 p>0.05, Figure 5C). In both treatments, their abundance increased until day 3, when the maximum values were recorded (6119 ± 1064 and 6866 ± 861 cells mL-1, respectively). After day 3, their abundance decreased until day 9, followed by a small increase until day 15.
3.3.3 Microplankton
The abundance of diatoms showed a similar fluctuation in the two experimental treatments during the experiment: A decrease in the abundance was recorded until day 7 followed by an increase until the end of the experiment (Figure 6B). Diatoms in HF were less abundant on all days of the experiment, and a statistically significant difference with the C treatment was found (R.M. ANOVA: F= 26.3, p<0.01). The maximum diatom abundance of 1,447 ± 179 cells L-1 was recorded in C on day 15, while in HF on day 0 (787 cells L-1). The most abundant genera in both treatments were Nitzschia, Thalassionema, and Navicula.
In HF, the initial abundance of dinoflagellates of 18,290 ± 2,336 cells L-1 decreased until day 3 then increased until day 7, after which it fluctuated until the end. Starting from an initial abundance of 18,556 ± 2,299 cells L-1, dinoflagellate abundance steadily decreased in C until the end of the experiment (Figure 5E). Significant differences between treatments were observed (R.M. ANOVA: F= 42,34, p<0.01). The groups of Gymnodiniales <10 μm and >10 μm were the most abundant in the two experimental treatments. Other abundant genera were Prorocentrum and Ceratium.
Ciliates showed statistically lower abundances in HF compared to C until day 7 (R.M. ANOVA: F= 34.07, p<0.01, Figure 5D), while from day 9 onwards, their abundance was higher in the HF treatment. In C, ciliate abundance increased by day 5 but then decreased sharply until the end of the experiment. In HF, their abundance decreased sharply from day 0 to day 1 but remained very low until the end of the experiment. The most abundant genera observed in both treatments were Strombidium and Strobilidium. The contribution of small ciliate species (<30 μm) to total ciliate abundance, both in C and HF, increased during the first days of the experiment (maximum contribution on day 5). Subsequently, in C, it decreased until day 13 then, on day 15, an increase was recorded. However, in the HF treatment, their abundance decreased after day 5 to close to zero values. In the last days of the experiment, ciliates showed different qualitative characteristics in the two experimental treatments as in the HF treatment, a mostly altered form was observed.
3.3.4 Zooplankton
Copepod abundance was significantly lower in HF throughout the experiment (R.M. ANOVA: F = 1020.74 and p<0.01, Figure 7A). In C, abundance increased from the start of the experiment, reached the maximum value on day 5 (15,855 ± 476 individuals m-3), and then gradually decreased. In contrast, the abundance of copepods in HF began to decrease immediately after the start of the experiment and was almost zero by the end.
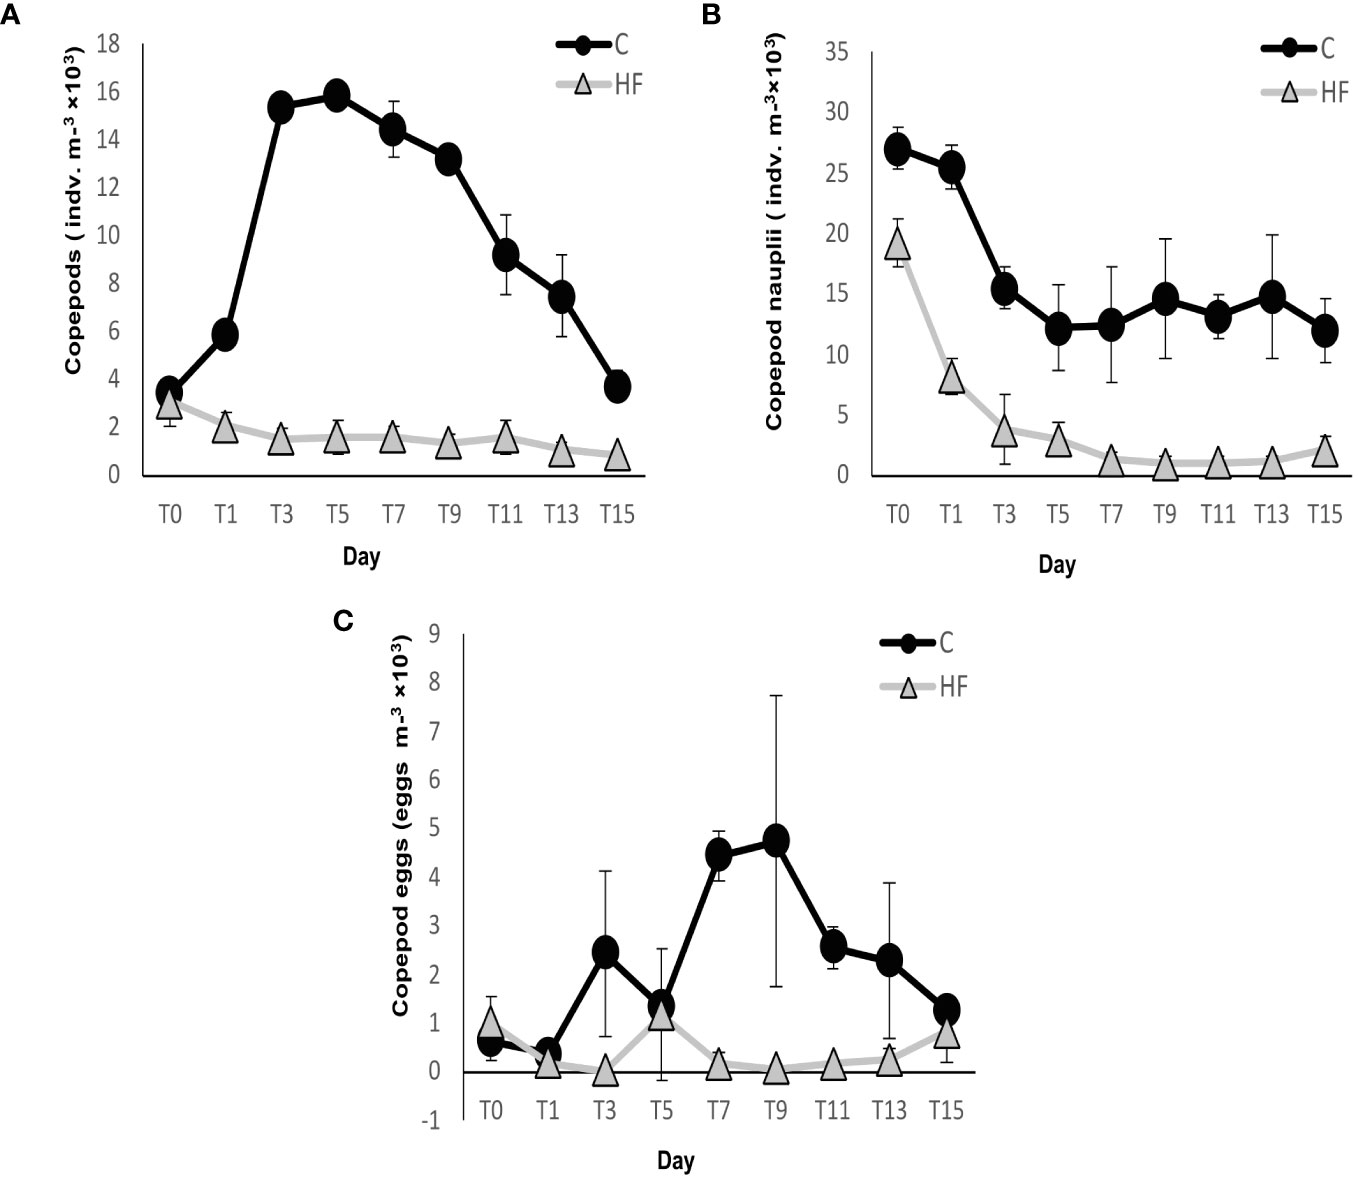
Figure 7 (A) Copepod (B) copepod nauplii and (C) copepod eggs abundance during the mesocosm experiment. C = Control mesocosms (no addition), HF = mesocosms where HuminFeed was added once, on the first day of the experiment. Data are mean ± SD of three replicates.
Similarly, copepod nauplii abundance was significantly lower in HF compared to C throughout the experiment (R.M. ANOVA: F = 180.91 and p<0.01, Figure 7B). The abundance in C sharply decreased during the first 5 days of the experiment and then slightly fluctuated until the end. In HF, the abundance sharply decreased until day 7 and remained low until the end. The highest abundance was recorded on day 0 for C and HF treatments at 27,031 ± 1,746 individuals m-3 and 19,242 ± 1,947 individuals m-3, respectively.
The number of copepod eggs was also lower in HF compared to C throughout the experiment (R.M. ANOVA: F = 29.64 and p<0.01, Figure 7C). Their number fluctuated until day 9 in C, when the highest number was recorded (4,739 ± 2,988 eggs m-3) and then decreased until the end of the experiment. The highest number recorded in HF was observed on day 5 (1,183 ± 1,371 eggs m-3), then decreased again until the end when a marginally increase was observed.
3.3.5 Ratio of heterotrophic to autotrophic biomass for picoplankton and nanoplankton
The biomass ratio of heterotrophic to autotrophic bacteria showed a large predominance of the heterotrophic component; however, no significant differences between the two experimental treatments were observed (Figure 8A). The ratio was almost constant until day 6 and then showed a sharp increase in both treatments. Then, in both HF and C, there was a small increase until the end of the experiment. Significant differences between the two treatments were recorded, and the ratio was higher in HF on days 12 and 13 (R.M. ANOVA: F=6.09, p<0.05).
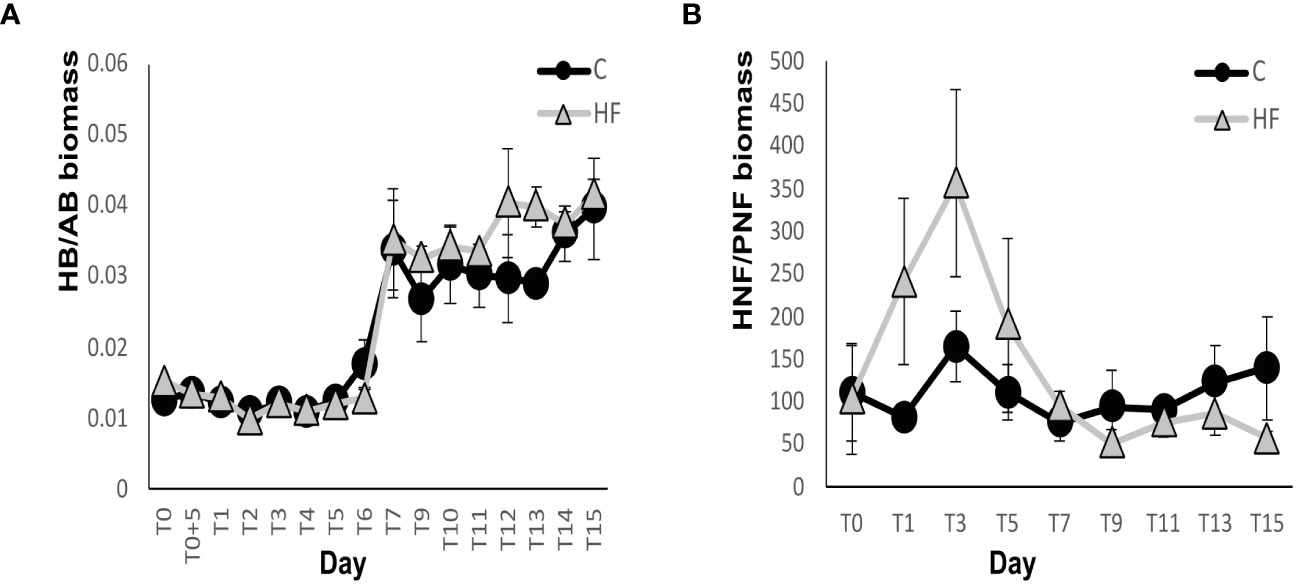
Figure 8 Ratio of heterotrophic to autotrophic biomass for (A) picoplankton and (B) nanoplankton during the mesocosm experiment. C = Control mesocosms (no addition), HF = mesocosms where HuminFeed was added once, on the first day of the experiment. Data are mean ± SD of three replicates.
The biomass ratio of total HNFs to total PNFs showed a predominance of the heterotrophic component throughout the experiment under both treatments (Figure 8B). It also showed non-significant differences between the two experimental treatments (R.M. ANOVA: F= 2.71, p>0.05). By day 7, the ratio was higher in HF and then lower compared to C. The ratio was relatively constant in C and fluctuated more in HF.
4 Discussion
The addition of HuminFeed caused shading in the mesocosms, but the effects observed on autotrophs were smaller than anticipated; only Synechococcus and diatoms were negatively affected and only during the first 3 days of the experiment. Moreover, the addition of HuminFeed resulted in an increase in the abundance and production of heterotrophic bacteria. Although bacteria abundance was slightly higher in HF only during the first days of the experiment, the increase in heterotrophic bacterial production was primary reflected in an increased abundance of HNA bacteria, and thus the effect of carbon enrichment was reflected in the production of larger cells rather than more cells. HuminFeed addition had a clear negative effect on both ciliates and copepods, with the first showing, for the most part, a distorted form. Dinoflagellates were the only microplankton group that was favored.
4.1 Autotrophic organisms
The hypothesis that the addition of HuminFeed will reduce the average light intensity in the mesocosms was confirmed. A decrease in light intensity was also observed in other similar mesocosm experiments with a 2 mg L-1 HuminFeed addition (Fonseca et al., 2022; Soulié et al., 2022; Spilling et al., 2022), as well as in experiments with higher additions (Lebret et al., 2018; Nydahl et al., 2019).
The slight decrease in cyanobacteria Synechococcus abundance as well as in the zeaxanthin (linked to cyanobacteria) concentration after the HF addition was most probably due to shading and not to the decrease in nutrient concentration because, although decreased, nutrients remained at relatively high levels for such an oligotrophic system. Another factor that may have played a role in the decrease in cyanobacteria abundance was increased predation by HNF, which reached its peak after that of Synechococcus, with the characteristic time lag of a prey-predator model.
The effect of light reduction was not so clear on PNFs <1 μm, which, although less abundant in HF in the first days of the experiment, increased in numbers from day 11 until the end of the experiment. Most probably, pelagophytes, chrysophytes, or green flagellates were responsible for this increase since the concentrations of 19BF (linked to pelagophytes or chrysophytes) and chlorophyll b’ (linked to green flagellates) were also higher in HF during the last days of the experiment. In contrast to small PNFs, larger PNFs (>1 μm) did not appear to be negatively affected by the reduction of light in HF as their abundance was higher compared to the controls during most days of the experiment. Mixotrophy (a combination of phagocytosis and photosynthesis in a cell) is common in PNFs (Stoecker et al., 2017; Livanou et al., 2019), so it is probable that shading did not affect them as strongly as cyanobacteria and diatoms, which are strictly autotrophic organisms. PNF mixotrophy has been reported to thrive under brownification conditions in other marine (Liess et al., 2016) and freshwater systems as well (Wilken et al., 2018; Senar et al., 2021).
Although the abundances of cyanobacteria and PNFs <1 μm were lower in HF, chlorophyll-a concentration was slightly higher in the HF treatment from day 2 to 6. The increased value of chlorophyll-a in HF on day 5 could not be attributed to PNFs >1 μm due to the very low abundance of this group. Therefore, it seems that diatoms were responsible for the slightly higher chlorophyll-a concentration on days 2 to 6, the biomass of which in those days was moderately higher in HF than in the control (Supplementary Figure S1). This conclusion is also supported by the fucoxanthin concentration (linked to the taxonomic group of diatoms), which was higher in HF from day 1 to day 9. It should be noted, however, that an increase in chlorophyll-a and other photosynthetic pigment concentrations following the HuminFeed addition may also be due to physiological acclimation to lower light inducing an increase of the cell pigment quota to maintain photosynthesis (Brunet et al., 2011). However, as the pigment increases were observed only during some days whereas the light decrease in HF was significantly lower all along the experiment, we may conclude that the pigment dynamics was not exclusively due to the physiological acclimation processes mentioned above but more probably related to phytoplankton abundance dynamics; probably antagonistic effects and the promotion or depression of some species/groups more than others.
In addition, the alteration of light intensity observed in HF had no significant effect on primary producers although the light reduction in HF resulted in a clear decrease of diadinoxanthin, β,β-carotene. These pigments, then, are related to light acclimation and photoprotection (Brunet et al., 2011). HuminFeed has been shown not only to decrease the light intensity but also to absorb more light in specific parts of the spectrum; i.e., at the UV wavelengths (Meinelt et al., 2007). So, perhaps not only the quantity but also the quality of the light led to such a decrease in the photoprotective pigments since they were no longer essential for the organisms.
In a similar mesocosm experiment conducted in a coastal site in the North Atlantic Bay, Soulié et al. (2022) observed that brownification resulted in significant reductions in the gross primary production linked to a reduction in the mean daily light integral. However, according to Spilling et al. (2022), in another similar experiment in the Baltic Sea, the effect of water coloring on primary production was less than expected. Fonseca et al. (2022) found similar results in a eutrophic lake; the concentration used and the single addition of HuminFeed may not have been sufficient to significantly affect autotrophic organisms. This statement seems to apply also to the present study. Meanwhile, in other mesocosm experiments conducted by Lefébure et al. (2013) and Paczkowska et al. (2020), in brackish water in the Baltic Sea using soil extract to induce brownification, primary production was significantly lower in treatments where the extract was added.
4.2 DOC concentration and origin
HuminFeed, in both the present study and in Spilling et al. (2022), did not induce an increase in the DOC concentration at the beginning of the experiment but, instead, resulted in a sharp increase in the POC concentration, which was, however, only 20% of TOC. In other words, only a small amount of HuminFeed was found suspended in the water column in the form of POC. After day 1, a gradual decrease in POC concentration was recorded until the end of the experiment, which was probably due to its gradual dissolution in the water column and its precipitation to the bottom of the mesocosms. POC decreased on average 0.18 mg L-1 in the first 5 days of the experiment but, at the same time, DOC increased on average 3.64 mg L-1, so the gradual dissolution of POC cannot totally explain the increase in DOC observed during the experiment. Therefore, it is possible that most of HuminFeed precipitated after its addition, and carbon was released to the water column as DOC later; therefore, it was responsible for the fluctuations of increased concentrations observed on days 5, 11 and 15.
Apart from the days HuminFeed concentration was higher in HF, there was a similar concentration of DOC in both treatments during most days of the experiment. However, in their similar experiment in a eutrophic lake, Fonseca et al. (2022) observed DOC concentration to be lower in HF during the entire experiment. The results of the present study are not directly comparable to those of Fonseca et al. (2022) as the two studies concern two very different environments. For example, on day 0 of the present experiment, the concentration of DOC was 2.8 mg L-1, while Fonseca et al. (2022), it was 5.2 mg L-1; i.e., almost double.
4.3 Heterotrophic organisms
The hypothesis that the addition of HuminFeed will increase the abundance and production of heterotrophic organisms, especially heterotrophic bacteria, was confirmed. The elevated abundance and production of heterotrophic bacteria in HF compared to the control on the first 4-5 days of the experiment suggest that HuminFeed stimulated cell production, whereas the apparent decoupling between abundance and increased heterotrophic bacterial production suggest a shift towards larger cells after day 5. This is supported by an increased frequency of HNA cells, however there were no indications of increased loss of bacterial cells due to grazing by protists in HF.
The positive correlation between heterotrophic bacterial production and the abundance of HNA bacteria in HF suggests that HNA bacteria were responsible for the increased heterotrophic bacterial production in HF. Increased heterotrophic bacterial production after the addition of HuminFeed was also observed by Spilling et al. (2022). It is therefore reasonable to assume that at least part of HuminFeed was bioavailable for bacterial decomposition and was used as a carbon source by bacteria. However, Soulié et al. (2022) suggested that the HuminFeed addition did not favor heterotrophic bacteria in their experiment since the aerobic respiration (connected to heterotrophic bacteria) measured was lower in the HF mesocosms. They concluded that the bacteria response was more related to the response of the phytoplankton community, which was depressed in their experiment, rather than directly to the HuminFeed-related carbon addition.
Additionally, in other mesocosm experiments conducted by Lefébure et al. (2013) and Paczkowska et al. (2020) in brackish water in the Baltic Sea, bacterial production was higher in the treatments where terrestrial matter was added. On the contrary, in a similar experiment as the above no clear effect on the bacterial abundance was observed (Traving et al., 2017). Simulated terrestrial runoff also seemed to positively affect bacterial abundance in two other mesocosm experiments conducted by Liess et al. (2016) and Courboulès et al. (2023) in a mesotrophic coastal lagoon in the Mediterranean Sea. Overall, these diverse results indicate the complexity of the ecological relationships and environments and highlight the importance of context-specific investigations.
The initial increase of heterotrophic bacteria abundance and production in both treatments was rapidly followed by a gradual decrease until day 5. HF abundance, instead, peaked on day 3 following the peak of abundance and production of heterotrophic bacteria, thus showing a clear prey-predator relationship. The consequent decline of the HF populations may be explained by the increase in the dinoflagellates, at least in the HF, which increased in numbers after the peak of HF. In contrast, in the controls, the decline in HF abundance was most probably due to ciliates, whose abundance peaked on day 5. The same trend regarding dinoflagellates was observed in the experiments conducted by Liess et al. (2016) and Soulié et al. (2022), in the latter, under the HuminFeed addition this group increased during the second part of the experiment as it was observed in the present study. On the contrary, dinoflagellates (mixotrophic and heterotrophic) showed lower abundances in the simulated runoff treatment, in the coastal lagoon experiment conducted by Courboulès et al. (2023).
The concentrations of dinoxanthin and peridinin, the two dinoflagellate specific pigments, were lower in HF during most days of the experiment but slightly higher than in the controls from day 5 to day 9. This indicates that the higher abundance of dinoflagellates in the HF treatment was due to the predominance of mixotrophic species and that they are not strongly affected by the reduction of light and are capable of switching to heterotrophic mode. Mixotrophy, the simultaneous regulation of photosynthesis, assimilation of dissolved inorganic and organic nutrients, and phagotophy are widespread in this group (Stoecker, 1999). This switch may have indirectly led to the decrease in the pigment concentration of the dinoxanthins and peridinins without affecting the total dinoflagellate abundance and biomass recorded. So, it is possible, that the heterotrophic bacteria production was probably channeled to small heterotrophic dinoflagellates (<30 μm), which were more abundant compared to the larger ones (data not shown), in the HF treatment. Heterotrophic dinoflagellates may effectively graze on bacteria in marine environments (Jeong et al., 2008). Additionally, the increase in the dinoflagellate abundance in HF was maybe related to the very low abundance of zooplankton recorded in HF throughout the experiment. Copepods, the basic component of mesozooplankton, are the main predators of dinoflagellates (Kleppel et al., 1991). Accordingly, the decrease in dinoflagellates in C was probably due to the predatory pressure exerted by copepods, whose abundance was much higher in control compared to the HF.
The decrease in the abundance of ciliates in the control may also be explained by the predatory pressure exerted on them by copepods, whose abundance was high in C. In contrast, in HF, the abundance of ciliates was very low soon after the HuminFeed addition, and most of them had a distorted form; this indicates that HuminFeed has a deleterious impact on ciliates. The same abundance decrease of ciliates was observed also by Courboulès et al. (2023) after the addition in the mesocosms of soil and river water by the nearby area of the study, but in a similar experiment in a different year (Liess et al., 2016) no clear of the brownification effect was observed. This highlights the variability of outcomes across different timeframes.
In the present study, due to the prey shortage (not only ciliates but also dinoflagellates), copepod populations consequently were very low in HF in the first half of the experiment. This allowed the increase in dinoflagellate abundance during the second half of the experiment, which was not reflected in a subsequent increase in the copepod abundance due to the longer life cycle of these metazoans. The high abundance of nanoflagellates (also prey for ciliates) in the first days of the experiment justifies the increase in the ciliate abundance in C recorded with a time lag (once more a pre-predator relationship). But in HF, a sharp decrease in the number of ciliates was recorded immediately after the addition of HuminFeed, with the deleterious effects mentioned above. Because of the distorted form of ciliates in the HF treatment and the subsequent difficulty identifying them under the microscope, it is probable that their actual abundance was even lower than the one measured.
Copepod adults, nauplii and eggs were all negatively affected by the HuminFeed addition, suggesting that HuminFeed impacted copepod feeding, reproduction and survival rates. A similar negative impact of HuminFeed on zooplankton was observed by Scharnweber et al. (2021) in a mesocosm experiment in a meso-eutrophic lake. According to these authors, HuminFeed should not interfere with the feeding and digestion of copepods because they are raptorial feeders; for this reason, copepod impairment may be due to stress induction, with the exact mechanisms poorly understood (Scharnweber et al., 2021). However, in the present study, there were strong indications that HuminFeed affected copepod feeding and digestion. First, copepods had visibly brown digestive tracks in the HuminFeed treatment. This suggests that copepods ingested prey with HuminFeed in or on it, or they ingested HuminFeed agglomerates. It is probable that HuminFeed affected their feeding by reducing food quality. It is known that ciliates are part of the copepod diet; in the HF treatment, most of ciliates had a distorted form, which strongly indicates that they were a poor-quality prey.
Second, it is possible that HuminFeed affected their feeding in an indirect way; i.e., by shading the water column, making it harder for visual predators, such as copepods, to see their food. Soulié et al. (2022) also described a depression in copepod abundance under HuminFeed addition in a North Atlantic fjord and suggested that copepods, as visual predators, are disadvantaged by light reduction compared to filtering predators; this fact potentially explaining their decline. But this would not affect all copepods, because not all of them are visual predators. Other agents used for water darkening experiments, e.g., Sera Blackwater Aquatan water conditioner (Sera GmbH), seem to not be harmful for zooplankton abundance and reproduction (Garnier et al., 2023 and references within). In other studies, where a natural brownification inducing agent such as soil and river water to simulate terrestrial runoff (Courboulès et al., 2023) or terrestrial matter from soil extract (Paczkowska et al., 2020) was used, brownification had significantly positive and negative effects on zooplankton respectively. These contrasting outcomes indicate that it does not seem that terrestrial inputs have a linear effect on zooplankton, but the results observed are more effected by the whole trophic web interactions and the specific agent used to mimic brownification.
Finally, the use of a commercially available substance (such as HuminFeed) for the experimental simulation of the phenomenon of brownification has great advantages. It allows studying the phenomenon in different environments and at different latitudes and comparing them in the framework of a bigger study. However, it should be used with precaution since it may be harmful or even toxic to organisms at higher trophic levels (Scharnweber et al., 2021) and may bias the experimental results. Furthermore, it is not directly comparable to the humic compounds naturally present in open marine and fresh waters. It would be interesting to investigate the addition of dissolved organic matter (DOM) from the immediate environment of each specific ecosystem under study since the composition and concentration of DOM varies between ecosystems. Therefore, for the full investigation of the phenomenon, investigating the effect of the addition of indigenous natural organic matter and not of commercially available alternatives since this may lead to atypical effects is recommended (Scharnweber et al., 2021).
5 Conclusions
Our study shows the complexity of effects on an oligotrophic marine environment triggered by artificial terrestrial inputs in the form of a commercially available substance observed during a mesocosm experiment. Our initial hypotheses were generally confirmed. HuminFeed caused shading, but the effects observed on autotrophs were smaller than anticipated. Regarding heterotrophic bacteria, the addition resulted in a small increase in abundance but a clearer increase in production, and had a clear negative effect on both ciliates and copepods. Dinoflagellates was the only microplankton group that was clearly favored, probably by boosting mixotrophic species. A combination of a bottom-up and a top-down control was observed, while the main results indicate that terrestrial inputs will probably alter the individual abundances of each plankton community but also shift their composition. All these findings come from a single mesocosm experiment, and the present study is the first attempt to study brownification in oligotrophic marine conditions. Taking all these results into consideration, any generalizations should be carefully reviewed when scaled up to the ecosystem level.
Data availability statement
The raw data supporting the conclusions of this article will be made available by the authors, without undue reservation.
Author contributions
GK: Formal Analysis, Investigation, Visualization, Writing – original draft. IM: Investigation, Project administration, Writing – review & editing. GC: Investigation, Writing – review & editing. JC: Investigation, Writing – review & editing. EME: Investigation, Writing – review & editing. JG: Investigation, Writing – review & editing. IK: Investigation, Writing – review & editing. MM: Investigation, Writing – review & editing. KS: Investigation, Writing – review & editing. MT: Writing – review & editing. FV: Investigation, Writing – review & editing. PP: Funding acquisition, Project administration, Supervision, Writing – review & editing.
Funding
The author(s) declare financial support was received for the research, authorship, and/or publication of this article. This work was supported by the Transnational Access program (support to GC, JC, EME, and MM) and the Joint Research Activities of the EU H2020-INFRAIA project (No. 871081) AQUACOSM-plus: Network of Leading Ecosystem Scale Experimental AQUAtic MesoCOSM Facilities Connecting Rivers, Lakes, Estuaries and Oceans in Europe and beyond, and also by the EU H2020-INFRAIA project (No. 731065) AQUACOSM: Network of Leading European AQUAtic MesoCOSM Facilities Connecting Mountains to Oceans from the Arctic to the Mediterranean, both funded by the European Commission.
Acknowledgments
This study took place at the “CretaCosmos” research infrastructure of HCMR (Hellenic Centre for Marine Research) in Crete, Greece. We would like to thank S. Zivanovic and E. Dafnomili for assistance with chemical analyses, S. Diliberto, B. E. Tohumcu, I. Papachristou, M. Kapsi, L. Roager, M. Bentzon-Tilia for assistance during the experiment.
Conflict of interest
The authors declare that the research was conducted in the absence of any commercial or financial relationships that could be construed as a potential conflict of interest.
Publisher’s note
All claims expressed in this article are solely those of the authors and do not necessarily represent those of their affiliated organizations, or those of the publisher, the editors and the reviewers. Any product that may be evaluated in this article, or claim that may be made by its manufacturer, is not guaranteed or endorsed by the publisher.
Supplementary material
The Supplementary Material for this article can be found online at: https://www.frontiersin.org/articles/10.3389/fmars.2024.1343415/full#supplementary-material
References
Ask J., Karlsson J., Persson L., Ask P., Byströ P. R., Jansson M. (2009). Terrestrial organic matter and light penetration: Effects on bacterial and primary production in lakes. Limnol. Oceanogr. 54, 2034–2040. doi: 10.4319/lo.2009.54.6.2034
Biddanda B., Ogdahl M., Cotner J. (2001). Dominance of bacterial metabolism in oligotrophic relative to eutrophic waters. Limnol. Oceanogr. 46, 730–739. doi: 10.4319/lo.2001.46.3.0730
Blanca Mena M. J., Arnau Gras J., García de Castro F. J., Alarcón Postigo R., Bono Cabré R. (2023). Non-normal data in repeated measures ANOVA: impact on type I error and power. Psicothema 35, 21–29. doi: 10.7334/psicothema2022.292
Brunet C., Johnsen G., Lavaud J., Roy S. (2011). “Pigments and photoacclimation processes,” in Phytoplankton Pigments (Cambridge: Cambridge Press University), 445–471.
Calderó-Pascual M., Yıldız D., Yalçın G., Metin M., Yetim S., Fiorentin C., et al. (2022). The importance of allochthonous organic matter quality when investigating pulse disturbance events in freshwater lakes: a mesocosm experiment. Hydrobiologia 849, 3905–3929. doi: 10.1007/s10750-021-04757-w
Caron D. A., Dam H. G., Kremer P., Lessard E. J., Madin L. P., Malone T. C., et al. (1995). The contribution of microorganisms to particulate carbon and nitrogen in surface waters of the Sargasso Sea near Bermuda. Deep-Sea Res. I 42, 943–972. doi: 10.1016/0967-0637(95)00027-4
Coll M., Piroddi C., Steenbeek J., Kaschner K., Lasram F. B. R., Aguzzi J., et al. (2010). The biodiversity of the Mediterranean Sea: Estimates, patterns, and threats. PloS One 5, e11842. doi: 10.1371/journal.pone.0011842
Courboulès J., Vidussi F., Soulié T., Nikiforakis E., Heydon M., Mas S., et al. (2023). Effects of an experimental terrestrial runoff on the components of the plankton food web in a Mediterranean coastal lagoon. Front. Mar. Sci. 10. doi: 10.3389/fmars.2023.1200757
Crane K. W., Grover J. P. (2010). Coexistence of mixotrophs, autotrophs, and heterotrophs in planktonic microbial communities. J. Theor. Biol. 262, 517–527. doi: 10.1016/j.jtbi.2009.10.027
Drobinski P., Silva N. D., Panthou G., Bastin S., Muller C., Ahrens B., et al. (2018). Scaling precipitation extremes with temperature in the Mediterranean: past climate assessment and projection in anthropogenic scenarios. Climate dynam. 51, 1237–1257. doi: 10.4319/lo.2009.54.6.2034
Fonseca B. M., Levi E. E., Jensen L. W., Graeber D., Søndergaard M., Lauridsen T. L., et al. (2022). Effects of DOC addition from different sources on phytoplankton community in a temperate eutrophic lake: An experimental study exploring lake compartments. Sci. Total Environ. 803, 150049. doi: 10.1016/j.scitotenv.2021.150049
Garnier A., Östman Ö., Ask J., Bell O., Berggren M., Rulli M., et al. (2023). Coastal darkening exacerbates eutrophication symptoms through bottom-up and top-down control modification. Limnol. Oceanogr. 68, 678–691. doi: 10.1002/lno.12302
Graneli W. (2012). “Brownification of Lakes,” In: Bengtsson L., Herschy R.W., Fairbridge R.W. (eds) Encyclopedia of Lakes and Reservoirs. Encyclopedia of Earth Sciences Series. Springer, Dordrecht. doi: 10.1007/978-1-4020-4410-6_256
Hedges J. I., Stern J. H. (1984). Carbon and nitrogen determinations of carbonate-containing solids. Limnol. Oceanogr. 29, 657–663. doi: 10.4319/lo.1984.29.3.0657
Holm-Hansen O., Lorenzen C. J., Holmes R. W., Strickland J. D. H. (1965). Fluorometric determination of chlorophyll. ICES J. Mar. Sci. 30, 3–15. doi: 10.1093/icesjms/30.1.3
Ivančič I., Degobbis D. (1984). An optimal manual procedure for ammonia analysis in natural waters by the indophenol blue method. Water Res. 18, 1143–1147. doi: 10.1016/0043-1354(84)90230-6
Jeong H. J., Seong K. A., YOO Y. D., Kim T. H., Kang N. S., Kim S., et al. (2008). Feeding and grazing impact by small marine heterotrophic dinoflagellates on heterotrophic bacteria. J. Eukaryotic Microbiol. 55, 271–288. doi: 10.1111/j.1550-7408.2008.00336.x
Jones R. I. (2000). Mixotrophy in planktonic protists: an overview. Freshw. Biol. 45, 219–226. doi: 10.1046/j.1365-2427.2000.00672.x
Kana T. M., Glibert P. M. (1987). Effect of irradiances up to 2000 μE m– 2 s– 1 on marine Synechococcus WH7803—I. Growth, pigmentation, and cell composition. Deep-Sea Res. I 34, 479–495. doi: 10.1016/0198-0149(87)90001-X
Kirchman D. L., Newell S. Y., Hodson R. E. (1986). Incorporation versus biosynthesis of leucine: implications for measuring rates of protein synthesis and biomass production by bacteria in marine systems. Mar. Ecol. Prog. Ser. 32, 47–59. doi: 10.3354/meps03204
Kleppel G. S., Holliday D. V., Pieper R. E. (1991). Trophic interactions between copepods and microplankton: a question about the role of diatoms. Limnol. Oceanogr. 36, 172–178. doi: 10.4319/lo.1991.36.1.0172
Kritzberg E. S., Ekström S. M. (2012). Increasing iron concentrations in surface waters - A factor behind brownification? Biogeosciences 9, 1465–1478. doi: 10.5194/bg-9-1465-2012
Krom M. D., Woodward E. M. S., Herut B., Kress N., Carbo P., Mantoura R. F. C., et al. (2005). Nutrient cycling in the south east Levantine basin of the eastern Mediterranean: Results from a phosphorus starved system. Deep-Sea Res. II 52, 2879–2896. doi: 10.1016/j.dsr2.2005.08.009
Lebaron P., Servais P., Agogué H., Courties C., Joux F. (2001). Does the high nucleic acid content of individual bacterial cells allow us to discriminate between active cells and inactive cells in aquatic systems? Appl. Environ. Microbiol. 67, 1775–1782. doi: 10.1128/AEM.67.4.1775-1782.2001
Lebret K., Langenheder S., Colinas N., Östman Ö., Lindström E. S. (2018). Increased water colour affects freshwater plankton communities in a mesocosm study. Aquat. Microbial. Ecol. 81, 1–17. doi: 10.3354/ame01858
Lee S., Fuhrman J. A. (1987). Relationships between biovolume and biomass of naturally derived marine bacterioplankton. Appl. Environ. Microbiol. 53, 1298–1303. doi: 10.1128/aem.53.6.1298-1303.1987
Lefébure R., Degerman R., Andersson A., Larsson S., Eriksson L. O., Båmstedt U., et al. (2013). Impacts of elevated terrestrial nutrient loads and temperature on pelagic food-web efficiency and fish production. Global Change Biol. 19, 1358–1372. doi: 10.1111/gcb.12134
Liess A., Rowe O., Francoeur S. N., Guo J., Lange K., Schröder A., et al. (2016). Terrestrial runoff boosts phytoplankton in a Mediterranean coastal lagoon, but these effects do not propagate to higher trophic levels. Hydrobiologia 766, 275–291. doi: 10.1007/s10750-015-2461-4
Livanou E., Lagaria A., Santi I., Mandalakis M., Pavlidou A., Lika K., et al. (2019). Pigmented and heterotrophic nanoflagellates: Abundance and grazing on prokaryotic picoplankton in the ultra-oligotrophic eastern Mediterranean Sea. Deep-Sea Res. II 164, 100–111. doi: 10.1016/j.dsr2.2019.04.007
Marie D., Simon N., Guillou L., Partensky F., Vaulot D. (2000). “Flow Cytometry Analysis of Marine Picoplankton,” In: Diamond R.A., Demaggio S. (eds) In Living Color. Springer Lab Manuals. Berlin, Heidelberg: Springer. doi: 10.1007/978-3-642-57049-0_34
Meinelt T., Paul A., Phan T. M., Zwirnmann E., Krüger A., Wienke A., et al. (2007). Reduction in vegetative growth of the water mold Saprolegnia parasitica (Coker) by humic substance of different qualities. Aquat. Toxicol. 83, 93–103. doi: 10.1016/j.aquatox.2007.03.013
Meunier C. L., Liess A., Andersson A., Brugel S., Paczkowska J., Rahman H., et al. (2017). Allochthonous carbon is a major driver of the microbial food web – A mesocosm study simulating elevated terrestrial matter runoff. Mar. Environ. Res. 129, 236–244. doi: 10.1016/j.marenvres.2017.06.008
Nydahl A. C., Wallin M. B., Tranvik L. J., Hiller C., Attermeyer K., Garrison J. A., et al. (2019). Colored organic matter increases CO2 in meso-eutrophic lake water through altered light climate and acidity. Limnol. Oceanogr. 64, 744–756. doi: 10.1002/lno.11072
Paczkowska J., Brugel S., Rowe O., Lefébure R., Brutemark A., Andersson A. (2020). Response of coastal phytoplankton to high inflows of terrestrial matter. Front. Mar. Sci. 7. doi: 10.3389/fmars.2020.00080
Porter K. G., Feig Y. S. (1980). The use of DAPI for identifying and counting aquatic microflora. Limnol. Oceanogr. 25, 943–948. doi: 10.4319/lo.1980.25.5.0943
Postel L., Fock H., Hagen W. (2000). Biomass and abundance. In ICES zooplankton methodology manual. Acad. Press, London, 83–192. doi: 10.1016/B978012327645-2/50005-0
Powley H. R., Krom M. D., Van Cappellen P. (2017). Understanding the unique biogeochemistry of the Mediterranean Sea: Insights from a coupled phosphorus and nitrogen model. Global Biogeochem. Cycles 31, 1010–1031. doi: 10.1002/2017GB005648
Rimmelin P., Moutin T. (2005). Re-examination of the MAGIC method to determine low orthophosphate concentration in seawater. Anal. Chim. Acta 548, 174–182. doi: 10.1016/j.aca.2005.05.071
Roy S., Llewellyn C., Egeland E., Johnsen G. (2011). Phytoplankton Pigments: Characterization, Chemotaxonomy and Applications in Oceanography (Cambridge: Cambridge University Press). doi: 10.1017/CBO9780511732263
Scharnweber K., Peura S., Attermeyer K., Bertilsson S., Bolender L., Buck, et al. (2021). Comprehensive analysis of chemical and biological problems associated with browning agents used in aquatic studies. Limnol. Oceanogr. Methods 19, 818–835. doi: 10.1002/lom3.10463
Sempere R., Panagiotopoulos C., Lafont R., Marroni B., Van Wambeke F. (2002). Total organic carbon dynamics in the Aegean Sea. J. Mar. Syst. 33, 355–364. doi: 10.1016/S0924-7963(02)00066-0
Senar O. E., Creed I. F., Trick C. G. (2021). Lake browning may fuel phytoplankton biomass and trigger shifts in phytoplankton communities in temperate lakes. Aquat Sci. 83, 21. doi: 10.1007/s00027-021-00780-0
Siokou-Frangou I., Bianchi M., Christaki U., Christou E. D., Giannakourou A., Gotsis O., et al. (2002). Carbon flow in the planktonic food web along a gradient of oligotrophy in the Aegean Sea (Mediterranean Sea). J. Mar. Syst. 33, 335–353. doi: 10.1016/S0924-7963(02)00065-9
Smith D. C., Azam F. (1992). A simple, economical method for measuring bacterial protein synthesis rates in seawater using 3H-leucine. Mar. Microb. Food webs 6, 107–114.
Solomon C. T., Jones S. E., Weidel B. C., Buffam I., Fork M. L., Karlsson J., et al. (2015). Ecosystem consequences of changing inputs of terrestrial dissolved organic matter to lakes: current knowledge and future challenges. Ecosystems 18, 376–389. doi: 10.1007/s10021-015-9848-y
Soulié T., Stibor H., Mas S., Braun B., Knechtel J., Nejstgaard J. C., et al. (2022). Brownification reduces oxygen gross primary production and community respiration and changes the phytoplankton community composition: An in situ mesocosm experiment with high-frequency sensor measurements in a North Atlantic Bay. Limnol. Oceanogr. 67, 874–887. doi: 10.1002/lno.12041
Spilling K., Asmala E., Haavisto N., Haraguchi L., Kraft K., Lehto A. M., et al. (2022). Brownification affects phytoplankton community composition but not primary productivity in eutrophic coastal waters: A mesocosm experiment in the Baltic Sea. Sci. Total Environ. 841, 156510. doi: 10.1016/j.scitotenv.2022.156510
Stoecker D. K. (1999). Mixotrophy among dinoflagellates 1. J. eukaryotic Microbiol. 46, 397–401. doi: 10.1111/j.1550-7408.1999.tb04619.x
Stoecker D. K., Hansen P. J., Caron D. A., Mitra A. (2017). Mixotrophy in the marine plankton. Annu. Rev. Mar. Sci. 9, 311–335. doi: 10.1146/annurev-marine-010816-060617
Strickland J. D. H., Parsons T. R. (1972). A practical handbook of seawater analysis. J. Fish. Res. Board Can. 167, 71–76. doi: 10.25607/OBP-1791
Traving S. J., Rowe O., Jakobsen N. M., Sørensen H., Dinasquet J., Stedmon C. A., et al. (2017). The effect of increased loads of dissolved organic matter on estuarine microbial community composition and function. Front. Microbiol. 8. doi: 10.3389/fmicb.2017.00351
Utermöhl H. (1958). Zur vervollkommnung der quantitativen phytoplankton-methodik: Mit 1 Tabelle und 15 abbildungen im Text und auf 1 Tafel. Internation. Vereinigung für theoretische und angewandte Limnol.: Mitt. 9, 1–38. doi: 10.1080/05384680.1958.11904091
Van Wambeke F., Bonnet S., Moutin T., Raimbault P., Alarcón G., Guieu C. (2008). Factors limiting heterotrophic bacterial production in the southern Pacific Ocean. Biogeosciences 5, 833–845. doi: 10.5194/bg-5-833-2008
Vidussi F., Mostajir B., Fouilland E., Le Floc’H E., Nouguier J., Roques C., et al. (2011). Effects of experimental warming and increased ultraviolet B radiation on the Mediterranean plankton food web. Limnol. Oceanogr. 56, 206–218. doi: 10.4319/lo.2011.56.1.0206\
Wilken S., Soares M., Urrutia-Cordero P., Ratcovich J., Ekvall M. K., Van Donk E., et al. (2018). Primary producers or consumers? Increasing phytoplankton bacterivory along a gradient of lake warming and browning. Limnol. Oceanogr. 63, S142–S155. doi: 10.1002/lno.10728
Keywords: plankton, microbial ecology, brownification, mesocosms, oligotrophic Eastern Mediterranean, HuminFeed
Citation: Ktistaki G, Magiopoulos I, Corno G, Courboulès J, Eckert EM, González J, Kalantzi I, Middelboe M, Symiakaki K, Tsapakis M, Vidussi F and Pitta P (2024) Brownification in the Eastern Mediterranean Sea: effect of simulated terrestrial input on the planktonic microbial food web in an oligotrophic sea. Front. Mar. Sci. 11:1343415. doi: 10.3389/fmars.2024.1343415
Received: 23 November 2023; Accepted: 01 February 2024;
Published: 05 March 2024.
Edited by:
Jesper H. Andersen, NIVA Denmark Water Research, DenmarkReviewed by:
Agneta Andersson, Umeå University, SwedenKristian Spilling, Finnish Environment Institute (SYKE), Finland
Copyright © 2024 Ktistaki, Magiopoulos, Corno, Courboulès, Eckert, González, Kalantzi, Middelboe, Symiakaki, Tsapakis, Vidussi and Pitta. This is an open-access article distributed under the terms of the Creative Commons Attribution License (CC BY). The use, distribution or reproduction in other forums is permitted, provided the original author(s) and the copyright owner(s) are credited and that the original publication in this journal is cited, in accordance with accepted academic practice. No use, distribution or reproduction is permitted which does not comply with these terms.
*Correspondence: Paraskevi Pitta, vpitta@hcmr.gr
†Present address: Katerina Symiakaaki, Plankton and Microbial Ecology, Department of Experimental Limnology Dep 3., Leibniz-Institute of Freshwater Ecology and Inland Fisheries (IGB), Stechlin, Germany