Seabird-vectored pelagic nutrients integrated into temperate intertidal rocky shores
 Samuel Healing
 Cassandra E. Benkwitt
 Ruth E. Dunn
  Nicholas A. J. Graham
- Lancaster Environment Centre, Lancaster University, Lancaster, United Kingdom
Seabirds provide inter-habitat connectivity by transporting vast quantities of nutrients from their pelagic feeding grounds to terrestrial and marine ecosystems via their nitrogen and phosphorous rich guano. However, it remains unclear whether seabird nutrients are cycling through many nearshore, temperate systems, such as United Kingdom (UK) rocky shores. Furthermore, it also remains unknown how seabird nutrient subsidies impact biodiversity, productivity, and recolonisation rates in UK rocky intertidal systems. Here, the impact of seabird nutrient subsidies to the Farne Islands, Northumberland, areas of high seabird densities during their breeding seasons, was compared to nearby low seabird density areas on the Northumberland coast. Estimated seabird derived nitrogen inputs and seabird densities were 420-1,025 and 949-2,279 times higher, respectively, on seabird islands than on the mainland. Seabird derived nutrient inputs led to substantially enriched nitrogen stable isotope (δ15N) values and total nitrogen content in terrestrial soil, plants, and lichen, and intertidal barnacles, and limpets, and higher δ15N values in macroalgae and turf algae. The seabird islands contained marginally greater algal species richness and higher densities of intertidal predators. However, other drivers could not be ruled out, such as nutrient inputs from mainland sources and marginally higher wave exposure at the mainland sites. No difference in limpet size, biomass, or abundance existed between the seabird islands and the mainland. On plots artificially cleared to simulate a disturbance event, barnacles recolonised faster on mainland sites. These findings provide evidence that seabird vectored pelagic nutrients are incorporated into terrestrial and intertidal ecosystems of UK islands, and therefore play an important role in facilitating ecosystem connectivity.
1 Introduction
The vectoring of nutrients and organic matter via the movement of motile consumers has long been recognised as a mechanism that links ecosystems (Hutchinson, 1950). Allochthonous nutrient subsidies support many ecosystems, influencing productivity, functioning, diversity, biomass, and community dynamics, boosting food availability and quality, and enhancing ecosystem resilience (Polis et al., 1997; Lundberg and Moberg, 2003; Loreau and Holt, 2004; Benkwitt et al., 2019). Seabirds are important nutrient vectors, transporting nutrients from their pelagic ocean feeding grounds to coastlines and islands via marine prey items that drop on the colony, lost feathers, abandoned or destroyed eggs, and individuals that die on land. However, the greatest nutrient subsidy is in the form of nitrogen- and phosphorous-rich guano; nutrients that are often limiting resources across many ecosystems. At local scales, these levels of nutrient input dictate the structure and dynamics of communities to the extent that seabirds have been described as “keystone species” (Mulder et al., 2011b). At global scales, seabirds may link marine and terrestrial environments, contributing to inter-habitat connectivity and providing multiple ecosystem services (Otero et al., 2018; Signa et al., 2021).
Whilst the functional role of seabird nutrient inputs on terrestrial habitats has received a great deal of attention, empirical studies investigating the effects of bottom-up nutrients supplied by seabirds on coastal marine ecosystems remain comparatively limited (Kazama, 2019; Signa et al., 2021; Grant et al., 2022). Evidence does exist, though, of nutrient inputs from seabirds moving through systems, such as consistently higher nitrogen signals in primary producers and invertebrates that are in close proximity to seabird colonies (Jones, 2010; Kolb et al., 2010; Gagnon et al., 2013; Rankin and Jones, 2021). However, whilst it is important to understand the extent that seabird nutrient inputs propagate through ecosystems, it is also critical to establish whether these allochthonous nutrients impact biodiversity and productivity. These influences have received recent attention in tropical systems: seabird nutrients led to increases in the growth rates of coral, damselfish, and parrotfish, as well as the biomass of fish communities (Graham et al., 2018; Savage, 2019; Benkwitt et al., 2021a, Benkwitt et al., 2021b, Benkwitt et al., 2023). Some research on the bottom-up effects of seabirds on temperate environments has been performed, examining intertidal community structure, and seabird nutrients impacts on macroalgae. For example, on the Mercury Islands, New Zealand, macroalgal diversity was highest on islands with the longest history of seabird presence (Rankin and Jones, 2021), whilst in the Stockholm archipelago, there was a shift towards increased epiphytic algae and invertebrate biomass near seabird islands (Kolb et al., 2010). Further, in South Africa, higher levels of nutrients due to seabirds resulted in higher algal production (Bosman and Hockey, 1986) and growth rates (Bosman et al., 1986). Whilst research in both tropical and temperate environments exists, more is needed to understand the influence of seabird nutrients to recipient systems, with the United Kingdom (UK) amongst the countries where research is deficient.
Despite their importance, seabirds are one of the most threatened bird groups, with almost half of all seabird species threatened with extinction (IUCN, 2022), and over half of Britain and Ireland’s seabirds are in decline (JNCC, 2023). The threats to seabirds do not only impact their own populations, but could also cascade through ecosystems, threatening communities and food webs that are dependent upon seabirds’ nutrients (McCann et al., 2005; Rooney et al., 2006; Thoresen et al., 2017). Current anthropogenic threats to seabirds include commercial fishing, pollution, habitat degradation, human disturbance, climate change, severe weather events, and human-introduced invasive predators (Croxall et al., 2012). Indeed, invasive predator eradication programmes are becoming an increasingly important conservation technique, with approximately half of all successful European invasive alien vertebrate eradications on inhabited islands having occurred within the UK, including on Staple island of the Farne Islands, Northumberland (Stanbury et al., 2017).
Cold-water systems, such as those surrounding the UK, make up a large proportion of global oceans, yet the impact of seabird nutrient input in these environments remains understudied. Strong seasonal differences exist in these environments, and they are prone to stormy weather, which is predicted to increase under future climate predictions (IPCC, 2022). The UK is of international importance for breeding assemblages of seabirds and shorebirds, with many of its islands designated as Special Protection Areas under EU legislation (Stanbury et al., 2017). These breeding seabirds excrete vast quantities of nutrients along the UK’s coastlines (Riddick et al., 2012). Given the global threats to seabird populations, that cold-water systems make up a large proportion of global oceans, and the international importance of the UK’s seabirds, it is important to determine the influence of seabird nutrient input on UK nearshore marine systems for both regional and global understanding.
To test the impact of seabirds upon terrestrial and intertidal systems in the UK, islands with high densities of breeding seabirds (the Farne Islands) were compared to mainland sites on the adjacent Northumberland coast, where no seabirds breed. It was hypothesised that seabird nutrient input would cycle through the terrestrial and intertidal ecosystems of the Farne Islands, boosting intertidal biodiversity. We also predicted that seabird nutrient input would increase intertidal productivity through increased limpet size and biomass. Rocky shore intertidal systems are subject to regular disturbance and recolonisation by intertidal organisms, which are expected to increase under future climate change. Furthermore, experimentally adding nutrients to rocky intertidal habitats has been shown to increase recolonisation (Kraufvelin et al., 2006; Kraufvelin, 2007; Masterson et al., 2008). Therefore, following experimental clearances it was predicted seabird nutrient input would support a more rapid recolonisation of algae and barnacles recolonisation.
2 Methods
2.1 Study sites
The Farne Islands are an archipelago situated off the Northumberland coast, located in the North Sea (Figure 1; 55.63° N, 1.63° W). The Farne Islands have National Nature Reserve, Special Protection Area, and Site of Special Scientific Interest (SSSI) designations and have been under the care of the National Trust since 1925. The three study islands were Inner Farne, Staple, and Brownsman, all of which have large seasonal seabird populations. Staple island underwent successful brown rat (Rattus norvegicus) eradications in 2006 and 2009. To the best of our knowledge, Inner Farne and Brownsman have no history of rat invasion. All data were collected at one site on each island, with partial observational data also collected at a fourth site (a second location on Inner Farne; Figure 1). The four comparison mainland sites were situated within two regions on the Northumberland coast, which, compared to the Farne Islands, have negligible seabird populations. Two sites were located at Blackrocks Point and Harkness Rocks, around Bamburgh lighthouse (Figure 1; 55.62° N, 1.72° W). This region has both Northumberland Coast SSSI and Bamburgh Coast and Hills SSSI designations. A further two sites were located at Greenhill Rocks and Monks House Rocks (Figure 1; 55.59° N, 1.68° W), which has Northumberland Coast SSSI designation. As on the Farne Islands, all data were collected at three sites, and partial observational data were also collected at a fourth site. All sites had similar rocky shore headland habitats; the seabird islands and mainland sites were as geographically close to one another as possible, had a low level of incline, and similar geology (BGS, 1896). Despite attempts to reduce the impact of confounding variables, the mainland sites may have been subject to nutrient enrichment from agricultural run-off and sewage treatment facilities, which have been reported at Lindisfarne National Nature reserve, approximately eight and ten kilometres north of the two mainland study sites, respectively. Furthermore, external influences from the North Sea and the River Tweed have been reported as sources of nitrogen within the area (NCC, 2020). The River Tweed is approximately 25 km north of the mainland study sites. The Ballantine exposure scales (Ballantine, 1961) was used to describe the wave exposure levels for the study sites, where one on the scale describes extremely exposed sites and eight describes extremely sheltered sites. On the Farne Islands, two sites scored seven on the Ballantine exposure scale, and one site scored six; all mainland sites were five on the scale.
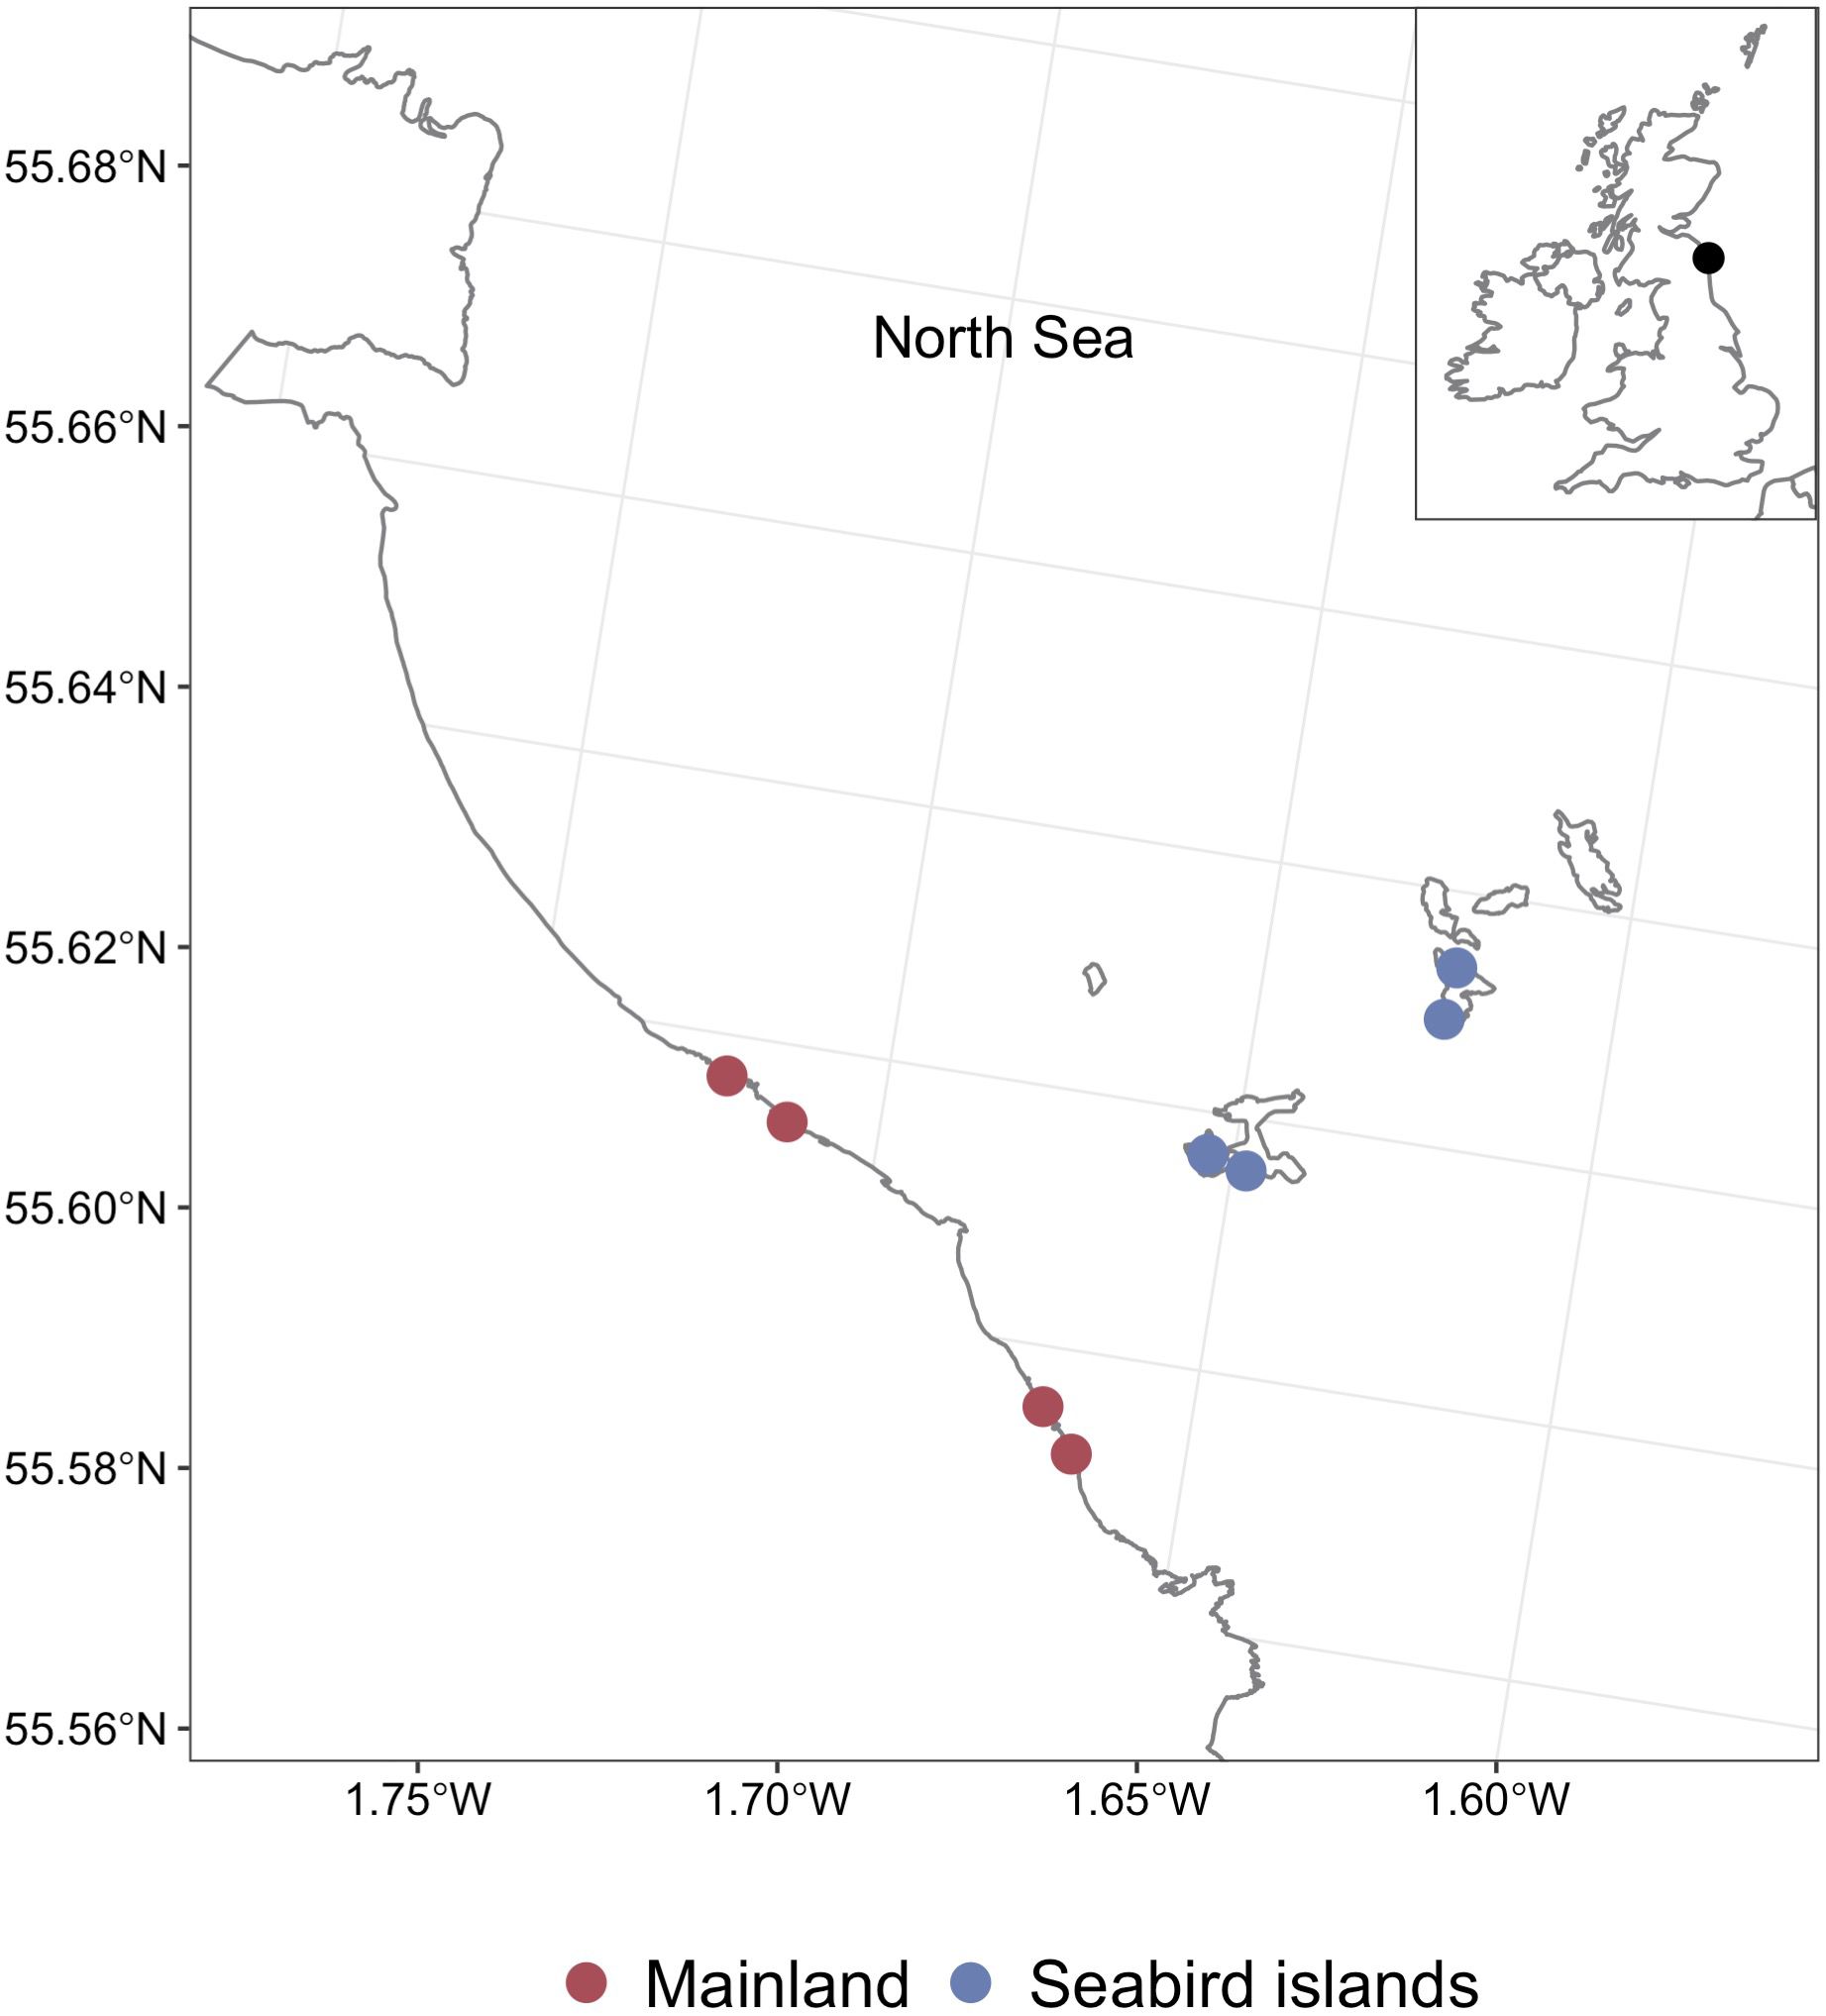
Figure 1 Map of the study sites. Location of the seabird islands (blue) and mainland (red) sites within the North Sea, with a close-up of the Farne Islands and Northumberland mainland.
2.2 Seabird surveys
Breeding seabird densities on the Farne Islands were counted annually from 2017-2021 by the National Trust (2022a). Species-specific survey methods were used, comprising surveys for apparently occupied nests (AON), apparently occupied burrows (AOB), apparently occupied sites (AOS), and whole-colony census counts (Walsh et al., 1995; Bibby, 2000). Repeated surveys were performed throughout single breeding seasons for all species to verify counts.
Non-breeding seabird densities on the mainland were counted annually from 2015-2019 by the British Trust Ornithology (BTO) as part of the Wetland Bird Survey (BTO, 2022a; note: data from seabird surveys during 2020 and 2021 were excluded due to disruptions caused by COVID-19). A mean seabird density for the entire survey area was estimated as all four mainland sites were located within a single BTO survey sector.
Specific species included in the Farne Island and mainland surveys were: Atlantic puffins (Fratercula arctica); black-legged kittiwakes (Rissa tridactyla); common guillemots (Uria aalge); European shags (Gulosus aristotelis); great cormorants (Phalacrocorax carbo); northern fulmars (Fulmarus glacialis); razorbills (Alca torda); black-headed gulls (Chroicocephalus ridibundus); common gulls (Larus canus); European herring gulls (Larus argentatus); great black-backed gulls (Larus marinus); lesser black-backed gulls (Larus fuscus); little gulls (Hydrocoloeus minutus), Arctic terns (Sterna paradisaea); common terns (Sterna hirundo); little terns (Sternula albifrons); roseate terns (Sterna dougallii); sandwich terns (Thalasseus sandvicensis). Non-seabird species were excluded from counts as they likely do not contribute to allochthonous nutrient inputs. Importantly, these seabird species feed in the open ocean, and not in the intertidal, and thus are not expected to exert top-down control on rocky intertidal systems. In addition, shorebird predation was presumed to exert a negligible influence on limpet populations on both the Farne Islands and the mainland due population sizes being comparable between the Farne Islands and the mainland.
2.3 Total estimated nitrogen input from guano
Total nitrogen input from guano per hectare per year was estimated for each site using previously published methods (Young et al., 2010; Graham et al., 2018):
where nitrogen input per hectare per year (NI) is estimated from the nitrogen content of guano (Ng), the defecation rate in g per species of bird (i) per day (Dr), the number of that species of bird (Bd) on the site (j), the number of days of the year that the species is present on the site (P), and the area of the survey site (Area). Nitrogen content of guano was held at 15.46%, as the mean of other seabird species (Lindeboom, 1984; Staunton Smith and Johnson, 1995; Young et al., 2010). Defecation rate was based on the European herring gull and scaled for all species by species’ biomass, assuming allometric relationships with body size (Portnoy and Soukup, 1990; Young et al., 2010). The number of days a year that a species was present was the sum of each species’ incubation period, fledging period, and colony-based post-fledging care period (in days; Schreiber and Burger, 2001). In instances of data deficiency, the number of post-fledging care days of the most closely related bird species was used (or a mean of closely related species, where multiple species were present).
The area of mainland survey sites and each seabird island was calculated in ArcGIS Pro (Esri, 2022; version 2.5.2). The mainland’s transect area was provided by the BTO (2022b), with all four sites falling within a single BTO sector, estimated to be 722 ha. The Farne Islands were estimated using data from Operational Land Imager (OLI) Collection 2 Level-1, Landsat 8 satellite imagery (30 m spatial resolution; USGS, 2022). The seabird islands were estimated to be 7.3 ha, 5 ha, and 6.9 ha for Inner Farne, Staple, and Brownsman, respectively. Note, these areas refer to the size of the areas in which bird survey areas were undertaken, not the size of the site in which the data were collected.
2.4 Isotope sampling
Nitrogen is commonly used in stable isotope analysis, where the ratio of 15N to 14N is compared, expressed as δ15N. Stable isotope analysis provides trophic level estimates, with greater δ15N present in predator diets, such as seabirds, due to their diets of fish, squids, and other relatively high trophic level species (Hobson and Welch, 1992). δ15N and total nitrogen content (%N) were used to infer the uptake of nutrients through terrestrial and intertidal food chains, using samples from three high seabird density island sites (seabird islands) and three low seabird density mainland sites (the mainland) to determine spatial variation. These samples were collected during the early seabird breeding season (4-8 May 2022).
Terrestrial samples included soil, terrestrial plants, and lichen. To collect topsoil, loose leaf litter and vegetation was cleared to expose the soil. New-growth leaves were taken from non-legume plants that use the C3 photosynthetic pathway to fix carbon dioxide during photosynthesis: sea campion (Silene maritima), dock (Rumex spp.), nettles (Urtica dioica), fiddlenecks (Amsinckia spp.), small bugloss (Anchusa arvensis), common orache (Atriplex patula), or red goosefoot (Chenopodium rubrum). The lichen collected was common orange lichen (Xanthoria parietina). Intertidal samples included macroalgae, epiphytic algae, turf algae, barnacles, and limpets. For the intertidal primary producers, macroalgae species were egg wrack (Ascophyllum nodosum), bladder wrack (Fucus vesiculosus), or serrated wrack (Fucus serratus); epiphytic algae species were red algae (Polysiphonia spp.) or tiny wrack bush (Elachista fucicola); turf algae species were pepper dulse (Osmundea spp.), tufted coral weed (Corallina spp.), green branched weeds (Cladophera spp.), sea lettuce (Ulva spp.), Irish moss (Chrondus crispus), or false Irish moss (Mastocarpus stellatus). For the intertidal consumers, we collected a mollusc, the common limpet (Patella vulgata) and barnacles, the acorn barnacle (Semibalanus balanoides). Five samples of each terrestrial and intertidal sample type were taken, except for epiphytic algae on Brownsman, due to its absence. Samples were taken a minimum of 5 m apart from one another to ensure each sample was unique.
All samples were dried in a food dehydrator at 60°C for 36 h, or until fully dry, and stored in plastic sample vials. Soil, lichen, macroalgae, epiphytic algae, turf algae, and barnacles were acid washed with hydrochloric acid to dissolve any calcareous matter or sediments that may have contaminated the samples, whereas limpets were extracted from their shells. Stable isotope analysis of nitrogen for all samples was carried out at Lancaster Environment Centre, Lancaster University, UK, using an Elementar Vario MICRO cube Elementar Analyser and analysed in an Isoprime 100 Isotope Ratio Mass Spectrometer, with international standards IAEA 600 and USGS 41. Isotope ratios and %N were calculated from 2 to 91 mg of each sample added to tin capsules. Accuracy based on international standards was 0.2 per mil standard deviation, with selected samples run in duplicate or triplicate to ensure precision of readings.
2.5 Community composition
Intertidal community composition was surveyed at four seabird island and four mainland study sites. Five replicate 0.5 m2 quadrats were positioned a minimum of 5 m apart at each site in the mid-shore intertidal zone. To determine algae and sessile filter feeder community structure, all algae and sessile filter feeder species were identified and their percent coverage estimated by two observers, where the final value was the mean of the two estimates; the percent coverage of all vacant rocky surface was estimated using the same method. All invertebrate fauna were identified and counted to calculate their abundance. To determine the relative similarity of intertidal community structure between the rocky shores at the mainland sites and seabird islands, intertidal species were classed into four functional groups based on their ecology: macroalgae, turf algae, intertidal invertebrate herbivores (e.g., periwinkles, but excluding limpets) and intertidal invertebrate predators (e.g., dogwhelks). Limpets were excluded from this analysis as they were analysed separately (see section 2.6). To compare species diversity and taxonomic relatedness, diversity measures were calculated for both algal and faunal taxa to determine species richness (total taxa), Shannon’s diversity index (H’; Shannon, 1948), and Pielou’s evenness index (J’; Pielou, 1966).
2.6 Limpet size, abundance, and biomass
The size distribution of 100 common limpet individuals at each site was compared between four mainland and four seabird island sites during the early breeding season visit. Vernier callipers were used to measure limpet maximum shell length to an accuracy of 1 mm. Limpet abundance (count per 0.5 m2) was counted in the same five quadrats per site used for the community analysis data (see section 2.5). As the quantity of algae grazed is more closely related to the biomass of limpets than the number present, limpet biomass was calculated using the following mass/length regression equation (Branch, 1971; Bosman and Hockey, 1988):
where dry somatic and gonadal mass (M) is a factor of the length in mm (L). Limpet biomass was site specifically calculated using the size distribution of the 100 limpets measured at each respective site, with limpets within each quadrat assumed to show the same pattern of size as the 100 individuals measured. Biomass was then calculated as a factor of limpet length and abundance.
2.7 Recolonisation patterns
To determine re-colonisation rates following a recent experimental disturbance, five 15 cm2 plots were artificially cleared in the mid-shore intertidal zone on three mainland sites and three seabird islands. Prior to clearance, percentage cover of algal species and sessile filter feeders was determined, and all invertebrate intertidal fauna were identified and counted. Plots were then cleared of all algae, sessile filter feeders, and common limpets. Plot clearances took place during 4-8 May 2022, around the period of acorn barnacles settlement (Hawkins and Hartnoll, 1982), using paint scrapers and wire brushes, leaving a substratum of bare rock. The plots were checked at two eight-week intervals (totalling 16 weeks) to determine algae and sessile filter feeder recolonisation levels (percent cover), and the number of all invertebrates present (counts).
2.8 Statistical analysis
To test for differences in the responses of terrestrial and intertidal communities around high seabird density islands versus low seabird density mainland sites, a combination of univariate and multivariate statistics were used. Linear mixed models (LMMs) were used to analyse univariate responses to seabird presence for δ15N and %N, with site included as a random effect to account for spatial non-independence among samples.
A multivariate non-metric multidimensional scaling (NMDS) was performed on Bray-Curtis similarity matrices to analyse algae and sessile filter feeder percentage coverage data, as well as the intertidal fauna count data (Kruskal, 1964). Multivariate analyses were performed on untransformed data, to determine the contributions of the dominant species, and on presence-absence data, to determine the contribution of intermediate and rarer species (Clarke et al., 2014).
PERMANOVA tests were conducted to test for community differences in intertidal species (Anderson and Walsh, 2013). Seabird islands were compared with the mainland (considered as a fixed factor) using data averaged by site to account for any non-independence of multiple samples at the same site. Indicator species analysis (IndVal; Dufrêne and Legendre, 1997) can be used to help determine when one or several species characterise a habitat. Here, it was used to help determine which species drove similarities between communities and was performed on both percentage coverage and count data. LMM univariate tests were then performed on IndVal selected algae and intertidal fauna species on both the untransformed and presence-absence data, with site included as a random effect. LMMs were also used to analyse univariate responses to seabird presence in limpet lengths, abundances, and biomasses, again with site included as a random effect to account for spatial non-independence among samples.
Univariate analyses were not performed when there were extreme unequal variances between mainland and seabird island sites (e.g., abundance of intertidal dogwhelks, Nucella lapillus). All univariate analyses were assessed for normality and homogeneity, with square root transformations used when those assumptions were not met. This was the case for individual species densities of serrated wrack, pepper dulse, mussels (Mytilus edulis), and common winkles (Littorina littorea), as well as the ‘turf algae’ and ‘other herbivores’ functional groups, and limpet biomass. Likelihood ratio tests were used to determine the effect of seabird density (low versus high) on each response (Zuur et al., 2009).
To determine whether the presence of seabirds influenced recolonisation responses of barnacles (percent coverage) and limpets (counts), the effect of seabirds (high versus low seabird abundances), time (prior to clearance of plots, zero weeks, eight weeks, and 16 weeks), and their interaction were analysed. As above, site was included as a random effect to account for spatial non-independence among samples (Zuur et al., 2009), and post-hoc tests with a Bonferroni correction performed to determine the drivers of differences (Holm, 1979).
All statistical analyses were conducted in R version 4.0.2 with associated packages ggplot2, dplyr, vegan, ape, indicspecies, rstatix, and lme4 (De Caceres and Legendre, 2009; Bates et al., 2015; Wickham, 2016; Wickham et al., 2018; Paradis and Schliep, 2019; Oksanen et al., 2020; Kassambara, 2021).
All results were interpreted using the language suggested by Muff et al. (2022).
3 Results
3.1 Seabird density and estimated nitrogen input
Mean seabird density, averaged across a five-year period, was 1563, 2279, and 949 times greater for seabird islands Inner Farne, Staple, and Brownsman, respectively, than on the mainland (Figure 2A; mean ± standard error (SE); 3778.0 ± 125.1, 5509.3 ± 232.2, and 2334.3 ± 93.1 birds ha-1 for Inner Farne, Staple, and Brownsman, respectively; 2 ± 0.4 birds ha-1 for the mainland). Mean estimated seabird nitrogen input, averaged across a five-year period, was 669, 1025, and 420 times greater for Inner Farne, Staple, and Brownsman, respectively, than on the mainland (Figure 2B; mean ± SE; 923.68 ± 49.8, 1414.6 ± 76.6, and 579.4 ± 21.2 kg-1 ha-1 for Inner Farne, Staple, and Brownsman, respectively; 1.38 ± 0.5 kg-1 ha-1 for the mainland).
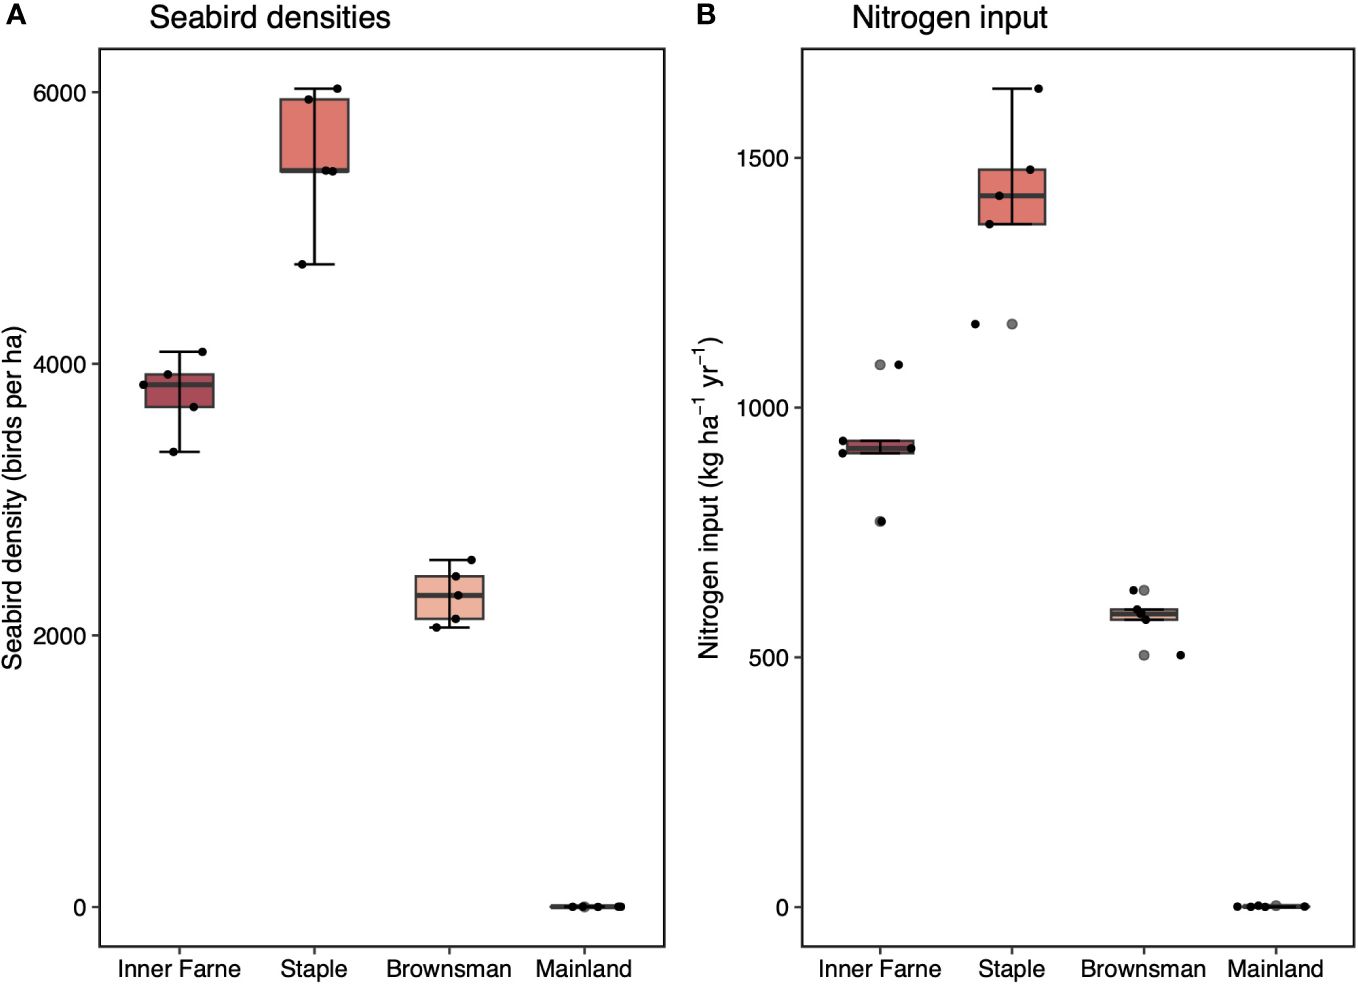
Figure 2 Seabird densities and nitrogen input to seabird islands (Inner Farne, Staple, and Brownsman, the Farne Islands) and low seabird density mainland sites (Northumberland coast). (A) Seabird density on Inner Farne, Staple, and Brownsman and the mainland. (B) Nitrogen input by seabirds for Inner Farne, Staple, Brownsman, and the mainland. Values are mean ( ± SE, n = 5). Box limits represent the first and third quartiles (25% and 75% percentiles), middle line represents the median (50% percentile), and whiskers represent the smallest and largest observations less than or equal to 1.5 × inter-quartile range. Note differences in y-axes.
3.2 Nitrogen stable isotope and nutrient analysis
Soils, terrestrial plants, lichen, macroalgae, turf algae, barnacles, and limpets on seabird islands had enriched δ15N in comparison to those from mainland sites (Figures 3A–H, Table 1). δ15N was much higher for terrestrial samples soil, plants, and lichen than intertidal samples, reflecting the direct guano signature. Soil, terrestrial plants, lichen, turf algae, barnacles, and limpets also had significantly higher %N on high seabird density islands (Figures 3I–P, Table 1).
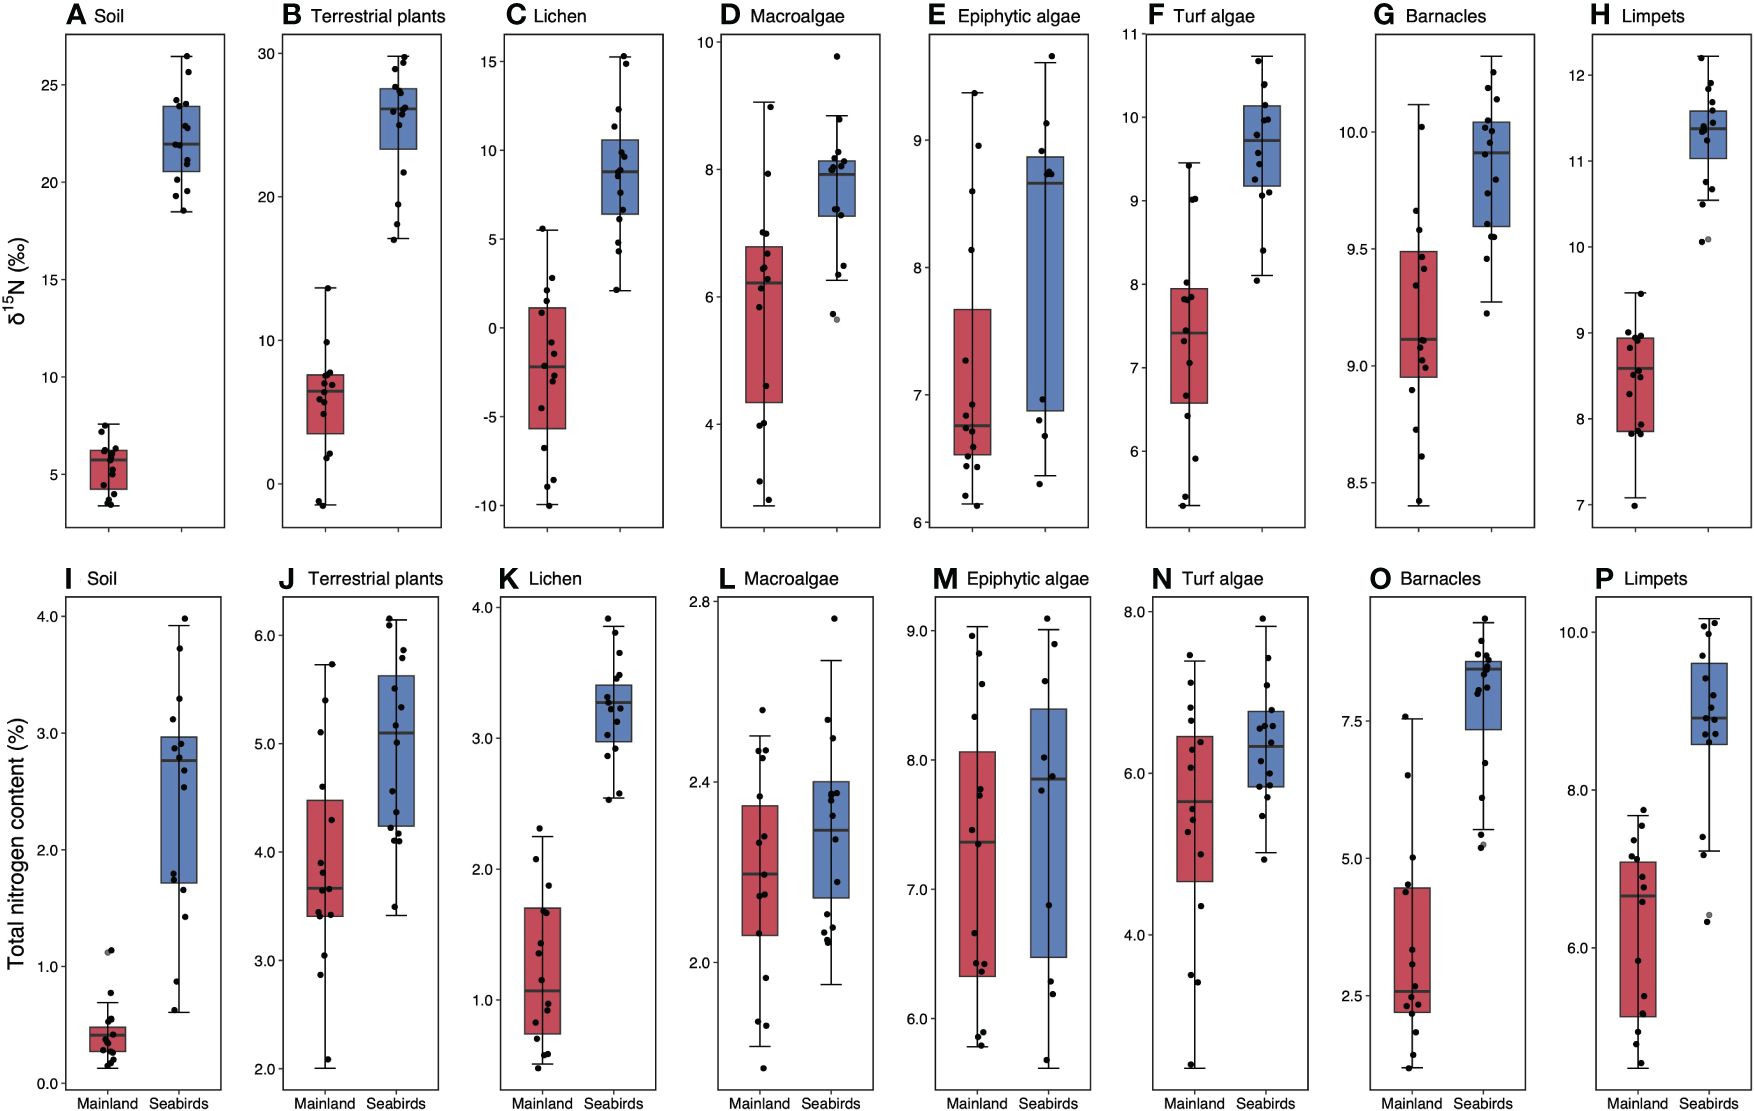
Figure 3 Early-breeding season nitrogen isotope signals and total nitrogen content in terrestrial and intertidal areas on the low seabird density mainland sites and seabird islands. A-H, δ15N values for (A) soil, (B) new growth leaves, (C) lichen, (D) macroalgae, (E) epiphytic algae, (F) turf algae, (G) barnacles, and (H) limpets. I-P, total nitrogen content for (I) soil, (J) new growth leaves, (K) lichen, (L) macroalgae, (M) epiphytic algae, (N) turf algae, (O) barnacles, and (P) limpets. Values are mean (± SE, n = 15 for all sample types except for seabird island epiphytic algae, where n = 10). Box limits represent the first and third quartiles (25% and 75% percentiles), middle line represents the median (50% percentile), and whiskers represent the smallest and largest observations less than or equal to 1.5 × inter-quartile range.
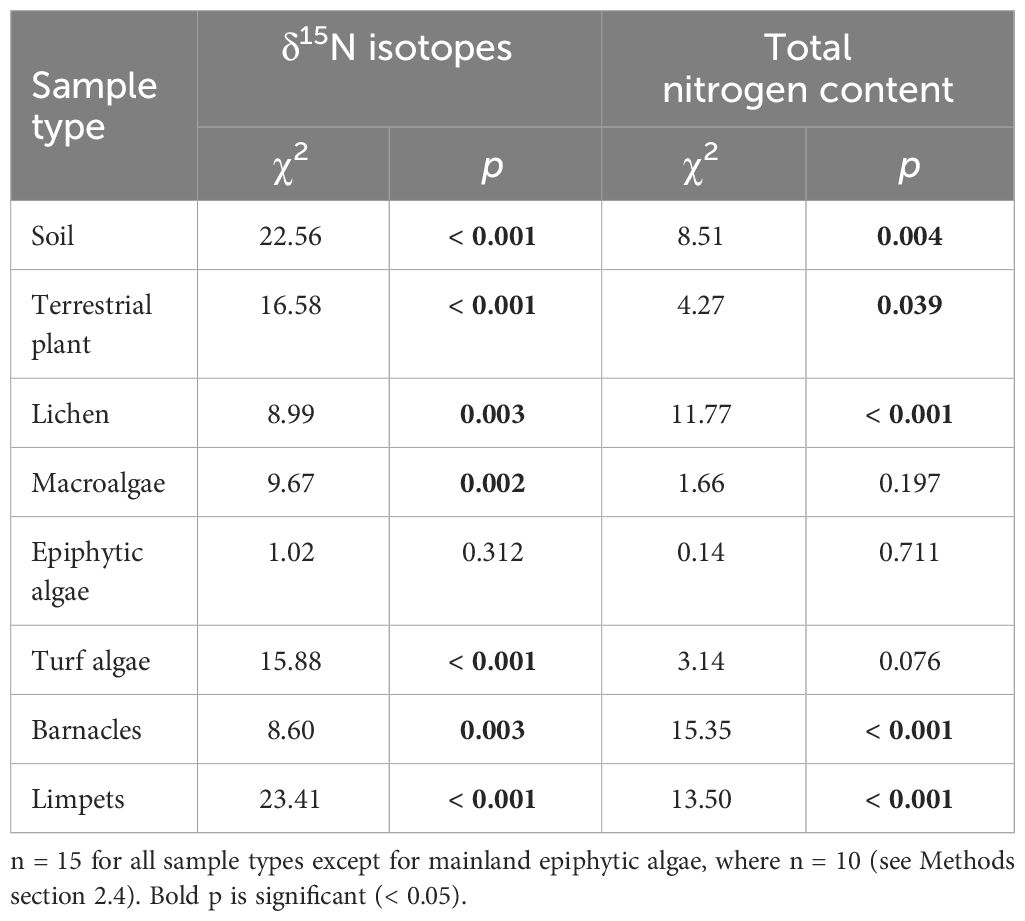
Table 1 Early breeding season nitrogen isotope and total nitrogen statistical results in terrestrial and intertidal areas on low seabird density mainland sites and seabird islands.
3.3 Community composition analysis
3.3.1 Algae and sessile filter feeders
There was no difference in intertidal community structure [all algal types, sessile filter feeders, and vacant surfaces (i.e., rock and sand)] between mainland sites and the seabird island sites when using the untransformed data (so as to determine the contributions of the dominant species; Figure 4A; PERMANOVA, F = 1.94, p = 0.122). There was weak evidence of a difference when analysing the presence-absence data to determine contributions of intermediate and rarer species (Figure 4B; PERMANOVA, F = 1.50, p = 0.058).
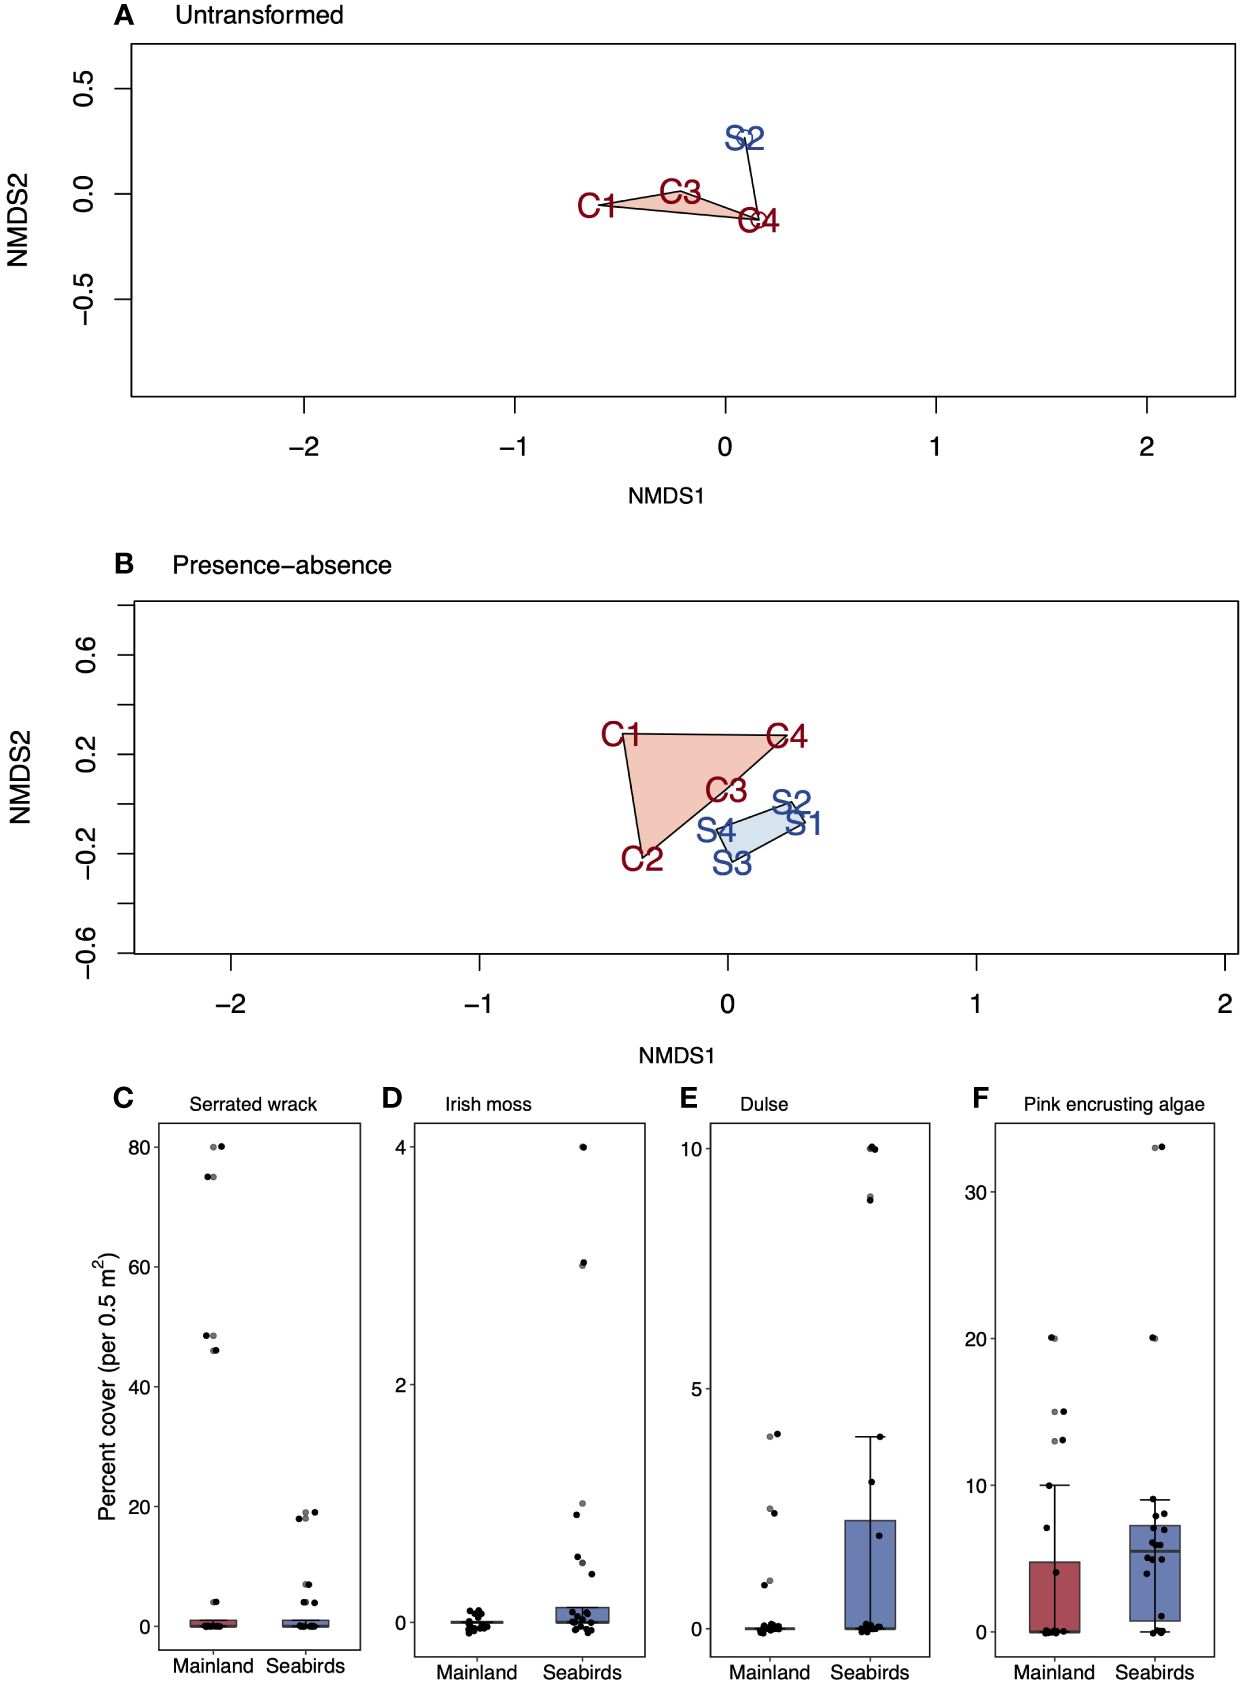
Figure 4 Non-metric dimensional analysis (NMDS) biplots and boxplots comparing indicator species (those driving community dissimilarities) on low seabird density mainland sites and seabird islands. (A, B), NMDS for (A) raw, untransformed algae and sessile filter feeder percent cover data (highlights dominant species importance), and (B) presence-absence transformed data (highlights intermediate and rarer species importance). Mainland sites are displayed as M1-4, seabird sites are displayed as S1-4. (C–F), algae and sessile filter feeder percent cover (untransformed data) for (C) serrated wrack, (D) Irish moss, (E) dulse, and (F) pink encrusting algae. Values are mean (± SE, n = 20). Box limits represent the first and third quartiles (25% and 75% percentiles), middle line represents the median (50% percentile), and whiskers represent the smallest and largest observations less than or equal to 1.5 × inter-quartile range.
When analysing the contributions of the dominant species, indicator species analysis (IndVal) determined which species characterised each habitat. IndVal determined that whilst some species were driving differences between the seabird islands and the mainland, none of the differences were significant. These species were the macroalga Fucus serratus (Figure 4C; mean ± SE; Chi-squared test; mainland = 12.7 ± 5.9% per 0.5 m2, seabird islands = 2.6 ± 1.3% per 0.5 m2; df = 1, N = 20, χ2 = 0.95, p = 0.329), and turf algae Chrondus crispus (Figure 4D; mean ± SE; not statistically analysed; mainland = 0.0 ± 0.0% per 0.5 m2, seabird islands = 0.5 ± 0.2% per 0.5 m2), Palmaria palmata (Figure 4E; mean ± SE; Chi-squared test; mainland = 0.4 ± 0.2% per 0.5 m2, seabird islands = 1.9 ± 0.8% per 0.5 m2; df = 1, N = 20, χ2 = 0.73, p = 0.394), and Corallinaceae (Figure 4F; mean ± SE; Chi-squared test; mainland = 3.5 ± 1.4% per 0.5 m2, seabird islands = 6.5 ± 1.7% per 0.5 m2; df = 1, N = 20, χ2 = 1.14, p = 0.286).
For intermediate and rarer species, IndVal again determined the species that characterised the seabird island mainland habitats. Again, non-significant community differences were driven by the green turf algae Cladophora (proportion of samples where species was present ± SE; Chi-squared test; mainland = 0.3 ± 0.1%, seabird islands = 0.6 ± 0.1; df = 1, N = 20, χ2 = 0.95, p = 0.329), and Mastocarpus stellatus (proportion of samples where species was present ± SE; Chi-squared test; mainland = 0.2 ± 0.1, seabird islands = 0.3 ± 0.1; df = 1, N = 15, χ2 = 0.43, p = 0.511).
3.3.2 Intertidal invertebrate fauna
Moderate evidence was found of a difference between mainland and seabird island intertidal invertebrate faunal communities when analysing presence-absence data to determine the contributions of intermediate and rarer species (Figure 5B; PERMANOVA, F = 2.64, p = 0.026). Dogwhelks drove dissimilarities between the mainland and the seabird island communities (proportion of samples where species was present ± SE; not statistically analysed; mainland = 0.0 ± 0.0, seabird islands = 0.4 ± 0.1).
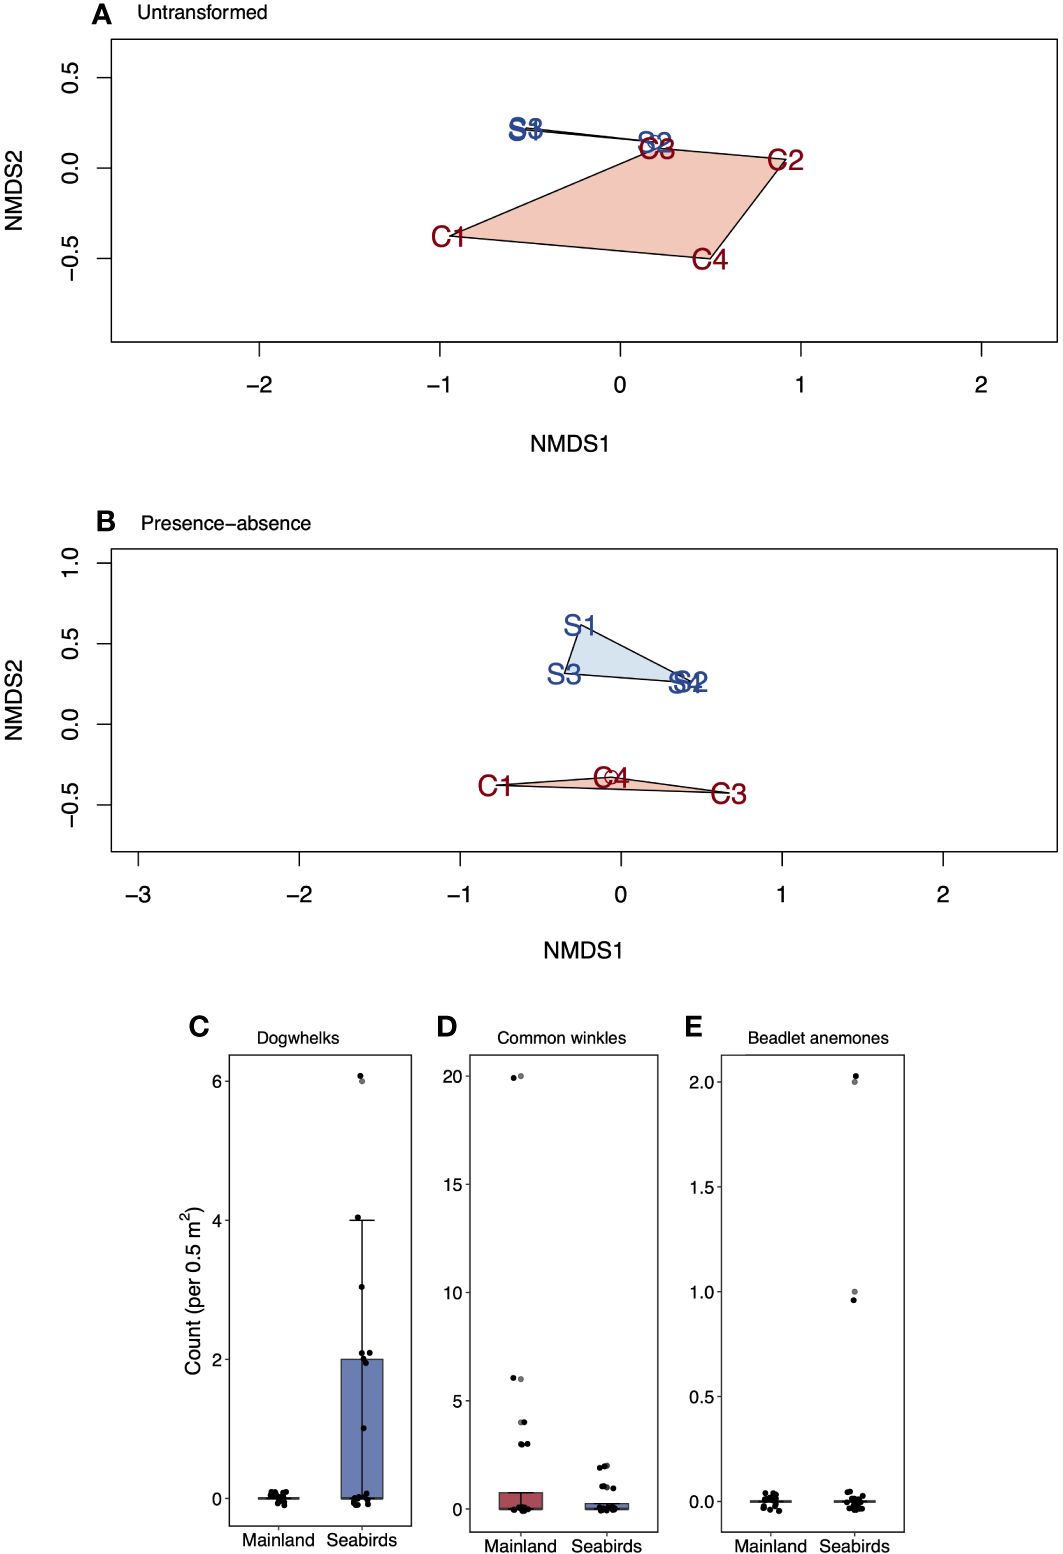
Figure 5 Non-metric dimensional analysis (NMDS) biplots and boxplots comparing indicator species (those driving community dissimilarities) on the low seabird density mainland sites and seabird islands. A-B, NMDS for (A) untransformed data (highlights dominant species importance), and (B) presence-absence transformed data (highlights intermediate and rarer species importance). Mainland sites are displayed as M1-4, seabird sites are displayed as S1-4. C, count (untransformed data) for (C) dogwhelks, (D) common winkles, and (E) beadlet anemones. Values are mean (± SE, n = 20). Box limits represent the first and third quartiles (25% and 75% percentiles), middle line represents the median (50% percentile), and whiskers represent the smallest and largest observations less than or equal to 1.5 × inter-quartile range.
There was no difference in intertidal invertebrate fauna when analysing the untransformed data to determine the contributions of the dominant species (Figure 5A; PERMANOVA, F = 2.39, p = 0.113). The species that drove dissimilarities between the mainland and seabird island communities were dogwhelks (Figure 5C; mean ± SE; not statistically analysed; mainland = 0.0 ± 0.0 no. per 0.5 m2, seabird islands = 1.1 ± 0.4 no. per 0.5 m2) and common winkle (Figure 5D; mean ± SE; Chi-squared test; mainland = 1.8 ± 1.0 no. per 0.5 m2, seabird islands = 0.4 ± 0.2 no. per 0.5 m2; df = 1, N = 20, χ2 = 0.77, p = 0.381).
3.3.3 Ecological community functional groups
Strong evidence was found of higher intertidal predator densities on seabird islands than on the mainland (Supplementary Figure S1E; Chi-squared test; mean ± SE; mainland = 0.1 ± 0.1 no. per 0.5 m2, seabird islands = 1.3 ± 0.4 no. per 0.5 m2; df = 1, N = 20, χ2 = 7.22, p = 0.007). However, there were no significant differences in densities in macroalgae (Supplementary Figure S1A; Chi-squared test; mean ± SE; mainland = 48.9 ± 9.1% per 0.5 m2, seabird islands = 63.0 ± 6.7% per 0.5 m2; df = 1, N = 15, χ2 = 1.38, p = 0.240), turf algae (Supplementary Figure S1B; Chi-squared test (square root transformed); mean ± SE; mainland = 11.1 ± 3.2% per 0.5 m2, seabird islands = 14.3 ± 3.3% per 0.5 m2; df = 1, N = 20, χ2 = 0.28, p = 0.597), sessile filter feeders (Supplementary Figure S1C; Chi-squared test; mean ± SE; mainland = 28.1 ± 6.6% per 0.5 m2, seabird islands = 31.6 ± 4.6% per 0.5 m2; df = 1, N = 20, χ2 = 0.06, p = 0.812), and other herbivores (Supplementary Figure S1D; Chi-squared test; mean ± SE; mainland = 3.4 ± 1.3 no. per 0.5 m2, seabird islands = 1.1 ± 0.3 no. per 0.5 m2, df = 1, N = 20, χ2 = 1.66, p = 0.198).
3.3.4 Diversity measures
There was weak evidence of a trend towards higher algal species richness on seabird islands compared to the mainland (Supplementary Figure S2A; Chi-squared test; mean ± SE; mainland = 4.8 ± 0.5 no. per 0.5 m2, seabirds = 6.6 ± 0.5 no. per 0.5 m2; df = 1, N = 20, χ2 = 3.23, p = 0.072). However, there was no difference in the total number of intertidal fauna species (Supplementary Figure S2B; mean ± SE; Chi-squared test; mainland = 1.7 ± 0.2 no. per 0.5 m2, seabird islands = 2.0 ± 0.3 no. per 0.5 m2; df = 1, N = 20, χ2 = 0.55, p = 0.458). No difference in Shannon’s Diversity Index (H’) between seabird islands and the mainland was detected for algal species (Supplementary Figure S2C; mean ± SE; Chi-squared test; mainland = 0.6 ± 0.1 H’, seabird islands = 0.8 ± 0.1 H’; df = 1, N = 20, χ2 = 0.41, p = 0.521) or fauna species (Supplementary Figure S2D; mean ± SE; Chi-squared test; mainland = 0.6 ± 0.1 H’, seabird islands = 0.6 ± 0.1 H’; df = 1, N = 20, χ2 = 0.19, p = 0.661). No distinct variation in Pielou’s Evenness Index (J’) between the seabird islands and the mainland was detected for algal species (Supplementary Figure S2E; mean ± SE; Chi-squared test; mainland = 0.2 ± 0.0 J’, seabird islands = 0.2 ± 0.0 J’; df = 1, N = 20, χ2 = 0.41, p = 0.521) or fauna species (Supplementary Figure S2F; mean ± SE; Chi-squared test; mainland = 0.2 ± 0.0 J’, seabird islands = 0.2 ± 0.0 J’; df = 1, N = 20, χ2 = 0.19, p = 0.662).
3.4 Limpet size, abundance, and biomass
Due to high variation, there was no difference in limpet length despite a higher effect size on the seabird islands compared to the mainland (Figure 6A; Chi-squared test; mean ± SE, mainland = 29.7 ± 0.6 mm, seabird islands = 35.8 ± 0.4 mm; df = 1, N = 400, χ2 = 2.17, p = 0.141). Similarly, there was no difference in limpet abundance despite a high effect size (Figure 6C; Chi-squared test; mean ± SE; mainland = 12.7 ± 3.6 no. per 0.5 m2; seabird islands = 5.0 ± 1.1 no. per 0.5 m2; df = 1, N = 20, χ2 = 2.83, p = 0.160). No difference in limpet biomass was detected between the mainland and seabird islands (Figure 6B; Chi-squared test; mean ± SE; mainland = 4.8 ± 1.4 g per 0.5 m2, seabird islands = 3.1 ± 0.7 g per 0.5 m2; df = 1, N = 400, χ2 = 1.19, p = 0.275).
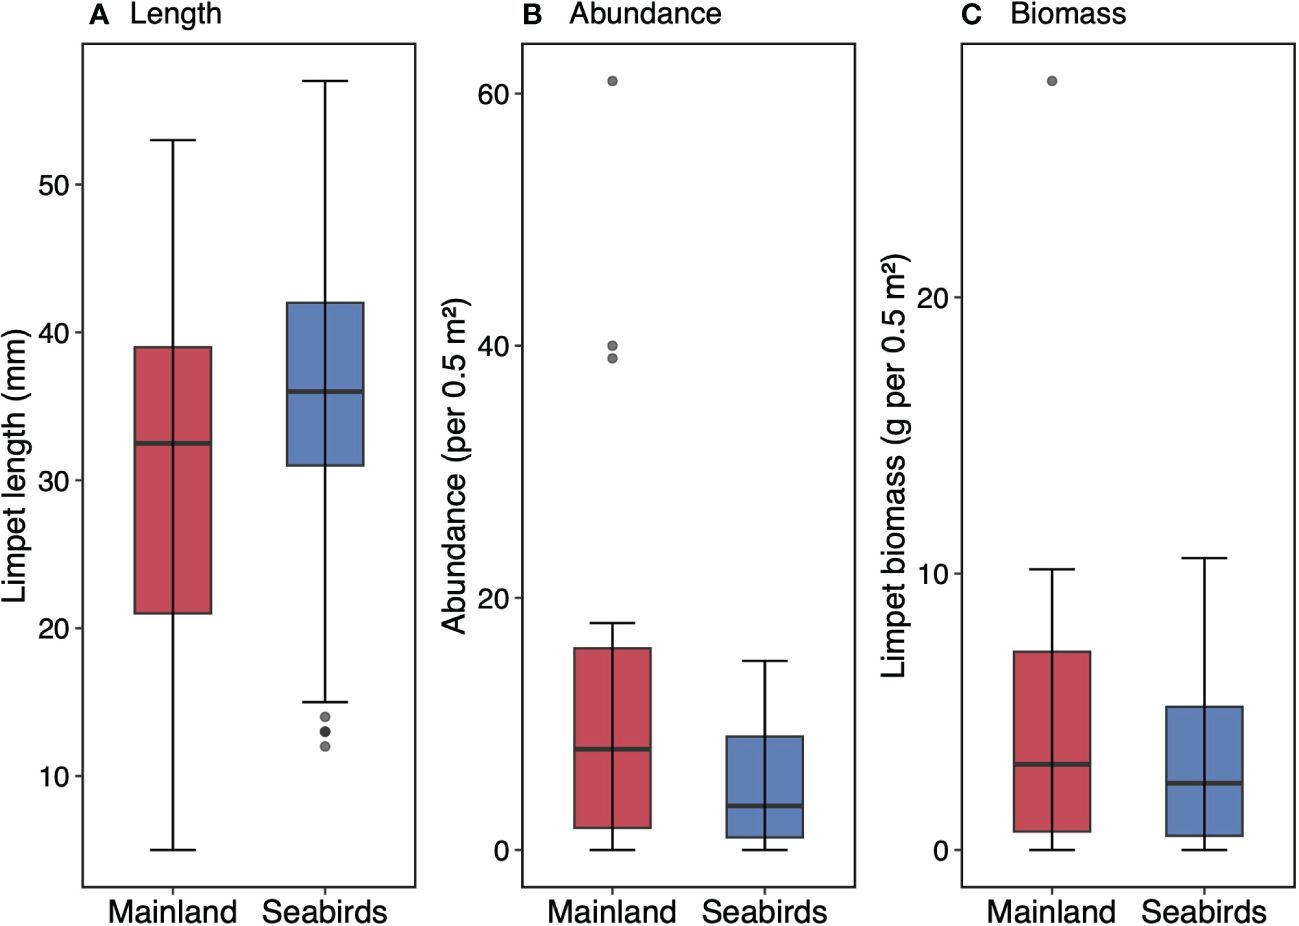
Figure 6 Limpet distribution boxplots comparing low seabird density mainland sites and seabird islands. Distributions for (A) limpet length, (B) limpet abundance, and (C) limpet biomass. Values are mean (± SE, n = 400 for A; n = 20 for (B, C). Box limits represent the first and third quartiles (25% and 75% percentiles), middle line represents the median (50% percentile), and whiskers represent the smallest and largest observations less than or equal to 1.5 × inter-quartile range. Note differences in y-axis.
3.5 Recolonisation patterns
Recolonisation rates of barnacles following experimental clearances were higher on the mainland than on seabird islands, and this effect did not vary with time (Figure 7A; seabirds*time; Chi-squared test; df = 2, N = 15, c2 = 1.31, p = 0.520; seabirds; Chi- squared test; df = 2, N = 15, c2 = 4.38, p = 0.036). Barnacle abundance was significantly higher at 16 weeks post-clearance (Bonferroni; F = 10.240, p = 0.009), but there was only weak evidence of a difference in abundance in pre-clearance plots (Bonferroni; F = 5.97, p = 0.063) and little evidence at eight weeks post-clearance (Bonferroni; F = 4.86, p = 0.108).
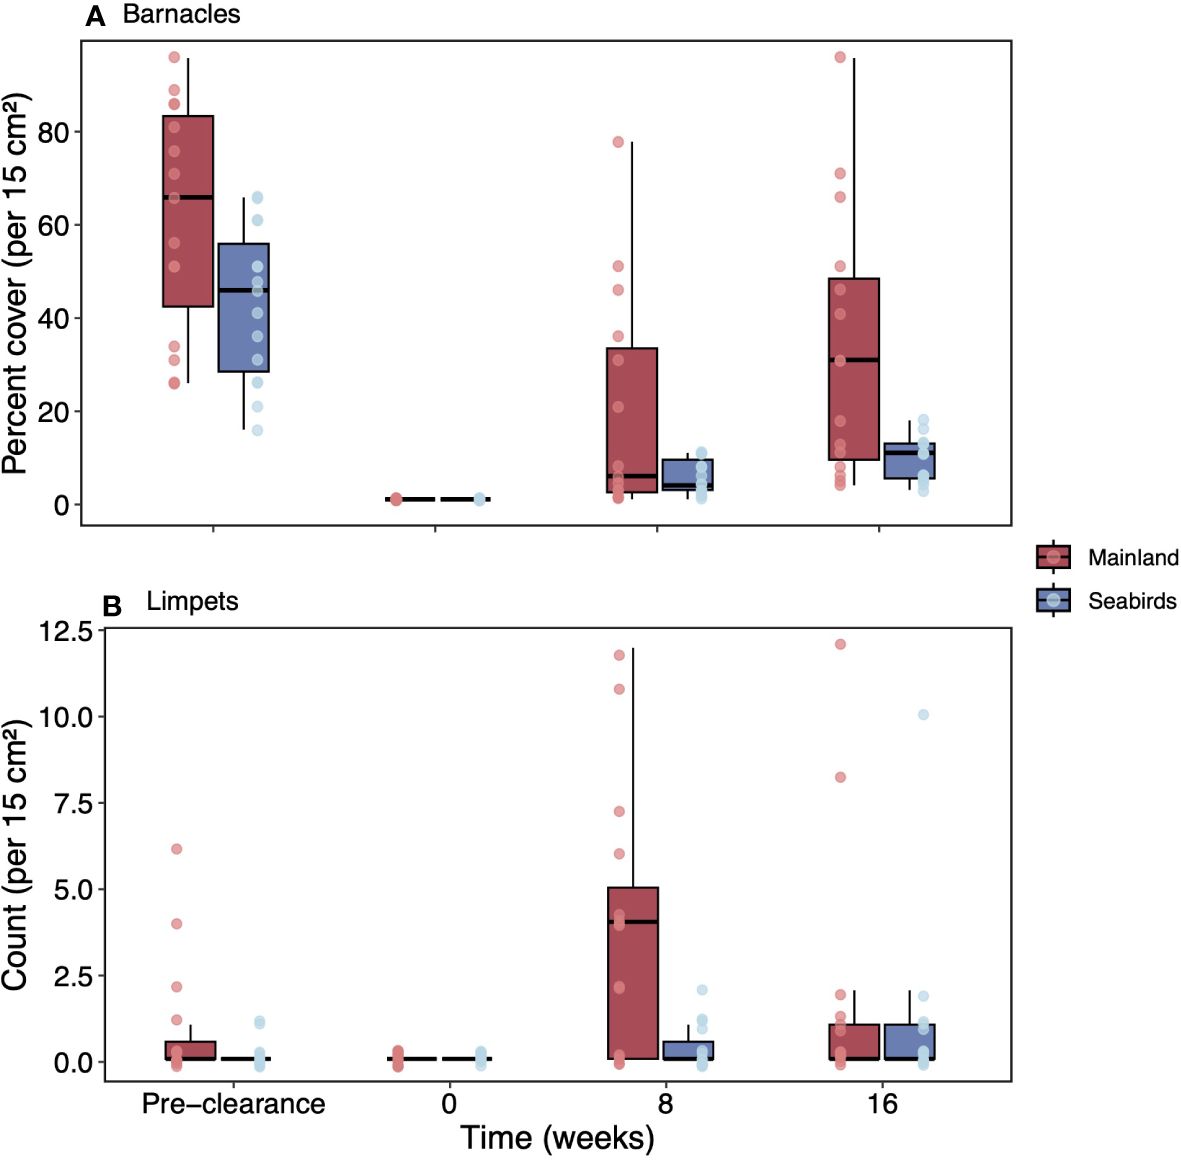
Figure 7 Recolonisation rates of clearance for low seabird density mainland sites and seabird islands. Recolonisation rates from pre-clearance, zero weeks, eight weeks, and 16 weeks for mainland sites and seabird islands for (A) barnacles, and (B) limpets. Values are mean (± SE; n = 5). Box limits represent the first and third quartiles (25% and 75% percentiles), middle line represents the median (50% percentile), and whiskers represent the smallest and largest observations less than or equal to 1.5 × inter-quartile range.
Limpet recolonisation differed between mainland/seabirds and varied by time (Figure 7B; seabirds*time; Chi-squared test; df = 2, N = 15, c2 = 5.98, p = 0.050). Strong evidence was found of higher limpet abundance at seabird sites at eight weeks post-clearance (Bonferroni; F = 11.10, p = 0.006), but there was no difference in abundance in pre-clearance plots (Bonferroni; F = 2.38, p = 0.402) or at 16 weeks post-clearance (Bonferroni; F = 0.35, p = 1.000).
4 Discussion
The findings of our study provide evidence that that seabirds are inputting pelagic nutrients to the terrestrial and intertidal ecosystems of temperate UK islands. Thus, seabirds provide a key cross-ecosystem link. However, there was limited evidence for seabird nutrients affecting intertidal community structure. There was some evidence that intertidal diversity was marginally greater on seabird islands (i.e., differences in intertidal fauna communities and functional group densities), while barnacle recolonisation rates were faster at low seabird density mainland sites. Disentangling the effects of seabird nutrients from other potential differences between the seabird islands and mainland locations will enable a better understanding of the role of seabird nutrient subsidies in temperate rocky intertidal systems.
Higher densities of seabirds were found on the Farne Islands, Northumberland, compared to the Northumberland mainland by four orders of magnitude. By foraging in pelagic feeding areas, seabirds were estimated to have vectored between three and four orders of magnitude more nitrogen inputs to the seabird islands compared to the mainland. The seabird density and nitrogen inputs revealed by our study are comparable with those observed in a tropical environment, where seabird density and nitrogen input were both three orders of magnitude greater on rat-free islands than those that had rats present on them (Graham et al., 2018). The higher density of seabirds on the Farne Islands is most likely due to these islands being predator free, in comparison to the mainland sites where predators including rats, cats and foxes would decimate seabird populations in accessible habitats.
The nutrient inputs from seabirds to the Farne Islands are used by terrestrial and intertidal organisms, evidenced by higher δ15N signals being found in soil, new-growth leaves, and lichen, as well as macroalgae, turf algae, barnacles, and limpets on seabird islands compared to low density seabird sites. The third highest δ15N values were found in limpets, which is likely explained by δ15N values increasing with trophic levels, and microphagous limpets grazing on 15N enriched early macroalgal stages and microalgal film (Jenkins and Hartnoll, 2001). This stepwise enrichment is consistent with other research in marine systems (Hobson and Welch, 1992; Zmudczyńska-Skarbek et al., 2015; Graham et al., 2018), although other studies have found mixed responses (Gagnon et al., 2013), or instances of primary consumers having higher 15N values than secondary consumers (Hong et al., 2019; Andrades et al., 2024). Significantly elevated nitrogen content was also found in soil, terrestrial plants, lichen, barnacles, and limpets, as well as marginally elevated turf algae nitrogen content. These findings support the hypothesis that seabird nutrient subsidies are cycling through the terrestrial and intertidal habitats. Previous studies in saltwater systems show that the proportion of seabird-derived nutrients decreases with increasing distance from seabird colonies (Jones, 2010; McCauley et al., 2012; Lorrain et al., 2017; Savage, 2019; Benkwitt et al., 2021a). Indeed, a similar pattern was generally observed in this study, with the samples closest to the seabird colonies (terrestrial plants and soil) having the greatest δ15N values on seabird islands, and macroalgae, epiphytic algae, and turf algae that inhabit intertidal areas further from the colony having lower values. By contrast, total nitrogen content was generally higher within intertidal samples than terrestrial ones, with all the intertidal samples except macroalgae having a higher %N value. This may indicate that nitrogen is also being input directly from the marine environment, such as from the North Sea. Whilst the difference in the patterns of δ15N and %N could be argued to contradict each other to an extent, the high δ15N values show that, despite other sources of nutrient input to the system, pelagic-derived seabird nutrients make up a dominant component of the Farne Island terrestrial and intertidal nutrient budgets.
Compared with tropical or polar regions, cold temperate regions are typically very productive and may provide high levels of background nutrients to the region (Sigman and Hain, 2012). Furthermore, two possible sources of nitrogen input exist in two areas close to the mainland study sites. First, there are reported marine nitrate toxicity issues in the River Tweed, around eight to ten kilometres north of the mainland study sites (Jarvie et al., 2002). Second, there is eutrophication at Lindisfarne National Nature Reserve, around 25 km north of the mainland study sites, where sources of nitrogen include diffuse agricultural runoff, misconnections in public and private sewage treatment works, and seasonal tourism pressures on dated sewage treatment facilities (NCC, 2020). Sewage δ15N signatures are comparable to those of animal waste and are almost always over 10‰, reaching up to around 20‰ (Heaton, 1986). In our study sites, mainland δ15N signals were below 10‰ in each sample type, providing evidence that sewage is not a major source of nitrogen input to these areas. Fertiliser δ15N signatures typically range from -2 to 2‰, though can reach values of 4‰ (Bateman and Kelly, 2007). A global study of soil δ15N trends estimated that UK δ15N values range between 3.5 and 6.2‰ (Amundson et al., 2003), and indeed, on the mainland study sites, δ15N signatures were 5.4 ± 0.3‰. Given that fertiliser δ15N values are lower than those of both typical soil and those observed on the mainland, δ15N cannot reliably be used to determine whether fertiliser is a source of nitrogen input to the mainland sites.
As well as being seabird breeding colonies, seals also inhabit the Farne Islands, predominantly grey seals (Halichoerus grypus), who use the islands as rookeries during their breeding season from October to January. Foraging distance in grey seals from the Farne Islands varies from short trips to known haul-out sites (mean distance 39.8 km) to long and distant journeys (2100 km; McConnell et al., 1999). Therefore, it is likely that seals are also providing an allochthonous source of nutrients to the Farne Islands. Furthermore, seal biomass exceeds that of seabird biomass on two of the three study islands (National Trust, 2022b). However, seabird abundance is approximately fifty times higher than seal abundance across the three islands (Webber et al., 2015; National Trust, 2022a, National Trust, 2022b). In terms of seal proximity to the sites on the seabird islands, it was confirmed by National Trust rangers working on the Farne Islands that none of the study sites were seal rookeries, and that the seabird colonies were closer to each study site than seal rookeries were. Some seabird species, like the gulls, also travel across the islands frequently, whereas the seals tend to haul out in one spot. Whilst the particularly high δ15N in the terrestrial samples suggest that it is the seabirds are the dominant cause of increased nitrogen loads to the terrestrial environments, it is clear that the seals are also providing a key source of nutrient input to the Farne Islands.
Nutrient input from seabirds can increase primary producer biomass, resulting in heightened algal herbivory and herbivore biomass, leading to increased resources for intertidal predators (Methratta, 2004). The similar densities of macroalgae, turf algae, sessile filter feeders, and other herbivores observed in this study indicate that the intertidal communities on seabird islands and the mainland are functionally similar. However, dogwhelks comprised 81% of the studied predators on seabird islands, yet were absent from mainland sites. Moreover, all sites were relatively sheltered and fairly similar in terms of wave exposure (on the Ballantine Index all mainland sites were considered slightly more exposed than those on the seabird islands: mainland sites = 5; Farne Islands = 6, 7 and 7). Given that typically dogwhelks are more common on exposed rocky shores than sheltered coasts (Ballantine, 1961), dogwhelks would have been expected to be more common on the mainland sites, but here, we found the opposite to be true. Thus, another cause of higher densities of intertidal predators could be that seabird nutrient subsidies result in bottom-up interactions, possibly cascading productivity up the food web to create greater predator densities (Young et al., 2011). While it is possible that the increased seabird nutrients on the Farne Islands are supporting this additional trophic level, on its own this evidence falls short of substantiating this effect.
When comparing species diversity and taxonomic relatedness, we found that the intertidal communities surrounding seabird islands and mainland sites were similar and that there was no observed difference in fauna species richness, untransformed community species diversity, or evenness for either algal or fauna species. A non-significant trend towards higher algal species richness was observed, though, similar to higher macroalgal diversity on islands with the longest history of seabird presence in New Zealand (Rankin and Jones, 2021). Overall, though, the diversity effects of seabird nutrients in the present study were small. Drivers of ecological community diversity are highly complex and it is possible confounding variables exist between the seabird islands and the mainland in this study, as well as high levels of nutrients already being present in the cold-water system. In addition, whilst the exposure levels between the mainland and the seabird islands were relatively similar (Ballantine Index of mainland sites = 5; Farne Islands = 6 and 7), those differences are large enough for some different community patterns to exist (Ballantine, 1961). Island biogeography may also have influenced differences in community patterns (MacArthur and Wilson, 1967). However, island sites were less than five kilometres from the mainland and were close to one another as well as the other surrounding islands of the Farne Islands archipelago, thereby reducing the likelihood of this impact (Figure 1). The effects of island biogeography are also more relevant to terrestrial species than marine or intertidal species, due to differences in their dispersal mechanisms, which formed the focus of this study (Carr et al., 2003; Hachich et al., 2015; Strathmann, 2015; Pinheiro et al., 2017).
Although no statistical difference was detected in limpet size, abundance or biomass between seabird islands and the mainland, the effect size between the mainland and seabird islands was high, with mean limpet size 20% larger on seabird islands. It is possible that greater sampling is needed to reduce variability and detect statistically significant differences. The relationship between body size and population density within communities is central to explaining community resource use (Pagel et al., 1991), and indeed, the quantity of algae grazed is more closely related to the biomass of limpets than their abundance (Branch, 1971; Bosman and Hockey, 1988). Shell growth in common limpets is rapid in their first two years, with growth rates between 0.4 and 2.0 mm/month. This rate then decreases over time, with a negative linear relationship existing between initial length and increment each year. By five years of age, they exhibit no measurable growth rate. Indeed, common limpet individuals that are five years and older are few, and form only negligible proportions of limpet populations (Blackmore, 1969). Therefore, limpets attaining a larger size may suggest that their growth rates are more rapid (Branch, 1974; Balaparameswara Rao, 1976). If indeed seabird nutrient input is increasing limpet growth rate on the Farne Islands, then this is consistent with previous findings of faster limpet growth in the presence of seabirds (Bosman and Hockey, 1988). Enhanced growth rates have been observed in other marine organisms such as corals and fishes due to the bottom-up effects of allochthonous nutrients (Graham et al., 2018; Savage, 2019; Benkwitt et al., 2021b, Benkwitt et al., 2023). Another possibility is that limpet growth rates is related to population density in both populations. The lower population densities and higher body size on the seabird islands, and vice versa on the mainland, could be explained by density-dependent growth rates in response to the limited resources of space and food. This pattern has been observed in the closely related species, Patella depressa, and is further supported by the similar biomass between the seabird islands and the mainland (Boaventura et al., 2003).
Contrary to predictions, recolonisation rates were faster on the mainland than seabird islands for both barnacles and limpets, which was inconsistent with other studies (Kraufvelin et al., 2006; Kraufvelin, 2007; Masterson et al., 2008). Whilst we sought to minimise the impact of confounding variables in the study, the mainland and seabird islands are inherently physically and biologically different, and it is likely that seabird nutrient input is not the dominant driver of demographic differences between the communities. For example, lower recolonisation rates are expected on islands with increasing isolation (MacArthur and Wilson, 1967), but all of our study islands were close to the mainland (<5 km) so it is unlikely that the Theory of Island Biogeography alone explains the higher rates of recolonisation observed on the mainland. Barnacle abundances increase with heightened wave exposure levels, with the most sheltered shores being largely absent of barnacles (Ballantine, 1961). Indeed, the three sites on the seabird islands were more sheltered from the prevailing UK west to south-westerly winds compared to the mainland. Furthermore, biological barnacle settlement cues will also impact community differences, these including the presence of algae species and diatoms, the abundance/fineness of detrital matter, microheterogeneity, food supply, and chlorophyll a concentration (Le Tourneux and Bourget, 1988; Hills and Thomason, 1998; Burrows et al., 2010). Faster limpet recolonisation was also observed on mainland sites than on seabird islands, with limpet abundance at week eight driving the difference. It is likely that limpets were more abundant on the recently disturbed plots as this disturbance drove increases in the abundance of microphagous limpets’ preferred food type within the plots: a microalgal film largely consisting of diatoms and cyanobacteria (Jenkins and Hartnoll, 2001). It is also possible that the observed increase in barnacles recolonisation was in part driven by the increased limpet recolonisation, as has been observed in other empirical research (Benedetti-Cecchi, 2000).
To conclude, strong evidence was found of seabird nutrients moving through UK terrestrial and intertidal ecosystems, through elevated δ15N signals and total nitrogen content. This study suggests a clear link by seabirds from pelagic to terrestrial and intertidal habitats. Intertidal diversity differences between the Farne Islands and the low seabird abundance mainland were small, though higher numbers of intertidal dogwhelks and weak evidence of greater algal species richness did offer some support of community differences on the seabird islands. However, cold-water systems typically have high levels of background nutrients, and anthropogenic nutrient inputs from the mainland could not be quantified, so community differences between the islands and the mainland cannot definitively be attributed to seabird nutrients. This research shows the importance of seabirds in connecting ecosystems, but further work is necessary to disentangle the influence of seabird nutrient inputs compared to other factors that structure temperate rocky intertidal ecosystems.
Data availability statement
The raw data supporting the conclusions of this article will be made available by the authors, without undue reservation.
Ethics statement
The animal study was approved by Lancaster University Animal Welfare and Ethics Review Board. The study was conducted in accordance with the local legislation and institutional requirements.
Author contributions
SH: Writing – review & editing, Writing – original draft, Visualization, Software, Resources, Project administration, Methodology, Investigation, Formal analysis, Data curation, Conceptualization. CB: Writing – review & editing, Supervision, Resources, Methodology, Investigation, Funding acquisition. RD: Writing – review & editing, Visualization, Supervision, Resources, Methodology, Investigation, Funding acquisition. NG: Writing – review & editing, Validation, Supervision, Resources, Project administration, Methodology, Funding acquisition, Conceptualization.
Funding
The author(s) declare financial support was received for the research, authorship, and/or publication of this article. CB and RD were supported by the Bertarelli Foundation as part of the Bertarelli Programme in Marine Science (grant number: 2021-819047).
Acknowledgments
We thank Natural England, the National Trust, and Northumberland County Council for granting us permission to undertake the research. Note, initial agreement was made with Natural England for three sites on the Farne Islands for all methods, though partial observational data were also collected at a fourth site and communicated to Natural England for inclusion in the analyses. We also thank Dave Hughes for performing the stable isotope analysis.
Conflict of interest
The authors declare that the research was conducted in the absence of any commercial or financial relationships that could be construed as a potential conflict of interest.
Publisher’s note
All claims expressed in this article are solely those of the authors and do not necessarily represent those of their affiliated organizations, or those of the publisher, the editors and the reviewers. Any product that may be evaluated in this article, or claim that may be made by its manufacturer, is not guaranteed or endorsed by the publisher.
Supplementary material
The Supplementary Material for this article can be found online at: https://www.frontiersin.org/articles/10.3389/fmars.2024.1343966/full#supplementary-material
References
Amundson R., Austin A. T., Schuur E. A. G., Yoo K., Matzek V., Kendall C., et al. (2003). Global patterns of the isotopic composition of soil and plant nitrogen. Global Biogeochemical Cycles 17, (1). doi: 10.1029/2002GB001903
Anderson M. J., Walsh D. C. I. (2013). PERMANOVA, ANOSIM, and the Mantel test in the face of heterogeneous dispersions: What null hypothesis are you testing? Ecol. Monogr. 83, 557–574. doi: 10.1890/12-2010.1
Andrades R., Cardozo-Ferreira G. C., Benevides L. J., Pimentel C. R., Mancini P. L., Ferreira C. E., et al. (2024). Seabird guano reshapes intertidal reef food web in an isolated oceanic islet. Coral Reefs. 43, 1–9. doi: 10.1007/s00338-024-02469-w
Balaparameswara Rao M. (1976). Studies on the growth of the limpet Cellana radiata (Born) (Gastropoda: Prosobranchia). J. Molluscan Stud. 42, 136–144. doi: 10.1093/oxfordjournals.mollus.a065314
Ballantine W. J. (1961). A biologically-defined exposure scale for the comparative description of rocky shores. Field Stud. J. 1, 1–19.
Bateman A. S., Kelly S. D. (2007). Fertilizer nitrogen isotope signatures. Isotopes Environ. Health Stud. 43, 237–247. doi: 10.1080/10256010701550732
Bates D., Mächler M., Bolker B., Walker S. (2015). Fitting linear mixed-effects models using lme4. J. Stat. Software 67, 1–48. doi: 10.18637/jss.v067.i01
Benedetti-Cecchi L. (2000). Predicting direct and indirect interactions during succession in a mid-littoral rocky shore assemblage. Ecol. Monogr. 70, 45–72. doi: 10.1890/0012-9615(2000)070[0045:PDAIID]2.0.CO;2
Benkwitt C. E., D’Angelo C., Gunn R. L., Healing S., Mardones L., Wiedenmann J., et al. (2023). Seabirds boost coral reef resilience. Sci. Adv. 9, eadj0390. doi: 10.1126/sciadv.adj0390
Benkwitt C. E., Gunn R. L., Le Corre M., Carr P., Graham N. A. J. (2021a). Rat eradication restores nutrient subsidies from seabirds across terrestrial and marine ecosystems. Curr. Biol. 31, 2704–2711.e2704. doi: 10.1016/j.cub.2021.03.104
Benkwitt C. E., Taylor B. M., Meekan M. G., Graham N. A. J. (2021b). Natural nutrient subsidies alter demographic rates in a functionally important coral-reef fish. Sci. Rep. 11, 12575. doi: 10.1038/s41598-021-91884-y
Benkwitt C. E., Wilson S. K., Graham N. A. J. (2019). Seabird nutrient subsidies alter patterns of algal abundance and fish biomass on coral reefs following a bleaching event. Glob Chang Biol. 25, 2619–2632. doi: 10.1111/gcb.14643
BGS. (1896). Quarter-inch geological map of England and Wales [Old Series]. Northumberland, and parts of Cumberland and Durham. Available at: https://webapps.bgs.ac.uk/data/maps/maps.cfc?method=viewRecord&mapId=11707 (Accessed February 2023).
Blackmore D. T. (1969). Studies of Patella vulgata L. I. Growth, reproduction and zonal distribution. J. Exp. Mar. Biol. Ecol. 3, 200–213. doi: 10.1016/0022-0981(69)90018-5
Boaventura D., Da Fonseca L. C., Hawkins S. J. (2003). Size matters: competition within populations of the limpet Patella depressa. J. Anim. Ecol. 72, 435–446. doi: 10.1046/j.1365-2656.2003.00713.x
Bosman A. L., Du Toit J. T., Hockey P. A. R., Branch G. M. (1986). A field experiment demonstrating the influence of seabird guano on intertidal primary production. Estuarine Coasta Shelf Sci. 23, 283–294. doi: 10.1016/0272-7714(86)90028-4
Bosman A. L., Hockey P. A. R. (1986). Seabird guano as a determinant of rocky intertidal community structure. Mar. Ecol. Prog. Ser. 32, 247–257. doi: 10.3354/meps032247
Bosman A. L., Hockey P. A. R. (1988). The influence of seabird guano on the biological structure of rocky intertidal communities on islands off the west coast of southern Africa. South Afr. J. Mar. Sci. 7, 61–68. doi: 10.2989/025776188784379134
Branch G. M. (1971). The ecology of patella linnaeus from the Cape Peninsula, South Africa I. Zonation, movements and feeding. Zoologica Africana 6, 1–38. doi: 10.1080/00445096.1971.11447402
Branch G. M. (1974). The ecology of patella linneaus from the Cape Peninsula, South Africa, 3. Growth rates. Trans. R. Soc. South Afr. 41, 161–193. doi: 10.1080/00359197409520069
BTO. (2022a). Wetland Bird Survey (WeBS). Available at: https://www.bto.org/our-science/projects/wetland-bird-survey (Accessed July 2021).
BTO. (2022b). Wetland Bird Survey (WeBS) Sites. Available at: https://app.bto.org/websonline/sites/data/sites-data.jsp (Accessed September 2022).
Burrows M. T., Jenkins S. R., Robb L., Harvey R. (2010). Spatial variation in size and density of adult and post-settlement Semibalanus balanoides: effects of oceanographic and local conditions. Mar. Ecol. Prog. Ser. 398, 207–219. doi: 10.3354/meps08340
Carr M. H., Neigel J. E., Estes J. A., Andelman S., Warner R. R., Largier J. L. (2003). Comparing marine and terrestrial ecosystems: implications for the design of coastal marine reserves. Ecol. Appl. 13, 90–107. doi: 10.1890/1051-0761(2003)013[0090:CMATEI]2.0.CO;2
Clarke K. R., Gorley R. N., Somerfield P. J., Warwick R. M. (2014). Change in marine communities: an approach to statistical analysis and interpretation. Plymouth, UK: Primer-E Ltd.
Croxall J. P., Butchart S. H. M., Lascelles B. E. N., Stattersfield A. J., Sullivan B. E. N., Symes A., et al. (2012). Seabird conservation status, threats and priority actions: a global assessment. Bird Conserv. Int. 22, 1–34. doi: 10.1017/S0959270912000020
De Caceres M., Legendre P. (2009). Associations between species and groups of sites: indices and statistical inference. Ecology 90, 3566–3574. doi: 10.1890/08-1823.1
Dufrêne M., Legendre P. (1997). Species assemblages and indicator species: the need for a flexible asymmetrical approach. Ecol. Monogr. 67, 345–366. doi: 10.2307/2963459
Esri. (2022). ArcGIS Pro. Available at: https://www.esri.com/en-us/home (Accessed August 2021).
Gagnon K., Rothausler E., Syrjanen A., Yli-Renko M., Jormalainen V. (2013). Seabird guano fertilizes Baltic Sea littoral food webs. PLoS One 8, e61284. doi: 10.1371/journal.pone.0061284
Graham N. A. J., Wilson S. K., Carr P., Hoey A. S., Jennings S., MacNeil M. A. (2018). Seabirds enhance coral reef productivity and functioning in the absence of invasive rats. Nature 559, 250–253. doi: 10.1038/s41586-018-0202-3
Grant M. L., Bond A. L., Lavers J. L. (2022). The influence of seabirds on their breeding, roosting and nesting grounds: A systematic review and meta-analysis. J. Anim. Ecol. 91, 1266–1289. doi: 10.1111/1365-2656.13699
Hachich N. F., Bonsall M. B., Arraut E. M., Barneche D. R., Lewinsohn T. M., Floeter S. R. (2015). Island biogeography: patterns of marine shallow-water organisms in the Atlantic Ocean. J. Biogeography 42, 1871–1882. doi: 10.1111/jbi.12560
Hawkins S. J., Hartnoll R. G. (1982). Settlement patterns of Semibalanus balanoides (L.) in the Isle of Man, (1977–1981). J. Exp. Mar. Biol. Ecol. 62, 271–283. doi: 10.1016/0022-0981(82)90207-6
Heaton T. H. E. (1986). Isotopic studies of nitrogen pollution in the hydrosphere and atmosphere: A review. Chem. Geology: Isotope Geosci. section 59, 87–102. doi: 10.1016/0168-9622(86)90059-X
Hills J. M., Thomason J. C. (1998). The effect of scales of surface roughness on the settlement of barnacle (Semibalanus balanoides) cyprids. Biofouling 12, 57–69. doi: 10.1080/08927019809378346
Hobson K. A., Welch H. E. (1992). Determination of trophic relationships within a high Arctic marine food web using δ13C and δ15N analysis. Mar. Ecol. Prog. Ser. 84, 9–18. doi: 10.3354/meps084009
Holm S. (1979). A simple sequentially rejective multiple test procedure. Scandinavian J. Stat, 65–70. doi: 10.2307/4615733
Hong J., Zhang J., Ma Y., Gu B., Lee R. (2019). The fates of nitrogen in an experimental wetland food web: a stable isotope study. Wetlands 39, 303–310. doi: 10.1007/s13157-018-1085-7
Hutchinson G. (1950). The biogeochemistry of vetebrate excretion (New York, USA: American Museum of Natual History, New York).
IPCC. (2022). Climate Change 2022: Impacts, Adaptation and Vulnerability. Contribution of Working Group II to the Sixth Assessment Report of the Intergovernmental Panel on Climate Change [Pörtner H.-O., Roberts D.C., Tignor M., Poloczanska E. S., Mintenbeck K., Alegría A., et al (eds.)]. Cambridge, UK and New York, NY, USA: Cambridge University Press, 3056 pp. doi: 10.1017/9781009325844
IUCN. (2022). 2021 IUCN Red List of Threatened Species. Available at: https://www.iucnredlist.org/ (Accessed 30 November 2021).
Jarvie H. P., Wade A. J., Butterfield D., Whitehead P. G., Tindall C. I., Virtue W. A., et al. (2002). Modelling nitrogen dynamics and distributions in the River Tweed, Scotland: an application of the INCA model. Hydrol. Earth Syst. Sci. 6, 433–454. doi: 10.5194/hess-6-433-2002
Jenkins S. R., Hartnoll R. G. (2001). Food supply, grazing activity and growth rate in the limpet Patella vulgata L.: a comparison between exposed and sheltered shores. J. Exp. Mar. Biol. Ecol. 258, 123–139. doi: 10.1016/S0022-0981(01)00211-8
JNCC (2023). Seabirds Count (Peterborough: JNCC). Available at: https://jncc.gov.uk/our-work/seabirds-count/ (Accessed February 2024).
Jones H. P. (2010). Prognosis for ecosystem recovery following rodent eradication and seabird restoration in an island archipelago. Ecol. Appl. 20, 1204–1216. doi: 10.1890/09-1172.1
Kassambara A. (2021). rstatix: Pipe-Friendly Framework for Basic Statistical Tests. (R package version 0.7.0). Available at: https://CRAN.R-project.org/package=rstatix (Accessed June 2021).
Kazama K. (2019). Bottom-up effects on coastal marine ecosystems due to nitrogen input from seabird feces. Ornithol Sci. 18, 117–126. doi: 10.2326/osj.18.126
Kolb G. S., Ekholm J., Hambäck P. A. (2010). Effects of seabird nesting colonies on algae and aquatic invertebrates in coastal waters. Mar. Ecol. Prog. Ser. 417, 287–300. doi: 10.3354/meps08791
Kraufvelin P. (2007). Responses to nutrient enrichment, wave action and disturbance in rocky shore communities. Aquat. Bot. 87, 262–274. doi: 10.1016/j.aquabot.2007.06.011
Kraufvelin P., Moy F. E., Christie H., Bokn T. L. (2006). Nutrient addition to experimental rocky shore communities revisited: Delayed responses, rapid recovery. Ecosystems 9, 1076–1093. doi: 10.1007/s10021-005-0188-1
Kruskal J. B. (1964). Multidimensional scaling by optimizing goodness of fit to a nonmetric hypothesis. Psychometrika 29, 1–27. doi: 10.1007/BF02289565
Le Tourneux F., Bourget E. (1988). Importance of physical and biological settlement cues used at different spatial scales by the larvae of Semibalanus balanoides. Mar. Biol. 97, 57–66. doi: 10.1007/BF00391245
Lindeboom H. J. (1984). Nitrogen pathway in a penguin rookery. Ecology 65, 269–277. doi: 10.2307/1939479
Loreau M., Holt R. D. (2004). Spatial flows and the regulation of ecosystems. Am. Nat. 163, 606–615. doi: 10.1086/382600
Lorrain A., Houlbreque F., Benzoni F., Barjon L., Tremblay-Boyer L., Menkes C., et al. (2017). Seabirds supply nitrogen to reef-building corals on remote Pacific islets. Sci. Rep. 7, 3721. doi: 10.1038/s41598-017-03781-y
Lundberg J., Moberg F. (2003). Mobile link organisms and ecosystem functioning: Implications for ecosystem resilience and management. Ecosystems 6, 87–98. doi: 10.1007/s10021-002-0150-4
MacArthur R. H., Wilson E. O. (1967). The theory of island biogeography (Princeton, New Jersey, United States: Princeton university press).
Masterson P., Arenas F. A., Thompson R. C., Jenkins S. R. (2008). Interaction of top down and bottom up factors in intertidal rockpools: Effects on early successional macroalgal community composition, abundance and productivity. J. Exp. Mar. Biol. Ecol. 363, 12–20. doi: 10.1016/j.jembe.2008.06.001
McCann K. S., Rasmussen J. B., Umbanhowar J. (2005). The dynamics of spatially coupled food webs. Ecol. Lett. 8, 513–523. doi: 10.1111/j.1461-0248.2005.00742.x
McCauley D. J., Desalles P. A., Young H. S., Dunbar R. B., Dirzo R., Mills M. M., et al. (2012). From wing to wing: the persistence of long ecological interaction chains in less-disturbed ecosystems. Sci. Rep. 2, 409. doi: 10.1038/srep00409
McConnell B. J., Fedak M. A., Lovell P., Hammond P. S. (1999). Movements and foraging areas of grey seals in the North Sea. J. Appl. Ecol. 36, 573–590. doi: 10.1046/j.1365-2664.1999.00429.x
Methratta E. T. (2004). Top-down and bottom-up factors in tidepool communities. J. Exp. Mar. Biol. Ecol. 299, 77–96. doi: 10.1016/j.jembe.2003.09.004
Muff S., Nilsen E. B., O’Hara R. B., Nater C. R. (2022). Rewriting results sections in the language of evidence. Trends Ecol. Evol. 37, 203–210. doi: 10.1016/j.tree.2021.10.009
Mulder C. P. H., Anderson W. B., Towns D. R., Bellingham P. J. (2011). “An introduction to seabird islands,” in Seabird Islands: Ecology, Invasion, and Restoration. (Oxford University Press, New York, USA), 3–26.
NCC. (2020). Northumberland Coast AONB Management Plan. Available at: https://www.northumberlandcoastaonb.org/management-plan/ (Accessed February 2023).
Oksanen J., Guillaume Blanchet. F., Friendly M., Kindt R., Legendre P., McGlinn D., et al. (2020). vegan: Community Ecology Package. (R package version 2.5-7). Available at: https://CRAN.R-project.org/package=vegan (Accessed June 2021).
Otero X. L., La Peña-Lastra D., Pérez-Alberti A., Ferreira T. O., Huerta-Diaz M. A. (2018). Seabird colonies as important global drivers in the nitrogen and phosphorus cycles. Nat. Commun. 9, 1–8. doi: 10.1038/s41467-017-02446-8
Pagel M. D., Harvey P. H., Godfray H. C. J. (1991). Species-abundance, biomass, and resource-use distributions. Am. Nat. 138, 836–850. doi: 10.1086/285255
Paradis E., Schliep K. (2019). ape 5.0: an environment for modern phylogenetics and evolutionary analyses in R. Bioinformatics 35, 526–528. doi: 10.1093/bioinformatics/bty633
Pielou E. C. (1966). The measurement of diversity in different types of biological collections. J. Theor. Biol. 13, 131–144. doi: 10.1016/0022-5193(66)90013-0
Pinheiro H. T., Bernardi G., Simon T., Joyeux J.-C., Macieira R. M., Gasparini J. L., et al. (2017). Island biogeography of marine organisms. Nature 549, 82–85. doi: 10.1038/nature23680
Polis G. A., Anderson W. B., Holt R. D. (1997). Toward an integration of landscape and food web ecology: The dynamics of spatially subsidized food webs. Annu. Rev. Ecol. Systematics 28, 289–316. doi: 10.1146/annurev.ecolsys.28.1.289
Portnoy J. W., Soukup M. A. (1990). Gull contributions of phosphorus and nitrogen to a Cape Cod kettle pond. Hydrobiologia 202, 61–69. doi: 10.1007/BF02208127
Rankin L. L., Jones H. P. (2021). Nearshore ecosystems on seabird islands are potentially influenced by invasive predator eradications and environmental conditions: a case study at the Mercury Islands, New Zealand. Mar. Ecol. Prog. Ser. 661, 83–96. doi: 10.3354/meps13590
Riddick S. N., Dragosits U., Blackall T. D., Daunt F., Wanless S., Sutton M. A. (2012). The global distribution of ammonia emissions from seabird colonies. Atmospheric Environ. 55, 319–327. doi: 10.1016/j.atmosenv.2012.02.052
Rooney N., McCann K., Gellner G., Moore J. C. (2006). Structural asymmetry and the stability of diverse food webs. Nature 442, 265–269. doi: 10.1038/nature04887
Savage C. (2019). Seabird nutrients are assimilated by corals and enhance coral growth rates. Sci. Rep. 9, 4284. doi: 10.1038/s41598-019-41030-6
Schreiber E. A., Burger J. (2001). Biology of Marine Birds (Baton Rouge: CRC Press). doi: 10.1201/9781420036305
Shannon C. E. (1948). A mathematical theory of communication. Bell system Tech. J. 27, 379–423. doi: 10.1002/bltj.1948.27.issue-3
Sigman D. M., Hain M. P. (2012). The biological productivity of the ocean. Nat. Educ. Knowledge 3, 21.
Signa G., Mazzola A., Vizzini S. (2021). Seabird influence on ecological processes in coastal marine ecosystems: An overlooked role? A critical review. Estuarine Coast. Shelf Sci. 250, 107164. doi: 10.1016/j.ecss.2020.107164
Stanbury A., Thomas S., Aegerter J., Brown A., Bullock D., Eaton M., et al. (2017). Prioritising islands in the United Kingdom and crown dependencies for the eradication of invasive alien vertebrates and rodent biosecurity. Eur. J. Wildlife Res. 63, (1). doi: 10.1007/s10344-017-1084-7
Staunton Smith J., Johnson C. R. (1995). Nutrient inputs from seabirds and humans on a populated coral cay. Mar. Ecol. Prog. Ser. 124, 189–200. doi: 10.3354/meps124189
Strathmann R. R. (2015). Why life histories evolve differently in the sea1. Am. Zoologist 30, 197–207. doi: 10.1093/icb/30.1.197
Thoresen J. J., Towns D., Leuzinger S., Durrett M., Mulder C. P. H., Wardle D. A. (2017). Invasive rodents have multiple indirect effects on seabird island invertebrate food web structure. Ecol. Appl. 27, 1190–1198. doi: 10.1002/eap.1513
USGS. (2022). EarthExplorer. Available at: https://earthexplorer.usgs.gov/ (Accessed August 2021).
Walsh P. M., Halley D. J., Harris M. P., del Nevo A., Sim I. M. W., Tasker M. L. (1995). Seabird monitoring handbook for Britain and Ireland (Peterborough, UK: JNCC / RSPB / ITE / Seabird Group).
Webber M. A., Jefferson T. A., Pitman R., Jefferson T. A. (2015). Marine Mammals of the World: A Comprehensive Guide to Their Identification (San Diego: San Diego: Elsevier Science & Technology).
Wickham H. (2016). ggplot2: Elegant Graphics for Data Analysis (New York, USA: Springer-Verlag). doi: 10.1007/978-3-319-24277-4
Wickham H., François R., Henry L., Müller K. (2018). dplyr: A Grammar of Data Manipulation. (R package version 1.0.8). Available at: https://CRAN.R-project.org/package=dplyr (Accessed June 2021).
Young H. S., Hurrey L., Kolb G. S. (2011). “Effects of seabird-derived nutrients on aquatic systems,” in Seabird Islands: Ecology, Invasion, and Restoration. Eds. Mulder C. P. H., Anderson W. B., Towns D. R., Bellingham P. J. (Oxford University Press, New York, USA).
Young H. S., McCauley D. J., Dunbar R. B., Dirzo R. (2010). Plants cause ecosystem nutrient depletion via the interruption of bird-derived spatial subsidies. Proc. Natl. Acad. Sci. 107, 2072–2077. doi: 10.1073/pnas.0914169107
Zmudczyńska-Skarbek K., Balazy P., Kuklinski P. (2015). An assessment of seabird influence on Arctic coastal benthic communities. J. Mar. Syst. 144, 48–56. doi: 10.1016/j.jmarsys.2014.11.013
Keywords: cross-ecosystem nutrients, intertidal environment, nutrient subsidy, seabird guano, marine ecology, stable isotope analysis
Citation: Healing S, Benkwitt CE, Dunn RE and Graham NAJ (2024) Seabird-vectored pelagic nutrients integrated into temperate intertidal rocky shores. Front. Mar. Sci. 11:1343966. doi: 10.3389/fmars.2024.1343966
Received: 24 November 2023; Accepted: 08 April 2024;
Published: 01 May 2024.
Edited by:
Vitor H. Paiva, University of Coimbra, PortugalReviewed by:
Gustavo Martins, University of the Azores, PortugalRyan Andrades, Federal University of Espirito Santo, Brazil
Copyright © 2024 Healing, Benkwitt, Dunn and Graham. This is an open-access article distributed under the terms of the Creative Commons Attribution License (CC BY). The use, distribution or reproduction in other forums is permitted, provided the original author(s) and the copyright owner(s) are credited and that the original publication in this journal is cited, in accordance with accepted academic practice. No use, distribution or reproduction is permitted which does not comply with these terms.
*Correspondence: Samuel Healing, samuelthealing@gmail.com