The shape of fringing tidal flats in engineered estuaries
 Jill L. J. Hanssen
 Bram C. van Prooijen
 Dirk S. van Maren
- 1Hydraulic Engineering Department, Delft University of Technology, Delft, Netherlands
- 2Ecosystems and Sediment Dynamics, Deltares, Delft, Netherlands
For the management of estuaries and the preservation of tidal flats it is crucial to understand the tidal flat shape and development. Previous work focused predominantly on the quasi-equilibrium shape of tidal flats along open coasts with a dominant cross-shore flow and wave exposure. This paper evaluates the shape of fringing tidal flats in engineered estuaries, where longshore velocities generally dominate. Using a long-term (20 years) topographic data set of an anthropogenically modified estuary in the Netherlands (the Western Scheldt estuary), we relate key profile shape parameters and changes over time to natural and anthropogenic processes. In an engineered estuary, the tidal flat shape depends on the estuary geometry, hydrodynamic forcings and human interventions. In contrast to open coast tidal flats, the presence of the channel and dominant longshore flow determines the available cross-shore length (accommodation space) of the tidal flat and the shape of the tidal flat. This accommodation space defines the maximum tidal flat height and opportunity for marsh development. We propose the use of the Index of Development, indicating to what extend tidal flats have space to develop. This index is not only influenced by longshore and cross-shore flow, but also (or even more) by hydraulic structures, dike realignments and channel migration. Especially the latter two strongly influence the accommodation space and thereby the maximum tidal flat height and the opportunity for marsh development. For large stretches of the Western Scheldt, the accommodation space is too small, and the majority of the tidal flats do not vertically extent to mean high water. The success of tidal flat and marsh restoration projects depends on the accommodation space.
1 Introduction
Tidal flats are vital elements of the estuarine ecosystem by offering a wide range of economical and ecological functions. They provide habitats for benthic species, nurseries for fish, and resting areas for birds and mammals (Ysebaert et al., 2003; Barbier et al., 2011; Mu and Wilcove, 2020). Tidal flats also provide socio-economical benefits, e.g. food production and recreation (Brouwer et al., 1999; Lau et al., 2019) and contribute to safety against flooding (Reed et al., 2018; Willemsen et al., 2018). The cross-shore tidal flat shape (i.e. the cross-shore length and slope(s)) in combination with the tidal range defines the available tidal flat area (Dyer, 1998). Yet in engineered coastal systems, tidal flats are under pressure due to human-induced coastal narrowing and coastal squeeze (Pontee, 2013; Fan et al., 2023). This fuels the need for understanding how tidal flats respond (in terms of height, slope, etc) to an anthropogenic reduction in length.
The tidal flat length is constrained by the accommodation space. The accommodation space is the lateral and vertical area available to accommodate coastal ecosystems and is bounded by the channel and human infrastructures. Human-induced changes to the system can directly influence the accommodation space (e.g. reclamation of the upper tidal flat) (Schuerch et al., 2018; Lansu et al., 2024). Such a change in the accommodation space can influence hydrodynamics and sediment transport processes, thereby affecting the tidal flat shape and eventually the available intertidal area (Winterwerp et al., 2013a). Other human interventions that do not directly modify the accommodation space might however impact the shape. Dredging activities for example steepen and narrow the tidal flat (Pontee, 2013; Benninghoff and Winter, 2019; van Dijk et al., 2021; Fan et al., 2023). The tidal flat shape may be additionally influenced by interventions at greater distance. For example, dams in the upstream part of a river reduce the sediment influx into the estuary, which may lead to erosion of the tidal flat (van den Berg et al., 1996; Zhu et al., 2019). But also relative Sea Level Rise (rSLR) will affect the intertidal area and tidal flat shape (by both eustatic Sea Level Rise and land subsidence). In case of rSLR, the tidal flat area can only be preserved if the flat accretes sufficiently fast or if the tidal flat can migrate in the seaward or landward direction in response to interventions (Kirwan and Megonigal, 2013; Schuerch et al., 2018).
This coastal narrowing can be especially challenging for fringing tidal flats. The equilibrium shape of such fringing tidal flats is determined by the alongshore flow and locally generated wind waves (Wang et al., 2015; Maan et al., 2018; van der Wegen et al., 2019). In the subtidal zone of estuarine tidal flats the longshore flow is dominant over cross-shore flows, defining the steepness of the channel bank and the lower flat. The shape of the upper part of a flat is generally more influenced by shoaling waves. These waves become progressively more important for resuspending sediments which deposit in the upper intertidal zone. This leads to higher wave-induced bed shear stresses and therefore erosion, re-establishing the tidal flat profile (maintaining the upper flat in equilibrium; see Friedrichs and Aubrey, 1996; Maan et al., 2018). The shape of tidal flats is generally depending on the relative importance of waves and tides, with tides promoting a convex-upward shape and waves a concave-upward shape (Friedrichs, 2011). Convex-up tidal flats accrete to attain equilibrium, whereas concave-up tidal flats retreat until a stable state is reached.
The (complex) relation between the equilibrium tidal flat shape and forcing factors has been explored with models and data-based techniques. 1D and 2D modelling showed that the tidal flat shape is primarily related to hydrodynamic forcing (tides and waves) and sediment characteristics (Roberts et al., 2000; Maan et al., 2018; van der Wegen et al., 2019). These results correspond to observational data analyses that also proved that that tidal range and wave exposure are the dominant drivers leading to a convex-up or concave-up tidal flat shape, respectively (Dyer et al., 2000; Kirby, 2000; Bearman et al., 2010). Such relations may hold for natural systems. Tidal flats in engineered estuaries may not be in equilibrium or might end up in different equilibrium conditions (Benninghofff and Winter, 2018). Which human interventions influence the tidal flats shape is however underexplored. Most of these earlier studies on processes controlling tidal flat dynamics focus on intertidal areas largely displaying natural behaviour. Such process-shape relationships derived from the various modelling and data-based studies are valid for tidal flats that are not constrained (e.g., a dike or tidal channel) on their landward or seaward side. However, many tidal flat systems worldwide are influenced by human interventions. The accommodation space has been reduced from the landward side (dike replacements) and channel side (channel deepening and widening). These interventions hamper the development to the natural equilibrium shape of the tidal flats and enforce a transition to a new equilibrium. Therefore, in engineered estuaries many tidal flats may be in anthropogenic equilibrium differing from the natural equilibrium or may be in a transient state (Benninghoff and Winter, 2019).
An example of a strongly engineered system is the Western Scheldt estuary in the Netherlands (de Vet et al., 2017; van Dijk et al., 2021). Various engineering works (e.g. groynes and longitudinal dams) have been constructed for navigation purposes and shoreline protection. Fringing tidal flats in this system are therefore not only shaped by natural processes. As such, this system provides a well-documented example in which the role of anthropogenic modifications to the cross-shore profile (especially through the loss of accommodation space) can be evaluated.
The aim of this paper is to determine the factors influencing tidal flat shape in the Western Scheldt estuary. More specifically, we aim to identify how accommodation space (and consequently the cross-shore length of the tidal flat) and human interferences influence tidal flat shape over time, to distinguish between transient or equilibrium conditions. We developed a novel approach to analyse the cross-shore profile shape and used this to relate the spatial and temporal variation of the cross-shore profile shape of tidal flats to human interventions. We subsequently develop a conceptual model to explore the complex relationships between the variation in accommodation space, the longshore and cross-shore tidal flow and the impact on the resulting tidal flat shape.
2 Materials and methods
2.1 Study area: Western Scheldt
We consider the Western Scheldt estuary as study area because a topography dataset of 20 years was open source available. The Western Scheldt (located in the southwest of the Netherland, Figure 1A) is the 55 km long seaward extension of the lower Sea Scheldt (Belgium), discharging into the North Sea. The estuary is a multi-channel system characterised by a main channel (the shipping lane to the Port of Antwerp), a secondary channel and several side channels and shoals in between. The tidal channel is dredged till -16.0 m +NAP (Dutch reference level, corresponding to 20 cm below mean sea level) and can reach local depths up to - 40 m+NAP ( (De Vriend et al., 2011; van Dijk et al., 2021), Figure 1). The Western Scheldt is a tide dominated environment with limitedly impacted wind waves (Wang et al., 2002; Hu et al., 2017). The wave height is typically 10 – 40 cm on the tidal flats and approaching from the South-West. Velocities in the main channel can reach values up to 2m/s which is an order of magnitude larger compared to the side channels. The mean tidal amplitude increases from 2.0 m in the estuary mouth to 2.6 m at the transition to the Sea Scheldt in Belgium (Kuijper et al., 2004; de Vet et al., 2017). The total area of the Western Scheldt is 270 km2, of which 30% is intertidal area. The majority of this tidal area is formed by shoals, in between the main channel and the secondary channel. The Land van Saeftinghe in the eastern part of the estuary is the largest fringing tidal flats, with an area of 35 km2. The tidal flats consist of mud and very fine sand (D50< 100 µm) (Braat et al., 2017; Willemsen et al., 2018, McLaren 1993 and McLaren 1994).
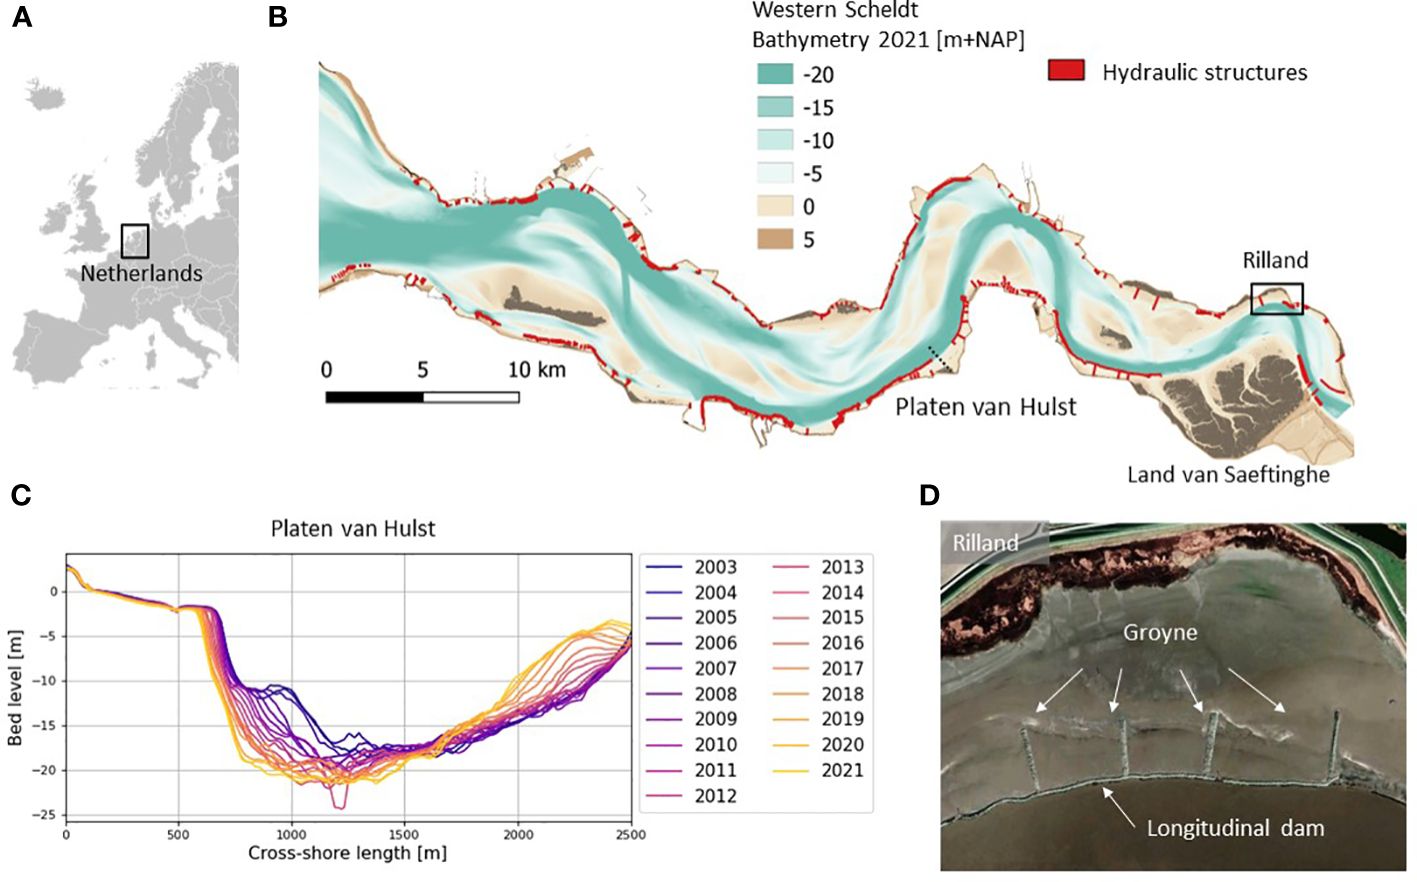
Figure 1 (A) Western Europe and the box indicates the Netherlands. (B) Topography of the Western Scheldt estuary with red lines indicating hydraulic structures (van der Vegt et al., 2020). The black dashed line indicates the location of the cross-shore profile illustrated in (C). (C) Annual profiles between 2003 (dark purple) and 2021 (yellow) are provided. (D) The difference between longitudinal dams and groynes are illustrated with an inset (based on Google Earth) for the tidal flat of Rilland-Bath.
The Western Scheldt was and is subject to various human interferences (van den Berg et al., 1996; Jeuken and Wang, 2010; Van Dijk et al., 2019). Since the Middle Ages, dikes were built along the margins of the estuary, reducing the intertidal areas. In later stages, the estuary was trained with (submerged) hydraulic structures. Furthermore, dredging has been a crucial human intervention for the local sediment budgets over the last decades. We identified three types of structures to train the estuary: submerged revetments, longitudinal dams, and groynes (Figure 1D). These structures were placed to reduce flow velocities in front of the dike and prevent erosion of the foreshore. The submerged revetments prevent landward migration of the channel and shelter the tidal flats from the energetic flows in the main tidal channels. Groynes with a length of 50 – 500 m have been placed perpendicular to the dike, strongly reducing the along-channel flow velocities on the tidal flat. Throughout the estuary, groyne fields have been constructed with typical spacings of 50 – 500 m between the groynes. The longitudinal dams have been constructed parallel to and 50 – 400 m from the dike. They also reduce the flow velocities between the structure and the dike. The construction height of these structures varies. On satellite images, the longitudinal dams and groynes are visible during low water, but not during high water.
The Western Scheldt has been subjected to dredging and sediment disposals. The tidal channel is annually dredged to maintain a minimum depth for navigation purposes, which increased the cross-sectional area and in turn led to a larger tidal volume, larger tidal amplitude, and higher flow velocities (Winterwerp et al., 2013b; de Vet et al., 2017; Van Dijk et al., 2019). The surplus of the sediment was disposed in the connecting channels between the ebb and flood chute, which therefore become shallower, and their discharge reduces. These dynamics lead to a transition of a multi-channel estuary towards a single-channel instead (Jeuken and Wang, 2010). A more recent strategy is to increase intertidal areas by placing the sediment on tidal flats.
The topography of the intertidal and subtidal area is annually measured in the Western Scheldt. The intertidal area is measured with airborne LiDAR and the subtidal area is measured with multi-beam measurements. For each year, these datasets are interpolated and gridded to a 20 x 20 m2 grid (RWS, 2021). For this study, we used the datasets of the years 2003 – 2021, a period for which also the intertidal areas where extensively monitored and therefore the dataset is most complete. We obtained mean high and low water levels, flow velocities and bed shear stresses in the Western Scheldt, from an extensively calibrated and validated Delft3D model (Van der Werf et al., 2015), which has been widely applied (e.g., de Vet et al., 2017; Brückner et al., 2019; Weisscher et al., 2022).
2.2 Profile extraction and characterization
We developed an automated tool to systematically extract cross-shore profiles from the gridded bed level data covering the tidal flats in the Western Scheldt. This tool is based on the mean water level (MSL), mean high water level (MHW) and the mean low water level (MLW). These water levels are determined for the year 2014. This year can be considered as a representative year according to Deltares (2021). The MWL is converted into a polygon along the boundaries of the estuary. Perpendicular to this polygon, we define cross-shore profiles with a length of 3 km and an alongshore spacing of 1 km (both on the North and South bank of the estuary). We obtained 122 profiles of the estuary and investigated the cross-shore profiles between 2003-2021 (example Figure 1C).
For each profile, we subsequently defined our study domain as the area with a bed level between the mean high water level (MHW) and the mean low water level (MLW) minus the local tidal range (TR), both for the year 2014. These boundaries are used for all considered years. Our focus area includes a part of the subtidal zone because the steepness of the lower flat is determined by the subtidal channel bank. Including a part of the subtidal area therefore leads to a better understanding of the tidal flat behaviour. For profiles with bed levels lower than MHW (as is common for fringing tidal flats) the profile is cut off at the dike or marsh edge.
The profile shape is linear, convex-up or concave-up. The convex-up and concave-up profiles consist of three parts with a varying tidal flat slope: the upper part of the tidal flat with slope , a curved transition zone and the lower tidal flat with the slope (Hanssen et al., 2022). Figure 1C is an example of a convex-up tidal flat with a mild upper slope (0-600 m), the transition zone (600-650 m) and the steep lower slope (650-750 m). The length of the three parts and the slope magnitude varies for each tidal flat. We define and compare these profile parameters for different transects to evaluate the spatial differences and temporal changes of the profiles. For each profile, we fit a hyperbolic function to describe the profile with a limited set of variables:
With bed level ( [m]) as function of the horizontal position ( [m]), length of the lower flat ( [m]), the slope of the lower and upper flat ( [-] and [-], respectively), [m] is the height of the intersection point of the upper and lower slope when extrapolating both slopes, and the curvature of the transition ( between the upper and the lower flat). The reader is referred to Hanssen et al. (2022) for a detailed description of this method. This equation can be used for concave-up as well as for convex-up profiles. Some profiles are closer to a linear shape. Therefore, all profiles are also fitted with a linear equation:
where S [-] is the profile slope, [m] is the height of the profile with respect to mean sea level at x=0. We perform an F-test to justify if Equation 1, with extra variables and complexity, results in a better fit compared to Equation 2. The F statistic is a function of the residual sum of squares of each profile for Equation 1 and Equation 2, the number of function variables of Equation 1 and Equation 2 and the number of datapoints of a profile. Based on the amount of datapoints, function variables and a rejection probability we determine a critical value . If the result of the F-test exceeds , we use Equation 1 (Sokal and Rohlf, 1995; van Prooijen et al., 2011).
In the last step, we evaluate the quality of the fit based on the root mean square error (RMSE) of the original smoothed profile and the fitted profile. We remove profiles with a RMSE larger than 0.5 m. In this manner, we also remove the profiles without a tidal flat (e.g. because the dike borders the tidal channel).
The total length of a profile is the length between the lowest and highest point of a focus profile. The maximum height is the highest point of a focus profile. A fully developed tidal flat extends up to MHW beyond which it develops into a marsh. To quantify the degree to which the flat is fully developed, and a marsh can establish, we define an Index of Development ( [-]) of each profile by
Where is the maximum height of each profile [m]. For = 1, the maximum flat height reaches MHW, and the profile is fully developed. If = 0, the profile reaches till MLW, indicating that there is no intertidal area. For 0 < < 1, the maximum flat height is in between MLW and MHW.
3 Results
In total, 122 profiles have been analysed, with a wide variety of cross-shore length, height and morphological changes. We present this variety in cross-shore shape in Section 3.1. Subsequently, we analyse the relations between the profile characteristics, with emphasis on the influence of the tidal flat length on the maximum tidal flat height. In addition, we studied the impact of human interventions on the maximum tidal flat height (Section 3.2). The temporal variability of the tidal flat shape is presented in Section 3.3.
3.1 Tidal flat shape
The majority (77%) of the tidal flat profiles in the Western Scheldt is convex-up with a transition from lower to upper flat between mean low water (MLW) and Mean Water (MW). The convex-up shape reflects the tide dominance (Friedrichs, 2011) in the Western Scheldt. Only 2% of the profiles were concave-up, reflecting the limited role of waves in the relatively sheltered estuary. 13% of the profiles has a linear shape and for 8% of the profiles we could not determine the shape (i.e. the RMSE was too large) (Figure 2). Although the majority of the profiles is convex-up, there is a range of profile lengths, heights, upper slopes and lower slopes (Figure 3A). Scaling the height with the tidal range does not reduce scatter around the mean profile (Figure 3B). The variation in tidal range is limited to 3.8 – 5.2 m. Scaling the horizontal axis with the tidal flats length increases scatter around the mean profile (Figure 3C) and obscures the characteristic cross-shore shape of a single flat. This implies that a profile can better be represented by a non-dimensional vertical axis than by a horizontal axis that is scaled with the total length. Figure 3A indicates that wider flats have a similar shape near the channel as shorter flats. As will be discussed later, increasing the length of a flat would not imply a change of the shape near the channel, but an elongation of the upper tidal flat.
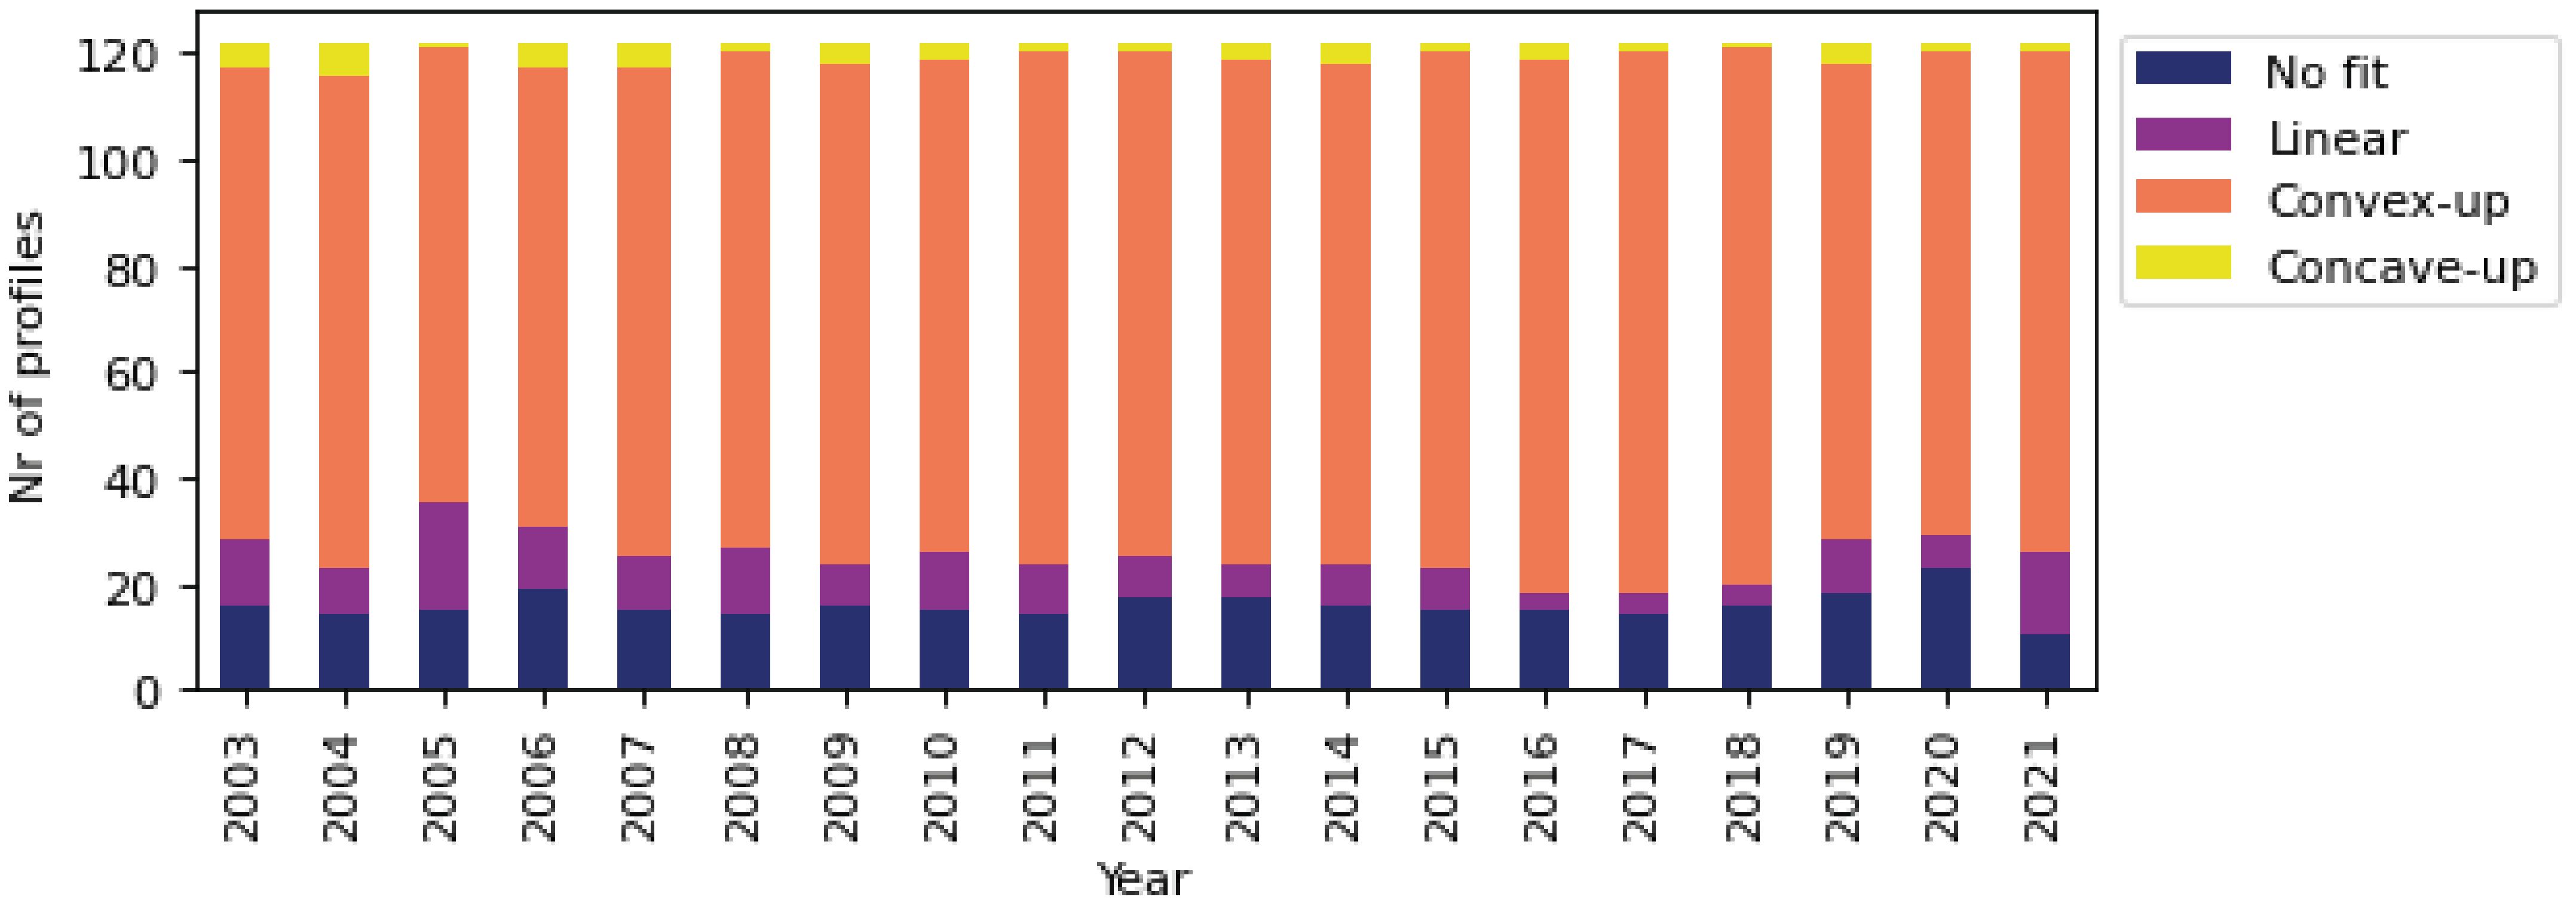
Figure 2 Number of profiles that is concave-up, convex-up, linear or no fit was found for the period 2003-2021.
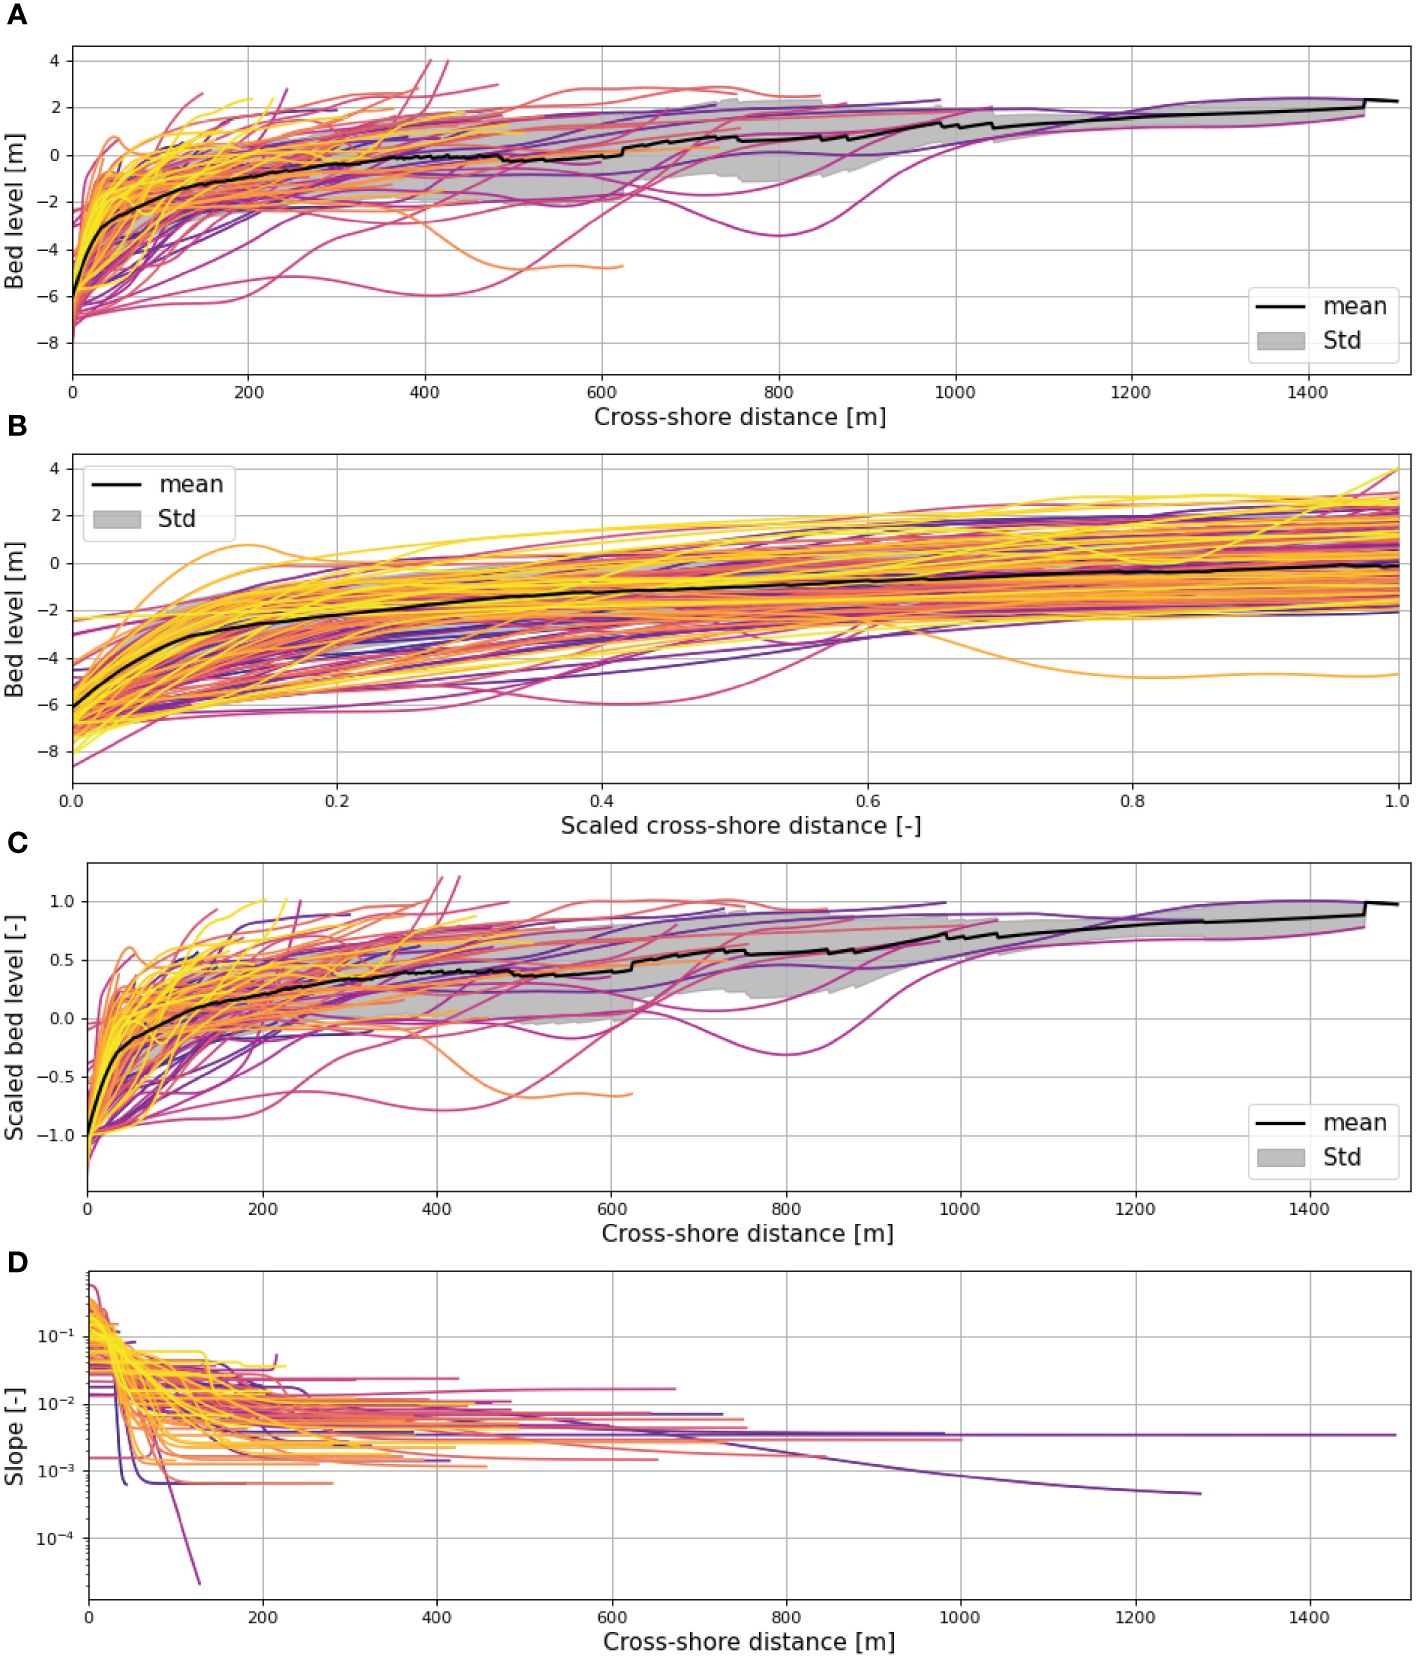
Figure 3 (A) Extracted profiles from the Western Scheldt estuary based on the topography of 2021 (Profiles 2021). The colour qualitatively indicates the length of the profiles (darker colour, long profile), the black line is the average profile of all profiles and the grey area the standard deviation. 3 (B) Profiles of 2021 scaled with the tidal range at that specific profile location. 3 (C) Profiles of 2021 scaled with their individual length. 3 (D) The variation of the slope with its length for each profile.
In general, profiles shorter than 100 m have a steep lower slope, do not exceed MW and, on average, do not have a mild upper flat (Figure 3D). We can explain the difference in tidal flat shape for wide and narrow tidal flats based on the hydrodynamic conditions for fringing tidal flats. The steepness of the lower slope is defined by the longshore current. For profiles exceeding a certain cross-shore length the profile extends above MLW. Above MLW, the alongshore flow diminishes towards the landward edge and wind waves influence the upper tidal flat slope (Maan et al., 2018). The altered hydrodynamic conditions result in a difference between the upper and lower flat slope. Profiles with a small cross-shore length, of which the height does not exceed MLW, do not experience this slope change.
3.2 Profile length
The length of the profiles varies between 80 – 1500 m (M = 300 m, SD = 266 m) (Figure 4) and is determined by the location where the bed level equals the low water line minus the tidal range and the dike or marsh. The Western Scheldt has a meandering two-channel character, implying that the main channel swaps between northern and southern bank. This variation is also reflected in the profile length. Short profiles are generally found when the main channel (Transects 5-12; 92-98) or secondary channel (e.g. Transects 29-37) is close to the dike. Such a variation would be expected in a natural estuary. In the case of the Western Scheldt, various measures (e.g. groynes) have been taken to protect the shoreline, leading to longer profiles than expected (e.g. Transects 54-57; 78-82). In two areas the cross-shore profiles are significantly wider compared to the other profiles: Zuidgors (Figure 4A Transects 23 - 27) and Land van Saeftinghe (Figure 4C Transects 65 - 77). The wide profiles can be attributed to two different human interferences. The tidal flat of Zuidgors is located in the inner bend and borders a secondary channel in which dumping of dredged sediment enhanced tidal flat accretion (de Vet et al., 2020). Land van Saeftinghe (Figure 4B) was a polder until a flood in 1570 drowned the area, leading to a significant increase in the available accommodation space and consequently profile length.
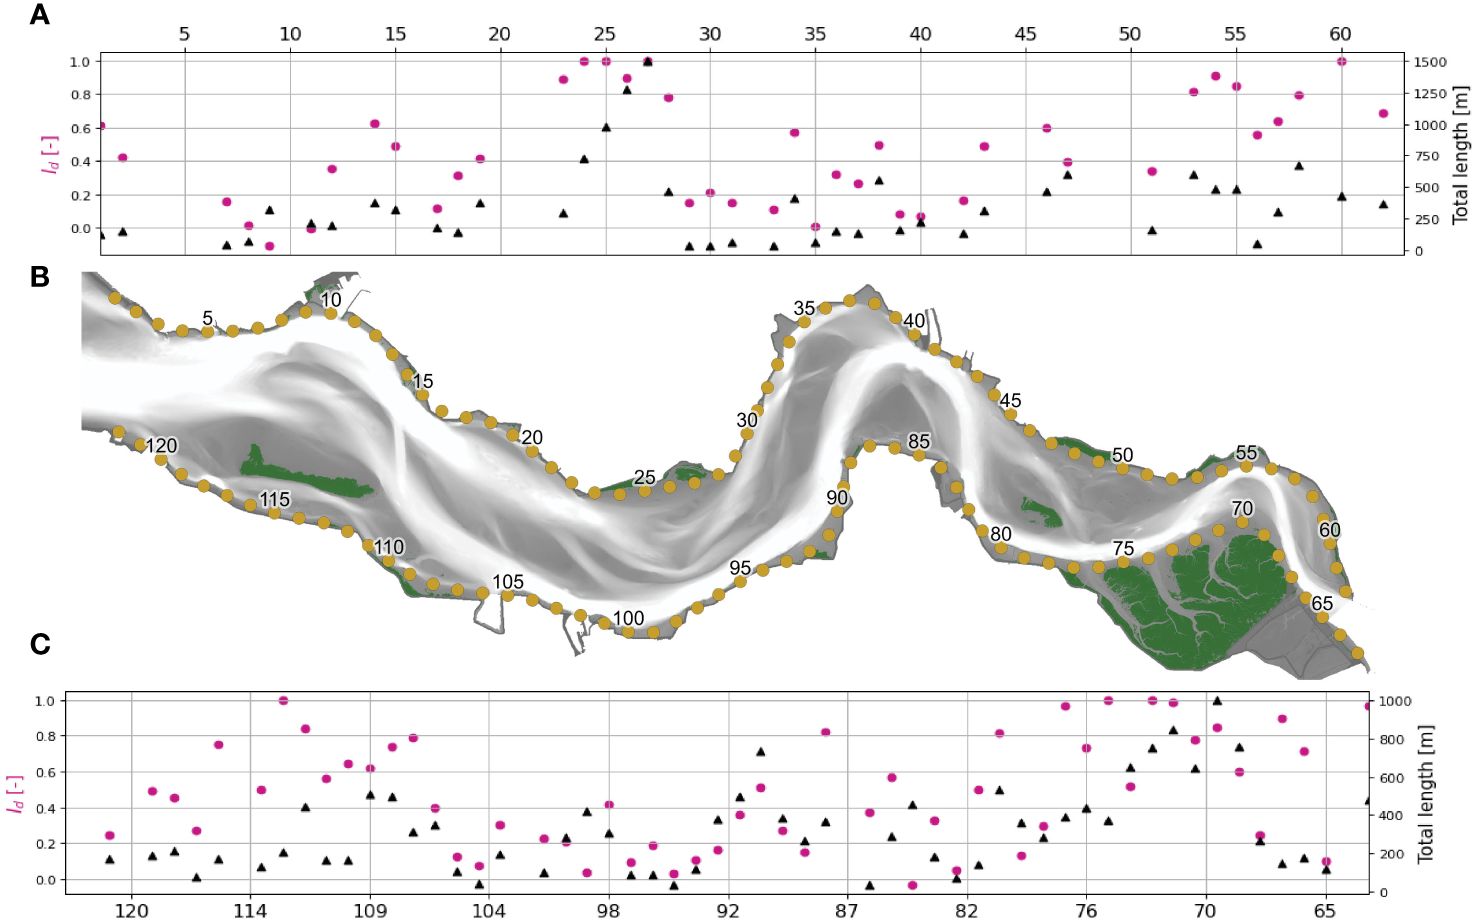
Figure 4 Calculated profile length (black triangles) and (pink dots) in the Western Scheldt estuary (year 2021). (A) The results of the north bank transects. (B) Indicates the transect locations in the Western Scheldt. The numbers correspond to the numbers in (A, C). (C) The results of the south bank transects.
3.3 Profile height and profile length
Similar to the tidal flat length, the variation of the maximum height coincides with the meandering of the estuary and the maximum height is larger for tidal flats in the inner bend, compared to the outer bend. We quantified the extend of the profiles with the Index of Development (, see Equation 3 in Section 2). The Index of Development indicates whether the flat developed to its maximum vertical extent ( =1). The spatial variation of the index is shown in Figures 4A, C. On the north and south bank of the estuary there is a clear correlation between the length and the longer the length, the higher . We tested this correlation and used the Spearman correlation coefficient because the profile length and are not normal distributed. There is a significant positive correlation between the two variables for the north bank ((54) = 0.74, p = 4.2E-9), and south bank ( (58) = 0.49, p = 8.8E-5). Longer tidal flats result in a higher maximum height of the flat compared to shorter flats. At locations where is close to 1, salt marshes are present. This confirms the expectation that if a profile reaches MHW, a salt marsh will develop (Kirwan and Guntenspergen, 2012).
There are four regions where is high but the length is limited: Zuidgors, Rilland, Bath and Hoofdplaat. At Id Zuidgors, Transects 23 – 24 are less than 700 m wide but Id is around 1. This is the effect of sediment relocation near Zuidgors and, as a result, the accretion of the tidal flat (de Vet et al., 2020). At Rilland (Transects 53 – 57), groynes prevent landward migration of the tidal channel thereby promoting sedimentation. Although the profiles are less than 600 m wide, is higher than 0.8. At Bath (Transects 58-62), the profiles are also less than 700 m wide with an if more than 0.8. Here, the tidal channel is pushed towards the south bank of the estuary and there is a shallow subtidal area between the flat and the tidal channel. Near Hoofdplaat (Transects 110-118), the tidal flats are 200 – 600 m wide but the is relatively high (0.6-0.8). Also here, groynes keep the channel at distance. Furthermore, these tidal flats are bordered by a secondary channel that is relatively shallow with mild hydrodynamic conditions.
The relation between tidal flat length and is shown in Figure 5 where the length and are plotted against each other. We distinguished between tidal flats bounded by hydraulic structures (i.e. groynes and/or longitudinal dams) and tidal flats without structures (i.e. Natural tidal flats). For visualisation, we grouped the profiles based on their length in 5 groups (or bins) with an equal amount of profiles per group and calculated the mean per group (Figure 5). Although there is quite some scatter in Figure 5, we can identify some patterns. The majority of the profiles shorter than 100 m is confined below the mean water line () (M = 0.17, SD = 0.14), implying that short flats do not frow to the MHW. On the other hand, long profiles (> 600 m) grow higher and the mean is 0.83 (SD = 0.17). For profiles longer than 600 m, the differences between maximum profile height and MHW decreases rapidly (i.e. ~1, Figure 5). The extend of natural tidal flats ranges between 100 – 1450 m. On average, the ratio : profile length is larger for short natural tidal flats (< 400 m) compared to the long natural tidal flats (1: 500 and 1: 1275, respectively). This indicates that the mean profile slope becomes milder for longer natural tidal flats, which coincides with Figure 3D.
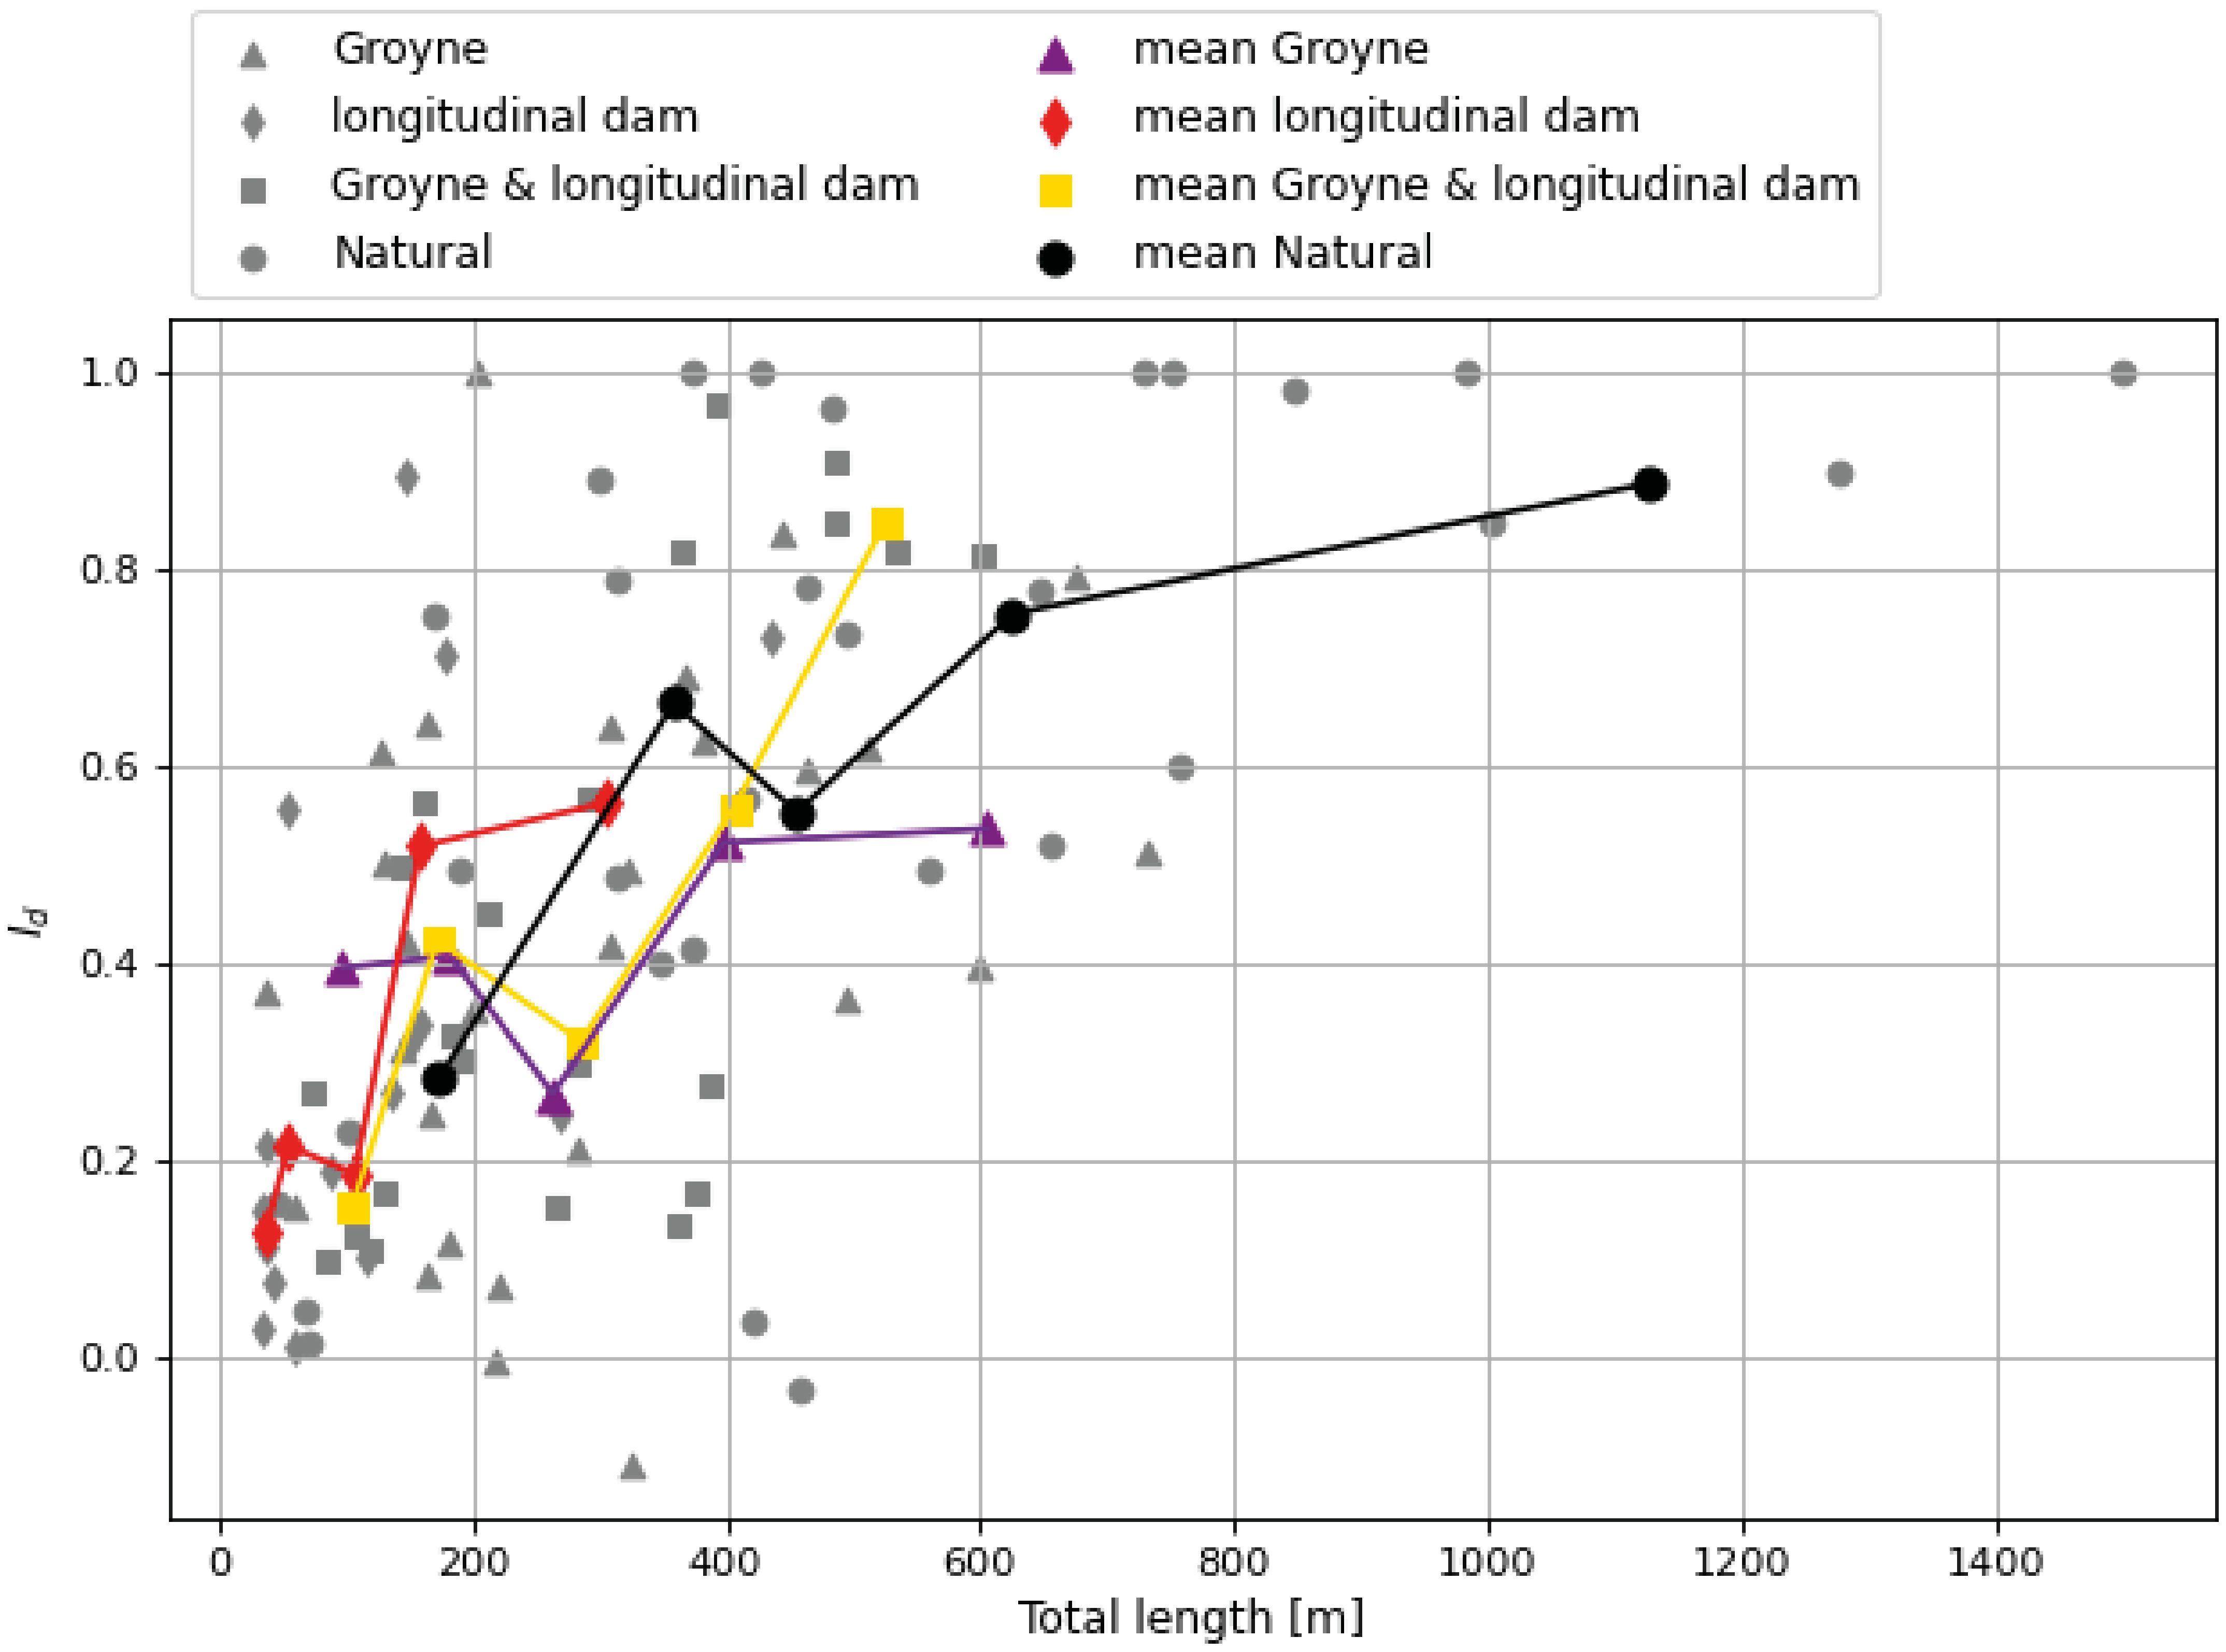
Figure 5 Relation between the Index of Development () and the tidal flat length for all data points in grey. The coloured symbols represent the mean bin values of transects with engineering constructions whereas the black symbols represent transects without cross-shore dams, longshore dams, or both.
The minimum and the mean tidal flat length of tidal flats bordered by structures is, on average, smaller compared to natural tidal flats which can be visually observed in Figure 5. We examined the statistical significance of the difference in length between natural tidal flats and tidal flat bordered by structures using a Mann-Whitney U test not requiring normal distribution of the data (Mann and Whitney, 1947). The profile length of natural tidal flats is statistically longer compared to flats bordered by groynes, longitudinal dams, or their combination, at a 95% confidence level. Structures are placed at locations where channel migration threatens the shoreline and therefore without such structures the tidal flat would likely not exist. The length of the groyne or distance between the longitudinal dam and the dike define the extend of the lee area and thereby the maximum length of the tidal flat. The mean of tidal flats bordered by groynes or longitudinal dams, does not exceed 0.6 (with the large variability around the mean reflecting the range in height of hydraulic structures). For tidal flats with groynes, the hardly increases if the tidal flat is longer than 200 m. Similarly for tidal flats bordered by groynes, remains constant for profile lengths larger than 400 m. does not significant differ between natural flats and tidal flats with structures for tidal flat lengths shorter than 700 m. Although the structure promotes or facilitates the tidal flat presence, the maximum tidal flat height is limited to the mean water line , whereas natural tidal flats develop a higher (average) maximum height because these tidal flats are longer.
The dynamics of the lower part of fringing tidal flats are controlled by the longshore flow, and therefore we extract the depth averaged flow velocity from an existing and well calibrated numerical model (Van der Werf et al., 2015). For each profile, we calculated the length and tide-average absolute flow velocity over the tidal flat (Figure 6). The flow velocity varies between 0 and 0.5 m/s and is only weakly related to the length of the flat (0.22 m/s for short tidal flats (< 250 m) and 0.18 m/s for longer tidal flats) for natural flats. This effect of tidal flat length on flow velocity is more pronounced for tidal flats with longitudinal dams (with on average 0.35 m/s in the first 100 meter), but also quite weak for tidal flats with groynes Overall the tidal flat shape seems poorly correlated with the alongshore flow velocity.
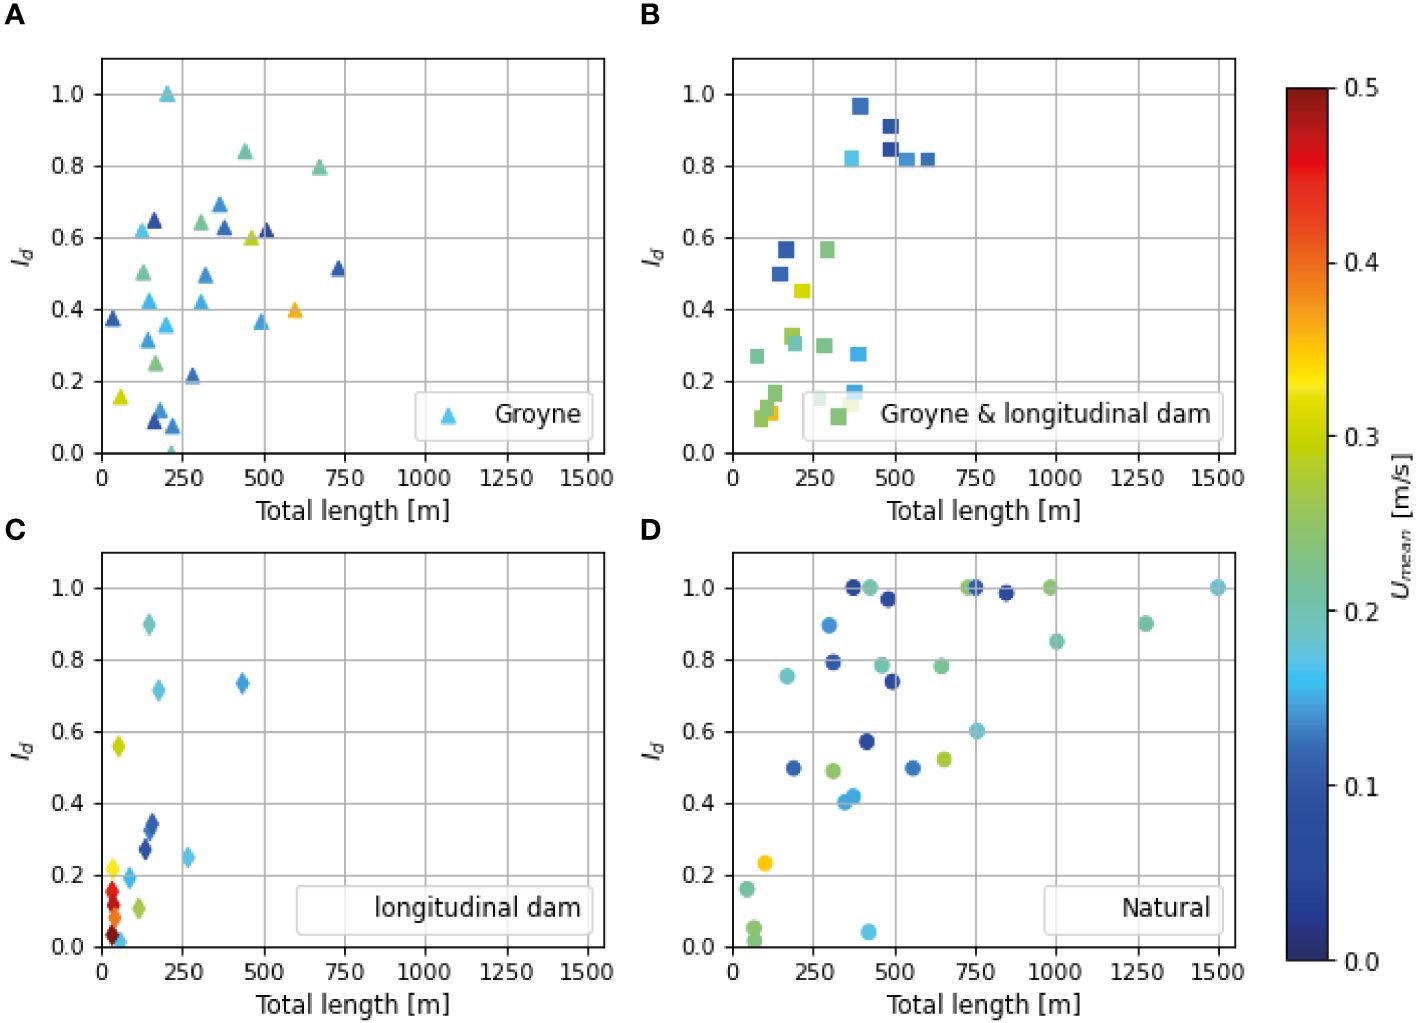
Figure 6 Relation between tidal flat length, Id and the mean velocity on the tidal flat with and without structures. (A) groynes, (B) groynes and longitudinal dams, (C) longitudinal dams and (D) natural tidal flats without structures.
3.4 Temporal variation of tidal flat shape
In addition to the spatial variation of the profiles, the data set also allows for an analysis of the temporal variation of the shape of the profiles, as measurements are available for the period 2003-2021. The values for the length and maximum height are plotted in Figures 7C, D, F, G with the transect locations in Figure 7E.
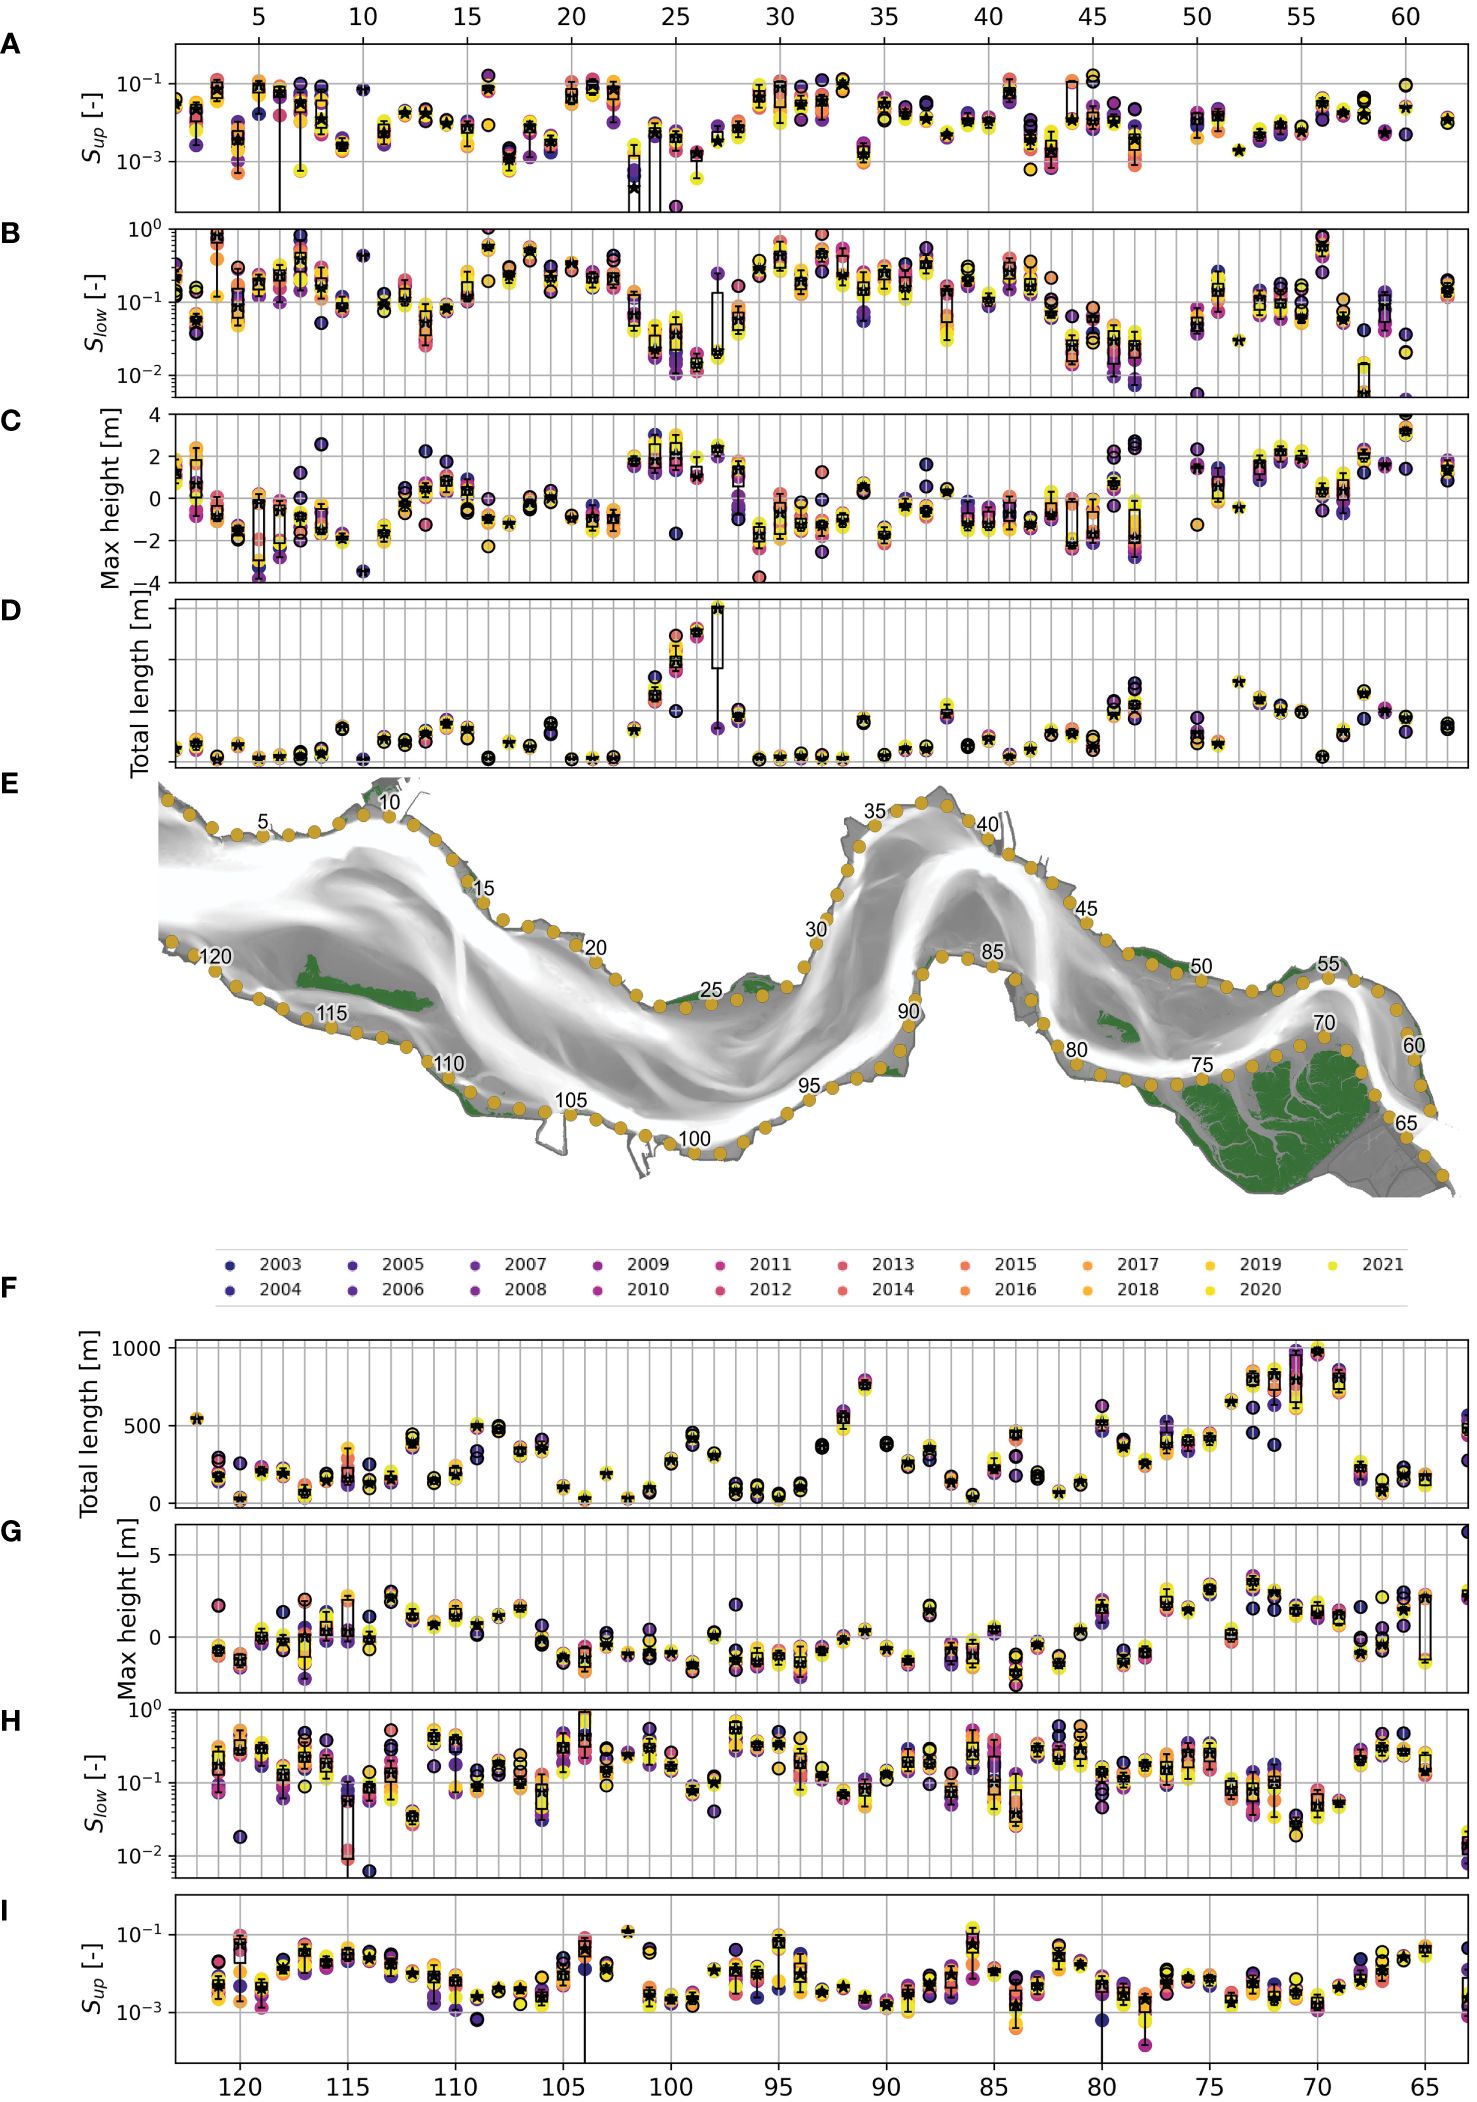
Figure 7 Tidal flat shape parameters total length (D, F), maximum height (C, G), lower slope (Slow) (B, H) and upper slope (Sup) (A, I) for each profile in the Western Scheldt in the period 2003-2021. For each parameter we calculated the median and plotted a boxplot per transect. Transect numbers on the x-axis correspond to Transect numbers indicated in panel (E).
To determine the change in profile length over time, we define the relative difference in length between 2021 and 2003: . The median relative change and median absolute change of the profile length and (respectively) indicating that, on average, the length of the tidal flats increased (positive relative change) even though the variability is larger (higher absolute change). Some areas, however, strongly deviate from these average changes. The tidal flat on Transect 24 expanded with 490 m because of nearby disposal of dredged material from the main channel. Channel dynamics are another cause for a large change in length, such as Transect 92 in Figures 8A, B where the channel migration leads to decrease of the length of the tidal flat. Similar to the change in length, we also define the change in height . The median relative change and median absolute change in maximum height are and . This indicates that the overall the tidal flats increase in height (in line with earlier observations by de Vet et al. (2017) and Kuijper et al. (2004)).
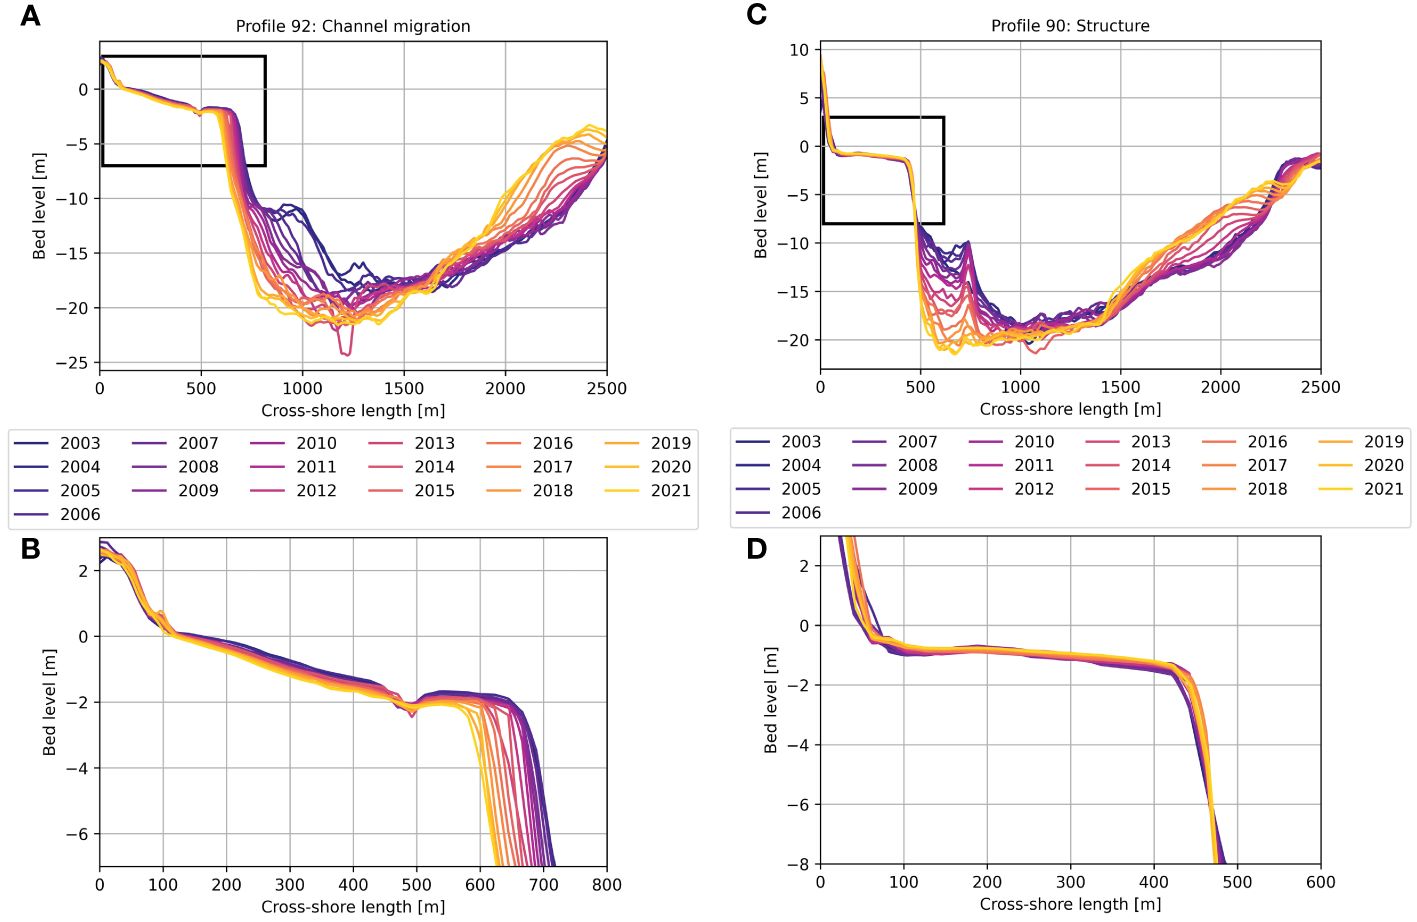
Figure 8 Two neighbouring tidal flats that are both subjected to channel migration but behave differently. (A) Tidal flat without protection by hydraulic structures erodes because the channel migrates to the tidal flat. (B) Detail of the eroding tidal flat. (C) Tidal flat protected by hydraulic structures and does not erode due to channel migration. The steepness of the channel bank increases. (D) Detail of the protected tidal flat.
In addition to the temporal and spatial variation of the length and maximum height, the values for the upper and lower part of the profile are plotted in Figures 7A, B, H, I) as well. The slopes are plotted on log scale, as the values span more than an order of magnitude. The spatial variation corresponds with the meandering pattern of the Western Scheldt. Smaller values for are found for the inner bends and higher values for the locations at the outer bends, where the channel is close to the dike. Low values for therefore also correspond to high values for the total length ( -0.69, p = 5.33 E-15). The slope of the upper part of the profile () correlates with the length of the slope: larger lengths result in a smaller (rs =-0.48, p = 4.27 E-7). Similarly, an in(de)crease in maximum height often coincides with an in(de)crease in upper slope, e.g. Transect 39. Some profiles show a substantial temporal variation in , e.g. profile 30 and 104. These profiles are very short without a distinct transition between the upper and lower slope. The fitting method becomes prone to inaccuracies because there are too many degrees of freedom compared to the amount of data points.
The migration of the tidal channel influences the available accommodation space and profile length of the tidal flat. An example is Figures 8A, B, where the channel migrates towards the dike, the tidal flat length reduces and the upper as well as the lower tidal flat erodes. There were also profiles where the tidal flat accreted and the channel accreted. However, we did not identify a generic relation between the migration of the channel and changes of the tidal flat profile shape.
The response of the tidal flat to changes in the channel is not straightforward. We observed for example that if the channel moves towards the tidal flat, accretion and erosion could occur on different parts of the tidal flat simultaneously (see Supplementary Material 2 Figures 2-1A, B). This implies that the dynamics that lead to erosion or accretion of the upper tidal flat are not fully determined by the dynamics of the channel. Local processes on the tidal flat may dominate over the larger scale channel dynamics. At most of the locations, the channel widens, deepens and migrates simultaneously (exemplified with an accreting channel that migrates towards the flat in Supplementary Material 2 Figures 2-1C, D). These morphological changes modify hydrodynamics in the channels as well as on the tidal flat. A straightforward response of the tidal flat is then not to be expected. Furthermore, morphological changes of the main channel do not affect a tidal flat if there is a secondary channel or creek in-between the considered tidal flat and the main channel (Supplementary Material 2 Figures 2-1E, F). For these profiles the dynamics of the secondary channel affect the tidal flat shape. And finally, the presence of hydrodynamic structures (groynes, longitudinal dams) decouple the interaction between the channel and the tidal flat. For example, the profile of Figures 8A, B is not protected by hydrodynamic structures and erodes whereas the neighbouring profiles that are protected by groynes and longitudinal dams do not erode. Only the channel bank becomes steeper (Figure 8C). So even though the dynamics of the upper and lower flat of the fairly natural tidal flats already seem to be decoupled, the decoupling is even stronger for the anthropogenically influenced tidal flats.
The channel may influence the tidal flat (in various ways), but the tidal flat does not influence the tidal channel for two reasons. Water depths and bed level changes over the tidal flat are an order of magnitude smaller than those in the channel. Tidal flat volume changes resulting from accretion of 0.5 m are insignificant compared to the volume of the much wider and deeper channel. Another reason is that bed protection by structures morphodynamically disconnect the tidal flat and the channel. Hence, bed level changes over the flat do not or only limitedly propagate into the tidal channel.
4 Discussion
Our work provides a new methodology to analyse tidal flat profiles and provides novel insights into the role of longshore flows, anthropogenic impacts and the role of the profile length which is inherent to the accommodation space. We will discuss these three aspects in more detail below.
4.1 Fringing tidal flats
A method is introduced to characterize cross-shore profiles, using 5 variables (upper slope, lower slope, length, height and transition length). Previous work predominantly focussed on the convexity or concavity of tidal flats and their equilibrium shapes (Kirby, 2000; Le Hir et al., 2000; Roberts et al., 2000; Pritchard et al., 2002; Pritchard and Hogg, 2003; Hu et al., 2015). Most of this work analysed the profile shape using models of varying complexity, with much less attention to simplified relationships describing profile shape. Kirby (2000) relates the length of the lower part of the profile linearly to the distance from the low to the high water mark as in: . This relation implies that the length of the lower part is related to the length of the upper part and that all profiles would scale by their length. Furthermore, this expression implies a relation between the upper and lower slope. Based on the profiles of the Western Scheldt, we conclude that the profiles do not scale by their length (Figure 3) and that the length of the upper flat depends on the accommodation space.
In this study, we investigated the tidal flat shape of actual tidal flats independent of their equilibrium. Lee and Mehta (1997) propose an exponential formulation in which the upper and lower slope are represented separately by two exponential terms describing the profile. Their approach is strongly skewed towards wave-dominated systems with the exponential terms in their relation representing wave dissipation neglecting the influence of tides. Bearman et al. (2010) identified the most dominant mode that shapes the tidal flat using Eigenfunction analysis, requiring scaling of the profile. However, we have demonstrated that in the Western Scheldt, such a scaling assumption is not valid because the length of the lower part of the flat does not scale with the length of the upper part of the flat.
So most previous work characterizing the tidal flat shape seems to be limitedly applicable to the Western Scheldt estuary. In contrast to previous studies on tidal flat shape and evolution, we focused on fringing tidal flats, characterized by dominant longshore currents. A substantial part of previous studies focused on the equilibrium tidal flat shape for tidal flats along open coasts (Roberts et al., 2000; Pritchard and Hogg, 2003; Friedrichs, 2011; Winterwerp et al., 2013a; Zhong and Hu, 2021). For these flats the cross-shore shape is determined by the relative contribution of waves and the cross-shore current. The tidal flats fringing many estuaries are additionally (or primarily) influenced by a longshore current. The longshore flow dominates the lower part of the profile whereas cross-shore flow additionally influences the upper profile, especially at the start of flood and end of ebb (Maan et al., 2018; van der Wegen et al., 2019). However, the transport processes shaping the morphology of tidal flats in environments strongly influenced by longshore flows have received relatively little attention in scientific literature. In contrast to cross-shore flow, the longshore flow is not a function of tidal volume (Supplementary Material 1 Equation 3) therefore the longshore flow dominating fringing tidal flat profiles does not scale with their cross-shore length (Figure 3). The longshore flow is a function of the estuarine topography (Le Hir et al., 2000), scales with the local water depth (Supplementary Material 1 Equation 3) and is therefore significantly larger in the main channel compared to the shallow areas (Van der Werf et al., 2015). These large channel flow velocities limit the extend of the tidal flats and shape the lower part of the tidal flat which is in agreement with field observations (Zhu et al., 2019) and model results of (Maan et al., 2018; van der Wegen et al., 2019). This study and the research of Bearman et al. (2010) are one of the few studies that use topography data of the entire estuary to study the cross-shore shape of tidal flats.
4.2 Engineered estuaries
This research was carried out in an engineered tidal system in which the presence of structures, dredging and nourishment of sediments interfere with the natural sediment transport processes between the main channel and the tidal flat. We exhibit the difference between natural and engineered estuaries. In natural estuaries, the geometry of the estuary and the alignment of the main channel and secondary channels define the available accommodation space, resulting in longer and accreting tidal flats along the inner bend and shorter and eroding flats on the opposite outer bend (Ladd et al., 2021). However, in engineered estuarine systems such as the Western Scheldt, human interventions influence the natural equilibrium shape of a tidal flat resulting in a more variable profile shape compared to pristine tidal flats. These dynamics result from alterations of the cross-shore flow, the longshore flow and the sediment availability by the construction of various dikes, groynes, longitudinal dams, dredging and dumping. The combined effect of natural and anthropogenic changes leads to a scattered tidal flat shape evolution. This scattered result is caused by 1) the upper and lower part of the tidal flat accrete or erode mutually independent (Supplementary Figures 2C, D), 2) different morphological changes like migration, widening and accretion occur simultaneously in the main channel (Supplementary Figures 2C, D), and 3) structures prevent erosion of a tidal flat while a neighbouring unprotected tidal flat erodes (Figure 8).
4.3 Adjusting the accommodation space
Our findings reveal that the profile shape is related to the profile length and the profiles are not self-similar (Figures 3, 5). The dynamics of the tidal flat shape (over time) of the tidal flats are poorly correlated to e.g. changes in the channel (Section 3.4). In the following section, we interpret the dynamics of the tidal flat based on the equilibrium profile conditions (Supplementary Material I) and not on observed tidal flat dynamics because this equilibrium shape is based on 100+ observed profiles while the observed dynamics are strongly influenced by the short-term variability.
4.3.1 Dike relocation
Dikes in our study area were constructed or relocated in the centuries preceding the observational period. As a result, observations of the impact of a dike relocation do not exist. Using a cross-shore profile model, Zhong and Hu (2021) concluded that tidal flats become accreting and steeper when reducing the tidal flat length because the cross-channel velocity gradients become smaller. On the other hand, a reduction of the tidal flat length also reduces the gross sediment transport and therefore sediment supply. Winterwerp et al. (2013a) conclude that this reduction in tidal volume, hence cross-shore flow and therefore gross sediment transport, leads to erosion. Figure 3 shows that all tidal flats follow the mean profile shape (black line), with the longer tidal flats having a longer upper flat with a similar slope as the upper flat of short tidal flats. Therefore, we argue that a seaward dike relocation leads to a cut-off of the upper part of the profile, but the remainder of the profile will not change.
Earlier modelling work suggests that for most fringing tidal flats in estuarine settings the cross-shore flow velocity is of minor importance compared to the alongshore flow velocities because they are insufficiently wide (van der Wegen et al., 2017; Maan et al., 2018; Wang et al., 2019). When a dike is relocated towards the channel (Supplementary Figure 1-1A, B), the accommodation space and tidal volume decrease. The cross-shore flow decreases (Supplementary Material 1 Equation 1) with the decrease in length. However, this is less relevant because the longshore flow is dominant. The longshore flow velocity is not dependent on the tidal flat length (see Supplementary Material 1 Equation 3). Decreasing the accommodation space from the landward side therefore does not change the longshore flow velocity on the lower flat, and therefore the impact of a dike relocation on the lower tidal flat shape is probably small for fringing tidal flats as observed along the Western Scheldt Estuary. We anticipate that also landward dike relocation (for instance as part of managed realignment) does not change the local longshore flow velocities and the tidal flat will not erode.
4.3.2 Channel migration
The boundary between a channel and a flat is influenced by lateral migration of a tidal channel, thereby controlling the accommodation space of estuarine tidal flats. In natural systems, channel widening reduces the intertidal area (Van Den Berg and Jeuken, 1996) and the channel meandering leads to tidal flat accretion in the inner bend and erosion in the outer bend (Hibma et al., 2004; Ladd et al., 2021). An example of channel migration and reduced accommodation space in the Western Scheldt is presented in Figures 8A, B. The channel migrates 100 m towards the dike while both the lower flat and upper flat erode (over the period 2003-2021): the upper flat is 0.3 m lower in 2021 compared to 2003. The accommodation space is confined on its landward side by a dike, preventing a landward shift of the flats. The channel erodes the lower intertidal and the subtidal profile, resulting in a local increase in water depth and the longshore flow velocity (Supplementary Material 1 Eq. 3). This increase in flow velocity and thereby bed shear stress on the lower flat results in further deepening, driving a positive feedback mechanism in which deepening further strengthens the flow velocity and bed erosion on the lower flat. As a consequence, the profile migrates landward, resulting in a low for short tidal flats (see also Figure 5).
4.4 Consequences for tidal flat restoration
Tidal flat wetlands are recognized as contributors to flood safety (Reed et al., 2018) as higher and longer foreshores reduce the wave impact more effectively (Vuik et al., 2019; Willemsen et al., 2020). Based on an analysis of 122 profiles, we conclude that the tidal flat height is primarily influenced by the cross-shore tidal flat length. This cross-shore length is set by the estuarine geometry as also observed by Bearman et al. (2010). In the Western Scheldt estuary, for the majority of the tidal flats the cross-shore length of the tidal flats is insufficient for the Index of Development to reach 1 (Figure 5). This implies that for restoration or development of fringing tidal flats aiming to heighten the tidal flats, the tidal flat length needs to be enlarged, for instance by managed realignment (shifting the dikes in the landward direction). Also, in view of the anticipated increase in Sea Level Rise rates, coastal wetlands need to migrate landward to mitigate coastal squeeze (Borchert et al., 2018; Schuerch et al., 2018). Hence, future-focused spatial planning should anticipate on these developments to preserve the vital services of tidal flats.
In the Westen Scheldt Estuary attempts were made to restore tidal flats locally, through the construction of hydraulic structures. The construction of groynes and/or longitudinal dams to deflect the channel seawards does not result in a significant higher tidal flat for small accommodation spaces compared to the natural situation (Figure 5). The length and height of the structure highly influence the tidal flat shape. In 2016, groynes were constructed and heightened in an existing groyne field in the Western Scheldt (Van der Werf et al., 2022). Measurements before and two years after the construction reveal that the longshore flow velocity is reduced up to 50%. The strongly reduced flow velocities in between groynes promote sediment deposition or reduce erosion rates resulting in up to 40 cm deposition in four years after the construction. The construction height of the groynes determines the magnitude of the flow reduction and height of the tidal flat – an overflowing groyne has a smaller impact on flow reduction than a non-overflowing groyne (Uijttewaal, 2005). The cross-shore length of the groyne strongly influences the maximum length of the tidal flat and therefore the cross-shore bed level gradient. Longitudinal dams similarly reduce the longshore and cross-shore flow directly. The dam height determines during which part of the tidal cycle the flow velocities are reduced and the cross-shore length between the dam and the dike defines the tidal flat length. Cross-shore profiles of flats with longitudinal dams are observed to have steep bed level gradients between the area protected and unprotected by the dam (Figure 8). Often, longitudinal dams are constructed in combination with groynes.
An important drawback of groynes and longitudinal dams is that they may also influence the hydrodynamics and sediment dynamics outside the area of interest (Nordstrom, 2014; Perkins et al., 2015). The tidal energy is redistributed to another area which may result in higher flow velocities elsewhere. Furthermore, sediment trapping within a certain groyne field leads to sediment starvation outside this groyne field, triggering erosion in areas adjacent to groyne fields. Erosion of 20-40 cm was measured on tidal flats in the vicinity of the groyne fields discussed above (Van der Werf et al., 2022). Another disadvantage of groynes and longitudinal dams is that they create steep gradients in abiotic factors as for instance flow velocity and bed level. At groyne locations, the flow velocity gradients increase in cross-shore direction and affect benthic communities (Ysebaert et al., 2016). Moreover, increased velocity gradients steepen bed level gradients and triggering erosion (Figure 8). de Vet et al. (2017) reported an increased steepness of shoals mainly by erosion of the lower flat in the Western Scheldt Estuary. Hydraulic structures will further increase the steepness of the tidal flats in the estuary and create steep vegetated islands with a minimal intertidal zone (Perkins et al., 2015). This implies that migratory birds have less foraging times during ebb and a reduction of macrobentic species that are most abundant in low dynamic intertidal areas (Ysebaert et al., 2016; Mu and Wilcove, 2020). Changes in abiotic parameters caused by structures are noteworthy disadvantageous for surrounding habitats.
5 Conclusion
We introduced a novel method to investigate the cross-shore tidal flat shape and the impact of changes to the accommodation space and human interferences on fringing tidal flats in a highly engineered estuary. With this method, we quantified and evaluated the tidal flat shape based on physical parameters (e.g. height, length and slope) expanding on previous research that predominantly focused on the convexity or concavity of tidal flats only. By introducing the Index of development () as a measure to evaluate the quality of the accommodation space, we have provided a practical tool for assessing the tidal flat maturity and restoration potential.
In engineered systems such as the Western Scheldt estuary, the tidal flat shape is affected by a combination of anthropogenic and natural estuarine changes. This complicates efforts to derive clear relations between profile shape changes and forcing factors or profile shape parameters. We do identify a clear relation between tidal flat length and height, where the tidal flat height increases with the tidal flat length, independent of hydraulic structures. Under natural circumstances, tidal flats are particularly long in the inner bends of the estuary and along the secondary channels. Given enough space, long tidal flats enable marsh establishment. However, the limited accommodation space caused by anthropogenic infrastructure in the Western Scheldt, constrains the tidal flat length and results in low tidal flats and hampers marsh development. Hydraulic structures facilitate tidal flats at locations where this would be impossible in natural systems. Nonetheless, these local structures also have important disadvantages such as altered sediment transport to neighbouring areas and inducing steep topographic and hydrodynamic gradients which impact habitat types.
The majority of the tidal flats in the Western Scheldt Estuary are convex-up and follow a common cross-shore shape. The tidal flats consist of an upper and lower flat with different slopes and the transition point between the upper and lower flat is generally between MLW and MW. The maximum elevation of the tidal flat is therefore dependent on the amount of space available for the upper flat. This has the following implications for tidal flat shape in response to (anthropogenic) disturbances. Reduction of the accommodation space by a dike re-allocation (and therefore (partial) cut-off of the upper part of the tidal flat) leads to a reduction of the maximum elevation of the tidal flat. Similarly, a landward migration of the channel leads to a shorter and steeper tidal flat because the lower flat erodes but cannot migrate landward. We attribute this morphological behaviour to the longshore current, which is dominant over cross-shore flow during a large part of the tidal cycle and independent of the tidal flat length. This demonstrates the importance of considering longshore flow alongside cross-shore flow when analysing the tidal flat shape in relation to changes in the accommodation space.
Our results highlight that sufficient accommodation space is key for high tidal flats with mild slopes and gradual hydrodynamic gradients. As a consequence, tidal flat and marsh restoration projects are more fruitful for the marine ecosystem if the accommodation space is enlarged.
Data availability statement
The original contributions presented in the study are included in the article/Supplementary Material. Further inquiries can be directed to the corresponding author/s.
Author contributions
JH: Writing – original draft, Visualization, Methodology, Formal analysis, Data curation, Conceptualization. BP: Writing – review & editing, Supervision, Resources, Methodology, Conceptualization. DM: Writing – review & editing, Supervision, Methodology.
Funding
The author(s) declare financial support was received for the research, authorship, and/or publication of this article. This research was funded by the Royal Netherlands Academy of Arts and Sciences (KNAW) within the framework of the Programme Strategic Scientific Alliances between China and The Netherlands, project PSA-SA-E-02.
Acknowledgments
We gratefully acknowledge P.M.J. Herman who was involved in the conceptualization of this paper and the methodology, his review on formal analysis and constructive comments.
Conflict of interest
The authors declare that the research was conducted in the absence of any commercial or financial relationships that could be construed as a potential conflict of interest.
Publisher’s note
All claims expressed in this article are solely those of the authors and do not necessarily represent those of their affiliated organizations, or those of the publisher, the editors and the reviewers. Any product that may be evaluated in this article, or claim that may be made by its manufacturer, is not guaranteed or endorsed by the publisher.
Supplementary material
The Supplementary Material for this article can be found online at: https://www.frontiersin.org/articles/10.3389/fmars.2024.1354716/full#supplementary-material
References
Barbier E. B., Hacker S. D., Kennedy C., Koch E. W., Stier A. C., Silliman B. R. (2011). The value of estuarine and coastal ecosystem services. Ecol. Monogr. 81, 169–193. doi: 10.1890/10-1510.1
Bearman J. A., Friedrichs C. T., Jaffe B. E., Foxgrover A. C. (2010). Spatial trends in tidal flat shape and associated environmental parameters in South San Francisco Bay. J. Coast. Res. 26, 342–349. doi: 10.2112/08-1094.1
Benninghofff M., Winter C. (2018). Decadal evolution of tidal flats and channels in the Outer Weser estuary, Germany. Ocean Dynamics 68, 1181–1190. doi: 10.1007/s10236-018-1184-2
Benninghoff M., Winter C. (2019). Recent morphologic evolution of the German Wadden Sea. Sci. Rep. 9 (1), 9293. doi: 10.1038/s41598-019-45683-1
Borchert S. M., Osland M. J., Enwright N. M., Griffith K. T. (2018). Coastal wetland adaptation to sea level rise: Quantifying potential for landward migration and coastal squeeze. J. Appl. Ecol. 55, 2876–2887. doi: 10.1111/1365-2664.13169
Braat L., van Kessel T., Leuven J. R. F. W., Kleinhans M. G. (2017). Effects of mud supply on large-scale estuary morphology and development over centuries to millennia. Earth Surface Dynamics 5 (4), 617–652. doi: 10.5194/esurf-5-617-2017
Brouwer R., Langford I. H., Bateman I. J., Turner R. K. (1999). A meta-analysis of Wetland Contingent valuation studies. Regional Environ. Change 1, 301–311. doi: 10.1007/s101130050007
Brückner M. Z. M., Schwarz C., van Dijk W. M., van Oorschot M., Douma H., Kleinhans M. G. (2019). Salt marsh establishment and eco-engineering effects in dynamic estuaries determined by species growth and mortality. J. Geophysical Research: Earth Surface 124, 2962–2986. doi: 10.1029/2019JF005092
de Vet P. L. M., van Prooijen B. C., Colosimo I., Ysebaert T., Herman P. M. J., Wang Z. B. (2020). Sediment disposals in estuarine channels alter the eco-morphology of intertidal flats. J. Geophysical Research: Earth Surface 125. doi: 10.1029/2019JF005432
de Vet P. L. M., van Prooijen B. C., Wang Z. B. (2017). The differences in morphological development between the intertidal flats of the Eastern and Western Scheldt. Geomorphology 281, 31–42. doi: 10.1016/j.geomorph.2016.12.031
De Vriend H. J., Wang Z. B., Ysebaert T., Herman P. M. J., Ding P. (2011). Eco-morphological problems in the yangtze estuary and the western scheldt. Wetlands 31, 1033–1042. doi: 10.1007/s13157-011-0239-7
Dyer K. R. (1998). The typology of intertidal mudflats. Geological Soc. Special Publ. 139, 11–24. doi: 10.1144/GSL.SP.1998.139.01.02
Dyer K. R., Christie M. C., Wright E. W. (2000). The classi " cation of intertidal mud # ats. Continental Shelf Res. 20, 1039–1060.
Fan X., Zhang L., Yuan L., Guo B., Zhang Q., Wang Y., et al. (2023). Loss of tidal creek ecosystem vitality caused by tidal flat narrowing on the central Jiangsu coast, China. Sci. Total Environ. 864, 161216. doi: 10.1016/j.scitotenv.2022.161216
Friedrichs C. T. (2011). “Tidal flat morphodynamics: A synthesis,” in Treatise on estuarine and coastal science, Vol. 3. (Elsevier Inc). doi: 10.1016/B978-0-12-374711-2.00307-7
Friedrichs C. T., Aubrey D. G. (1996). Uniform bottom shear stress and equilibrium hyposometry of intertidal flats. (Washington, DC: American Geophysical, Union), 405–429. doi: 10.1029/ce050p0405
Hanssen J. L. J., van Prooijen B. C., Volp N. D., de Vet P. L. M., Herman P. M. J. (2022). Where and why do creeks evolve on fringing and bare tidal flats? Geomorphology 403, 108182. doi: 10.1016/j.geomorph.2022.108182
Hibma A., Schuttelaars H. M., De Vriend H. J. (2004). Initial formation and long-term evolution of channel-shoal patterns. Continental Shelf Res. 24, 1637–1650. doi: 10.1016/j.csr.2004.05.003
Hu Z., Wang Z. B., Zitman T. J., Stive M. J. F., Bouma T. J. (2015). Predicting long-term and short-term tidal flat morphodynamics using a dynamic equilibrium theory. J. Geophysical Research: Earth Surface 120, 1803–1823. doi: 10.1002/2015JF003486
Hu Z., Yao P., van der Wal D., Bouma T. J. (2017). Patterns and drivers of daily bed-level dynamics on two tidal flats with contrasting wave exposure. Sci. Rep. 7, 1–9. doi: 10.1038/s41598-017-07515-y
Jeuken M. C. J. L., Wang Z. B. (2010). Impact of dredging and dumping on the stability of ebb-flood channel systems. Coast. Eng. 57, 553–566. doi: 10.1016/j.coastaleng.2009.12.004
Kirby R. (2000). Practical implications of tidal flat shape. Continental Shelf Res. 20, 1061–1077. doi: 10.1016/S0278-4343(00)00012-1
Kirwan M. L., Guntenspergen G. R. (2012). Feedbacks between inundation, root production, and shoot growth in a rapidly submerging brackish marsh. J. Ecol. 100, 764–770. doi: 10.1111/j.1365-2745.2012.01957.x
Kirwan M. L., Megonigal J. P. (2013). Tidal wetland stability in the face of human impacts and sea-level rise. Nature 504, 53–60. doi: 10.1038/nature12856
Kuijper C., Steijn R., Roelvink D., van der Kaaij T., Olijslagers P. (2004). Morphological modelling of the Western Scheldt, in Report. WL | Delft Hydraulics/Alkyon.
Ladd C. J. T., Duggan-Edwards M. F., Pagès J. F., Skov M. W. (2021). Saltmarsh resilience to periodic shifts in tidal channels. Front. Mar. Sci. 8. doi: 10.3389/fmars.2021.757715
Lansu E. M., Reijers V. C., Höfer S., Luijendijk A, Rietkerk M, Wassen MJ, et al. (2024). A global analysis of how human infrastructure squeezes sandy coasts. Nat. Commun. 15, 432. doi: 10.1038/s41467-023-44659-0
Lau J. D., Hicks C. C., Gurney G. G., Cinner J. E. (2019). What matters to whom and why? Understanding the importance of coastal ecosystem services in developing coastal communities. Ecosystem Serv. 35, 219–230. doi: 10.1016/j.ecoser.2018.12.012
Lee S.-C., Mehta A. J. (1997). Problems in characterizing dynamics of mud shore profiles. J. Hydraulic Eng. 123, 351–361. doi: 10.1061/(ASCE)0733-9429(1997)123:4(351)
Le Hir P., Roberts W., Cazaillet O., Christie M., Bassoullet P., Bacher C. (2000). Characterization of intertidal flat hydrodynamics. Continental Shelf Res. 20, 1433–1459. doi: 10.1016/S0278-4343(00)00031-5
Maan D. C., van Prooijen B. C., Zhu Q., Wang Z. B. (2018). Morphodynamic feedback loops control stable fringing flats. J. Geophysical Research: Earth Surface 123, 2993–3012. doi: 10.1029/2018JF004659
Mann H. B., Whitney D. R. (1947). On a test of whether one of two random variables is stochastically larger than the other. Ann. Math. Stat 18, 50–60. doi: 10.1214/aoms/1177730491
McLaren P. (1993). Patterns of sediment transport in the western part of the Westerschelde. Tech. Rep.
McLaren P. (1994). Sediment transport in the westerschelde between baarland and rupelmonde. Rep. Prepared Antwerp Harbour Authorities.
Mu T., Wilcove D. S. (2020). Upper tidal flats are disproportionately important for the conservation of migratory shorebirds. Proc. R. Soc. B: Biol. Sci. 287. doi: 10.1098/rspb.2020.0278
Nordstrom K. F. (2014). Living with shore protection structures: A review. Estuarine Coast. Shelf Sci. 150, Part A, 11–23. doi: 10.1016/j.ecss.2013.11.003
Perkins M. J., Ng T. P., Dudgeon D., Bonebrake T. C., Leung K. M. (2015). Conserving intertidal habitats: what is the potential of ecological engineering to mitigate impacts of coastal structures? Estuarine Coast. Shelf Sci. 167, 504–515.
Pontee N. (2013). Defining coastal squeeze: A discussion. Ocean Coast Manag. 84, 204–207. doi: 10.1016/j.ocecoaman.2013.07.010
Pritchard D., Hogg A. J. (2003). Cross-shore sediment transport and the equilibrium morphology of mudflats under tidal currents. J. Geophysical Research: Oceans 108, 1–15. doi: 10.1029/2002JC001570
Pritchard D., Hogg A. J., Roberts W. (2002). Morphological modelling of intertidal mudflats: The role of cross-shore tidal currents. Continental Shelf Res. 22, 1887–1895. doi: 10.1016/S0278-4343(02)00044-4
Reed D., van Wesenbeeck B., Herman P. M. J., Meselhe E. (2018). Tidal flat-wetland systems as flood defenses: Understanding biogeomorphic controls. In Estuarine Coast. Shelf Sci. 213pp, 269–282). doi: 10.1016/j.ecss.2018.08.017
Roberts W., Le Hir P., Whitehouse R. J. S. (2000). Investigation using simple mathematical models of the effect of tidal currents and waves on the profile shape of intertidal mudflats. Continental Shelf Res. 20, 1079–1097. doi: 10.1016/S0278-4343(00)00013-3
RWS (2021). DATASET Dataportal topographic data 2003-2021. Available online at: https://www.rijkswaterstaat.nl/zakelijk/open-data.
Schuerch M., Spencer T., Temmerman S., Kirwan M. L., Wolff C., Lincke D., et al. (2018). Future response of global coastal wetlands to sea-level rise. Nature 561, 231–234. doi: 10.1038/s41586-018-0476-5
Sokal R. R., Rohlf F. J. (1995). Biometry: the principles and practice of statistics in biological research3rd EditionEd. Freeman W. H.
Uijttewaal W. S. J. (2005). Effects of groyne layout on the flow in groyne fields: laboratory experiments. J Hydraul Eng. doi: 10.1061/(ASCE)0733-9429(2005)131:9(782)
Van Den Berg J. H., Jeuken C. J. L. (1996). Chapter Seven Hydraulic processes affecting the morphology and evolution of the Westerschelde estuary.
van den Berg J. H., Jeuken M. C. J. L., van der Spek A. J. F. (1996). Hydraulic processes affecting the morphology and evelotion of the Westerschelde estuary. Estuar. Shores: Evolution Environments Hum. Alterations, 157–183.
Van der Vegt H., Mastbergen D., van der Werf J. (2020). “Moeilijk-erodeerbare lagen in de Westerschelde,” in Report. Delft, Deltares, 1210301–015-ZKS-0014. Available at: https://www.deltares.nl/expertise/publicaties/moeilijk-erodeerbare-lagen-in-de-westerschelde-onzekerheden-en-gevolgen-voor-morfodynamiek.
van der Wegen M., Jaffe B., Foxgrover A., Roelvink D. (2017). Mudflat morphodynamics and the impact of sea level rise in south san francisco bay. Estuaries Coasts 40, 37–49. doi: 10.1007/s12237-016-0129-6
van der Wegen M., Roelvink J. A., Jaffe B. E. (2019). Morphodynamic resilience of intertidal mudflats on a seasonal time scale. J. Geophysical Research: Oceans 124, 8290–8308. doi: 10.1029/2019JC015492
Van der Werf J., de Vet L., Salvador de Paiva J., van Oiijen T., Bax V., van der Laag W., et al. (2022). “Buitendijkse maatregelen Knuitershoek en Baalhoek,” (Report).
Van der Werf J., Van Oyen T., De Maerschalck B., Nnafie A., Taal M., Verwaest T., et al. (2015). Modeling the morphodynamics of the mouth of the scheldt estuary. E-proceedings 36th IAHR World Congress.
van Dijk W. M., Cox J. R., Leuven J. R. F. W., Cleveringa J., Taal M., Hiatt M. R., et al. (2021). The vulnerability of tidal flats and multi-channel estuaries to dredging and disposal. Anthropocene Coasts 4, 36–60. doi: 10.1139/anc-2020-0006
Van Dijk W. M., van der Werf J. J., Kleinhans M. G. (2019). Effects of shoal margin collapses on the morphodynamics of a sandy estuary. J. Geophysical Research: Earth Surface 124, 195–215. doi: 10.1029/2018JF004763
van Prooijen B. C., Montserrat F., Herman P. M. (2011). A process-based model for erosion of Macoma balthica-affected mud beds. Continental Shelf Res. 31 (6), 527–538.
Vuik V., Borsje B. W., Willemsen P. W. J. M., Jonkman S. N. (2019). Salt marshes for flood risk reduction: Quantifying long-term effectiveness and life-cycle costs. Ocean Coast. Management , 171 96–110. doi: 10.1016/j.ocecoaman.2019.01.010
Wang Z. B., Jeuken M. C. J. L., Gerritsen H., De Vriend H. J., Kornman B. A. (2002). Morphology and asymmetry of the vertical tide in the Westerschelde estuary. Continental Shelf Res. 22.
Wang Z. B., Van Maren D. S., Ding P. X., Yang S. L., Van Prooijen B. C., De Vet P. L. M., et al. (2015). Human impacts on morphodynamic thresholds in estuarine systems. Continental Shelf Res. 111, 174–183. doi: 10.1016/j.csr.2015.08.009
Wang Y., Wang Y. P., Yu Q., Du Z., Wang Z. B., Gao S. (2019). Sand-mud tidal flat morphodynamics influenced by alongshore tidal currents. J. Geophysical Research: Oceans 124, 3818–3836. doi: 10.1029/2018JC014550
Weisscher S. A. H., Baar A. W., van Belzen J., Bouma T. J., Kleinhans M. G. (2022). Transitional polders along estuaries: Driving land-level rise and reducing flood propagation. Nature-Based Solutions 2100022. doi: 10.1016/j.nbsj.2022.100022
Willemsen P. W. J. M., Borsje B. W., Vuik V., Bouma T. J., Hulscher S. J. M. H. (2020). Field-based decadal wave attenuating capacity of combined tidal flats and salt marshes. Coast. Eng. 156, 103628. doi: 10.1016/j.coastaleng.2019.103628
Winterwerp J. C., Erftemeijer P. L. A., Suryadiputra N., Van Eijk P., Zhang L. (2013a). Defining eco-morphodynamic requirements for rehabilitating eroding mangrove-mud coasts. Wetlands 33, 515–526. doi: 10.1007/s13157-013-0409-x
Winterwerp J. C., Wang Z. B., Van Braeckel A., Van Holland G., Kösters F. (2013b). Man-induced regime shifts in small estuaries - II: A comparison of rivers. Ocean Dynamics 63, 1293–1306. doi: 10.1007/s10236-013-0663-8
Ysebaert T., Craeymeersch J., van der Wal D. (2016). De relatie tussen bodemdieren en hydro- en morfodynamiek in het sublitoraal en litoraal van de Westerschelde. Imares, Wageningen.
Ysebaert T., Herman P. M. J., Meire P., Craeymeersch J., Verbeek H., Heip C. H. R. (2003). Large-scale spatial patterns in estuaries: Estuarine macrobenthic communities in the Schelde estuary, NW Europe. Estuarine Coast. Shelf Sci. 57, 335–355. doi: 10.1016/S0272-7714(02)00359-1
Zhong Z., Hu Z. (2021). The impact of reclamation on tidal flat morphological equilibrium. Front. Mar. Sci. 8. doi: 10.3389/fmars.2021.769077
Zhu C., Guo L., van Maren D. S., Tian B., Wang X., He Q., et al. (2019). Decadal morphological evolution of the mouth zone of the Yangtze Estuary in response to human interventions. Earth Surface Processes Landforms 44, 2319–2332. doi: 10.1002/esp.4647
Keywords: engineered estuary, tidal flat shape, mud flat development, accommodation space, intertidal zone, topography data
Citation: Hanssen JLJ, van Prooijen BC and van Maren DS (2024) The shape of fringing tidal flats in engineered estuaries. Front. Mar. Sci. 11:1354716. doi: 10.3389/fmars.2024.1354716
Received: 12 December 2023; Accepted: 29 March 2024;
Published: 08 May 2024.
Edited by:
Paolo Ciavola, University of Ferrara, ItalyReviewed by:
Fan Xu, East China Normal UniversityMark Schuerch, University of Lincoln, United Kingdom
Copyright © 2024 Hanssen, van Prooijen and van Maren. This is an open-access article distributed under the terms of the Creative Commons Attribution License (CC BY). The use, distribution or reproduction in other forums is permitted, provided the original author(s) and the copyright owner(s) are credited and that the original publication in this journal is cited, in accordance with accepted academic practice. No use, distribution or reproduction is permitted which does not comply with these terms.
*Correspondence: Jill L. J. Hanssen, j.l.j.hanssen@tudelft.nl