Indices and methods for evaluating gross ecosystem product in sea areas: a case study in Changdao County, China
 Wenwen Li
 Shuai He1
 - 1First Institute of Oceanography, Ministry of Natural Resources, Qingdao, China
- 2Department of Agriculture, Qingdao Hengxing University, Qingdao, China
- 3Department of Economics, the University of Warwick, Coventry, United Kingdom
- 4College of Wetland, Yancheng Teachers’ University, Yancheng, China
Introduction: Coastal nations heavily rely on their sea areas to achieve sustainable socioeconomic development. Sea areas offer abundant marine ecosystem products and services that are difficult to substitute with industrial goods. Although considerable research has been performed to evaluate the contribution offrom the marine ecosystems to human well-being, systematic and measurable indices are lacking.
Methods: To address this knowledge gap, ecosystem service theory was used to establish a framework for assessing the gross ecosystem product (GEP) of a sea area, which represents the total monetary value of final ecosystem products directly and indirectly used by people within a specific administrative jurisdiction in one year. To evaluate marine GEP, three primary indices, i.e., material products, regulating products, and cultural products, were employed, and they consist of eight secondary indices. Material products in the sea area include aquatic products and oxygen products; regulating products include carbon sequestration, climate regulation, waste treatment, and coastal protection; and cultural products include leisure and recreation, and seascape-added value. The marine GEP was calculated for the administrative sea areas of Changdao County, which is located in the Yellow Sea-Bohai Sea transitional zone.
Results and discussion: Our analysis indicated that from 2017 to 2019, the marine GEP in Changdao ranged between 32.59 and 33.35 billion Chinese yuan (CNY). Regulating products contributed two-thirds of this total value. However, over the three-year period, the marine GEP underwent a 5.64% decrease in Changdao. Specifically, the value of material products increased by 38.85% while that of regulating and cultural products decreased by 9.16% and 15.87%, respectively. Notably, the spatial distribution of ecosystem product values in Changdao displayed two prominent trends: (1) higher values along the coastal sea areas of islands and lower values in offshore sea areas; and (2) higher values in coastal areas of southern islands and lower values in coastal areas of northern islands. Marine GEP may serve as a comprehensive indicator for assessing the sustainability of marine ecosystem. Combining the assessment of both marine and terrestrial GEP facilitates an understanding of how marine and terrestrial ecosystems interact in coastal regions. Furthermore, the combined use of marine GEP and GDP helps better evaluate and sort the level of green development of coastal nations and regions.
1 Introduction
Land spatial planning divides a country into living, production, and ecological spaces. In an economic system, gross domestic product (GDP) serves as a comprehensive indicator of the economic output of the production space. During the early and middle stages of rapid development, many countries prioritize using the GDP growth rate as a major indicator to assess local economic growth and government officials’ performance. Consequently, local governments pay little attention to environmental capacity and natural ecological carrying capacity. This practice has led to issues such as excessive resource consumption, environmental degradation, and ecosystem decline (Chen et al., 2013; Ouyang et al., 2017; Liu et al., 2018). Thus, there is an urgent need to establish a comprehensive ecological output indicator that aligns with GDP. Such an indicator would enable decision-makers to pay attention to critical ecological and human welfare issues while formulating economic development strategies and policies (Daily et al., 2009; Ouyang et al., 2016). Considering the final products and services, Chinese scholars, such as Ouyang Zhiyun, proposed the scientific concept of gross ecosystem product (GEP) in 2013, which considers the significant role of ecosystem services in supporting socio-economic activities and human well-being (Ouyang et al., 2013).
Gross ecosystem product quantifies the monetary value of the final material products and services that ecosystems provide for human well-being and sustainable development in a specific region and time period. Similar to GDP, GEP is usually calculated annually. It includes the value of material products (e.g., agriculture, forestry, and fishing), regulating services (e.g., water retention, flood mitigation, soil retention, sandstorm prevention, carbon sequestration, air purification, and climate regulation), and cultural services (e.g., recreation and tourism) (Ouyang et al., 2013; Zheng et al., 2019). It is important to note the overlap between GEP and GDP since the production space in the economic system occupies part of the ecological space in the ecosystem. If the production space overlaps completely with the ecological space, both the economic system and the ecosystem will collapse. Consequently, GEP can be a useful complement to GDP because it highlights the contribution of nature, which is overlooked in GDP calculations, thus allowing for a more comprehensive assessment of the impact of economic development on ecosystems and the formulation of more sustainable development strategies (Zheng et al., 2023).
In China, numerous studies on GEP have been undertaken, including 16, 29, and 151 assessments at the provincial, municipal, and county levels, respectively (Zheng et al., 2023), and they have predominantly focused on evaluating terrestrial GEP. Among the most notable include assessments at the provincial levels (Ouyang et al., 2016, 2020) and city/county levels (Wang et al., 2017; Dong et al., 2019; Pema et al., 2017; 2020; Yang et al., 2019) led by Ouyang Zhiyun’s team as well as a terrestrial GEP evaluation at the national level led by Wang Jinnan’s team (Ma et al., 2017; Ma et al., 2020a, b). Furthermore, GEP evaluations can help assess local ecological conservation effectiveness and ecological civilization (Geng and Ren, 2020; Pema et al., 2020; Jiang et al., 2021). The findings of such studies have revealed the intrinsic ecological value of ecosystems by reflecting their quality and provided decision-makers with more scientific and rational strategies for sustainable development and environmental policies (Ma et al., 2020a, b). China has proposed a range of innovative policies through existing integrated GEP accounting strategies and early examples of effective ecosystem service management and payment schemes, including establishing a GEP-based administrative evaluation system, improving eco-compensation regulation, developing a GEP-based financing mechanism, establishing a GEP-based procurement system, and establishing a GEP credit system (Zheng et al., 2023).
Although researchers have extensively assessed marine ecosystem services (Chen et al., 2006; Wang et al., 2011; Beaumont et al., 2014; Castaño-Isaza et al., 2015; Xiao et al., 2016; Hao et al., 2020), most of these assessments focused on a single ecosystem service; moreover, studies on the GEP in sea areas are largely lacking. The jurisdictional sea areas in coastal regions include diverse ecosystems, including estuaries, bays, shallow seas along straight coastlines, mangroves, coral reefs, seagrass beds, kelp fields, oyster reefs, coastal salt marshes, tidal flats, upwelling areas, islands, shellfish and algae aquaculture zones, artificial fishing reefs, and cage culture zones. Considering the distinct nature of marine and land environments, which significantly differ in their chemical properties and sedimentation processes, a separate evaluation system for marine GEP is required. The evaluation of marine GEP will not only provide a better understanding of the health and service functions of marine ecosystems but also reveal their role in supporting socioeconomic development and human well-being in coastal areas.
This study constructed an evaluation system for marine GEP, and it included the principles for selecting evaluation indices as well as the selected indices and evaluation methods. Subsequently, this evaluation system was applied to the Changdao sea area in Shandong Province. Located in the Yellow Sea large marine ecosystem, which is one of the 66 large marine ecosystems in the world, the Changdao sea area has the most typical temperate marine-island complex ecosystem in China, with as many as seven types of natural protection areas, which are representative of the research area. This study verified the value of the final material products and services provided by Changdao’s sea areas and their support for socioeconomic development from 2017 to 2019. The assessment of the marine GEP of the Changdao in this study offers scientific guidance for local governments in managing marine development, evaluating environmental performance, and constructing ecological civilizations in coastal regions.
2 Materials and methods
2.1 Selection procedure and principles of evaluation indices
The GEP is a subset of the value of ecosystem services, and it only assesses direct and indirect use values rather than potential and existence values (Ouyang et al., 2017). Guided by the principles of scientific validity, human significance, calculability, and data accessibility (see Supplementary Material 1), we derived eight key indices from the initial 17 marine ecosystem service indices, thus forming the framework for the evaluation of marine GEP (Table 1). The evaluation framework for marine GEP includes three primary indices: material products, regulating products, and cultural products. Material products refer to the physical products that marine ecosystems provide to human beings, including two secondary indices: aquatic products and oxygen products. Regulating products refer to the services provided by marine ecosystems to regulate the quality of the human living environment, including four secondary indices: carbon sequestration, climate regulation, waste treatment, and coastal protection. Cultural products refer to the non-material benefits of marine ecosystems that enhance the quality of human life, including two secondary indices: leisure and recreation and seascape-added value.
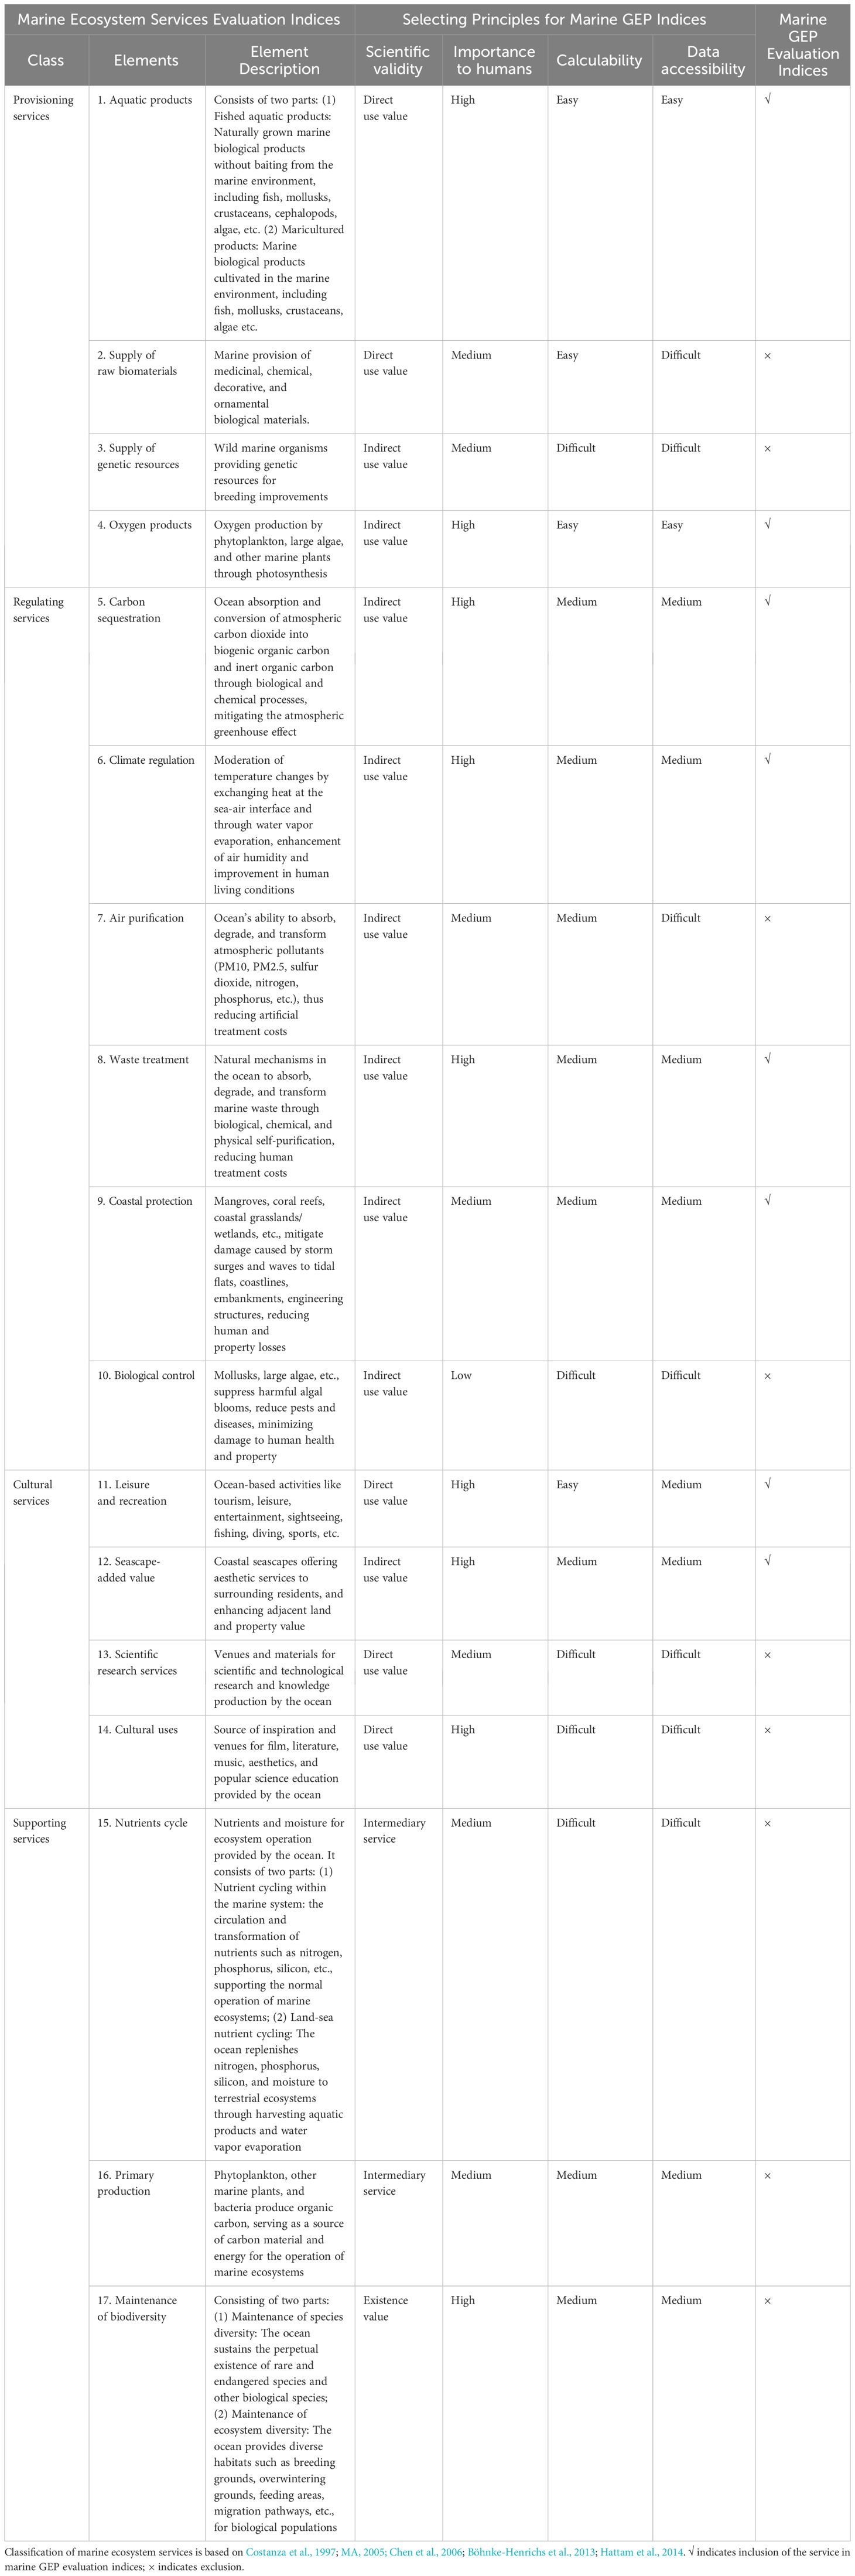
Table 1 Composition of marine gross ecosystem product evaluation indices.
2.2 Evaluation of material products
2.2.1 Aquatic products
The annual yield and value of both mariculture and fished aquatic products in sea areas were evaluated, including fish, shellfish, crustaceans, cephalopods, and others. To evaluate the value of these aquatic products the market price method was employed, as per Equation (1):
where VP is the value provided by aquatic products (Chinese yuan (CNY) per annum); VA and VC represent the values of cultured and harvested aquatic products, respectively (CNY per annum); QAi indicates the yield of a specific type of cultured aquatic product (kg per annum); PAi represents the unit price of a certain type of cultured aquatic product (kg per CNY); QCj denotes the yield of a particular type of harvested aquatic product (kg per annum); and PCj stands for the unit price of a certain type of harvested aquatic product (kg per CNY), with the unit price deducting the cost of cultivation or harvesting.
2.2.2 Oxygen products
The evaluation of production involved determining the value of oxygen from coastal grassland vegetation like mangroves, seepweed, and spartina, as well as large algae, seaweed, and phytoplankton. The formulas for oxygen production are provided in Equations (2-4). The value assessment of oxygen products used the replacement cost method, as per Equation (5):
where QO2 represents the production of oxygen (ton per annum); QO2 signifies the daily oxygen production per unit area of vegetation (mg/m2·d); S stands for the target sea area (km2); QO2 denotes the production of oxygen by annual large algae (ton per annum); Qpp represents the primary productivity of phytoplankton (mg/m2·d); QA stands for the dry weight of annual large algae (ton per annum); and represents the unit cost of artificial oxygen production (CNY per ton).
2.3 Evaluation of regulating products
2.3.1 Carbon sequestration
The quantity and value of carbon sequestration by phytoplankton, annual large algae, and shells were evaluated. The carbon sequestration of annual large algae is based on the dry weight of the algae, while that of phytoplankton is determined through net primary productivity. The sequestration by shellfish/shells factors is based on in their wet weight, coefficients for dry shell weight, and average carbon content within the shells (Zhang et al., 2021). Formulae for the quantity of carbon sequestration are given in Equations (6-9); the value of carbon sequestration was assessed using the replacement market price method, as per Equation (10):
where represents the total carbon sequestration (ton per annum); denotes the carbon sequestration of phytoplankton per unit area over unit time in the sea area (mg/m2·d); S is the area of the target sea area (km2); is the carbon sequestration by annual large algae (ton per annum); denotes the carbon sequestration by shells (ton per annum); Qpp represents the primary productivity of phytoplankton (mg/m2·d); QA is the dry weight of annual large algae (ton per annum); Q is the annual wet weight yield of shellfish (ton per annum); PS stands for the ratio of dry to wet shell weight (referred to as the dry shell weight coefficient); CS stands for the average carbon content in the shells, %; is the coefficient converting shell carbon content to carbon dioxide content; represents the value of carbon sequestration (CNY per annum); and is the market trading price of China’s carbon dioxide emission rights (CNY per ton).
2.3.2 Climate regulation
The assessment of climate regulation involved the evaluation of sensible heat flux produced during winter and summer at the sea-air interface as well as latent heat flux that transfers heat from the ocean to the atmosphere due to seawater evaporation. The calculations of these two parameters considered an average daily temperature lower than 8°C and higher than 26°C (Chen et al., 2022) and used the bulk method (Chu et al., 2006; Luo et al., 2018), as detailed in Equations (11-18). The value of climate regulation was evaluated using the replacement cost method, as per Equation (19):
where W represents the quantity of climate regulation in the target sea area (kW·h/a); A denotes the area of the target sea area (km2); T stands for the effective hours; γ is the air conditioning energy efficiency ratio, set at 3.25 (Cheng et al., 2021); Qi represents the sensible heat flux at sea-air interface for the i-th day (kJ/d·m2); Qj denotes the latent heat flux for the j-th day; θ stands for the atmospheric potential temperature at a 2-m height above the sea surface for the i-th day (K, Equation 14); ρa is the density of moist air at the sea-air interface (kg/m3, Equation 15); Cpa represents the specific heat capacity of air at constant pressure, set at 1004.67 J/(kg·K); Ch and Ce denote the exchange coefficients for sensible heat and water vapor (dimensionless), set at 1.176×10⁻³ and 1.191×10⁻³, respectively, based on Yan (1999); p stands for the standard atmospheric pressure, set at 1008.0 hPa; qa is the specific humidity of air (g/kg, Equation 16); Le represents the latent heat of vaporization (J/kg, Equation 17); qs denotes the specific humidity of moist air at the sea-air interface (g/kg, see Equation 18); Twi stands for the average temperature of the sea surface layer for the i-th day (K); V10i is the average wind speed at a distance of 10 m above the sea surface for the i-th day (m/s); ea and es represent atmospheric saturation vapor pressure (hPa) and saturation vapor pressure at the sea-air interface (hPa), respectively, calculated using the Goff–Gratch equation; VW is the value of climate regulation (CNY/a); and PE stands for the electricity price for air conditioning consumption (CNY/kW·h).
2.3.3 Waste treatment
The evaluation of the quantity and value of land-based wastewater discharged into the sea area mainly includes industrial wastewater, domestic sewage discharge, chemical oxygen demand (COD) content, and ammonia nitrogen discharge. The quantity and value are calculated using Equations (20) and (21), respectively:
where QSWT represents the quantity of waste treatment (seawater discharge) (ton per annum); QWW denotes the total discharge of industrial wastewater and urban domestic sewage (ton per annum); QCOD stands for the total discharge of COD in industrial wastewater and urban domestic sewage (ton per annum); QNH3-N is the total discharge of ammonia nitrogen in industrial wastewater, urban, and rural domestic sewage; QWT represents the total COD and ammonia nitrogen discharged into the sea by major rivers (ton per annum); and PW denotes the unit cost of artificial waste treatment (CNY per ton).
2.3.4 Coastal protection
Coastal protection refers to the preservation of coastal ecosystems such as coastal salt marshes, mangroves, coral reefs, seagrass beds, and algae fields to mitigate the damage caused by storms, surges, and waves on embankments. The length of protected coastlines and embankments was acquired through remote sensing and on-site surveys and calculated using Equation (22), and the value of coastal protection is evaluated using the replacement cost method, as per Equation (23):
where Dcl represents the total length of protected coastline (km per annum); Dcli denotes the length of coastline protected by class i ecosystems (km per annum); Vcl stands for the value of coastal protection (CNY per annum); and Ccli is the annualized construction and maintenance cost per kilometer of coastline protected by class i ecosystems against storm surges and waves (CNY per km).
2.4 Evaluation of cultural products
2.4.1 Leisure and recreation
To assess the value of leisure and recreation activities, such as entertainment, sightseeing, and tourism activities in natural marine landscapes, the number of visitors and their economic contribution were evaluated. The travel cost method was employed to evaluate the value of leisure and recreation, as per Equation (24):
where Vt represents the value of leisure tourism (CNY per annum); Ni denotes the number of tourists from region i; and TCi stands for the average travel cost per person from region i (CNY per person).
2.4.2 Seascape-added value
To measure the rise in the added value of surrounding real estate due to enhanced coastal seascapes, the market price method is utilized for valuation, as per Equation (25):
where Va denotes the seascape-added value (CNY per annum), Aa represents the total area of land and properties benefiting from coastal seascapes (m2), and Pa indicates the premium per unit area of real estate and land brought by coastal seascapes (CNY per m2).
2.5 Evaluation of marine GEP
Marine GEP represents the sum of the values of all final ecosystem products provided by the ecosystems in the target sea area within a year, as per Equation (26):
where GEP denotes the gross ecosystem product, i.e., the total value of all marine ecosystem products (Chinese CNY per annum), and Vi represents the value of various final ecosystem products (CNY per annum), including aquatic product value, oxygen product value, carbon sequestration value, climate regulation value, waste treatment value, coastal protection value, leisure and recreation value, and seascape-added value.
3 Case verification: Changdao, Shandong Province
3.1 Overview of the study area
Changdao is situated at the convergence of the Yellow Sea and Bohai Sea in the Bohai Strait and covers a total territorial area of 3302 km², including 3242.742 km² of sea area and 59.26 km² of island land (Figure 1). The coastline extends over 184.64 km, encompassing a cluster of 151 islands, of which only 10 are inhabited. These include (from south to north) Nanchangshan Island, Beichangshan Island, Miaodao Island, Daheishan Island, Xiaoheishan Island, Tuoji Island, Daqin Island, Xiaoqin Island, Nanhuangcheng Island, and Beihuangcheng Island. The study area has a warm temperate monsoon continental climate. Changdao has typical temperate marine and island ecosystems in China, thus providing crucial sanctuaries for spotted seals, East Asian finless porpoises, migratory birds, and animals. These islands play a key role as essential “pumping stations” for the Bohai Sea ecosystems (He et al., 2023).

Figure 1 Study area used in the current study. Beihuangcheng Island (BHCD); Nanhuangcheng Island (NHCD); Xiaoqin Island (XQD); Daqin Island (DQD); Tuoji Island (TJD); Gaoshan Island (GSD); Houji Island (HJD); Cheyou Island (CYD); Xiaozhushan Island (XZSD); Dazhushan Island (DZSD); Beichangshan Island (BCSD); Nanchangshan Island (NCSD); Daheishan Island (DHSD); Xiaoheishan Island (XHSD); Miaodao Island (MD).
3.2 Selection of evaluation indices
Based on the Changdao marine ecosystem features, ecological development and utilization status, and data accessibility, six key indices were identified for the marine GEP evaluation: aquatic products, oxygen products, carbon sequestration, climate regulation, waste treatment, and leisure and recreation. The Changdao coastline is steep with narrow beaches, which are primarily composed of gravel shores and show a lack of mudflats and sandy beaches. Protective coastal wetland ecosystems, such as mangroves, coral reefs, and coastal grasslands, are absent. Consequently, the contribution of coastal protection services is minimal. Residential areas on the islands are generally located within 500 m of the shoreline and primarily consist of coastal landscape properties. It is difficult to find suitable non-landscape controls on the islands. Therefore, the evaluation of coastal protection and seascape-added value was not included in the GEP evaluation of the Changdao sea area.
3.3 Data sources
Data for various aquaculture and fishing product yields on the Changdao were provided by the Changdao Natural Resources Bureau (see Supplementary Material 2). Primary productivity data for phytoplankton in Changdao (Supplementary Material 3) were partly derived from measurements and partly calculated based on the chlorophyll, transparency, and photosynthetic coefficient of phytoplankton. Meteorological data, such as the ten-day average sea surface temperature, ten-day average air temperature at 2 m above the sea, relative humidity, and wind speed, were obtained from buoy stations on Beihuangcheng Island and Penglai and provided by the North China Forecast and Disaster Reduction Center of the Ministry of Natural Resources. Information on domestic sewage, COD pollutants, and ammonia nitrogen pollutants in Changdao was sourced from the Yantai Statistical Yearbooks. To assess leisure and recreation values, information on tourist numbers was obtained from the Changdao Management Committee while information on tourist travel expenses and income was gathered through field questionnaire surveys detailed in Supplementary Material 4.
Prices for various aquatic products in Changdao were obtained from wholesale markets (see Supplementary Material 2). The average cost of industrial oxygen production (400 CNY per ton) and afforestation (352.93 CNY per ton) served as the unit costs, with an average of 376.47 CNY per ton (Ouyang et al., 2017). The unit price for carbon sequestration relied on monthly average transaction prices for carbon emission rights on the Shanghai Environmental and Energy Exchange (https://www.cneeex.com/) and fluctuated between 40 and 50 CNY per ton; therefore, an average value of 45 CNY per ton was used. Electricity costs were sourced from the Changdao Power Supply Bureau at 0.55 CNY/kWh. The unit cost for domestic sewage was calculated based on the annual wastewater treatment volume and the operational cost of industrial wastewater treatment facilities. The treatment cost of COD and ammonia nitrogen pollution of 4300 CNY per ton was based on the study by Wu et al. (2008).
4 Results
4.1 Material product value in the Changdao sea area
The aquatic products in the Changdao sea area primarily include fish, shellfish, algae, cephalopods, crustaceans, and other marine delicacies. From 2017 to 2019, the value of aquatic products increased from 3.125 billion CNY to 3.199 billion CNY. During this period, the value of cultured aquatic products increased by 10 million CNY, while harvested aquatic products rose by 19 million CNY, contributing to an overall increase of 29 million CNY in the total value of aquatic products (Table 2).
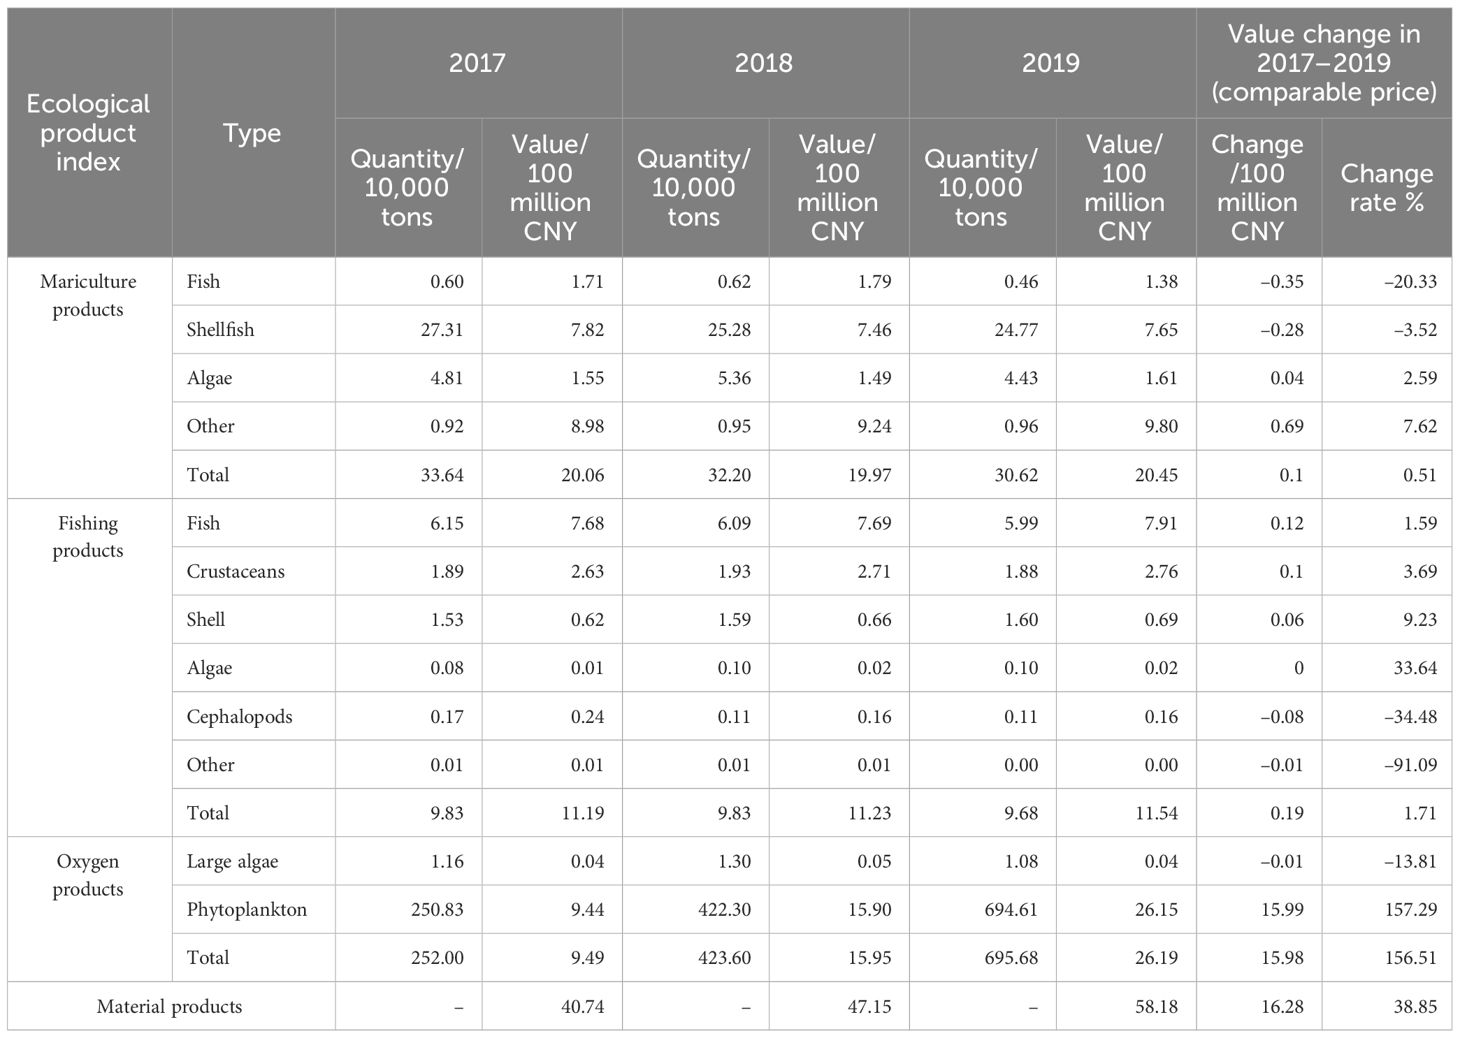
Table 2 Quantity and value of material products in the Changdao sea area from 2017 to 2019.
The oxygen products in the Changdao sea area mainly consist of oxygen generated by phytoplankton and large algae. From 2017 to 2019, the value of oxygen products surged from 0.949 billion CNY to 2.119 billion CNY, with a significant part of these increases attributed to phytoplankton.
In the same period, the value of material products in Changdao increased from 4.074 billion CNY to 5.818 billion CNY, marking a 38.85% increase after adjusting for inflation. Cultured aquatic products and oxygen production value contributed significantly, accounting for 35.14–49.24% and 23.29–45.01%, respectively.
4.2 Regulating product value in the Changdao sea area
Using comparable prices, the value of phytoplankton carbon sequestration in the Changdao sea area increased by 0.267 billion CNY from 2017 to 2019, with minimal changes noted in carbon sequestration for large algae and shell (see Supplementary Material 5). The overall carbon sequestration service value in these sea areas increased by 0.267 billion CNY (Table 3).
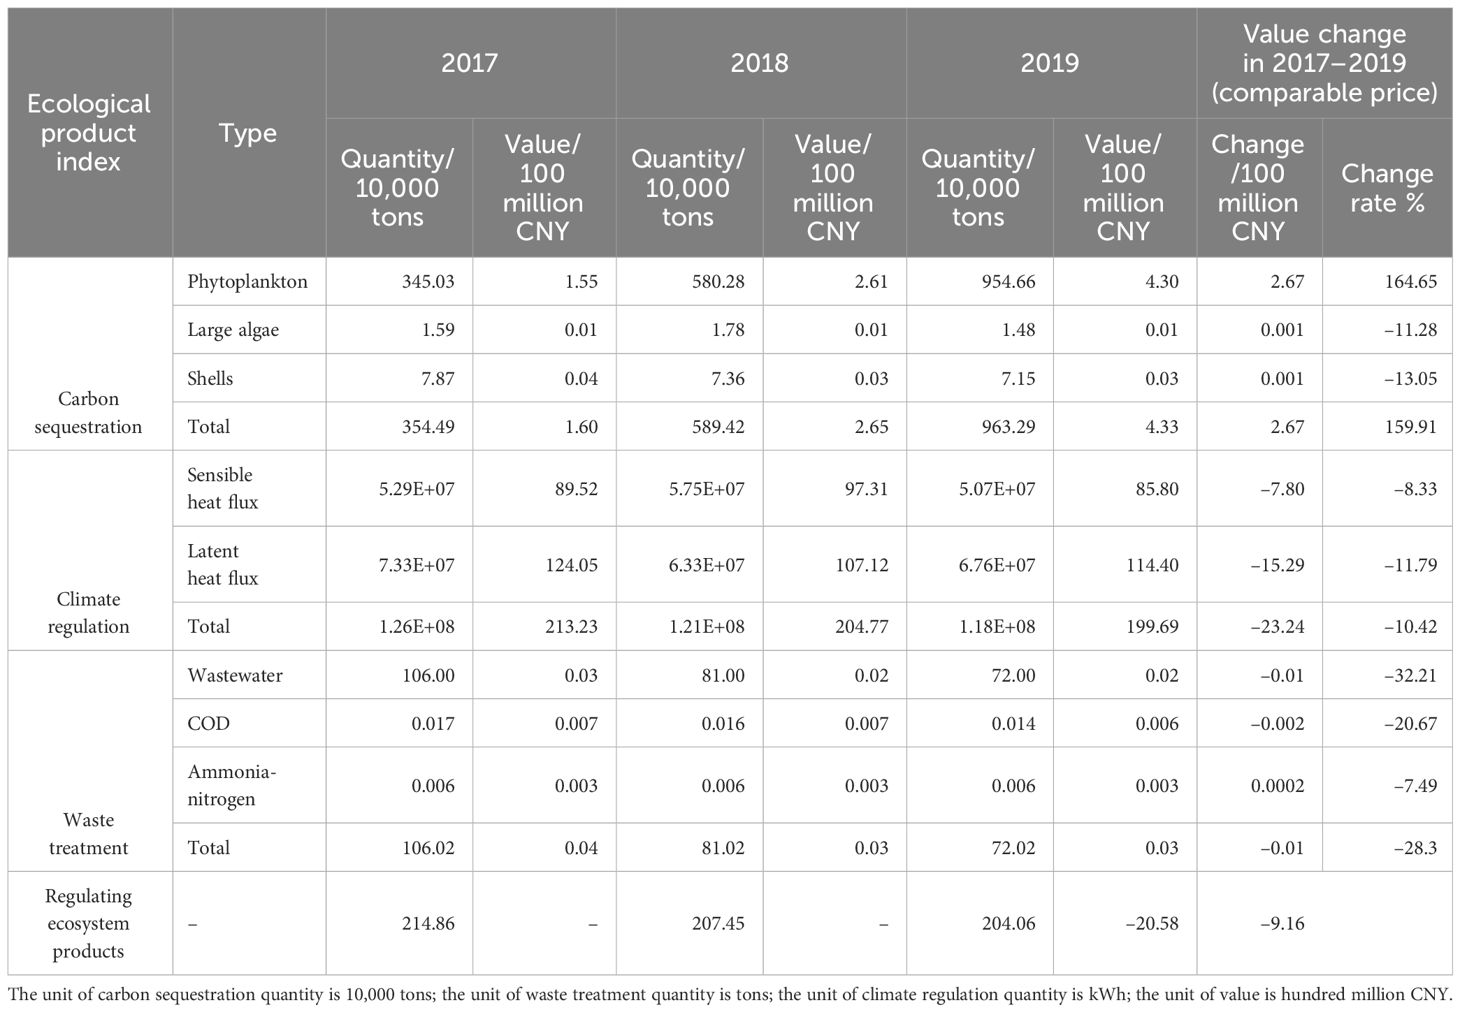
Table 3 Quantity and value of regulating products in the Changdao sea area from 2017 to 2019.
In terms of climate regulation service value in the Changdao sea area, an initial increase followed by a subsequent decrease was observed from 2017 to 2019. After adjusting for inflation, an overall reduction of 2.324 billion CNY was noticed over the three-year period.
During the same period, the amount of wastewater, COD, and ammonia nitrogen processed in these areas decreased from 106.02 tons to 72.02 tons. Consequently, the value of waste treatment decreased from 4 million CNY to 3 million CNY, a reduction of one-fourth.
Furthermore, the overall value of regulating products in the sea areas of Changdao decreased from 21.486 billion CNY to 20.406 billion CNY from 2017 to 2019. After adjusting for inflation, this indicated a decrease of 9.16% in the value of regulation services (Table 3). Notably, over 95% of the regulating product value in these areas comes from climate regulation, while a low proportion stem from carbon sequestration and waste treatment.
4.3 Cultural product value in the Changdao sea area
Cultural products in the Changdao sea area primarily belong to the leisure and recreation category. From 2017 to 2019, the number of visitors to Changdao gradually decreased from 3.85 million to 3.67 million. These visitors were classified into 26 different categories based on the data collected from on-site visitor questionnaires. By employing the zonal travel cost method, the travel expenses for each origin were calculated, leading to the total value of leisure and recreation in Changdao, representing the cultural products’ value. The values of these products over the years 2017 to 2019 were 7.68 billion CNY, 7.13 billion CNY, and 7.129 billion CNY, respectively. After adjusting for inflation, the value of cultural products in Changdao experienced a decline of 15.87% over the three-year period (Table 4).
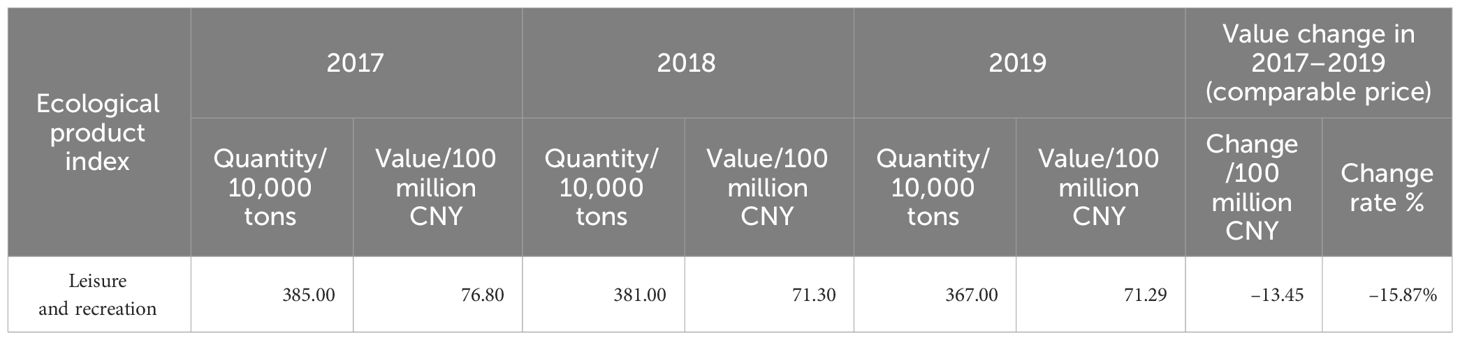
Table 4 Quantity and value of cultural products in the Changdao sea area from 2017 to 2019.
4.4 GEP of the Changdao sea area
From 2017 to 2019, the GEP in the Changdao sea area fluctuated from 33.240 billion CNY to 32.590 billion CNY and then to 33.353 billion CNY (see Table 5). Two-thirds of this total value was accounted for by regulating products. After adjusting for inflation, an overall 5.64% decrease in GEP was noticed over these three years. When categorized, the value of material products increased annually, predominantly due to the increasing value of oxygen production (Table 2). Meanwhile, the values of regulating and cultural products decreased annually, primarily due to the decline in climate regulation services and leisure and recreation services (Tables 3, 4).
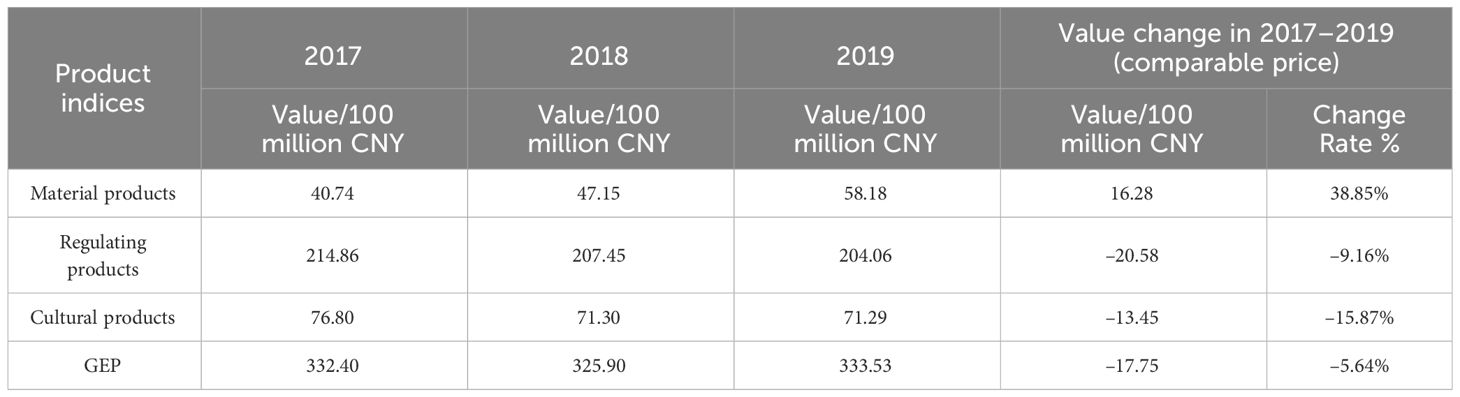
Table 5 Composition and variation of GEP in the Changdao sea area from 2017 to 2019.
4.5 Spatial distribution of ecosystem product values in the Changdao sea areas
The values of Changdao’s cultured aquatic products, oxygen products, carbon sequestration, and leisure and recreation displayed significant differences in spatial distribution. The high-value zones for cultured aquatic products were primarily situated near the northern islands, with mid-value areas near the central islands and low-value zones predominantly surrounding the southern islands (Figure 2A). Figures 2B, C depict the distribution maps for oxygen product value and carbon sequestration value, respectively, calculated using the inverse distance weighting (IDW) spatial interpolation method. Clear spatial value discrepancies were observed, with significantly higher values in the north compared to the south. Figure 2D displays the distribution map of leisure and recreation value, calculated using a 2.5 km buffer zone centered on scenic areas, and the ratio of value within the buffer area to buffer area size. Areas near the central and southern islands of Changdao showcase relatively higher leisure and recreation values, corresponding to the spatial distribution of marine natural scenic areas.
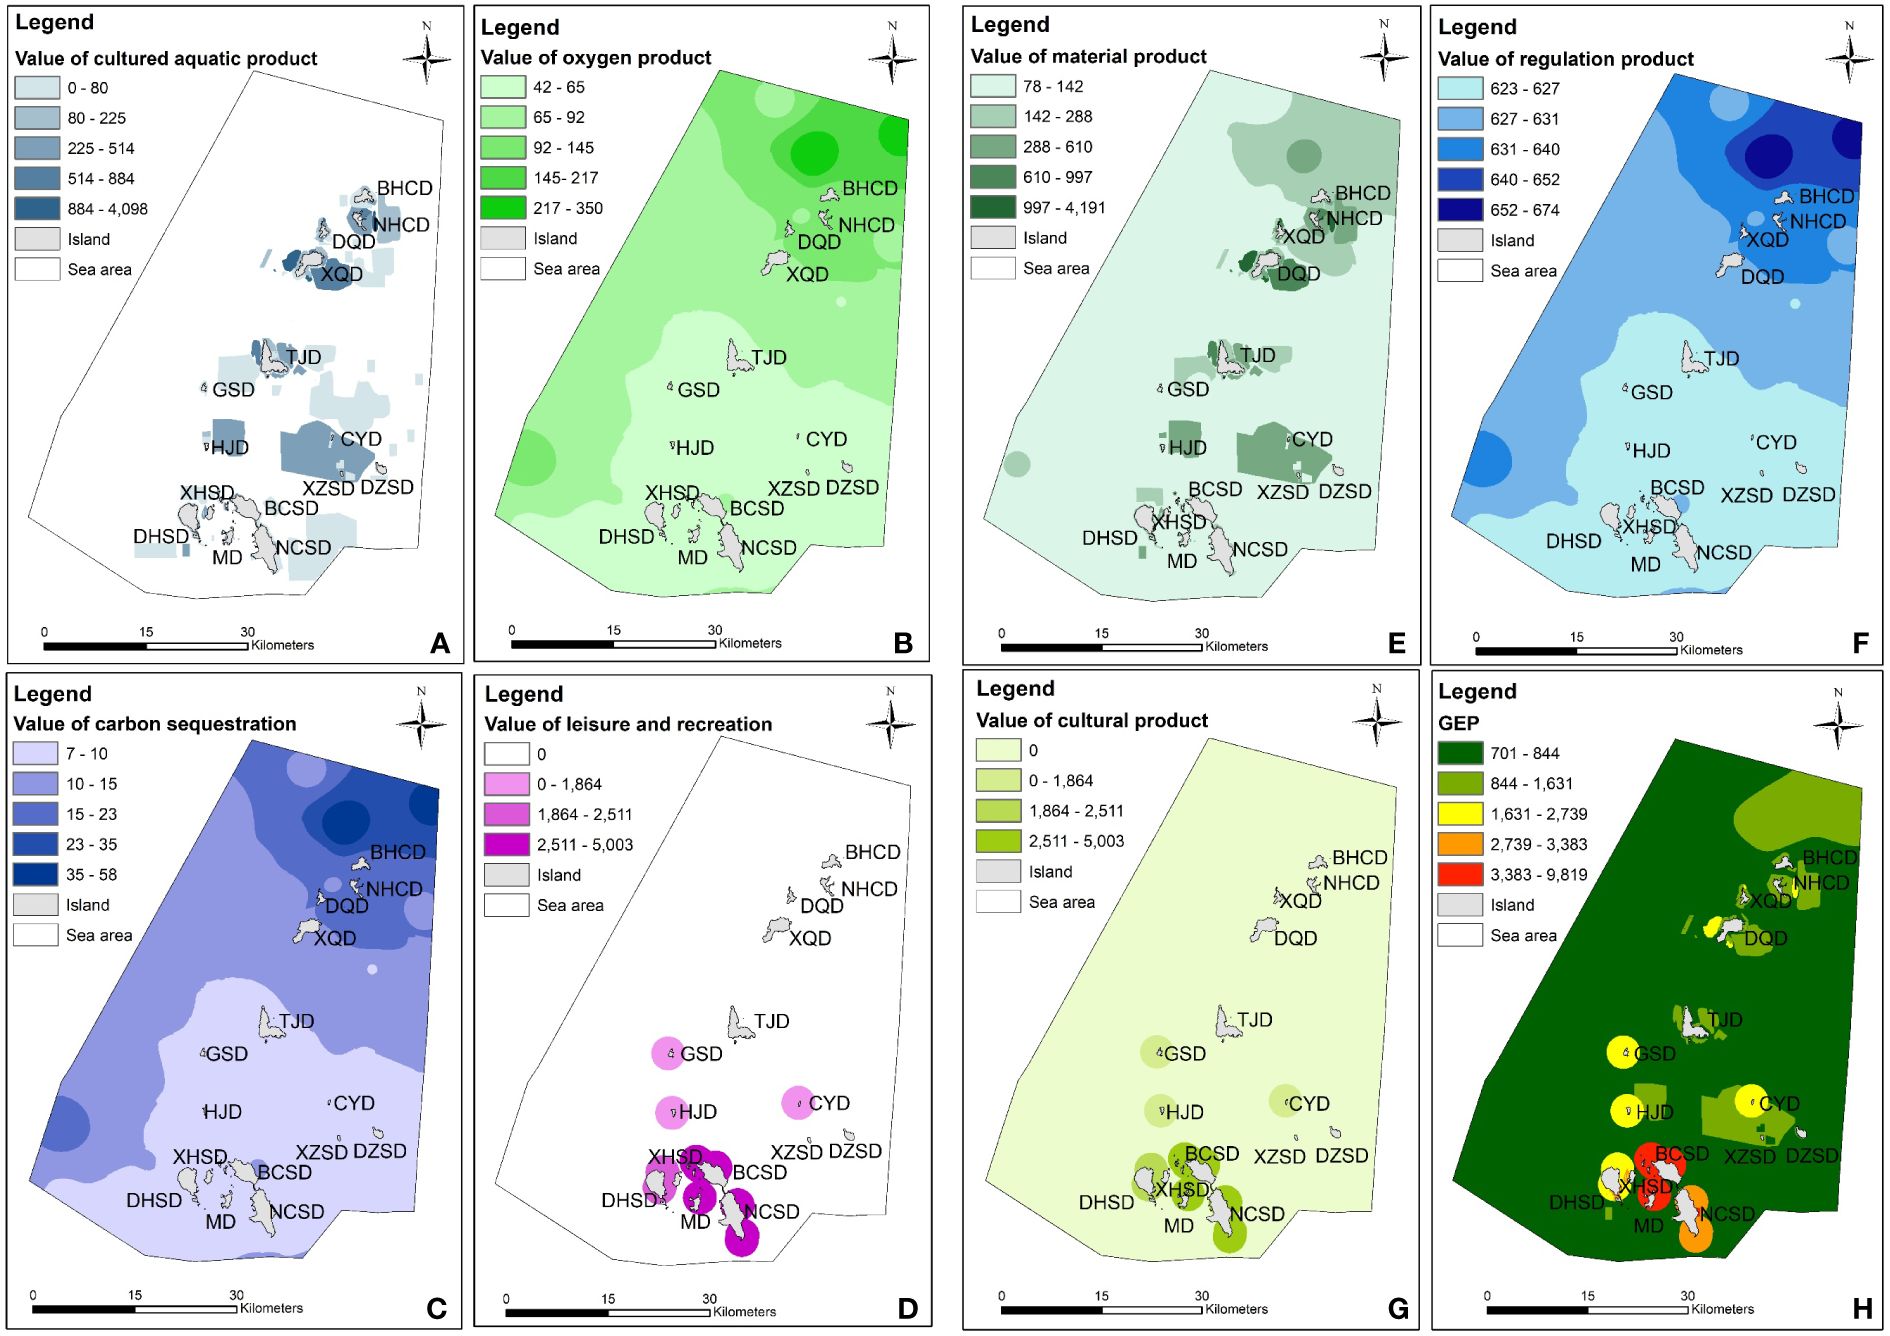
Figure 2 Ecological product value density maps across the Changdao Island sea areas. (A–D): The value of individual ecosystem product measured in 10,000 CNY/km2. (E–H) Material product value, regulating product value, cultural product value, and GEP for the Changdao Islands sea areas, respectively. Note that the value distribution maps are based on data from 2019 and are displayed only for ecosystem products with spatial variations. North Huangcheng Island (BHCD); South Huangcheng Island (NHCD); Xiaoqin Island (XQD); Daqin Island (DQD); Tuoji Island (TJD); Gaoshan Island (GSD); Houji Island (HJD); Cheyou Island (CYD); Xiaozhushan Island (XZSD); Dazhushan Island (DZSD); North Changshan Island (BCSD); South Changshan Island (NCSD); Daheishan Island (DHSD); Xiaoheishan Island (XHSD); Miaodao Island (MD).
Figures 2E–G represent the distribution maps of material product value, regulating product value, and cultural product value (superimposed on spatial distribution maps of each value element). These figures show that high-value zones for material and regulating products are primarily situated near the northern islands, whereas high-value zones for cultural product value are concentrated near the southern islands.
Figure 2H presents the spatial distribution map of GEP in the Changdao sea areas. The GEP of near-shore areas was significantly higher than that of farther offshore areas. The high-value zones were located near Beichangshan Island, Miaodao Island, and Xiaoheishan Island; the mid-value zones were located near Nanchangshan Island, Daheishan Island, Dazhushan Island, Xiaoheishan Island, and Gaoshan Island, which are all uninhabited; and the low-value zones were situated around the peripheral sea areas of the northern islands.
5 Discussion
5.1 Application of the marine GEP evaluation
The current mandate by the Chinese government requires local governments to incorporate ecological benefits into their performance evaluations (Zheng et al., 2023). In China, 672 counties, accounting for 49.4% of the nation, are designated as key ecological function conservation areas in an attempt to sustain the country’s ecosystem services (Ouyang et al., 2016). Within these regions, GEP evaluations serve as a valuable complement to regional GDP evaluations by compensating for the contributions of natural ecology, which are often overlooked in GDP assessments. Approximately 595 million residents in China inhabit coastal regions, and 7.8% of the country’s GDP originating from sea areas (Ministry of Natural Resources of the People’s Republic of China, 2022). Among the 24 monitored nearshore marine ecosystems in China, 17 remain in a sub-healthy state (Ministry of Ecology and Environment of the People’s Republic of China, 2022). Although the pressure for excessive development in coastal waters has not escalated, it persists at high levels. Due to the absence of human habitation at sea and the isolation of marine waters, issues such as resource destruction, seawater pollution, and ecological harm remain concealed. This results in inadequate recognition and insufficient attention to the importance and severity of the damaged outputs of marine ecosystems by humans.
The marine GEP evaluation indices and methods developed in our study provide a comprehensive approach for measuring the contribution of marine ecosystems to human well-being. Moreover, they offer a scientific tool that hopefully will assist local governments facing marine conservation questions, such as “what to protect, where to establish protection, and how to perform protection.” Marine GEP can evaluate the ecological output within marine ecological protection redlines and gauge the sustainability of marine ecosystems. Combining marine and terrestrial GEP can allow the evaluation of integrated land-sea ecological conservation effectiveness in coastal areas. Further, this approach can also enable assessments of the synergy between ecological and production spaces for green development.
Repetitive calculations significantly undermine the credibility of ecosystem service evaluations (Fu et al., 2011). This study establishes a marine GEP evaluation index system that includes three primary indices, namely, material products, regulating products, and cultural products, and eight secondary indices. These evaluation indices account for the value of final ecosystem products in marine ecosystems, including aquatic products, oxygen products, carbon sequestration, waste treatment, climate regulation, coastal protection, leisure and recreation, and seascape-added value. This approach mitigates issues of redundant calculations by including rational index selection and evaluation methods.
During the evaluation process, a crucial aspect involves identifying the ecosystem products present in the assessment area. The accuracy of the results heavily relies on the determination of unit prices. Principles guiding unit price selection include (1) using market pricing for products and services with clear market prices and (2) prioritizing published norms, technical guidelines, and recommended prices for assessments and using the replacement cost method for calculations for products and services lacking clear market prices. Arbitrarily using market prices or cost prices from areas outside the assessment area is not recommended. For example, the market price for aquatic products must be sourced from wholesale market surveys within the assessment area. Similarly, the unit cost for sewage treatment must be derived from the cost set by local sewage treatment companies within the assessment area.
5.2 Changdao as a case study
This study employs the Changdao sea area as a case study for validation. During 2017, 2018, and 2019, the marine GEP in Changdao was 33.240 billion CNY, 32.590 billion CNY, and 33.353 billion CNY, respectively, which were 4.66 times, 4.19 times, and 4.48 times the GDP of the corresponding years. Assessing the marine GEP reveals that these sea areas not only provide essential material products to the local and surrounding regions but also offer significant regulating and cultural products. Therefore, the marine GEP has considerable indirect ecological value in Changdao.
The value of material products in sea areas increased by 38.85%, while the values of regulation and cultural products decreased by 9.16% and 15.87%, respectively. Overall, the marine GEP experienced a slight decline of 5.64%. Notably, the value of the climate regulation service in the Changdao sea area presented the greatest contribution among regulating services, followed by the value of leisure and recreation services, and then the value of aquatic products. These three ecosystem products account for the largest part of Changdao’s GEP. The results of this study affirm the applicability of the proposed evaluation method for marine GEP, and it can similarly be employed to evaluate the GEP of other sea areas.
In addition, the regulating product value accounted for a large proportion (more than 60%) of the total GEP in this study. A number of studies that have evaluated terrestrial GEP revealed that the regulating service value accounted for a large proportion of the terrestrial GEP. For example, Dong et al. (2019) showed that the regulating service value accounted for 58.70% of the GEP in Ordos City, while Pema et al. (2020) showed that the regulating service value accounted for 76.19% of the GEP in Xishui County. Regulating products mainly depends on the stability and health of the ecosystem, and the growth of GDP and the development of economic activities often have an impact on the ecological environment and thus may negatively impact people’s well-being and economic growth. By considering GEP, the impact of economic development on ecosystems can be more fully assessed, and more sustainable development strategies can be developed.
5.3 Shortcomings and prospects
The proposed evaluation indices and methods for marine GEP face certain shortcomings. First, determining natural contributions can be challenging. While natural contributions can be calculated by subtracting the costs of other inputs, such as labor, intermediate, and capital inputs, from the calculated value (Ouyang et al., 2020), the existing data increase the difficulty of separating such contributions from other input costs. For example, the national economic assessment system of China provides information on intermediate inputs, labor, and capital inputs, allowing the estimation of natural value by deducting these costs. However, when calculating the value of leisure and recreation services in Changdao, the lack of data on infrastructure costs led to the assignment of all evaluated values to nature, which likely led to an overestimation of nature’s contribution.
Second, even if natural contributions are clearly identified, precisely estimating certain ecosystem products is difficult due to limitations in data collection or models. For example, incomplete spatial data for some ecosystem products, such as captured aquatic products, makes it difficult to verify if all were from within the sea areas of the Changdao, which may have led to a potential overestimation. Moreover, using sensible and latent heat fluxes for climate regulation estimation depends upon variables such as sea surface temperature, wind speed, air humidity at the sea-air interface, etc., which have greatly improved with sensory technology. However, they require greater sampling frequency and correction of platform motion errors to avoid atmospheric distortions (Weill et al., 2003).
Third, although this study incorporated many ecosystem products into the marine GEP index system, this collection still constitutes an incomplete set of ecosystem products. Our study primarily focused on the direct support of marine ecosystems for human economic and social activities. Nevertheless, some ecosystem products are difficult to monetize, and thus may have been overlooked. For example, the assessment of cultural products only included leisure and recreation and seascape-added value but did not account for other cultural products’ value, such as aesthetic, spiritual, and mental satisfaction values (Zheng et al., 2023). Future studies should focused on establishing methods of evaluating the use value of more final ecosystem products from sea areas.
6 Conclusion
GEP evaluations offer clear and convincing monetary values for ecosystem products. It make the value of marine ecosystem on the table of decision-makers. Although researchers from China have conducted extensive pilot testing and practical exploration regarding GEP, its evaluations and applications are still evolving. However, the GEP evaluations still require improvement, and thus further studies and discussions will be crucial in refining evaluation data and standardizing evaluation methods.
Data availability statement
The original contributions presented in the study are included in the article/Supplementary Material. Further inquiries can be directed to the corresponding author.
Author contributions
WL: Conceptualization, Data curation, Formal analysis, Investigation, Methodology, Software, Validation, Writing – original draft, Writing – review & editing. SH: Data curation, Investigation, Software, Validation, Writing – review & editing. EC: Data curation, Investigation, Formal analysis, Writing – original draft. TX: Software, Supervision, Writing – review & editing. YJ: Formal analysis, Investigation, Writing – review & editing. BT: Resources, Formal analysis, Writing – review & editing. SC: Conceptualization, Funding acquisition, Methodology, Resources, Supervision, Writing – review & editing.
Funding
The author(s) declare financial support was received for the research, authorship, and/or publication of this article. National Key Research and Development Program of China, Grant/Award Number: 2023YFE0113104; 2023YFE0113105; 2022YFF1301800. Natural Science Foundation of Shangdong Province, China. Grant/Award Number: AR2023QD034.
Conflict of interest
The authors declare that the research was conducted in the absence of any commercial or financial relationships that could be construed as a potential conflict of interest.
Publisher’s note
All claims expressed in this article are solely those of the authors and do not necessarily represent those of their affiliated organizations, or those of the publisher, the editors and the reviewers. Any product that may be evaluated in this article, or claim that may be made by its manufacturer, is not guaranteed or endorsed by the publisher.
Supplementary material
The Supplementary Material for this article can be found online at: https://www.frontiersin.org/articles/10.3389/fmars.2024.1356149/full#supplementary-material
References
Beaumont N. J., Jones L., Garbutt A., Hansom J. D., Toberman M. (2014). The value of carbon sequestration and storage in coastal habitats. Estuarine. Coast. Shelf. Sci. 137, 32–40. doi: 10.1016/j.ecss.2013.11.022
Böhnke-Henrichs A., Baulcomb C., Koss R., Hussain S. S., de Groot R. S. (2013). Typology and indicators of ecosystem services for marine spatial planning and management. J. Environ. Manage. 130, 135–145. doi: 10.1016/j.jenvman.2013.08.027
Castaño-Isaza J., Newball R., Roach B., Lau W. W. (2015). Valuing beaches to develop payment for ecosystem services schemes in Colombia’s Seaflower marine protected area. Ecosystem. Serv. 11, 22–31. doi: 10.1016/j.ecoser.2014.10.003
Chen S., Li W. W., Sun X. P., He S., Tang B. P., Wang H. Z., et al. (2022). DB3209/T 1214-2022: Technical specifications for gross ecosystem product accounting. Yancheng Market Supervision Administration. Available at: https://dbba.sacinfo.org.cn/stdDetail/26bd2fe3e18efdcea93bfad46d7d8d2b39b9086d5734dd3a0ac7c0b94723a822.
Chen S., Zhang Z. H., Ma Y., Shi H. H., Ma A. Q., Zheng W., et al. (2006). Program for service evaluation of Marine ecosystems in China Waters. Adv. Earth Sci. 21, 1127–1133. doi: 10.11867/j.issn.1001-8166.2006.11.1127
Chen Y., Ebenstein A., Greenstone M., Li H. (2013). Evidence on the impact of sustained exposure to air pollution on life expectancy from China’s Huai River policy. Proc. Natl. Acad. Sci. 110, 12936–12941. doi: 10.1073/pnas.1300018110
Cheng J. H., L, H. Q., Gao B. H., Huang H., Miao X. W., Wang Y. R., Lin K. (2021). GB 12021.3-2010 The minimum allowable value of the energy efficiency and energy efficiency grades for room air conditioners (Beijing: Chinese Specification Press).
Chu J. T., Chen J. N., Xu L. Y. (2006). Improved calculation of turbulent heat fluxes at air-sea interface in maritime China. Oceanol. Limnol. Sin. 37, 482–487.
Costanza R., d'Arge R., De Groot R., Farber S., Grasso M., Hannon B., et al. (1997). The value of the world's ecosystem services and natural capital. nature 387, 253–260. doi: 10.1038/387253a0
Daily G. C., Polasky S., Goldstein J., Kareiva P. M., Mooney H. A., Pejchar L., et al. (2009). Ecosystem services in decision making: time to deliver. Front. Ecol. Environ. 7, 21–28. doi: 10.1890/080025
Dong T., Zhang L., Xiao Y., Zheng H., Huang B. B., Ouyang Z. Y. (2019). Assessment of ecological assets and gross ecosystem product value in Ordos City. Acta Ecol. Sin. 39, 3062–3074. doi: 10.5846/stxb201911012305
Fu B. J., Su C. H., Wei Y. P., Willett l.-R. (2011). Double counting in ecosystem services valuation: causes and countermeasures. Ecol. Res. 26, 1–14. doi: 10.1007/s11284-010-0766-3
Geng J., Ren B. N. (2020). Application of the gross ecosystem product accounting theory on rural ecological civilization assessment in Hainan Province: A case study of Wenmen Village in Sanya. Acta Ecol. Sin. 40, 3236–3246. doi: 10.5846/stxb201902210314
Hao L. H., He S., Chen S., Zhao D. B., Hu D. J. (2020). Evaluation method and application on regulating service value in marine ecosystem: Wenzhou city’s practice. Acra. Ecol. Sin. 40, 4264–4278. doi: 10.5846/stxb201911012305
Hattam C. E., Mangi S. C., Gall S. C., Rodwell L. D. (2014). Social impacts of a temperate fisheries closure: understanding stakeholders' views. Mar. Policy 45, 269–278. doi: 10.1016/j.marpol.2013.09.005
He S., Xia T., Luo M., Li W., Zhang J., Li Y., et al. (2023). Vacancy analysis and layout optimization of Changdao natural protected area from the perspective of multi-objective collaboration. Front. Ecol. Evol. 11, 1265428. doi: 10.3389/fevo.2023.1265428
Jiang H., Wu W., Wang J., Yang W., Gao Y., Duan Y., et al. (2021). Maping global value of terrestrial ecosystem services by countries. Ecosystem. Serv. 52, 101361. doi: 10.1016/j.ecoser.2021.101361
Liu J., Viña A., Yang W., Li S., Xu W., Zheng H. (2018). China's environment on a metacoupled planet. Annu. Rev. Environ. Resour. 43, 1–34. doi: 10.1146/annurev-environ-102017-030040
Luo J. X., Gao Z. G., Liu K. X., Song X. Z., Wu S. Q., Fan Z. H. (2018). Evaluation of ear-interim and merra sensible heat flux and latent heat flux along coast of China. Adv. Meteorol. Sci. Technol. 8, 6–14. doi: 10.3969/j.issn.2095-1973.2018.04.001
Ma G., Peng F., Yang W., Yan G., Gao S., Zhou X., et al. (2020a). The valuation of China’s environmental degradation from 2004 to 2017. Environ. Sci. Ecotechnol. 1, 100016. doi: 10.1016/j.ese.2020.100016
Ma G., Wang J., Yu F., Yang W., Ning J., Peng F., et al. (2020b). Framework construction and application of China's Gross Economic-Ecological Product accounting. J. Environ. Manage. 264, 109852. doi: 10.1016/j.jenvman.2019.109852
Ma G. X., Yu F., Wang J. N., Zhou X. F., Yuan J., Mou X. J., et al. (2017). Measuring gross ecosystem product (GEP) of 2015 for terrestrial ecosystems in China. China Environ. Sci. 37, 1474–1482.
MA (Millenium Ecogystem Assessment Panel) (2005). Ecosystems and Human Well-Being: Synthesis (Washington, DC: Island Press).
Ministry of Natural Resources of the People’s Republic of China. (2022). China's Statistical Bulletin on Marine Economy. Available at: http://gi.mnr.gov.cn/202304/t20230413_2781419.html
Ministry of Ecology and Environment of the People’s Republic of China. (2022). China’s Bulletin on the state of Marine ecological environment. Available at: https://www.mee.gov.cn/hjzl/sthjzk/jagb/
Ouyang Z. Y., Jin L. S., Zhen L., Xu L. Y., Ge C. Z., Zhang Y. X., et al. (2017). Developing gross ecosystem product and ecological asset accounting for eco-compensation (Beijing: science press).
Ouyang Z. Y., Song C. S., Zheng H., Polasky S., Xiao Y., Bateman I. J., et al. (2020). Using gross ecosystem product (GEP) to value nature in decision making. Proc. Natl. Acad. Sci. 117, 201911439. doi: 10.1073/pnas.1911439117
Ouyang Z., Zheng H., Xiao Y., Polasky S., Liu J., Xu W., et al. (2016). Improvements in ecosystem services from investments in natural capital. Science 352, 1455–1459. doi: 10.1126/science.aaf2295
Ouyang Z. Y., Zhu C. Q., Yang G. B., Xu W. H., Zheng H., Zhang Y., et al. (2013). Gross ecosystem product: concept, accounting framework and case study. Acta Ecol. Sin. 33, 6747–6761. doi: 10.5846/stxb201310092428
Pema D., Xiao Y., Ouyang Z. Y., Wang Y. L. (2017). Gross ecosystem product accounting for the Garze Tibetan Autonomous Prefecture. Acta Ecol. Sin. 37, 6302–6312. doi: 10.5846/stxb201310092428
Pema D., Xiao Y., Ouyang Z. Y., Wang Y. L. (2020). Assessment of ecological conservation effect in Xishui county based on gross ecosystem product. Acta Ecol. Sin. 40, 499–509. doi: 10.5846/stxb201812202767
Wang M., Chen S., Xia T., Du G. Y. M., Wang W., Zhang T. (2011). Valuation of ecological capital in Shandong coastal waters: provisioning service value. Acta Ecol. Sin. 31, 5561–5570.
Wang Y. L., Xiao Y., Ouyang Z. Y., Wei Q., Bo W. J., Zhang J., et al. (2017). Gross ecosystem product accounting in the national key ecological function area. China Population. Resour. Environ. 27, 146–154. doi: 10.3969/j.issn.1002-2104.2017.03.018
Weill A., Eymard L., Caniaux G., Hauser D., Planton S., Dupuis H., et al. (2003). Toward a better determination of turbulent air–sea fluxes from several experiments. J. Climate 16, 600–618. doi: 10.1175/1520-0442(2003)016<0600:TABDOT>2.0.CO;2
Wu S. S., Liu R. Z., Qi L. M., Liang X. B. (2008). Value assessment of marine ecosystem service in Bohai sea. China Population. Resour. Environ. 18, 65–69.
Xiao Y., Chen S., Cao Z. Q., Xia T., Hao L. H. (2016). Using the contingent valuation method to assess the value of ecosystem diversity maintenance of Shangdong’s marine protected areas. Acta Ecol. Sin. 36, 3321–3328. doi: 10.5846/stxb201507071443
Yan J. Y. (1999). Estimation and analysis for air-sea fluxes of heat and moisture over the neighbouring seas of China. Q. J. Appl. Meteorol. 10, 9–19.
Yang M., Xiao Y., Ouyang Z. Y., Ye H., Deng M. T., Ai L. (2019). Ecosystem regulation services accounting of gross ecosystem product (GEP) in Sichuan province. J. Southwest. Minzu. Univ. (Natural. Sci. Edition). 45, 221–232. doi: 10.11920/xnmdzk.2019.03.001
Zhang J. H., Liu Y., Zhang Y., Sun K., Wu W. G., Lin F., et al. (2021). HY/T0305-2021: Estimation method of maricultural seaweed and bivalve carbon sink—Carbon stock variation method (Beijing: Chinese Specification Press).
Zheng H., Wang L., Peng W., Zhang C., Daily G. C. (2019). Realizing the values of natural capital for inclusive, sustainable development: informing China's new ecological development strategy. Proc. Natl. Acad. Sci. 116, 8623–8628. doi: 10.1073/pnas.1819501116
Keywords: Sea areas, gross ecosystem product, ecosystems, sustainability, Changdao
Citation: Li W, He S, Chen E, Xia T, Jin Y, Tang B and Chen S (2024) Indices and methods for evaluating gross ecosystem product in sea areas: a case study in Changdao County, China. Front. Mar. Sci. 11:1356149. doi: 10.3389/fmars.2024.1356149
Received: 15 December 2023; Accepted: 18 March 2024;
Published: 04 April 2024.
Edited by:
Yanli Lei, Chinese Academy of Sciences (CAS), ChinaReviewed by:
Nitin Agarwala, National Maritime Foundation, IndiaYen-Chiang Chang, Dalian Maritime University, China
Copyright © 2024 Li, He, Chen, Xia, Jin, Tang and Chen. This is an open-access article distributed under the terms of the Creative Commons Attribution License (CC BY). The use, distribution or reproduction in other forums is permitted, provided the original author(s) and the copyright owner(s) are credited and that the original publication in this journal is cited, in accordance with accepted academic practice. No use, distribution or reproduction is permitted which does not comply with these terms.
*Correspondence: Shang Chen, schen@fio.org.cn