Germplasm evaluation and identification of the population source of hard clam (Mercenaria mercenaria) in China using SSR and COI markers
 JunYi Wang1,2,3,4,5,6
  DongXiu Xue2,3,4,5,6
  MeiJie Yang2,3,4,5,6 YunLong Ji7 Hao Song2,3,4,5,6 Cong Zhou2,3,4,5,6,8
  Pu Shi2,3,4,5,6,8
  YongRen Li9
  YongJun Guo9 FanYu Meng10
  ChangPing Lai11
  ShunFeng Cheng1*
  Tao Zhang2,3,4,5,6*
- 1College of Life Sciences, Key Laboratory of Animal Reproduction and Biotechnology in Universities of Shandong, Qingdao Agricultural University, Qingdao, China
- 2Chinese Academy of Sciences (CAS) Key Laboratory of Marine Ecology and Environmental Sciences, Institute of Oceanology, Chinese Academy of Sciences, Qingdao, China
- 3CAS Engineering Laboratory for Marine Ranching, Institute of Oceanology, Chinese Academy of Sciences, Qingdao, China
- 4Laboratory for Marine Ecology and Environmental Science, Qingdao National Laboratory for Marine Science and Technology, Qingdao, China
- 5Center for Ocean Mega-Science, Chinese Academy of Sciences, Qingdao, China
- 6Key Laboratory of Experimental Marine Biology, Qingdao, Shandong, China
- 7Shandong Fisheries Development and Resources Conservation Center, Yantai, China
- 8University of Chinese Academy of Sciences, Beijing, China
- 9Tianjin Key Laboratory of Aqua-ecology and Aquaculture, Fisheries College, TianjinAgricultural University, Tianjin, China
- 10Bureau of Agriculture, Rural and Social Affairs, Lianyungang, China
- 11Lianyungang Blue Carbon Marine Technology Co., Ltd, Lianyungang, China
In aquaculture, good germplasm resources are nearly decisive for its development. The hard clam (Mercenaria mercenaria), a significant marine aquaculture bivalve in China, has flourished quickly since being introduced from North America in 1997. However, for numerous reasons, it has suffered from germplasm deterioration and uncertain origins. To address these issues, seven microsatellite DNA loci (SSRs) and mtCOI were employed to evaluate germplasm and trace the origins of various Chinese populations. The results of these two molecular genetic markers revealed weak genetic differentiation among all Chinese populations, with high genetic diversity observed across most individuals, except for a few outliers. This suggests an alarming situation regarding germplasm resources in China. Based on results of traceability analysis, the most likely areas of origin for the Chinese populations are Chesapeake Bay and the southern region of Cape Hatteras. This study provides a crucial theoretical foundation for the cultivation, conservation, and subsequent introduction of hard clam populations in China, thereby ensuring the sustainable growth of the hard clam breeding sector.
1 Introduction
In aquaculture, people often introduce exceptional germplasm from diverse geographic regions to enhance the diversity of local bivalve species such as Argopecten irradians (Zhan et al., 2005; Wang et al., 2007) and Crassostrea gigas (Ward et al., 2000; Meistertzheim et al., 2013; Rohfritsch et al., 2013) are frequently introduced to enrich the variety of bivalve species in specific areas. With human intervention, these species can rapidly multiply, leading to the establishment of large local populations (Song et al., 2006; Wang et al., 2007). However, beneath this prosperity lies a serious crisis. High-quality germplasm resources are crucial for genetic improvement, where genetic diversity and structure play vital roles in the efficient development of aquaculture (Huang et al., 2002; Thomson et al., 2007). Genetic variation is a key factor that influences differences in genetic diversity and structure among individuals and populations (Ramanatha Rao and Hodgkin, 2002; Traulsen and Sieber, 2021). Inbreeding can lead to a reduction in genetic diversity within individuals, impacting the overall germplasm diversity and resulting in its deterioration (Allendorf and Phelps, 1980; Keller and Waller, 2002), as well as reducing genetic divergence between individuals and populations.Regrettably, introduced species often encounter the described issues, leading to the degradation of their germplasm at the genetic level over time (Wang et al., 2007). This underscores the importance of carefully managing and conserving germplasm resources to ensure the long-term sustainability and success of aquaculture practices.
Since its introduction in 1997, the hard clam (Mercenaria mercenaria), a Veneroida clam species widely dispersed along the east coast of North America (Harte, 2001), has rapidly flourished and become a significant marine aquaculture bivalve species along the Chinese coast (Hu et al., 2019). However, the introduction of hard clams from the east coast of North America has resulted in all current individuals in China being descended from a limited number of parents in controlled environments through extensive mixed breeding, multi-generational breeding, and inbreeding. This situation raises concerns about germplasm degradation and the lack of information regarding the genetic structure of the population. Moreover, uncertainties surrounding the population’s origin have arisen due to the loss of original introduction data and the extensive mixed breeding that has occurred. These factors pose significant challenges to the growth of aquaculture practices. To address these obstacles, we have initiated a comprehensive evaluation of germplasm and an investigation into the origins of Chinese hard clam populations. By conducting these studies, we aim to gain valuable information that will aid in the conservation and sustainable development of hard clam aquaculture in China.
Genetic diversity and genetic structure play pivotal roles in population genetic analyses (Ellis and Burke, 2007) and are essential components when assessing germplasm resources of various species. These aspects are crucial for evaluating genetic variation across populations and tracing the origins of species (Tsutsui et al., 2001; Geleta et al., 2006; Kolbe et al., 2007; Merceron et al., 2017; Islam et al., 2018; Slim et al., 2019; Zombardo et al., 2021; Kumar et al., 2022; Khan et al., 2023). Researchers leverage these insights to develop comprehensive conservation strategies tailored to safeguard and explore high-quality germplasm resources (Crozier, 2000; Pertoldi et al., 2007). Nevertheless, a research gap persists in the study of the genetic diversity and genetic structure of hard clams in China, hindering further detailed investigations. Therefore, it is imperative to conduct thorough genetic evaluations of the species to fill this knowledge void. By addressing this crucial step, researchers can set the stage for subsequent in-depth studies that will pave the way for effective conservation planning and sustainable management practices for hard clam populations in China.
Due to their high polymorphism, co-dominance, and other advantageous characteristics, microsatellite loci (SSRs) are commonly used as molecular genetic markers in population genetic analyses (Kapoor et al., 2020). SSRs play a crucial role in genetic evaluations across various bivalve species, such as Ruditapes philippinarum (Tan et al., 2020; Zheng et al., 2023), Crassostrea gigas (Kochmann et al., 2012; Lallias et al., 2015; Angles d'Auriac et al., 2017; Liang et al., 2023), Argopecten irradians (Campanella et al., 2007; Hemond and Wilbur, 2011), Meretrix meretrix (Gu et al., 2015; Ye et al., 2020), Meretrix petechialis (Xu et al., 2020), among others. In addition, the mitochondrial DNA Cytochrome c Oxidase subunit I (COI) gene, which encodes a protein in mtDNA (Liu and Zhou, 2017), is extensively utilized as a molecular genetic marker in the genetic analysis of bivalve species (Stoeckle et al., 2017; Zheng et al., 2019; Feng et al., 2020; Yi et al., 2021). By employing multiple molecular markers, including mtDNA COI, Single Nucleotide Polymorphisms (SNPs), and SSRs, researchers have investigated the population genetic structure of hard clams from North America and Tokyo Bay, Japan. These studies have provided valuable insights into the genetic diversity and structure of hard clam populations, enhancing our understanding of their evolutionary history and aiding in conservation efforts.
Given the considerations outlined, we have chosen to utilize two molecular genetic markers—SSRs and mtCOI to conduct a comprehensive genetic assessment of diverse hard clam populations in both China and North America. This study serves as a fundamental undertaking for evaluating germplasm and tracing origins. The primary objectives of this research are threefold: (1) assess whether the germplasm of Chinese hard clam populations has undergone any degradation; (2) identify genetic distinctions among the various Chinese populations; (3) elucidate the ancestral backgrounds of these populations. The overarching aim of this study is to ensure the sustained advancement of China’s aquaculture industry by providing crucial insights and a solid scientific basis for conserving genetic resources within these populations. By achieving these goals, we anticipate contributing significantly to the long-term viability and growth of aquaculture practices in China while fostering the preservation of valuable genetic diversity of hard clam populations.
2 Materials and methods
2.1 Sample collection
A total of nine locations across China, comprising Panjin (PJ), Tianjin (TJ), Tangshan (TS), Lianyungang (LYG), Yancheng (YC), Zhoushan (ZS), Putian (PT), Zhangzhou (ZZ), and Zhanjiang (ZJ), as well as three locations along the east coast of North America, including Commonwealth of Virginia (VI), Lange Eylandt (LE), and Rhode Island (RL), were sampled during the period from July 2022 to March 2023 (Figure 1, Table 1). Upon collection, dissected samples had their adductor muscles removed and were subsequently preserved at -80°C. Meanwhile, live samples were carefully shipped back to the laboratory under controlled conditions using dry ice.
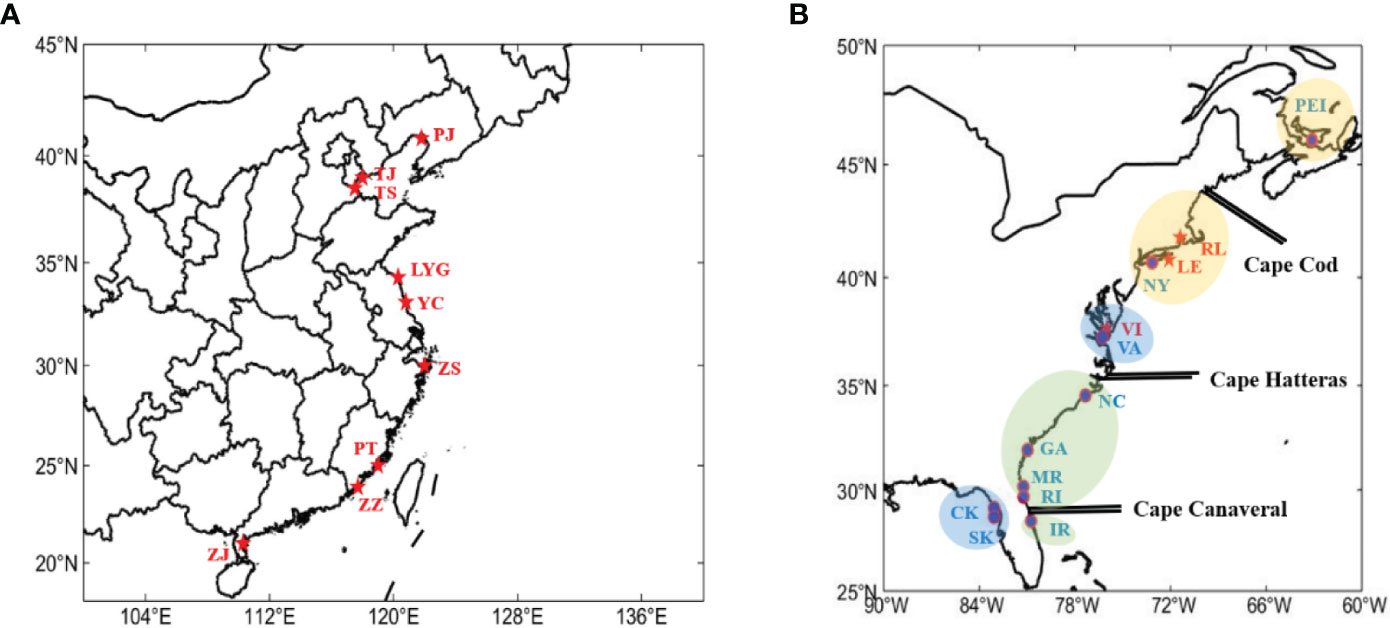
Figure 1 Sampling sites. The red names and asterisks are populations that we collected, the blue names and labels are populations involved in the previous study (Baker et al., 2008). (A) Collection sites in China. (B) Collection sites in North America.
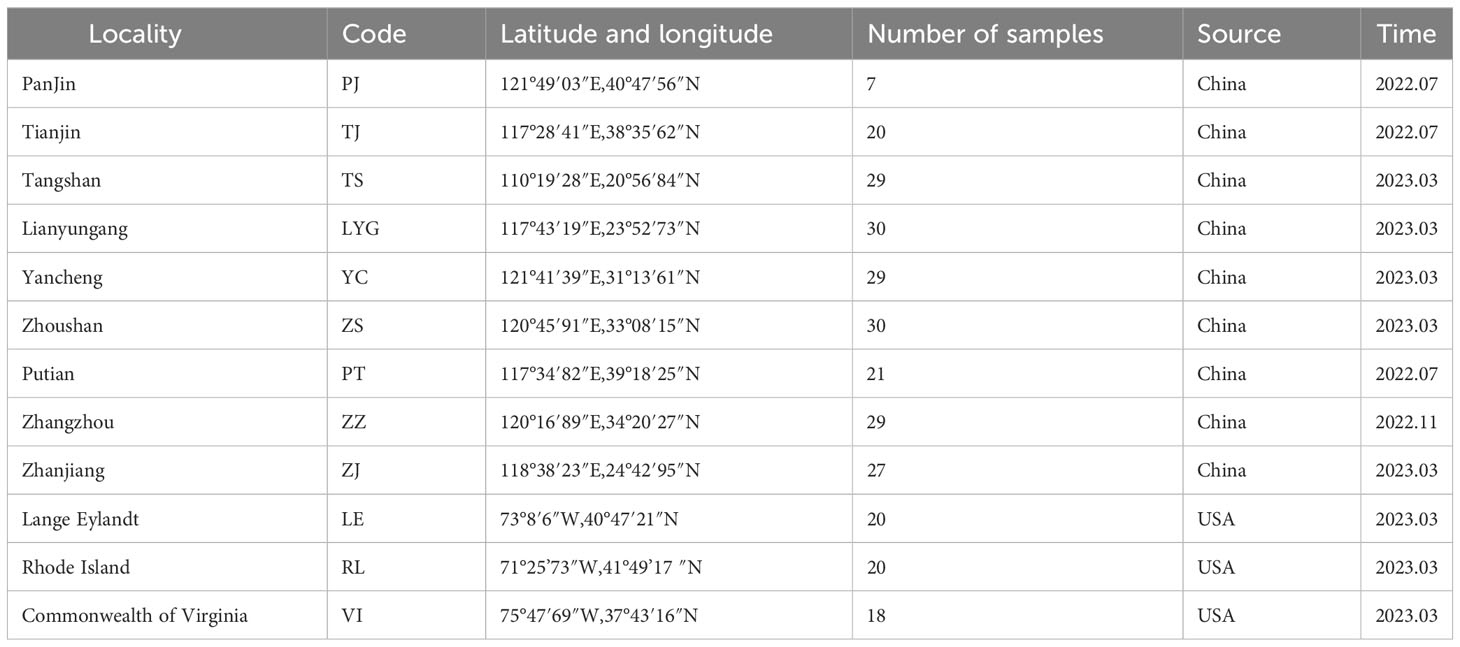
Table 1 Sampling sites’ information.
All procedures involved in the animal collection, rearing and dissection were conducted following the Guideline of Ethical Regulations of Animal Welfare of the Institute of Oceanology, Chinese Academy of Sciences (IOCAS 2013.3). Our study protocols were approved by the Animal Welfare Committee of the IOCAS.
2.2 DNA extraction, amplification, and sequencing of PCR products
The SteadyPure Universal Genomic DNA Extraction Kit (Accurate Biotechnology (Hunan) Co.,Ltd., ChangSha, China) is used to extract total DNA from adductor muscles. 2X Pro Taq Master Mix Ver. 2 (Accurate Biotechnology (Hunan) Co., Ltd., ChangSha, China) is the reagent used for amplification. Reaction system involves combining 25 μl of 2X Accurate Taq Master Mix, 15 μl of template DNA and RNase-free water, 1 μl of forward primer, and 1 μl of reverse primer. Reaction conditions are as follows: Predenaturation at 95°C for 15 minutes, Denaturation at 94°C for 30 seconds, Annealing for 1 minute and 30 seconds, Extension at 72°C for 1 minute and 30 seconds (a total of 35 cycles), Final extension at 72°C for 10 minutes.
The mtCOI primers, originally designed by Baker et al. (2008), have the following sequences: Forward primer - 5’ TTTTCTATTTGGCAGGTCT 3’ and Reverse primer - 5’ CCTAACCCCTACAGGATCAAAA 3’ (Table 2). After annealing at 48°C, a 528-bp fragment was successfully amplified for further analysis. Subsequently, the PCR products were sent to Tsingke Biotechnology Co., Ltd. for sequencing using the dideoxy chain-termination method with ABI 3730xl sequencers.
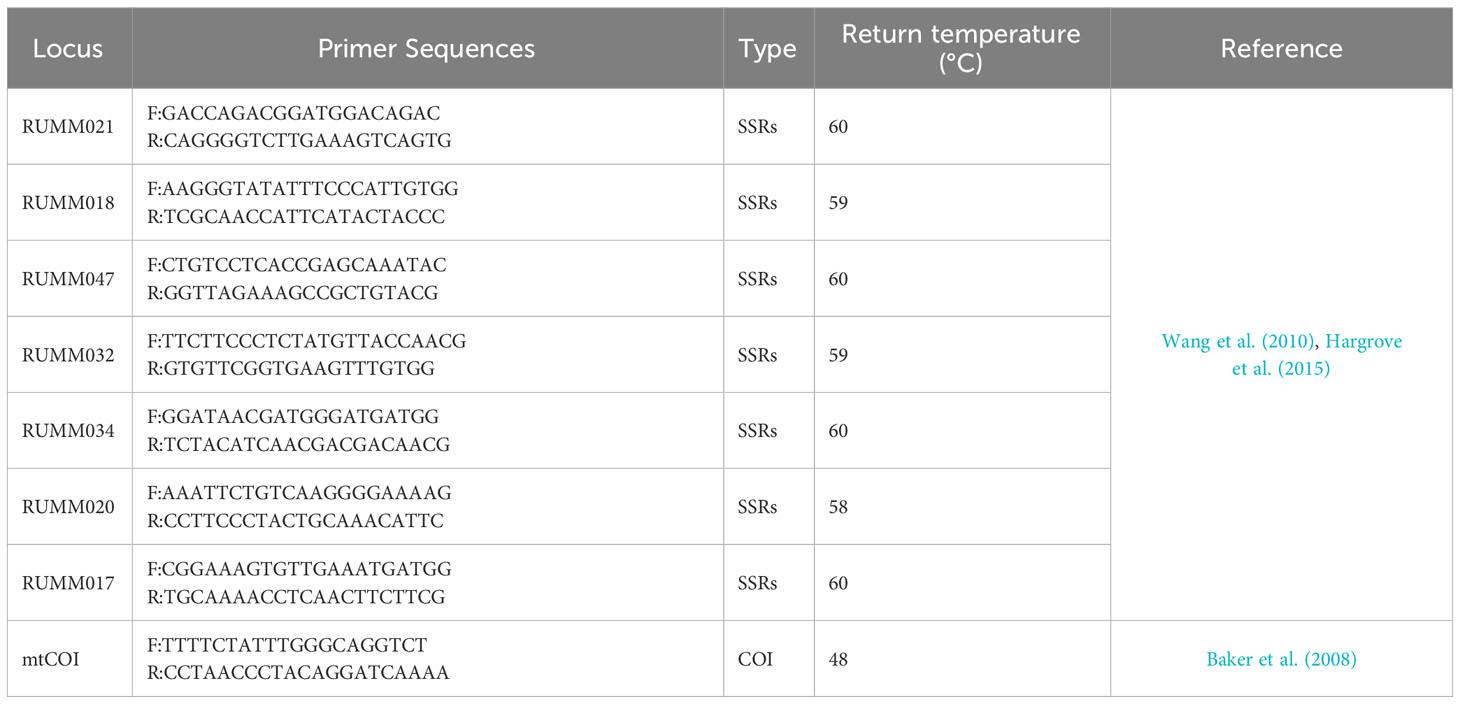
Table 2 Primers’ information.
The SSRs primers, including RUMM17, RUMM18, RUMM20, RUMM21, RUMM32, RUMM34, and RUMM47 (Table 2), were designed by Wang et al. (2010). All forward primers were tagged with a cac sequence tag (5’- cacgacgttgtaaaacgac -3’) and had 6-carboxyfluorescein (FAM) attached to the 5’ end for identification purposes. Following primer selection, the PCR products were sent to Tsingke Biotechnology Co., Ltd. for analysis. Electrophoresis was conducted using a 3730xl DNA analyzer to visualize and assess the amplified fragments. Specific microsatellites were chosen based on the known characteristics such as size range and repeating motifs of a single microsatellite region, as detailed in the study by Wang et al. (2010).
2.3 Microsatellite analysis
The raw data obtained was processed and summarized based on size ranges and repeat base sequences. Various genetic diversity parameters like the number of alleles (Na), effective number of alleles (Ae), observed heterozygosity (HO), expected heterozygosity (He), and others were calculated by GenAlex 6.51b2 (Peakall and Smouse, 2012). The polymorphic information content (PIC) for each locus was determined by powdermarker 3.52 (Liu and Muse, 2005) Subsequently, UPGMA dendrograms were generated by calculating pairwise Nei’s genetic distances between different populations. The confidence level of these dendrograms was assessed with 1000 bootstrap replications. The output files (.nwk) generated from these analyses were further beautified by online tool iTQL (Letunic and Bork, 2021). Arlequin 3.5 (Excoffier and Lischer, 2010) was employed to compute the FST values (Weir and Cockerham, 1984) between all populations. Significance testing of FST values was carried out with 1000 permutations and corrected by Bonferroni procedure (Rice, 1989). For determining the ideal population size (K), STURCTURE 2.3.4 (Pritchard et al., 2000) was utilized. Individuals were assigned to clusters through Bayesian model-based clustering methods. The likelihood test LnP(K) was run for K ranging from 1 to 12, with 15 replicates for each K value. Parameters like burn-in period length and MCMC reps were set accordingly, following which mean LnP(K) and Delta K values were calculated by STURCTURE HARVESTE (Earl and vonHoldt, 2011) based on the approach established by Evanno et al. (2005) to determine the optimal K value.
2.4 mtCOI analysis
The North American haplotype sequences from Baker et al. (2008) were obtained from Genbank (GeneBank accession numbers: EU360354–EU360438), including Charlottetown(PEI), Patchogue Bay(NY), Mobjack Bay(VA), New River(NC), Wassaw Sound(GA), Matanzas River(MR), Rattlesnake Isl(RI), Indian River(IR), Cedar Key(CK) and Seahorse Key(SK)and all sequences were co-trimmed using Bioedit 7.2.6.1 (Hall, 1999) and subjected to sequence comparison using CLUSTAL W. DNAsp6 (Rozas et al., 2017) was used to calculate genetic diversity parameters such as the number of haplotypes (H), the number of polymorphic sites (S), the haplotype diversity (Hd), the mean number of nucleotide differences (k), the number of nucleotide polymorphisms (Pi). MEGA11 (Tamura et al., 2021), in which the statistical method of nodal reliability is the Bootstrap method with 1000 repetitions of the test and the substitution type is Kimura two-parameter distance matrix (Kimura, 1980; Nei et al., 1998), was used to calculate the pairwise Nei’s genetic distances between various populations, which was used for building the unrooted population tree by Phylip’s (Felsenstein, 1993) Subprogram Fitch and then was beatified by online program iTQL (Letunic and Bork, 2021). To analyze the genealogical relationships among haplotypes, haplotype networks were built using Arlequin 3.5 (Excoffier and Lischer, 2010) and Popart 1.7 (Leigh et al., 2015). All haplotypes were annotated, with previously uploaded haplotype sequences using the original serial numbers for annotation and newly discovered haplotype occurrences using Roman numerals. The components of variance between populations, between individuals, and within individuals were estimated using Molecular Variance Scores (AMOVA) on the Chinese and North American populations using Arlequin 3.5 (Excoffier and Lischer, 2010). The FST (Weir and Cockerham, 1984) between all groups was also calculated by this software, the significance of the FST was tested using 1000 permutations and corrected with the Bonferroni procedure (Rice, 1989). According to the geographic isolation of east coast of the North America (Engle and Summers, 1999; Baker et al., 2008; Ropp et al., 2023), we categorized the 12 North American populations into 6 groups: Group 1 for PEI, Group 2 for NY-RL (NY, LE, and RL), Group 3 for VI and VA, Group 4 for NC-RI (NC, GA, MR, and RI), Group 5 for IR, and Group 6 for CK and SK.
3 Results
3.1 Genetic diversity
3.1.1 Genetic diversity based on SSRs
The seven SSRs loci utilized in this study exhibited a substantial degree of polymorphism. The highest polymorphic information content (PIC) was observed at RUMM18 (0.9417), while the lowest was noted at RUMM20 (0.5648), with a mean PIC value of 0.7475 (Table S1). This diversity indicated that all loci could be effectively employed for further investigations. Further examination revealed that RUMM018 possessed the highest number of alleles (Na), followed by RUMM032 and RUMM034, whereas RUMM020 had the lowest Na across various populations and loci (Supplementary Table S2). These findings align with the PIC results obtained.
PJ was excluded from the comparison due to low values resulting from a small sample size. Excluding PJ, the allele number (Na) in Chinese populations ranged from 8.571 to 11.429, while effective number of alleles (Ae) varied between 4.338 and 5.386, Shannon’s Index(I) ranged from1.596 to 1.800, Observed heterozygosity (HO) ranged from 0.465 to 0.545, and expected heterozygosity (He) ranged from 0.693 to 0.761 (Table 3). Interestingly, genetic diversity indicators remained consistently stable across the three North American groups, with VI displaying the lowest value for each parameter and LE exhibiting the highest values (Table 3). This trend suggests that among the North American populations, the level of genetic diversity is LE > RL > VI. Upon evaluating the relevant parameters separately for Chinese and North American populations, it was noted that although the North American populations showcased higher levels of genetic diversity, there were no significant distinctions between the two groups (Table 4). This finding indicates that genetic diversity levels within Chinese populations were generally similar and remained high, except in cases like TJ and PJ where variability was noticeably lower.
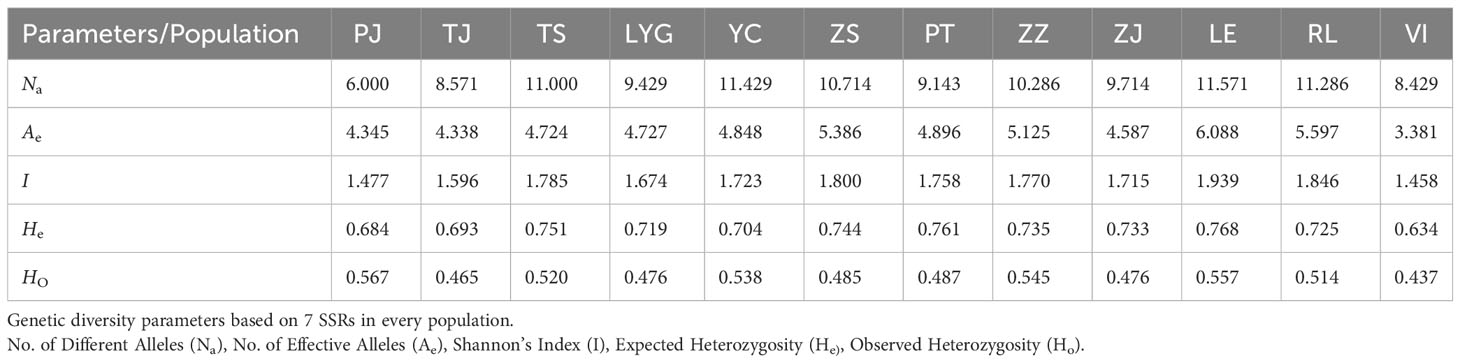
Table 3 Sampling sites’ information.
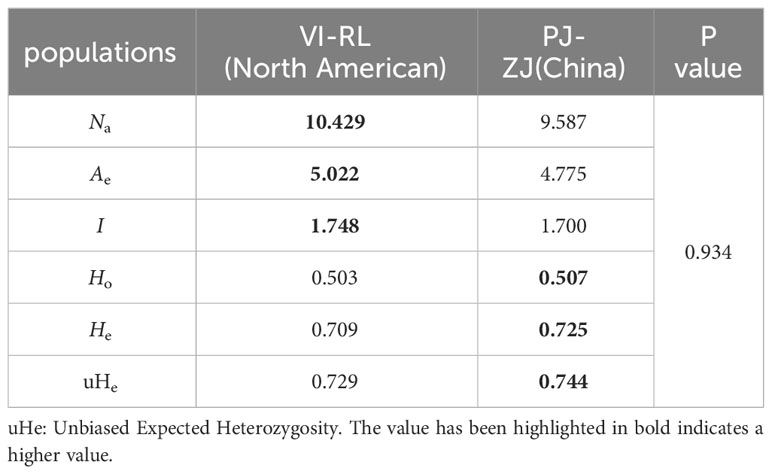
Table 4 Genetic diversity parameters in two populations.
3.2.1 Genetic diversity based on mtDNA COI
A total of 38 haplotypes were identified upon analyzing 278 samples from the partial COI region (Table 5). Among these, twenty-six haplotypes (I-XII, 1, 3, 9, 11, 12, 14, 15, 19, 29, 33, 38, 39, 62, and 81) were detected in nine Chinese populations. Notably, twelve of these haplotypes (I-XII) had not been documented in previous studies, so there are specific haplotypes of Chinese populations. Apart from these specific: Hap I–XII haplotypes, Hap 1 was ubiquitous across all populations and exhibited the highest number of occurrences. The remaining haplotypes were distributed among multiple populations as reported by Baker et al. (2008).
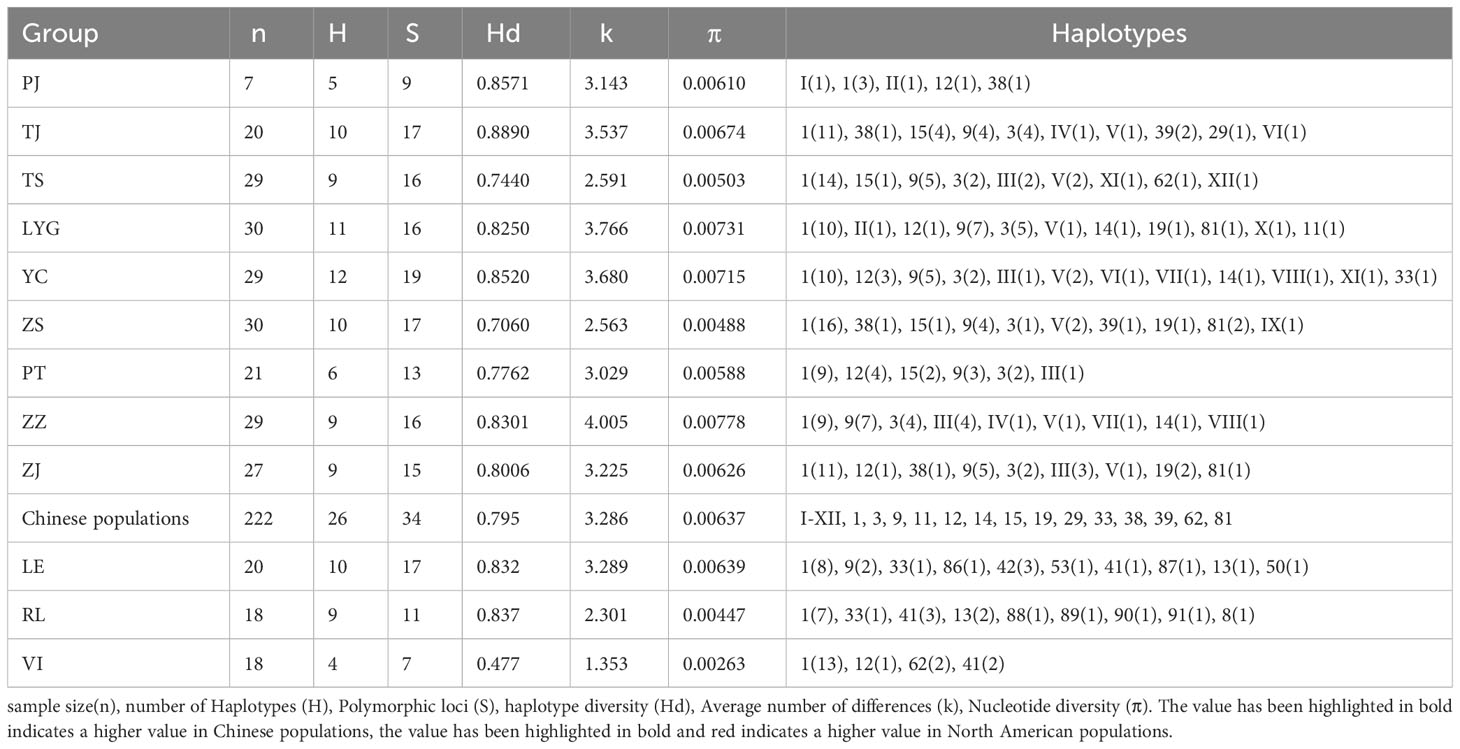
Table 5 Genetic diversity parameter based on mtCOI.
Based on the haplotype network (Figure 2), it is evident that Hap 1 serves as the ancestral haplotype, with all subsequent haplotypes descending from H1. The newly discovered haplotypes in this study, HapI to HapXII, are derived from various North American haplotypes subsequent to the introduction of hard clams to China. Due to the significantly smaller sample size of PJ compared to the other populations, a comparison involving PJ and the remaining populations was not conducted. Among the nine populations in China, YC exhibited the highest number of haplotypes (12), while PT had the lowest number (6). The consistency in the number of haplotypes across Chinese populations suggests significant haplotype sharing among different groups, indicating extensive gene flow and interactions among communities in China. Haplotype diversity (Hd) ranged from 0.706 (ZS) to 0.8890 (TJ); average nucleotide differences (k) ranged from 2.563 (ZS) to 4.005 (ZZ); and nucleotide polymorphism (Pi) varied from 0.488 (ZS) to 0.00778 (ZZ). Noteworthy is that ZS, PT, and TS displayed lower genetic diversity levels, with ZS showing the least genetic diversity compared to the other populations (Table 5).
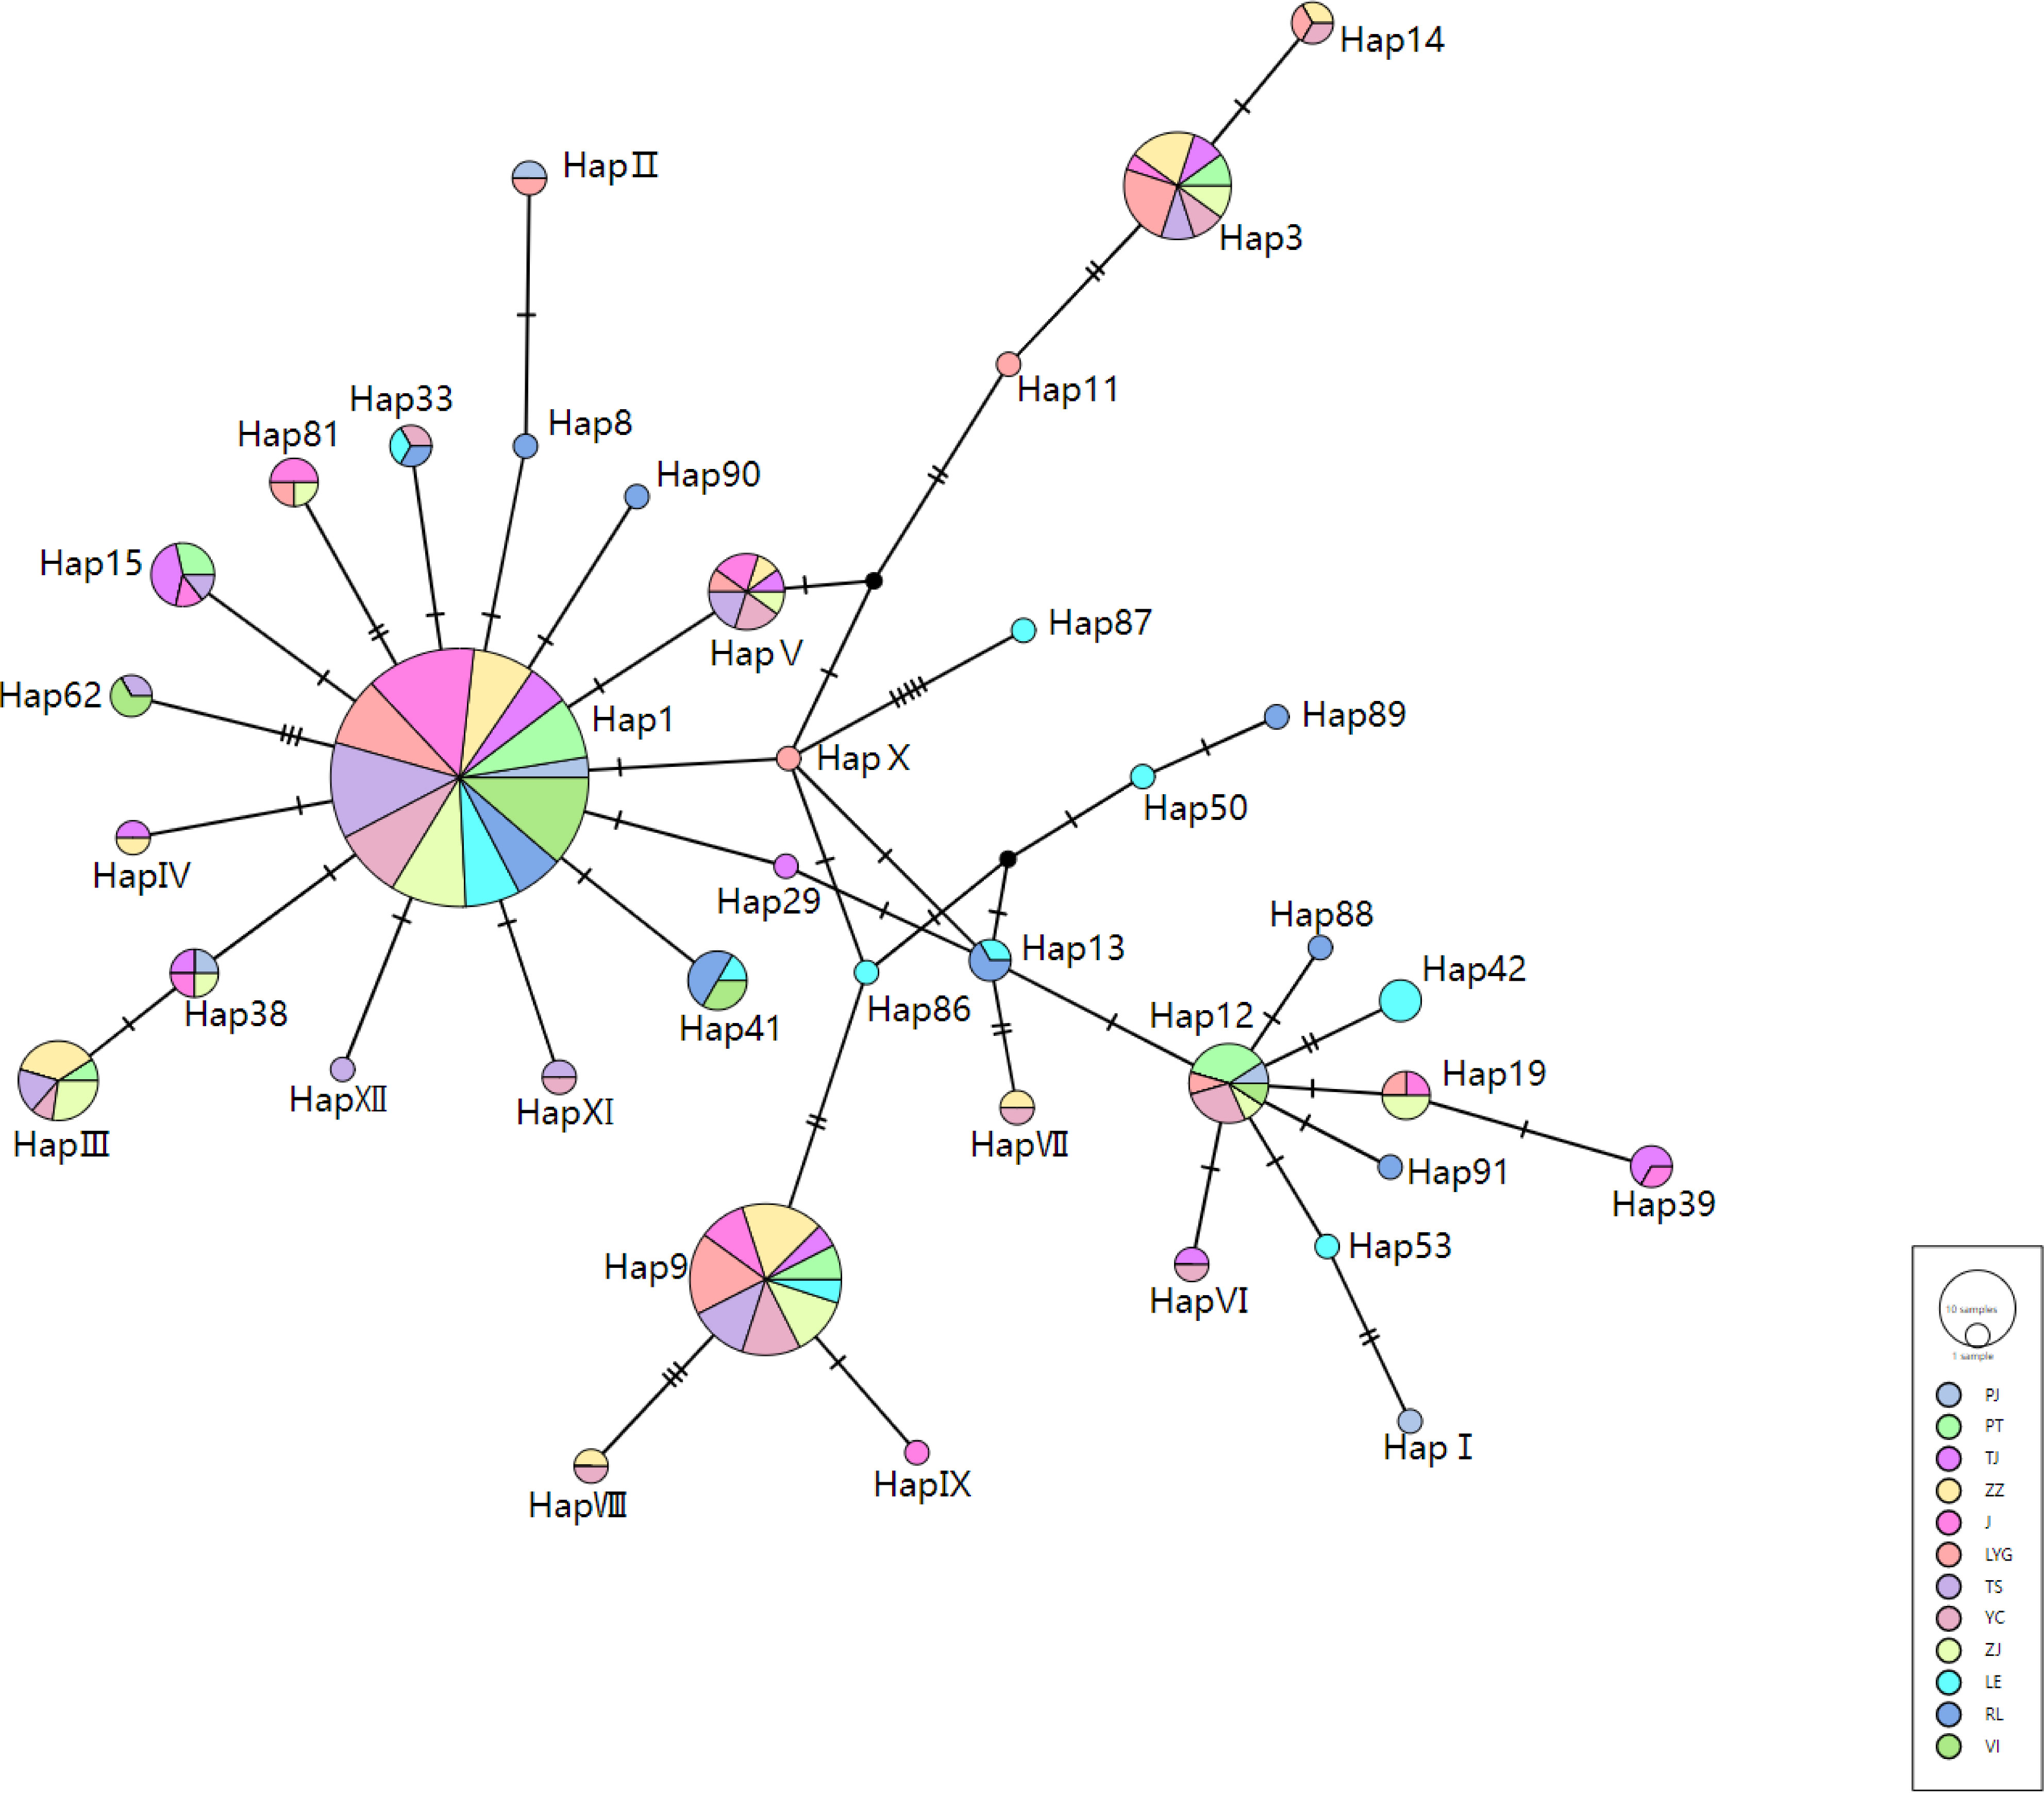
Figure 2 Statistical parsimony network of the mtCOI haplotypes detected in the 278 samples. Circle size indicates frequency. The population origins of the haplotypes were indicated by colors.
In the three North American populations, a total of twelve haplotypes were identified (Hap8, 13, 41, 42, 50, 53, 86, 87, 88, 89, 90, and 91), where Hap86 to Hap91 were novel specific haplotypes. Haplotypes 86 and 87 were found in LE, while 88 to 91 were present in RL. The majority of haplotypes observed in VI were common across most populations. Regarding genetic diversity, VI exhibited the lowest level of genetic diversity, while LE showed the highest amount of genetic diversity, with RL falling in between these two extremes (Table 5).
3.3 Population genetic structure
Due to the limited sample size of PJ, there was a concern that it might introduce bias into the results pertaining to genetic structure. As a result, PJ was not included in this phase of the analysis. Subsequently, when referring to all Chinese populations except for PJ in later descriptions, they will be denoted as CN.
3.3.1 Genetic structure based on SSRs
The population structure was examined using STRUCTURE 2.3.4 through a Bayesian cluster analysis, yielding a peak at δK=2. The results (Figures 3A–C) indicate that at δK values of 3, 4, and 5, the North American populations exhibit significant genetic differentiation from CN. Moreover, while VI is also exist the genetic differentiated from CN, its differentiation is less pronounced compared to LE and RL, hinting that VI might be one of the potential origins of CN. However, when comparing the genetic differences between various Chinese populations, most genetic disparities were found to be minimal or insignificant except ZZ and LYG.
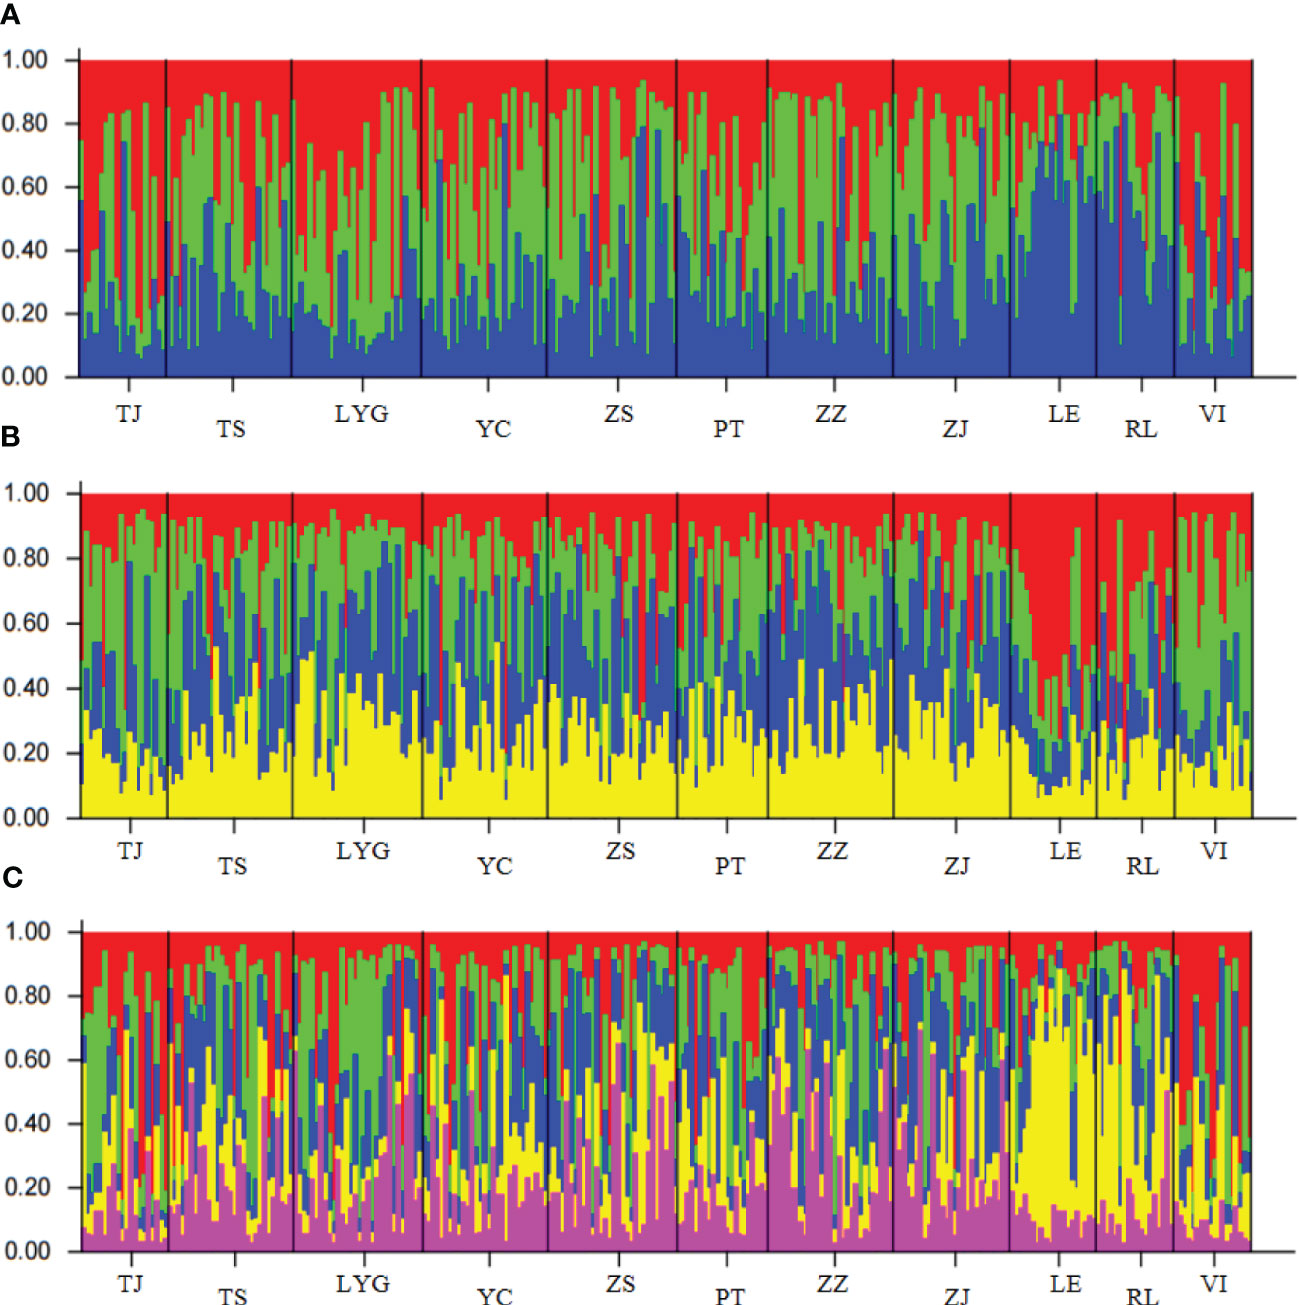
Figure 3 The results of population STURCTURE analysis (A) The population structure of All samples when δK is 3. (B)The population structure of All samples when δK is 4. (C) The population structure of All samples when δK is 5.
The majority of pairwise FST values between populations don’t exhibit highly significant differences (*P < 0.0009), with VI-ZJ displaying the greatest difference (0.08445) and ZS-ZJ showing the smallest (0.00123). Chinese populations, especially VI, were found to be distantly related to North American groups. The UPGMA dendrogram (Figure 4) constructed using pairwise Nei’s genetic distances (Table 6) among various populations also reflected similar result, grouping populations into two groups based on their geographic distribution. While genetic differentiation within CN was minor, there were outlier examples like TJ that stood out as more distinct, likely due to reduced gene flow with other populations. The UPGMA dendrogram results aligned with previous findings indicating weaker genetic differentiation between VI and CN; however, FST results revealed that LE and CN showed less differentiation.
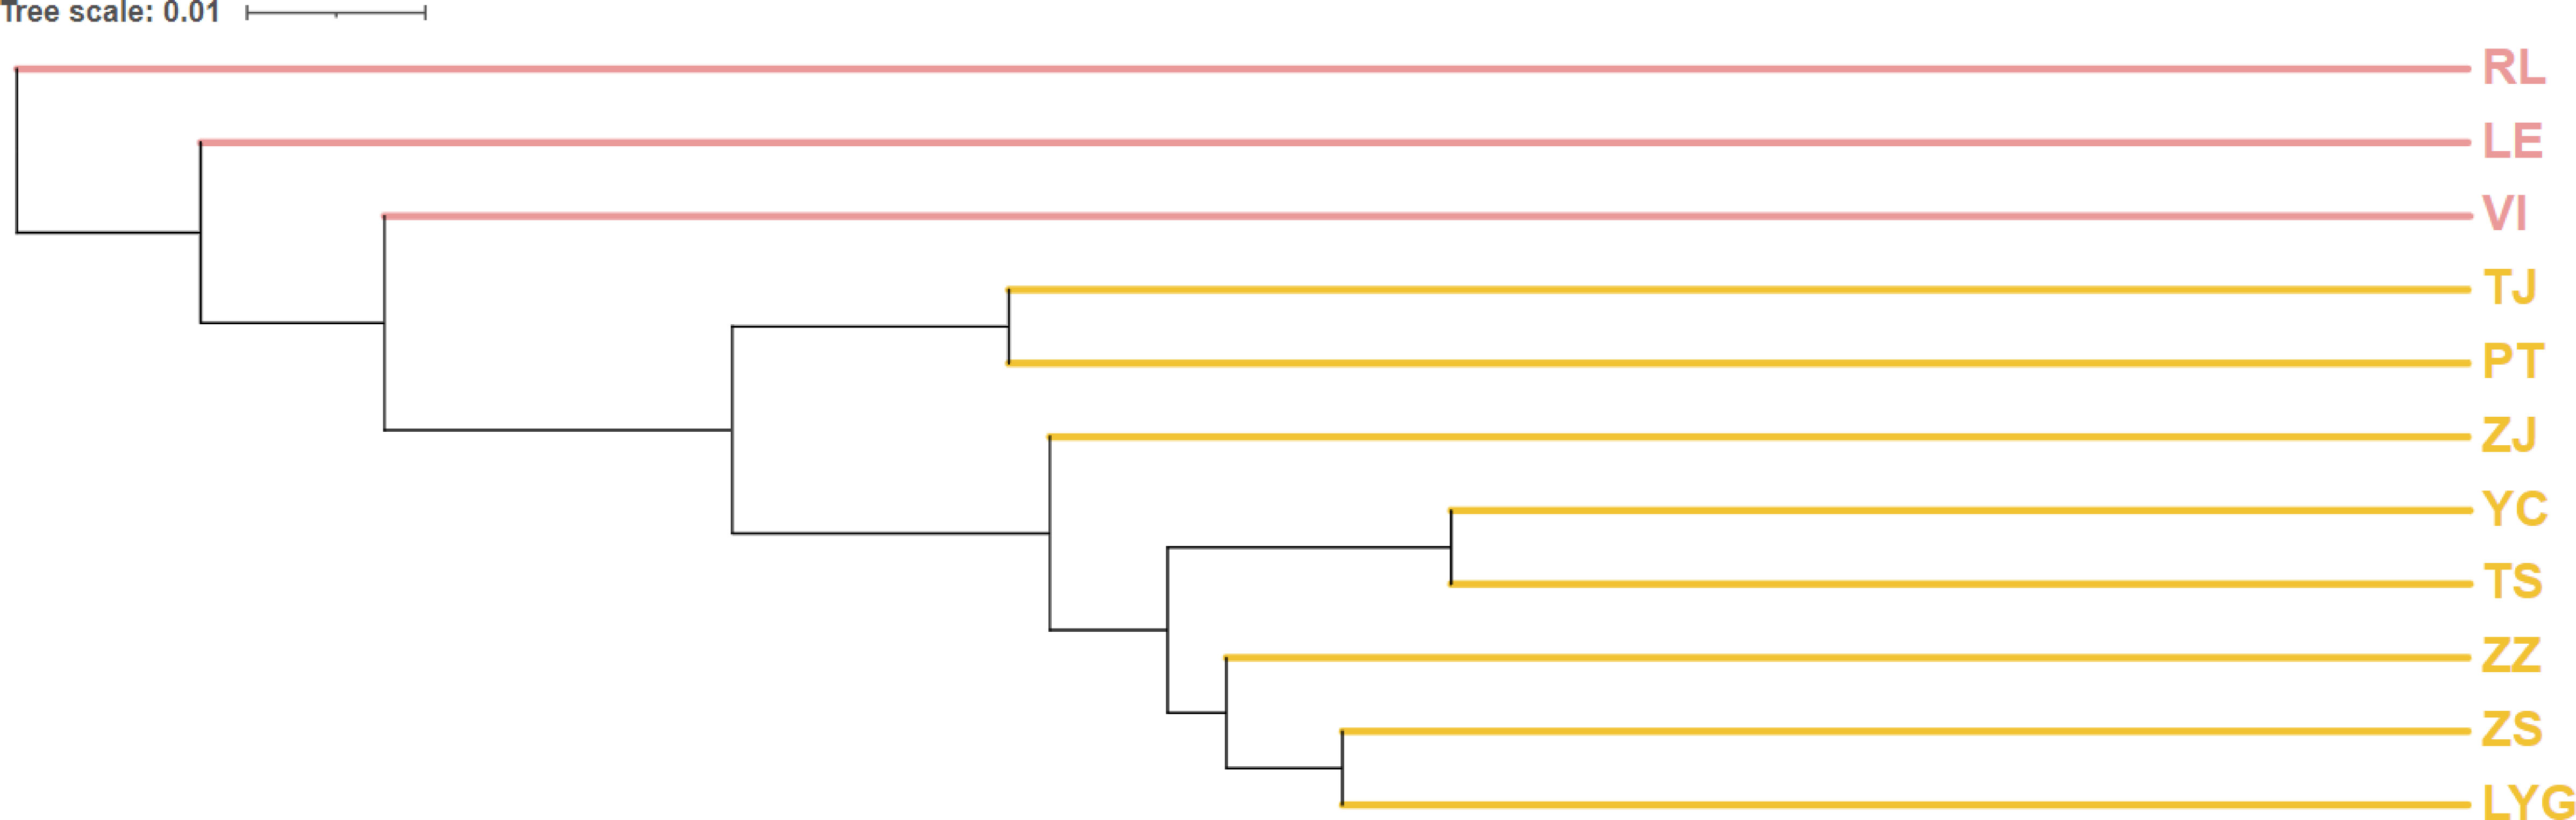
Figure 4 Unweighted pair group method with arithmetic mean (UPGMA) dendrogram based on different populations’ Pairwise Nei’s genetic distance. The pink titles are American populations and the orange titles are Chinese populations.
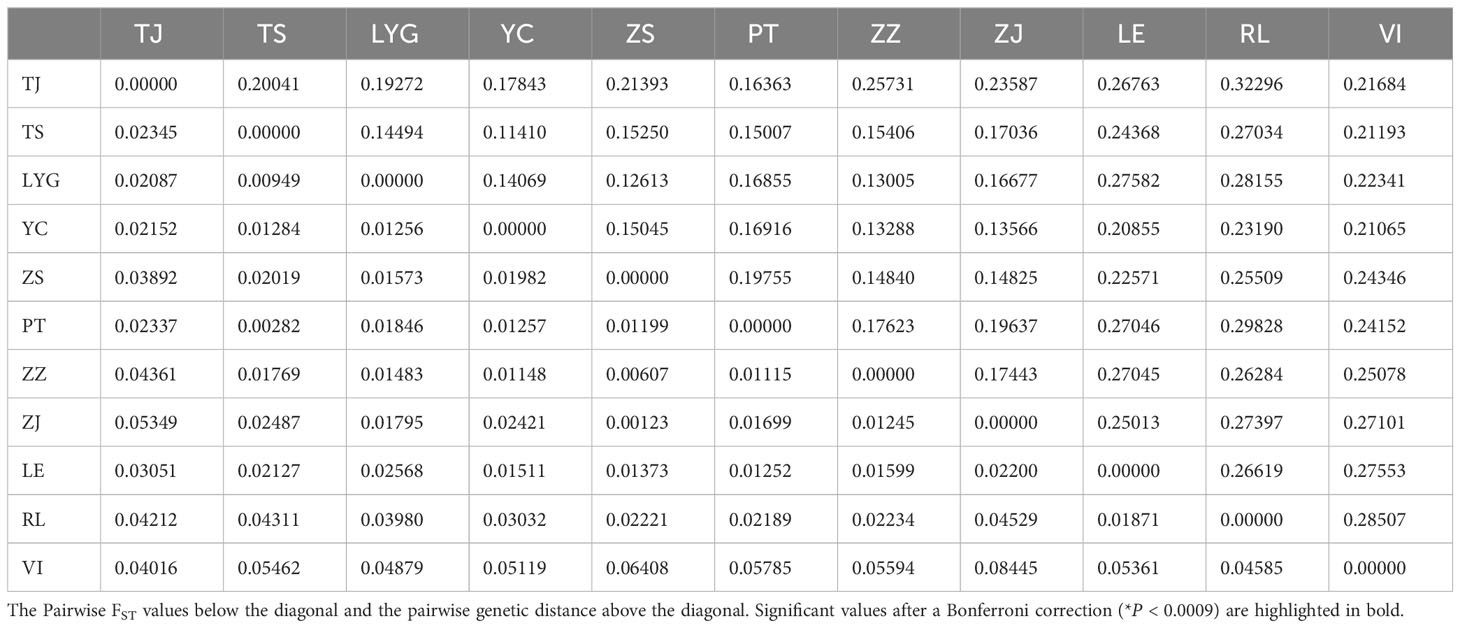
Table 6 Pairwise FST values and pairwise Genetic distance between different populations in China and the North America by SSRs.
3.3.2 Genetic structure based on mtDNA COI
The AMOVA analysis conducted on Chinese and North American populations individually demonstrated that the Among Populations Variance component of the North American population was notably higher compared to that of CN. This discrepancy suggests that there was weaker genetic differentiation among distinct populations in China (Table 7). This finding was further supported by the pairwise FST values between the two populations.
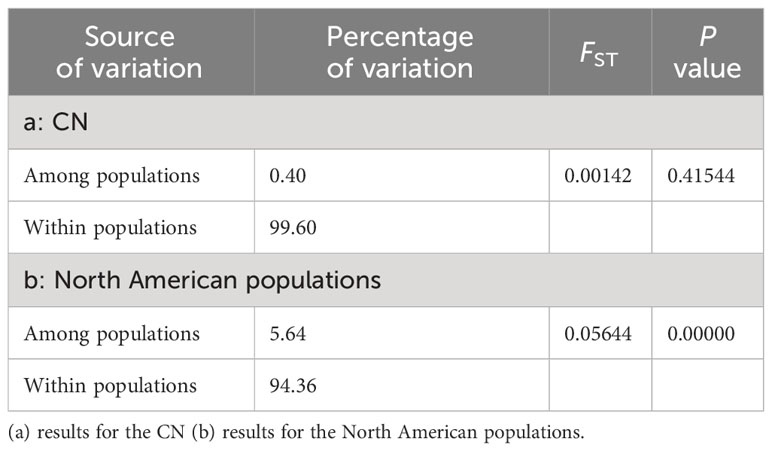
Table 7 The Analysis of molecular variance (AMOVA) results of CN and North American populations based on mtCOI.
The pairwise genetic distances and pairwise FST between distinct groups in China and North America, along with the unrooted population tree based on the Kimura two-parameter distance matrix, can be used to determine the link between the populations and the genetic difference. (Figure 5, Table 8). The results from (Table 8) revealed that genetic distances among Chinese populations ranged from 0.00511 to 0.00772, while pairwise FST varied from -0.01907 to 0.04207. Across all populations, genetic distances spanned from 0.00331 to 0.00942, with FST ranging from -0.03456 to 0.15275. A few significant differences were noted in the pairwise FST values of all populations, indicating no strong relationship between any North American population and CN (*P < 0.0002). The unrooted population tree displayed a distant relationship between CN and specific North American Groups 1 and 2, suggesting it is improbable that CN originates from these geographic populations as these groups. Furthermore, the clustering of CN populations together in the tree suggests minimal genetic differentiation among them, although there are discernible differences, which aligns with the earlier findings.
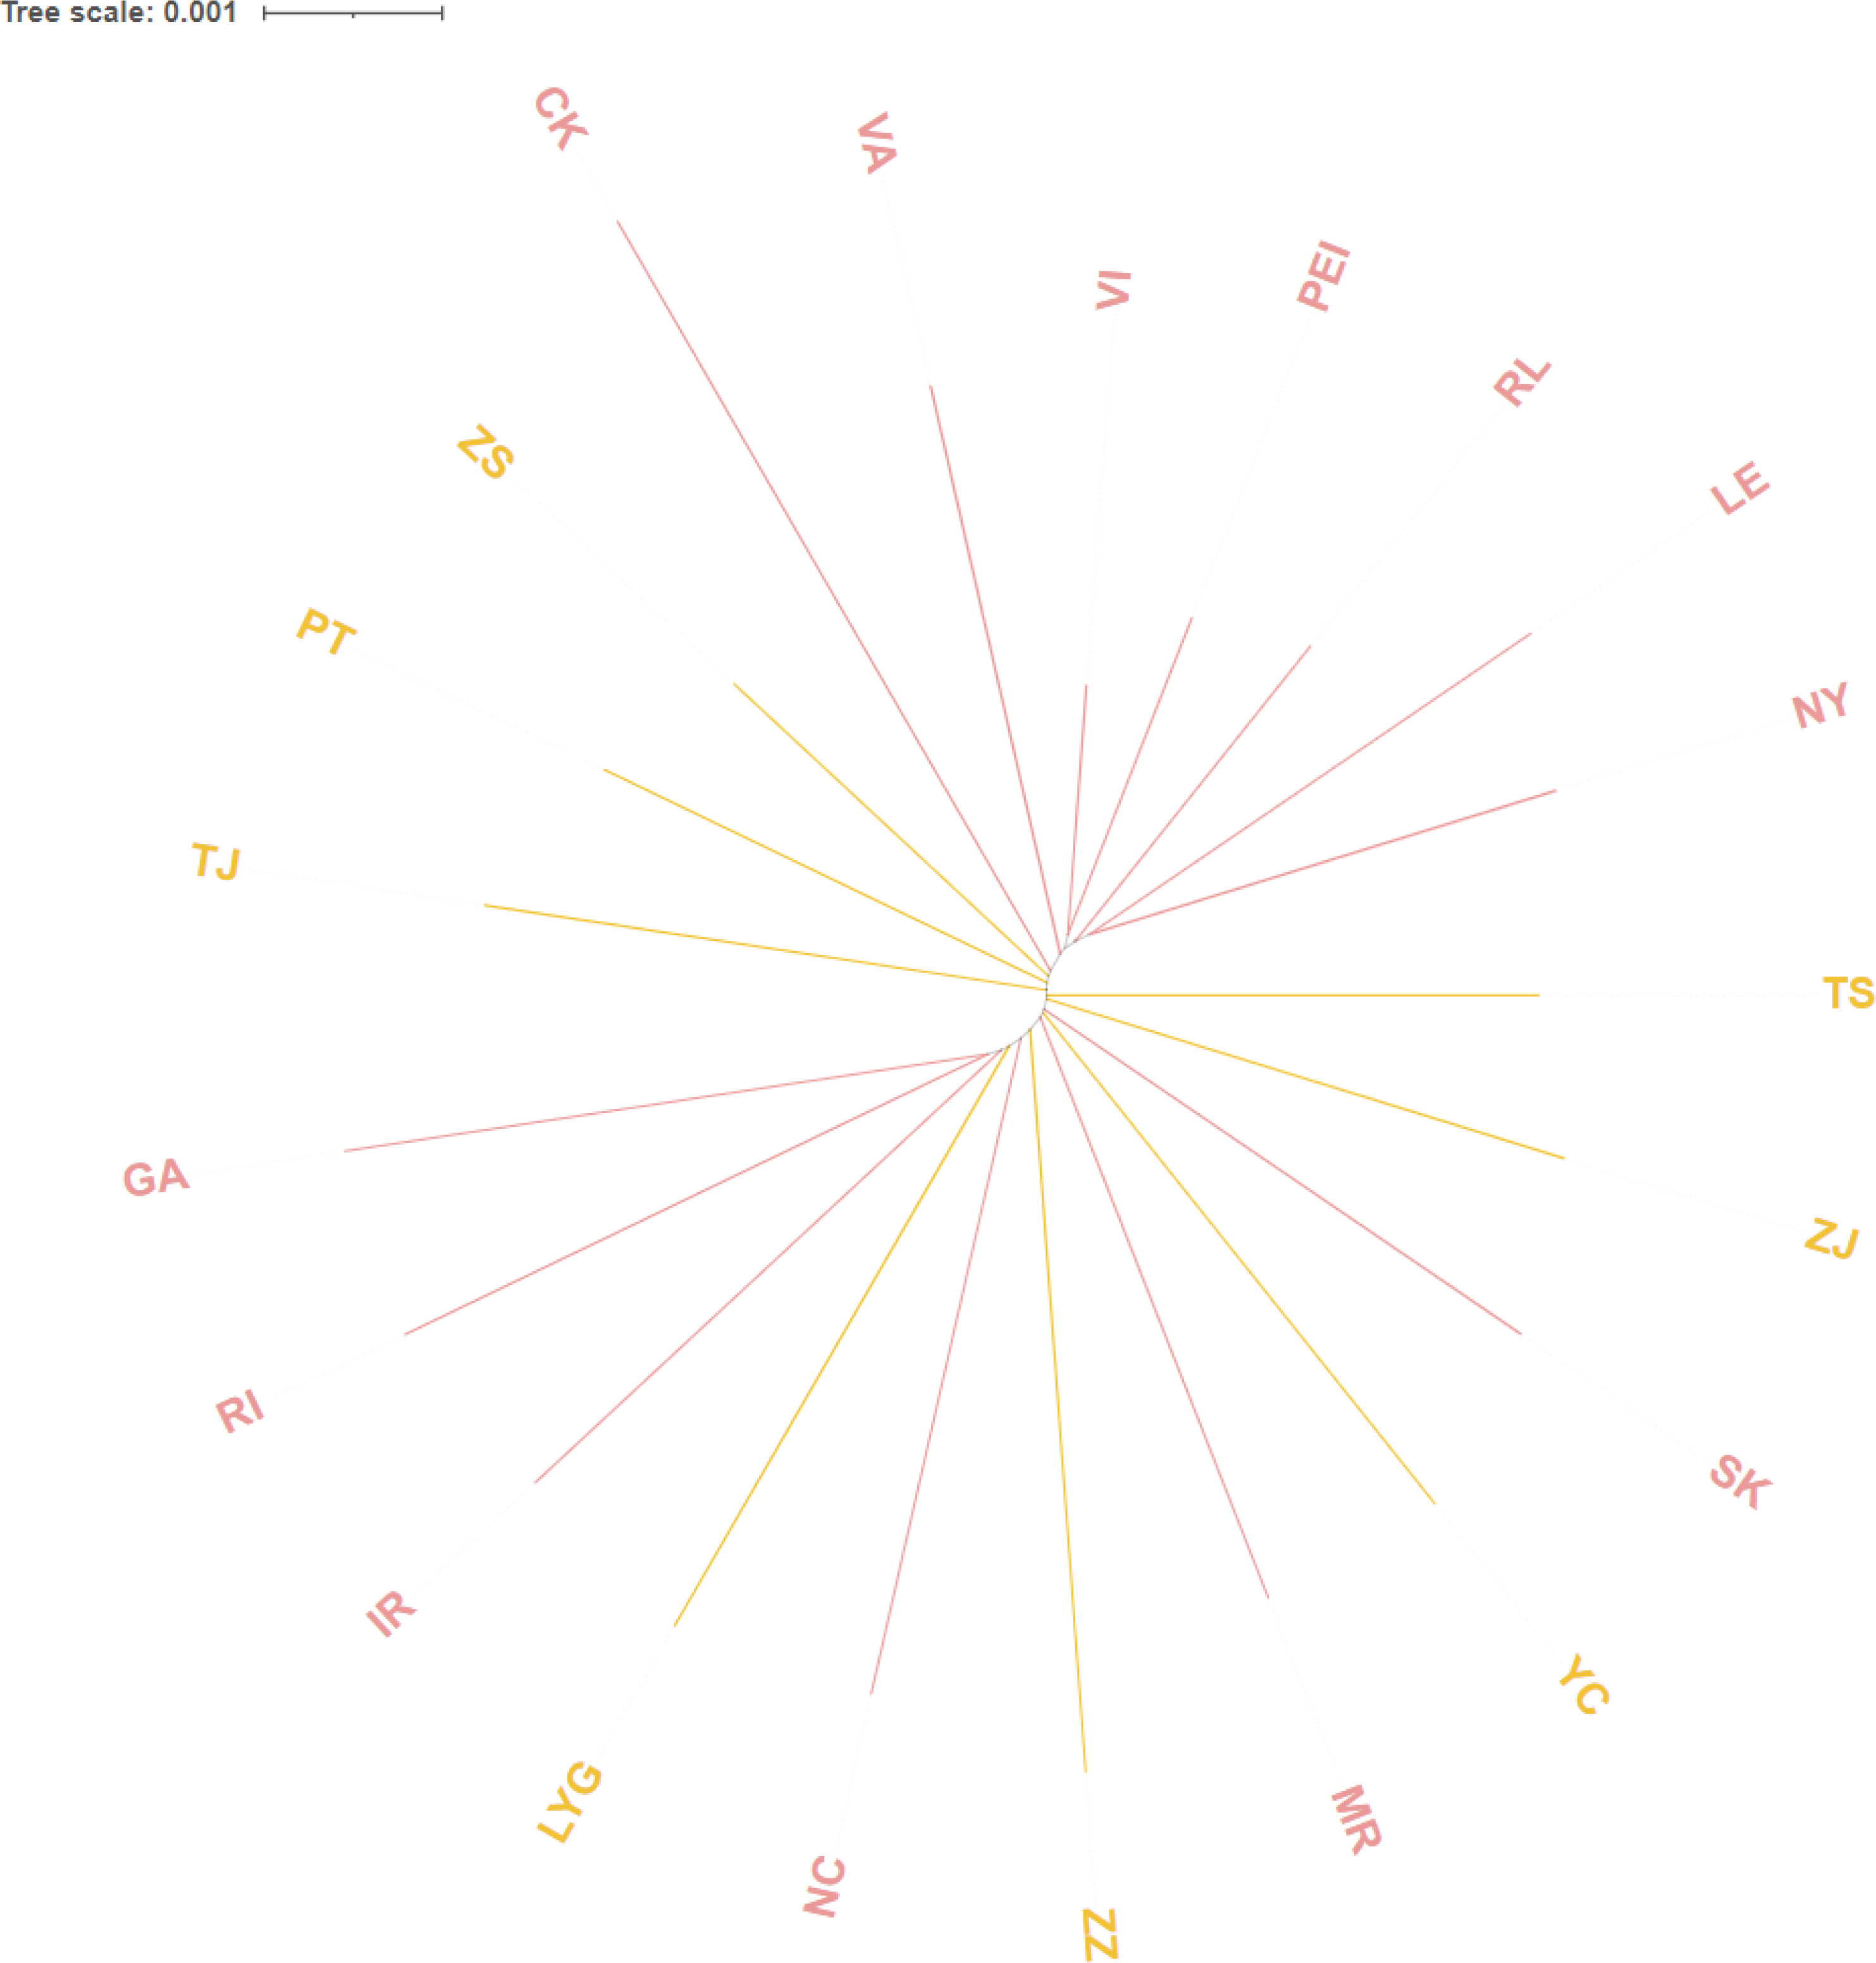
Figure 5 Using Kimura two-parameter distance to construct unrooted population tree. based on Genetic distance between the different populations in China and North America.; The pink titles are American groups and the orange titles are Chinese groups.
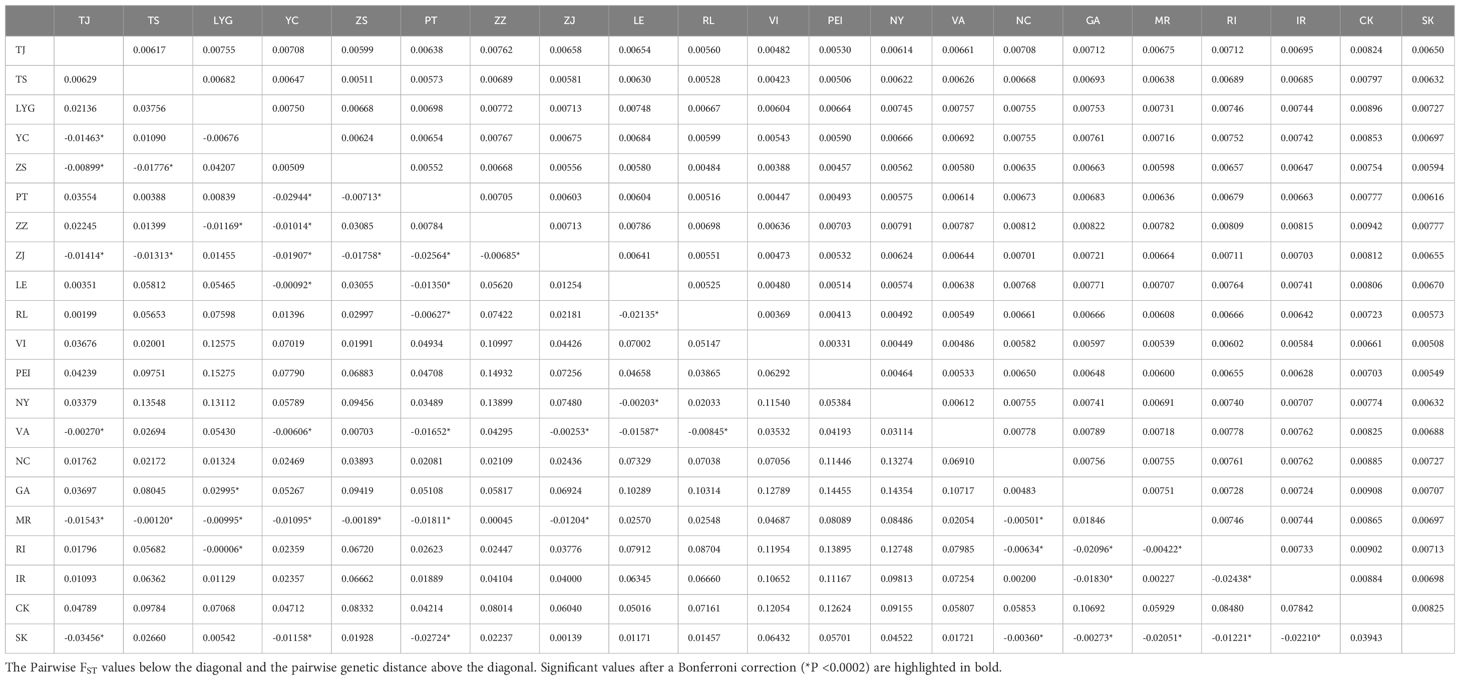
Table 8 Pairwise FST values and pairwise Genetic distance between different populations in China and the North America by mtDNA COI.
Considering all the outcomes, the genetic differentiation among all Chinese populations is notably weak, leading us to treat them collectively in subsequent analyses. Post the calculation of pairwise FST values between CN and the six groups specified in the Materials and methods, we observed the highest pairwise FST value in A (0.06854) and the lowest in C (0.01980) (Table 9). Additionally, we conducted pairwise FST calculations between CN and VA independently to explore if the results from Group 3 were linked to VI haplotypes. The findings revealed that the presence and quantity of VI haplotypes did not impact the results of C. Consequently, Group 3 and 6 exhibit closer affinities with CN based on the analysis.
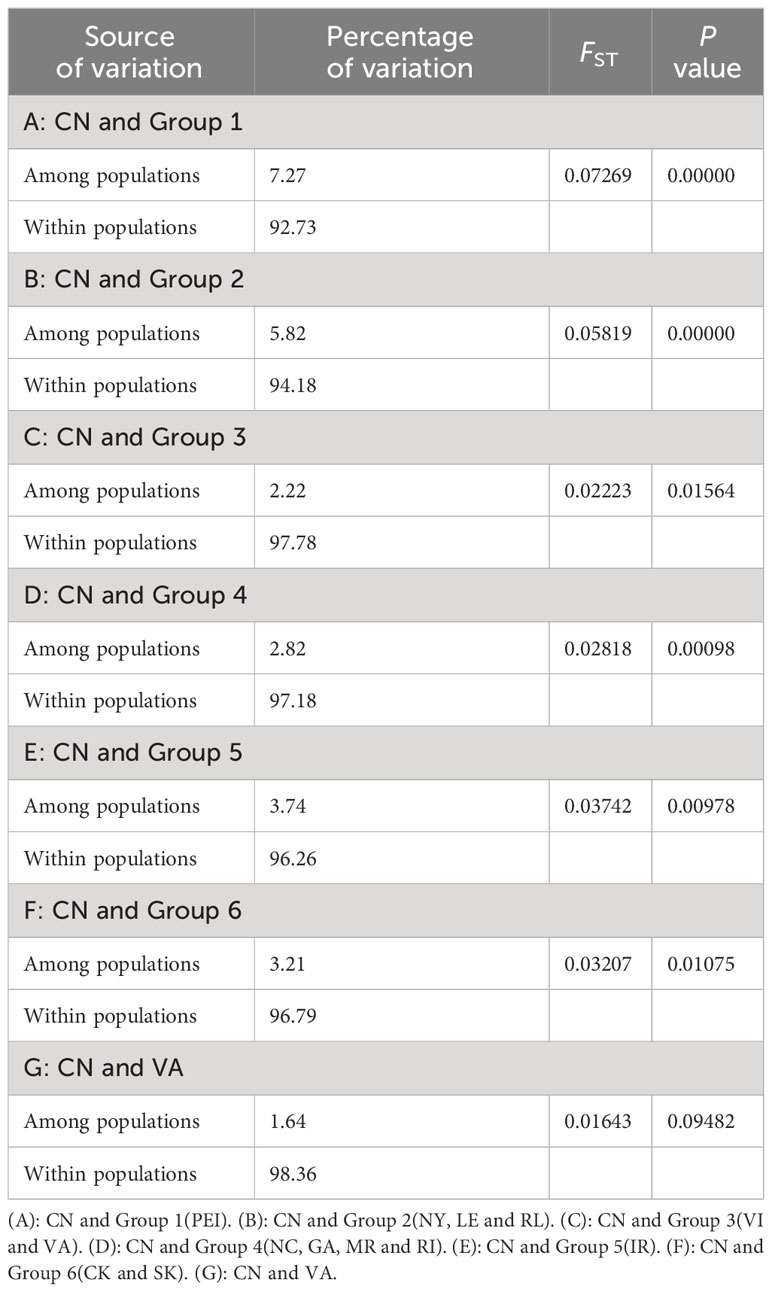
Table 9 The AMOVA results of CN and all Groups.
Building upon the results mentioned earlier, we categorized all groups into three classes to assess their proximity to the Chinese groups. Group 3 and 6 were assigned to the first class denoted by a blue circle, indicating the closest affinities, whereas Group 4 and 5 were positioned in the second class marked by a green circle. Lastly, Group 1 and 2 were allocated to the third class represented by a yellow circle in the diagram (Figure 1), signifying the most distant affinities.
4 Discussion
The hard clam, a widely distributed species native to the east coast of North America, has been subjected to genetic scrutiny. Hargrove et al. (2015) employed SSRs to assess genetic diversity within cultured populations in contrast to wild populations in Florida. Baker et al. and Ropp et al. examined the genetic makeup of populations along the east coast of North America using mtCOI and SNP analyses (Baker et al., 2008; Ropp et al., 2023). Additionally, Murakami-Sugihara et al. (2012) scrutinized populations in Tokyo Bay utilizing mtCOI, drawing on previous work by Baker et al. (2008). This study employs SSRs and mtCOI to probe the genetic diversity and structure of nine populations spanning south to north along the Chinese coast, alongside three populations from northern North America (LE, RL, and VI). The aim is to compare these findings with those from the studies mentioned above to evaluate the germplasm of CN and track its origins.
4.1 Loci polymorphism
The Polymorphism Information Content (PIC) index serves as a crucial metric for assessing the level of polymorphism in markers (Nagy et al., 2012). This value indicates a marker’s ability to reveal population polymorphism (Serrote et al., 2020), with values exceeding 0.5 suggesting high informativeness (Botstein et al., 1980). The utilization of SSRs for genetic diversity and structure analysis in other bivalve species has gained prominence recently. Jiang et al. employed 29 SSRs, revealing a PIC range of 0.341–0.910 in Ruditapes philippinarum (Jiang et al., 2018). An et al. utilized nine microsatellite markers to compare genetic diversity in wild and cultured Crassostrea gigas populations in Korea, yielding PIC values ranging from 0.77–0.96 (An et al., 2013). Zhan et al. developed microsatellite markers with PIC values spanning from 0.2128 to 0.7843 using expressed sequence tags from Argopecten irradians (Zhan et al., 2005). Lu et al. established three EST-SSR markers with QTL for Meretrix meretrix growth, showcasing PIC values ranging from 0.7963–0.8438 (Lu et al., 2013). In our investigation, the PIC values range from 0.5810 to 0.9417, with a mean of 0.7475. It appears that the seven microsatellite markers employed in this study exhibit higher polymorphism levels compared to other bivalve species and loci studied previously.
4.2 Genetic diversity
4.2.1 Differences in number of different alleles of loci
New alleles can arise from genetic variation in individuals or groups, playing a crucial role in genetic diversity (Allendorf, 1986). Assessing differences in allele numbers can help determine if there has been a decline in genetic diversity (Allendorf and Phelps, 1980). Notably, the RUMM018 locus exhibits the highest number of alleles on SSRs, both in the populations under our scrutiny and in the study conducted by Hargrove et al. (2015). In our analysis, the number of alleles at other loci besides RUMM018 is significantly lower than that found at RUMM018, while this trend is also observed in the study by Hargrove et al. (2015) although the difference is not as pronounced as in our investigation. Apart from RUMM018, RUMM032 and RUMM034 showcase the highest allele counts in our study, distinctly surpassing the others. Conversely, in the research by Hargrove et al., RUMM032 and RUMM034 exhibit fewer alleles and are not notably different from the remaining loci. This suggests that, compared to the Florida populations, RUMM032 and RUMM034 show more specificity within the populations under our examination.
On mtCOI, the count of haplotypes identified in CN (26) is notably lower than that of North American populations (91) and more aligned with Tokyo Bay populations (44). However, it’s important to consider that the actual disparity may be greater when factoring in the number of samples and sampling sites due to a positive correlation between the number of haplotypes and samples (Wang et al., 2017; Zheng et al., 2019). Similar to the A-TJ haplotypes observed in Tokyo Bay populations (Murakami-Sugihara et al., 2012) (A-TJ, GeneBank accession numbers: AB670719-AB670734, AB685193-AB685212), haplotypes I-XII are specific to CN. These haplotypes (I-XII, A-TJ) emerged from the North American populations post-successful migration, yet the count of endemic haplotypes in the two populations significantly differs (12:36). Furthermore, the disparity in haplotype numbers between Chinese and North American populations is remarkable, despite the common trend of alien populations encountering reduced genetic diversity due to loss of genetic variation following successful migration (Roman and Darling, 2007).
In exploring this phenomenon, we believe there are two potential reasons at play. The first explanation could be attributed to differences in genetic variation. However, parameters like Hd, k, and Pi in the former are not notably lower compared to the latter two. Generally, higher parameter values signify greater genetic diversity (Frankham et al., 2002; Hughes et al., 2008), suggesting that CN remains relatively on par with the other populations regarding genetic variation. The second reason likely involves environmental factors. Diverse environmental conditions serve as significant drivers of genetic differentiation among populations (Riginos and Nachman, 2001; Lee and Mitchell-Olds, 2011; Kijewski et al., 2019). When juxtaposed with Tokyo Bay and the Florida peninsula, the Chinese coast is similar with the east coast of North America concerning temperature, salinity, and other environmental aspects, potentially leading to less variation. Yet, these typical environmental conditions encompass a wide range of factors, including temperature and salinity. Therefore, further comprehensive studies will be required in the future to pinpoint the specific factors contributing to this observed phenomenon.
4.2.2 Genetic diversity of Mercenaria mercenaria between different geographical populations
Cape Hatteras in North Carolina is recognized as a significant biogeographic barrier (Engle and Summers, 1999). Building on this information, the North American populations under study presently and previously (Hargrove et al., 2015) can be classified into two main groups: populations situated north of Cape Hatteras and populations in Florida. Various genetic diversity parameters serve to gauge the extent of genetic variety, where a higher parameter value generally indicates greater genetic diversity (Frankham et al., 2002; Hughes et al., 2008). Regarding the genetic diversity of SSRs, populations located north of Cape Hatteras exhibit the highest levels, followed by CN, and then the populations in Florida (Table 3).
When looking at mtCOI, despite the genetic diversity being relatively consistent across geographical populations, there are specific populations within CN, such as PT, ZS, and TS, that exhibit lower diversity. Our speculation is that these particular populations have suffered due to intensive farming practices, leading to increased inbreeding in comparison to the remaining two wild populations (Avise et al., 1987; Hedgecock et al., 1992; Hedgecock, 1994). This heightened inbreeding can result in a gradual loss of genetic variations, creating a detrimental cycle. Such a situation could pose a significant threat to the germplasm resources crucial for aquaculture.
Considering the results from SSRs and mtCOI, we observe that CN showcases a higher level of genetic diversity, with minimal disparity compared to North American populations. Notably, specific groups within CN exhibit elevated diversity levels, such as YC. However, conversely, there are still populations facing challenges, like PT. In recent years, advancements in internet accessibility and transportation have facilitated increased intermixing among populations from different locations to enhance offspring quality and gene flow in various aquaculture species (Zhang et al., 2007; Li et al., 2011; Ye et al., 2020; Ma et al., 2022). Our speculation regarding PT, identified as the oldest population in our study, centers on two potential reasons for its low genetic diversity: firstly, inherent limited genetic variation within the population itself, and secondly, historical practices that discouraged extensive mixing, hindering adequate gene flow over many years.
The founder effect, as explained by Nei et al. (1975), entails a reduction in genetic diversity occurring when alien species invade an area and establish a new geographic population. While this phenomenon is prevalent in numerous marine species (Lindholm et al., 2005; Marescaux et al., 2016), there exist instances where reductions in genetic diversity are less pronounced (Roman and Darling, 2007; Meistertzheim et al., 2013). This study appears to align more with the latter category. Upon analyzing the data, we note that the genetic diversity in CN is higher in SSRs compared to Florida populations but lower in mtCOI. We believe we have now discerned the reasons behind this disparity after considering both the introduction history and genetic structure aspects. One plausible explanation for this lies in the hybrid nature of CN due to the incorporation of various populations from different North American regions. The diverse origins of the founders initially contributed to higher genetic variability in Chinese populations, even though the founder effect might render Chinese populations less genetically diverse than their North American counterparts. Despite experiencing reductions due to mixed breeding, multi-generational breeding, and inbreeding leading to allele loss (Allendorf and Phelps, 1980), the current genetic diversity remains relatively high due to the initial rich genetic pool. Conversely, the Florida population faces significant challenges in genetic flow owing to its geographic isolation and southernmost location (Engle and Summers, 1999; Baker et al., 2008; Ropp et al., 2023) from the rest of North America. Hence, CN exhibits slightly greater genetic diversity in SSRs compared to Florida populations. Concerning mtCOI, while it may marginally lag behind in comparison, specific populations within CN still exhibit notable genetic diversity. Combined with the above results, we conclude that the germplasm of hard clam in China has not been seriously degraded and still has a high level of genetic diversity.
Across two molecular genetic markers, VI, originating from the Commonwealth of Virginia in the United States, exhibits the lowest levels of genetic diversity. While VA, as mentioned in the study by Baker et al. (2008), was also collected from the same region, significant differences in genetic diversity between the two populations prompt us to propose two potential reasons for this occurrence. Firstly, in contrast to VA sourced from a wild population, VI may have originated from a cultivated population. Consequently, VI likely experienced less gene flow compared with wild populations, and the process of cultivation typically leads to diminished genetic diversity (Avise et al., 1987; Hedgecock et al., 1992; Hedgecock, 1994). Secondly, geographic distribution plays a crucial role. Research by Ropp et al. (2023) highlights that the Commonwealth of Virginia encompasses an isolated bay known as Chesapeake Bay. Species inhabiting this region encounter challenges in engaging in gene flow with populations in the mid-Atlantic region (spanning from New York State to Virginia), which is how the differences between VI and VA came into existence. In essence, as a farmed species, limited interaction with other populations may be the primary contributing factor to its reduced genetic diversity.
4.3 Germplasm evaluation
Genetic structure analysis plays a vital role in evaluating germplasm, as highlighted by several studies (Djè et al., 2000; Cordeiro et al., 2003; Schnell et al., 2003; Zhebentyayeva et al., 2003; Chao et al., 2007; Shehzad et al., 2009; Szamosi et al., 2010). It enables the examination of connections and differentiations among various groups and individuals (Lessa, 1990), thereby providing insights into the optimal structures for utilization in breeding programs (Brown, 1978).
On SSRs, despite classifying individuals and populations into different groups, results consistently showed minimal genetic differences across CN. VI exhibited less variations from CN in the STRUCTURE analysis, hinting at a possible origin relationship between them. The UPGMA dendrogram, based on pairwise Nei’s genetic distances among populations, echoed these conclusions. Except for PJ, populations from China and North America were distinctly grouped. Combined with the results of pairwise FST, we speculate LE and RL are distantly related to CN but we’ll need to verify that later.
In mtCOI, we observed similar trends where CN populations were predominantly grouped with minimal variation between them. As mentioned earlier, in the context of modern transportation and internet connectivity, cultivated species often migrate from their original locations to new areas. We believe this phenomenon is the primary factor influencing the population structure of Mercenaria mercenaria. The second significant aspect is historical introduction. All current individuals in China are descendants of a small number of specimens brought from North America (Hu et al., 2019), resulting in initial minimal genetic differences among different Chinese populations. In our view, the historical introduction plays a pivotal role in shaping these outcomes, while the migration process simply facilitates this pattern.
In the preceding discussion on genetic diversity, we highlighted the absence of significant degradation in germplasm of hard clam in China. However, upon considering this aspect alongside the following section, it becomes apparent that the germplasm quality remains satisfactory, the limited genetic differentiation between populations indicates an unfavorable situation.
4.4 The origin of Chinese hard clams
Based on the above results discussed, we have deduced that there exists minimal genetic differentiation among various Chinese populations, suggesting they can be treated collectively when we trace their origin. Drawing from previous research indicating geographic isolation (Engle and Summers, 1999; Baker et al., 2008; Ropp et al., 2023), we divided North American populations into six groups (Group 1-6) and calculate the pairwise FST between CN with them. Our findings reveal that Group 3 exhibits a closer relationship to CN compared to Group 2, aligning with our earlier observations from SSRs where VI is more similar to CN than LE and RL. After combining the maps, we find the regions north of Cape Hatteras are genetically very different from the CN, while the regions south are much smaller, with the exception of Group 3. This suggests Cape Hatteras acts as a barrier to gene flow, indicating a probable southern origin for CN. Despite not introducing hard clams from certain sites in this region, gene flow has led to some relatedness with those locations. Regarding Chesapeake Bay, although located north of Cape Hatteras, its strong association with CN implies prior introduction of hard clams to this area.
Due to the limited number of haplotype types (1, 12, 41, 62) and the prevalence of shared haplotypes in VI, these haplotypes are also more dominant in CN. This leads us to suspect that the pronounced connection between Group 3 and CN may be influenced by the haplotype distribution in VI. To confirm this hypothesis, we recalculated the pairwise FST between CN and VA in Group G. Surprisingly, even after excluding VI from the analysis, the pairwise FST value between CN and Group 3 remains lower than that of CN with the other groups. This additional finding further supports our conclusion that Chesapeake Bay serves as one of the origin points.
The traceability findings indicate that LE and RL exhibit a considerable genetic differences with CN, suggesting that the geographic populations where they are present may not have been previously introduced to China. Moreover, these populations display a notable level of genetic diversity, positioning them as valuable germplasm resources. Consequently, it is highly probable that LE and RL could play a pivotal role in improving the current status of hard clam germplasm in China.
5 Conclusion
In this study, we assessed the germplasm and traced the origin of the hard clam population in China using two molecular genetic markers, SSRs, and mtCOI. The results revealed that the Chinese subpopulation maintains a higher level of genetic diversity compared to populations in North America and Tokyo Bay. Due to extensive mixing, inbreeding, and multi-generational breeding, there is minimal genetic differentiation among individuals within this population, this suggests that the germplasm of hard clam in China is a cause for concern. Nonetheless, certain populations such as LYG exhibit significant genetic variance from others and harbor substantial genetic diversity, representing valuable germplasm resources. To enhance the genetic pool of germplasm in China, it remains essential to introduce high-quality populations from North America. Among the populations introduced in this study, LE and RL are identified as promising resources. The probable areas of origin for the Chinese populations are suggested to be Chesapeake Bay and south of Cape Hatteras. These insights will aid in furthering research and conservation efforts related to the genetic diversity and origins of hard clam populations in China.
Data availability statement
The original contributions presented in the study are included in the article/Supplementary Material, further inquiries can be directed to the corresponding author/s.
Ethics statement
All procedures involved in the animal collection, rearing and dissection were conducted following the Guideline of Ethical Regulations of Animal Welfare of the Institute of Oceanology, Chinese Academy of Sciences (IOCAS 2013.3). Our study protocols were approved by the Animal Welfare Committee of the IOCAS.
Author contributions
JW: Data curation, Formal analysis, Investigation, Methodology, Writing – original draft. DX: Formal analysis, Supervision, Writing – review & editing. MY: Supervision, Writing – review & editing. YJ: Methodology, Resources, Writing – original draft. HS: Supervision, Validation, Writing – review & editing. CZ: Data curation, Writing – original draft. PS: Formal analysis, Writing – original draft. YL: Resources, Writing – review & editing. YG: Resources, Writing – review & editing. FM: Methodology, Resources, Writing – original draft. CL: Methodology, Resources, Writing – original draft. SC: Visualization, Writing – review & editing. TZ: Conceptualization, Funding acquisition, Supervision, Writing – review & editing.
Funding
The author(s) declare financial support was received for the research, authorship, and/or publication of this article. This research was supported by Key R&D Program of Shandong Province, China (2023CXGC010411), National Natural Science Foundation of China (31972793), Tianjin science and technology commission project (20YFZCSN00240), Tianjin Agricultural Committee Project (202103010), Lianyungang City Lianyun District, “Mountain and Sea Talent Program” Leading Talent Project, Lianyungang City Huaguo Mountain Talent “Double Creation Program” (Entrepreneurship) Project, the earmarked fund for CARS (CARS-49), the Key Research and Development Program of Guangxi Province (Grant No. 2021AB34014), HS was supported by the Taishan Scholars Program, Young Elite Scientists Sponsorship Program by CAST (Grant No. 2021QNRC001) and Youth Innovation Promotion Association by CAS. The funders had no role in the study design, data collection and analysis, decision to publish, or preparation of the manuscript.
Conflict of interest
Author CL was employed by the company Lianyungang Blue Carbon Marine Technology Co., Ltd.
The remaining authors declare that the research was conducted in the absence of any commercial or financial relationships that could be construed as a potential conflict of interest.
Publisher’s note
All claims expressed in this article are solely those of the authors and do not necessarily represent those of their affiliated organizations, or those of the publisher, the editors and the reviewers. Any product that may be evaluated in this article, or claim that may be made by its manufacturer, is not guaranteed or endorsed by the publisher.
Supplementary material
The Supplementary Material for this article can be found online at: https://www.frontiersin.org/articles/10.3389/fmars.2024.1362003/full#supplementary-material
References
Allendorf F. W. (1986). Genetic drift and the loss of alleles versus heterozygosity. Zoo Biol. 5, 181–190. doi: 10.1002/zoo.1430050212
Allendorf F. W., Phelps S. R. (1980). Loss of genetic variation in a hatchery stock of cutthroat trout. Trans. Am. Fisheries Soc. 109, 537–543. doi: 10.1577/1548-8659(1980)109<537:LOGVIA>2.0.CO;2
An H. S., Lee J. W., Kim W. J., Lim H. J., Kim E. M., Byun S. G., et al. (2013). Comparative genetic diversity of wild and hatchery-produced Pacific oyster (Crassostrea gigas) populations in Korea using multiplex PCR assays with nine polymorphic microsatellite markers. Genes Genomics 35, 805–815. doi: 10.1007/s13258-013-0140-2
Angles d'Auriac M. B., Rinde E., Norling P., Lapegue S., Staalstrom A., Hjermann D. O., et al. (2017). Rapid expansion of the invasive oyster Crassostrea gigas at its northern distribution limit in Europe: Naturally dispersed or introduced? PLoS One 12, e0177481. doi: 10.1371/journal.pone.0177481
Avise J. C., Arnold J., Ball R. M., Bermingham E., Lamb T., Neigel J. E., et al. (1987). Intraspecific phylogeography: the mitochondrial DNA bridge between population genetics and systematics. Annu. Rev. Ecol. systematics 18, 489–522. doi: 10.1146/annurev.es.18.110187.002421
Baker P., Austin J. D., Bowen B. W., Baker S. M. (2008). Range-wide population structure and history of the northern quahog (Merceneria merceneria) inferred from mitochondrial DNA sequence data. ICES J. Mar. Sci. 65, 155–163. doi: 10.1093/icesjms/fsn007
Botstein D., White R. L., Skolnick M., Davis R. W. (1980). Construction of a genetic linkage map in man using restriction fragment length polymorphisms. Am. J. Hum. Genet. 32 (3), 314. doi: 10.1016/j.gene.2019.144175
Brown A. (1978). Isozymes, plant population genetic structure and genetic conservation. Theor. Appl. Genet. 52, 145–157. doi: 10.1007/BF00282571
Campanella J. J., Bologna P. A. X., Kim L. E. J., Smalley J. V. (2007). Molecular genetic evidence suggests long island as the geographic origin for the present population of bay scallops in Barnegat Bay, New Jersey. J. Shellfish Res. 26, 303–306. doi: 10.2983/0730-8000(2007)26[303:MGESLI]2.0.CO;2
Chao S., Zhang W., Dubcovsky J., Sorrells M. (2007). Evaluation of genetic diversity and genome-wide linkage disequilibrium among US wheat (Triticum aestivum L.) germplasm representing different market classes. Crop Sci. 47, 1018–1030. doi: 10.2135/cropsci2006.06.0434
Cordeiro G. M., Pan Y.-B., Henry R. J. (2003). Sugarcane microsatellites for the assessment of genetic diversity in sugarcane germplasm. Plant Sci. 165, 181–189. doi: 10.1016/S0168-9452(03)00157-2
Crozier W. W. (2000). Escaped farmed salmon, Salmo salar L., in the Glenarm River, Northern Ireland: genetic status of the wild population 7 years on. Fisheries Manage. Ecol. 7, 437–446. doi: 10.1046/j.1365-2400.2000.00219.x
Djè Y., Heuertz M., Lefebvre C., Vekemans X. (2000). Assessment of genetic diversity within and among germplasm accessions in cultivated sorghum using microsatellite markers. Theor. Appl. Genet. 100, 918–925. doi: 10.1007/s001220051371
Earl D. A., vonHoldt B. M. (2011). STRUCTURE HARVESTER: a website and program for visualizing STRUCTURE output and implementing the Evanno method. Conserv. Genet. Resour. 4, 359–361. doi: 10.1007/s12686-011-9548-7
Ellis J. R., Burke J. M. (2007). EST-SSRs as a resource for population genetic analyses. Heredity 99, 125–132. doi: 10.1038/sj.hdy.6801001
Engle V., Summers J. (1999). Latitudinal gradients in benthic community composition in Western Atlantic estuaries. J. Biogeography 26, 1007–1023. doi: 10.1046/j.1365-2699.1999.00341.x
Evanno G., Regnaut S., Goudet J. (2005). Detecting the number of clusters of individuals using the software STRUCTURE: a simulation study. Mol. Ecol. 14, 2611–2620. doi: 10.1111/j.1365-294X.2005.02553.x
Excoffier L., Lischer H. E. (2010). Arlequin suite ver 3.5: a new series of programs to perform population genetics analyses under Linux and Windows. Mol. Ecol. Resour 10, 564–567. doi: 10.1111/j.1755-0998.2010.02847.x
Felsenstein J. (1993). PHYLIP (phylogeny inference package) (Joseph Felsenstein) (USA: University of Washington).
Feng J., Fu Z., Guo Y., Li J., Guo B., Lu Z., et al. (2020). Strong genetic differentiation of the clam Meretrix lamarckii in the China Sea revealed by mitochondrial DNA marker. Mol. Biol. Rep. 47, 693–702. doi: 10.1007/s11033-019-05177-9
Frankham R., Briscoe D. A., Ballou J. D. (2002). Introduction to conservation genetics (UK: Cambridge university press). doi: 10.1017/CBO9780511808999
Geleta N., Labuschagne M. T., Viljoen C. D. (2006). Genetic diversity analysis in sorghum germplasm as estimated by AFLP, SSR and morpho-agronomical markers. Biodiversity Conserv. 15, 3251–3265. doi: 10.1007/s10531-005-0313-7
Gu X. F., Dong Y. H., Yao H. H., Zhou X. L., Qi X. Y., Lin Z. H. (2015). Microsatellite marker analysis reveals the distinction between the north and south groups of hard clam (Meretrix meretrix) in China. Genet. Mol. Res. 14, 1210–1219. doi: 10.4238/2015.February.6.23
Hall T. A. (1999). “BioEdit: a user-friendly biological sequence alignment editor and analysis program for Windows 95/98/NT,” in Nucleic acids symposium series (Oxford), 95–98.
Hargrove J. S., Sturmer L., Scarpa J., Austin J. D. (2015). Assessment of genetic diversity in wild and aquaculture stocks of Mercenaria mercenaria in Florida. J. Shellfish Res. 34, 355–365. doi: 10.2983/035.034.0218
Harte M. E. (2001). “Chapter 1 systematics and taxonomy,” in Developments in Aquaculture and Fisheries Science. Eds. Kraeuter J. N., Castagna M. (Netherlands: Elsevier), 3–51.
Hedgecock D. (1994). Does variance in reproductive success limit effective population sizes of marine organisms. Genet. Evol. Aquat. organisms 122, 122–134.
Hedgecock D., Chow V., Waples R. S. (1992). Effective population numbers of shellfish broodstocks estimated from temporal variance in allelic frequencies. Aquaculture 108, 215–232. doi: 10.1016/0044-8486(92)90108-W
Hemond E. M., Wilbur A. E. (2011). Microsatellite loci indicate population structure and selection between Atlantic and Gulf of Mexico populations of the bay scallop Argopecten irradians. Mar. Ecol. Prog. Ser. 423, 131–142. doi: 10.3354/meps08922
Hu Z., Song H., Zhou C., Yu Z. L., Yang M. J., Zhang T. (2019). Complete mitochondrial genome of the hard clam (Mercenaria mercenaria). Mitochondrial DNA B Resour 4, 3738–3739. doi: 10.1080/23802359.2019.1681306
Huang Q., Borner A., Roder S., Ganal W. (2002). Assessing genetic diversity of wheat ( Triticum aestivum L.) germplasm using microsatellite markers. Theor. Appl. Genet. 105, 699–707. doi: 10.1007/s00122-002-0959-4
Hughes A. R., Inouye B. D., Johnson M. T., Underwood N., Vellend M. (2008). Ecological consequences of genetic diversity. Ecol. Lett. 11, 609–623. doi: 10.1111/j.1461-0248.2008.01179.x
Islam M. Z., Khalequzzaman M., Prince M., Siddique M. A., Rashid E., Ahmed M. S. U., et al. (2018). Diversity and population structure of red rice germplasm in Bangladesh. PLoS One 13, e0196096. doi: 10.1371/journal.pone.0196096
Jiang L., Nie H., Li C., Li D., Huo Z., Yan X. (2018). The genetic diversity of wild and cultivated Manila clam (Ruditapes philippinarum) revealed by 29 novel microsatellite markers. Electronic J. Biotechnol. 34, 17–21. doi: 10.1016/j.ejbt.2018.05.003
Kapoor M., Mawal P., Sharma V., Gupta R. C. (2020). Analysis of genetic diversity and population structure in Asparagus species using SSR markers. J. Genet. Eng. Biotechnol. 18, 1–10. doi: 10.1186/s43141-020-00065-3
Keller L. F., Waller D. M. (2002). Inbreeding effects in wild populations. Trends Ecol. Evol. 17, 230–241. doi: 10.1016/S0169-5347(02)02489-8
Khan H., Ullah I., Woeste K., Fiaz S., Zeb U., Ghazy A. I., et al. (2023). Population genetics informs new insights into the phytogeographic history of Juglans regia L. Genet. Resour. Crop Evol. 70, 2263–2278. doi: 10.1007/s10722-023-01597-6
Kijewski T., Zbawicka M., Strand J., Kautsky H., Kotta J., Rätsep M., et al. (2019). Random forest assessment of correlation between environmental factors and genetic differentiation of populations: Case of marine mussels Mytilus. Oceanologia 61, 131–142. doi: 10.1016/j.oceano.2018.08.002
Kimura M. (1980). A simple method for estimating evolutionary rates of base substitutions through comparative studies of nucleotide sequences. J. Mol. Evol. 16, 111–120. doi: 10.1007/BF01731581
Kochmann J., Carlsson J., Crowe T. P., Mariani S. (2012). Genetic evidence for the uncoupling of local aquaculture activities and a population of an invasive species–a case study of Pacific oysters (Crassostrea gigas). J. Hered 103, 661–671. doi: 10.1093/jhered/ess042
Kolbe J. J., Glor R. E., Schettino L. R., Lara A. C., Larson A., Losos J. B. (2007). Multiple sources, admixture, and genetic variation in introduced anolis lizard populations. Conserv. Biol. 21, 1612–1625. doi: 10.1111/j.1523-1739.2007.00826.x
Kumar B., Choudhary M., Kumar P., Kumar K., Kumar S., Singh B. K., et al. (2022). Population structure analysis and association mapping for Turcicum leaf blight resistance in tropical maize using SSR markers. Genes (Basel) 13, 618. doi: 10.3390/genes13040618
Lallias D., Boudry P., Batista F. M., Beaumont A., King J. W., Turner J. R., et al. (2015). Invasion genetics of the Pacific oyster Crassostrea gigas in the British Isles inferred from microsatellite and mitochondrial markers. Biol. Invasions 17, 2581–2595. doi: 10.1007/s10530-015-0896-1
Lee C. R., Mitchell-Olds T. (2011). Quantifying effects of environmental and geographical factors on patterns of genetic differentiation. Mol. Ecol. 20, 4631–4642. doi: 10.1111/mec.2011.20.issue-22
Leigh J. W., Bryant D., Nakagawa S. (2015). popart: full-feature software for haplotype network construction. Materials Methods Ecol. Evol. 6, 1110–1116. doi: 10.1111/2041-210X.12410
Lessa E. P. (1990). Multidimensional analysis of geographic genetic structure. Systematic Zoology 39, 242–252. doi: 10.2307/2992184
Letunic I., Bork P. (2021). Interactive Tree Of Life (iTOL) v5: an online tool for phylogenetic tree display and annotation. Nucleic AIDS Res. 49, W293–W296. doi: 10.1093/nar/gkab301
Li Q., Wang Q., Liu S., Kong L. (2011). Selection response and realized heritability for growth in three stocks of the Pacific oyster Crassostrea gigas. Fisheries Sci. 77, 643–648. doi: 10.1007/s12562-011-0369-0
Liang Y., Xu C., Li Q. (2023). Heterosis and genetic diversity of intraspecific hybrids crosses between two selected lines of the Pacific oyster Crassostrea gigas. Aquaculture 569, 739369. doi: 10.1016/j.aquaculture.2023.739369
Lindholm A. K., Breden F., Alexander H. J., CHAN W. K., Thakurta S. G., Brooks R. (2005). Invasion success and genetic diversity of introduced populations of guppies Poecilia reticulata in Australia. Mol. Ecol. 14, 3671–3682. doi: 10.1111/j.1365-294X.2005.02697.x
Liu K., Muse S. V. (2005). PowerMarker: an integrated analysis environment for genetic marker analysis. Bioinformatics 21, 2128–2129. doi: 10.1093/bioinformatics/bti282
Liu G., Zhou L. (2017). Population genetic structure and molecular diversity of the red swamp crayfish in China based on mtDNA COI gene sequences. Mitochondrial DNA A DNA Mapp Seq Anal. 28, 860–866. doi: 10.1080/24701394.2016.1199022
Lu X., Wang H., Liu B., Xiang J. (2013). Three EST-SSR markers associated with QTL for the growth of the clam Meretrix meretrix revealed by selective genotyping. Mar. Biotechnol. 15, 16–25. doi: 10.1007/s10126-012-9453-4
Ma P.-Z., Li H.-M., Liu Y.-M., Li C., Zhang Z., Wang H.-Y. (2022). First confirmed occurrence of the invasive mussel Mytella strigata (Hanley 1843) in Guangdong and Hainan, China, and its rapid spread in Indo-West Pacific regions. BioInvasions Records 11, 947–963. doi: 10.3391/bir.2022.11.4.13
Marescaux J., von Oheimb K. C. M., Etoundi E., von Oheimb P. V., Albrecht C., Wilke T., et al. (2016). Unravelling the invasion pathways of the quagga mussel (Dreissena rostriformis) into Western Europe. Biol. Invasions 18, 245–264. doi: 10.1007/s10530-015-1005-1
Meistertzheim A.-L., Arnaud-Haond S., Boudry P., Thébault M.-T. (2013). Genetic structure of wild European populations of the invasive Pacific oyster Crassostrea gigas due to aquaculture practices. Mar. Biol. 160, 453–463. doi: 10.1007/s00227-012-2102-7
Merceron N. R., Leroy T., Chancerel E., Romero-Severson J., Borkowski D. S., Ducousso A., et al. (2017). Back to America: tracking the origin of European introduced populations of Quercus rubra L. Genome 60, 778–790. doi: 10.1139/gen-2016-0187
Murakami-Sugihara N., Furota T., Okamoto K. (2012). Genetic structure of the exotic hard clam Mercenaria mercenaria in Tokyo Bay, determined using mitochondrial DNA. Fisheries Sci. 78, 569–575. doi: 10.1007/s12562-012-0483-7
Nagy S., Poczaii P., Cernák I., Gorji A. M., Hegedűs G., Taller J. (2012). PICcalc: an online program to calculate polymorphic information content for molecular genetic studies. Biochem. Genet. 50, 670–627. doi: 10.1007/s10528-012-9509-1
Nei M., Kumar S., Takahashi K. (1998). The optimization principle in phylogenetic analysis tends to give incorrect topologies when the number of nucleotides or amino acids used is small. Proc. Natl. Acad. Sci. 95, 12390–12397. doi: 10.1073/pnas.95.21.12390
Nei M., Maruyama T., Chakraborty R. (1975). The bottleneck effect and genetic variability in populations. Evolution 29, 1–10. doi: 10.2307/2407137
Peakall R., Smouse P. E. (2012). GenAlEx 6.5: genetic analysis in Excel. Population genetic software for teaching and research—an update. Bioinformatics 28, 2537–2539. doi: 10.1093/bioinformatics/bts460
Pertoldi C., Bijlsma R., Loeschcke V. (2007). Conservation genetics in a globally changing environment: present problems, paradoxes and future challenges. Biodiversity Conserv. 16, 4147–4163. doi: 10.1007/s10531-007-9212-4
Pritchard J. K., Stephens M., Donnelly P. (2000). Inference of population structure using multilocus genotype data. Genetics 155, 945–959. doi: 10.1093/genetics/155.2.945
Ramanatha Rao V., Hodgkin T. (2002). Genetic diversity and conservation and utilization of plant genetic resources. Plant Cell Tissue Organ Culture 68, 1–19. doi: 10.1023/A:1013359015812
Rice W. R. (1989). Analyzing tables of statistical tests. Evolution 43, 223–225. doi: 10.2307/2409177
Riginos C., Nachman M. (2001). Population subdivision in marine environments: the contributions of biogeography, geographical distance and discontinuous habitat to genetic differentiation in a blennioid fish, Axoclinus nigricaudus. Mol. Ecol. 10, 1439–1453. doi: 10.1046/j.1365-294X.2001.01294.x
Rohfritsch A., Bierne N., Boudry P., Heurtebise S., Cornette F., Lapegue S. (2013). Population genomics shed light on the demographic and adaptive histories of European invasion in the Pacific oyster, Crassostrea gigas. Evolutionary Appl. 6, 1064–1078. doi: 10.1111/eva.12086
Roman J., Darling J. A. (2007). Paradox lost: genetic diversity and the success of aquatic invasions. Trends Ecol. Evol. 22, 454–464. doi: 10.1016/j.tree.2007.07.002
Ropp A. J., Reece K. S., Snyder R. A., Song J., Biesack E. E., McDowell J. R. (2023). Fine-scale population structure of the northern hard clam (Mercenaria mercenaria) revealed by genome-wide SNP markers. Evolutionary Appl. 16, 1422–1437. doi: 10.1111/eva.13577
Rozas J., Ferrer-Mata A., Sanchez-DelBarrio J. C., Guirao-Rico S., Librado P., Ramos-Onsins S. E., et al. (2017). DnaSP 6: DNA sequence polymorphism analysis of large data sets. Mol. Biol. Evol. 34, 3299–3302. doi: 10.1093/molbev/msx248
Schnell R., Brown J., Olano C., Power E., Krol C., Kuhn D., et al. (2003). Evaluation of avocado germplasm using microsatellite markers. J. Am. Soc. Hortic. Sci. 128, 881–889. doi: 10.21273/JASHS.128.6.0881
Serrote C. M. L., Reiniger L. R. S., Silva K. B., dos Santos Rabaiolli S. M., Stefanel C. M. (2020). Determining the polymorphism information content of a molecular marker. Gene 726, 144175. doi: 10.1016/j.gene.2019.144175
Shehzad T., Okuizumi H., Kawase M., Okuno K. (2009). Development of SSR-based sorghum (Sorghum bicolor (L.) Moench) diversity research set of germplasm and its evaluation by morphological traits. Genet. Resour. Crop Evol. 56, 809–827. doi: 10.1007/s10722-008-9403-1
Slim A., Piarulli L., Chennaoui Kourda H., Rouaissi M., Robbana C., Chaabane R., et al. (2019). Genetic structure analysis of a collection of Tunisian durum wheat germplasm. Int. J. Mol. Sci. 20, 3362. doi: 10.3390/ijms20133362
Song L., Xu W., Li C., Li H., Wu L., Xiang J., et al. (2006). Development of expressed sequence tags from the bay scallop, Argopecten irradians irradians. Mar. Biotechnol. 8, 161–169. doi: 10.1007/s10126-005-0126-4
Stoeckle B. C., Araujo R., Geist J., Kuehn R., Toledo C., Machordom A. (2017). Strong genetic differentiation and low genetic diversity of the freshwater pearl mussel (Margaritifera margaritifera L.) in the southwestern European distribution range. Conserv. Genet. 18, 147–157. doi: 10.1007/s10592-016-0889-3
Szamosi C., Solmaz I., Sari N., Bársony C. (2010). Morphological evaluation and comparison of Hungarian and Turkish melon (Cucumis melo L.) germplasm. Scientia Hortic. 124, 170–182. doi: 10.1016/j.scienta.2009.12.024
Tamura K., Stecher G., Kumar S. (2021). MEGA11: molecular evolutionary genetics analysis version 11. Mol. Biol. Evol. 38, 3022–3027. doi: 10.1093/molbev/msab120
Tan Y., Fang L., Qiu M., Huo Z., Yan X. (2020). Population genetics of the Manila clam (Ruditapes philippinarum) in East Asia. Sci. Rep. 10, 21890. doi: 10.1038/s41598-020-78923-w
Thomson M. J., Septiningsih E. M., Suwardjo F., Santoso T. J., Silitonga T. S., McCouch S. R. (2007). Genetic diversity analysis of traditional and improved Indonesian rice (Oryza sativa L.) germplasm using microsatellite markers. Theor. Appl. Genet. 114, 559–568. doi: 10.1007/s00122-006-0457-1
Traulsen A., Sieber M. (2021). Evolutionary ecology theory - microbial population structure. Curr. Opin. Microbiol. 63, 216–220. doi: 10.1016/j.mib.2021.08.001
Tsutsui N. D., Suarez A. V., Holway D. A., Case T. J. (2001). Relationships among native and introduced populations of the Argentine ant (Linepithema humile) and the source of introduced populations. Mol. Ecol. 10, 2151–2161. doi: 10.1046/j.0962-1083.2001.01363.x
Wang X., Kong L., Chen J., Matsukuma A., Li Q. (2017). Phylogeography of bivalve Meretrix petechialis in the Northwestern Pacific indicated by mitochondrial and nuclear DNA data. PloS One 12, e0183221. doi: 10.1371/journal.pone.0183221
Wang Y., Wang A., Guo X. (2010). Development and characterization of polymorphic microsatellite markers for the northern Quahog Mercenaria mercenaria (Linnaeus 1758). J. Shellfish Res. 29, 77–82. doi: 10.2983/035.029.0130
Wang L., Zhang H., Song L., Guo X. (2007). Loss of allele diversity in introduced populations of the hermaphroditic bay scallop Argopecten irradians. Aquaculture 271, 252–259. doi: 10.1016/j.aquaculture.2007.06.020
Ward R. D., English L. J., McGoldrick D. J., Maguire G. B., Nell J. A., Thompson P. A. (2000). Genetic improvement of the Pacific oyster Crassostrea gigas(Thunberg) in Australia. Aquaculture Res. 31, 35–44. doi: 10.1046/j.1365-2109.2000.00388.x
Weir B. S., Cockerham C. C. (1984). Estimating F-statistics for the analysis of population structure. evolution 38, 1358–1370. doi: 10.2307/2408641
Xu Q., Zheng J., Nie H., Wang Q., Yan X. (2020). Genetic diversity and population structure of Meretrix petechialis in China revealed by sequence-related amplified polymorphism markers. PeerJ 8, e8723. doi: 10.7717/peerj.8723
Ye Y., Yan C., Senanan W., Guo B., Xu K., Lü Z. (2020). Genetic population structure of the hard clam Meretrix meretrix along the Chinese coastlines revealed by microsatellite DNA markers. Front. Mar. Sci. 7. doi: 10.3389/fmars.2020.00516
Yi C. H., Yoon M., Kim J. M., Kim I. H., Cho I. Y., An H. S. (2021). Genetic analysis and population genetic structure of hard-shelled mussel, Mytilus coruscus Gould 1861 (Mytiloida: Mytilidae) from the coasts of South Korea based on mitochondrial cytochrome oxidase (COI) gene sequences. Genes Genomics 43, 577–585. doi: 10.1007/s13258-021-01073-4
Zhan A.-B., Bao Z. M., Wang X. L., Hu J. J. (2005). Microsatellite markers derived from bay scallop Argopecten irradians expressed sequence tags. Fisheries Sci. 71, 1341–1346. doi: 10.1111/j.1444-2906.2005.01100.x
Zhang H., Liu X., Zhang G., Wang C. (2007). Growth and survival of reciprocal crosses between two bay scallops, Argopecten irradians concentricus Say and A. irradians irradians Lamarck. Aquaculture 272, S88–S93. doi: 10.1016/j.aquaculture.2007.08.008
Zhebentyayeva T., Reighard G., Gorina V., Abbott A. (2003). Simple sequence repeat (SSR) analysis for assessment of genetic variability in apricot germplasm. Theor. Appl. Genet. 106, 435–444. doi: 10.1007/s00122-002-1069-z
Zheng J.-H., Nie H.-T., Yang F., Yan X.-W. (2019). Genetic variation and population structure of different geographical populations of Meretrix petechialis based on mitochondrial gene COI. J. Genet. 98, 1–9. doi: 10.1007/s12041-019-1111-4
Zheng S., Zhang T., Tu K., Li L., Liu Z., Wu B., et al. (2023). Population genetics of manila clam (Ruditapes philippinarum) in China inferred from microsatellite markers. Biol. (Basel) 12, 557. doi: 10.3390/biology12040557
Keywords: Mercenaria mercenaria, microsatellite, mtDNA COI, germplasm evaluation, origin tracing
Citation: Wang J, Xue D, Yang M, Ji Y, Song H, Zhou C, Shi P, Li Y, Guo Y, Meng F, Lai C, Cheng S and Zhang T (2024) Germplasm evaluation and identification of the population source of hard clam (Mercenaria mercenaria) in China using SSR and COI markers. Front. Mar. Sci. 11:1362003. doi: 10.3389/fmars.2024.1362003
Received: 27 December 2023; Accepted: 20 March 2024;
Published: 05 April 2024.
Edited by:
Xiujun Sun, Chinese Academy of Fishery Sciences (CAFS), ChinaCopyright © 2024 Wang, Xue, Yang, Ji, Song, Zhou, Shi, Li, Guo, Meng, Lai, Cheng and Zhang. This is an open-access article distributed under the terms of the Creative Commons Attribution License (CC BY). The use, distribution or reproduction in other forums is permitted, provided the original author(s) and the copyright owner(s) are credited and that the original publication in this journal is cited, in accordance with accepted academic practice. No use, distribution or reproduction is permitted which does not comply with these terms.
*Correspondence: Tao Zhang, tzhang@qdio.ac.cn; ShunFeng Cheng, sfcheng@qau.edu.cn