Extraction and analysis of the sea ice parameter dataset of the Bohai Sea from 2011 to 2021 based on GOCI
 Ran Yan1
  Xi Zhang2
  Wenlong Bi1
  Ning Wang3
  Yiding Zhao3
  Luchuan Bi1
  Haipeng Guan1
  Yunbo Liu1
  Fuxi Duan1
  Meijie Liu1*
- 1College of Physical Science, Qingdao University, Qingdao, China
- 2First Institute of Oceanography, Ministry of Natural Resources, Qingdao, China
- 3North China Sea Marine Forecasting Centre of State Oceanic Administration, Qingdao, China
The Bohai Sea and its surrounding areas are rich in oil and natural gas and play an important role in industry, agriculture and the economy. However, the Bohai Sea suffers severely from sea ice in the winter. While previous research has predominantly focused on methods for retrieving sea ice parameters in the Bohai Sea, analyses of their long-term statistical patterns have been limited. The Geostationary Ocean Color Imager (GOCI) is the first geostationary satellite for ocean color remote sensing, offering high spatial and temporal resolution, which greatly facilitates the extraction of Bohai Sea ice parameters. Utilizing GOCI data, we systematically extracted relevant sea ice parameters for the Bohai Sea region from 2011 to 2021. These parameters include sea ice concentration, sea ice thickness, and sea ice drift. We conducted a comprehensive statistical analysis of the long-term sea ice changes in the Bohai Sea and found that the development process of winter sea ice area is different from the sea ice thickness, and the direction of sea ice drift is basically unchanged. Then we developed statistical models linking sea ice parameters with ocean dynamic factors such as temperature, wind, and drift currents. Among them, the correlation coefficient between the predicted value and the measured value of the sea ice area model is the highest, reaching 0.8382. Furthermore, we examined the previously unexplored relationship between daily sea ice area, sea ice thickness, and accumulated temperature with their respective starting temperatures and accumulation periods. This study provides critical data to support Bohai Sea ice monitoring and marine environmental research. The results of this study contribute to a better understanding of sea ice change trends in the Bohai Sea and inform the development of disaster prevention and mitigation measures.
1 Introduction
The Bohai Sea is globally one of the regions with the lowest latitude in which ice forms, and extensive ice coverage occurs during the winter (Yan et al., 2019a). The Bohai Sea region benefits from convenient maritime transportation and a strategic geographical location, making it one of the most economically developed areas in northern China. However, during the winter, the Bohai Sea is frequently the site of severe sea ice disasters, leading to blocked waterways, the closure of ports, interruption of maritime traffic, and adverse effects on offshore oil and gas exploration and production. Additionally, collisions with passing vessels and offshore structures result in significant economic losses (Zhang et al., 2013; Tao et al., 2018). For example, major ice freezes in the Bohai Sea in 1969 and 1977 caused the collapse of offshore oil platforms, followed by varying degrees of shaking of oil platforms in 1978, 1980, 1981, 1984 and 1985 (Yang, 2000). In the winter of 2009-2010, the worst sea ice disaster in 30 years occurred in the Bohai Sea, and the direct economic loss reached 930 million dollars (Bulletin of China Marine Disaster, 2023). Therefore, to ensure safe navigation and marine production in the winter and safeguard economic security in the Bohai Sea, it is crucial to establish accurate, timely, high spatial resolution, and high temporal resolution long-term monitoring of Bohai Sea ice. The sea ice concentration, sea ice thickness, and sea ice drift velocity are the primary parameters necessary for monitoring sea ice in the Bohai Sea. Establishing a standardized multiparameter dataset for long-term sequences is essential for understanding the statistical patterns of long-term variations in Bohai Sea ice. Studying the impact of ocean dynamic factors on these sea ice parameters is important for Bohai Sea ice detection and operational monitoring. It enables us to conduct experiments on the mechanisms of sea ice disasters and develop a classification system for sea ice disasters (Gu et al., 2013). This effort also serves as a valuable reference for sea ice forecasting, disaster prevention and reduction, and policy formulation in the Bohai region.
Unlike the Arctic and other high-latitude regions, the Bohai Sea experiences ice formation only during the winter months, exhibiting a distinct regional characteristic. Remote sensing technology, due to its efficiency, speed, and wide coverage, has become the primary means for monitoring sea ice in the Bohai Sea. It includes optical sensors, radiometers, and synthetic-aperture radar (SAR), among which radiometers have lower resolution, and there is limited availability of SAR data for Bohai Sea ice. Consequently, the current state of sea ice information acquisition in the Bohai region heavily relies on optical satellites with large data volumes and high spatial resolutions, such as MODIS. At present, the focus of sea ice monitoring in the Bohai Sea primarily revolves around researching methods for sea ice parameter retrieval during specific periods, with relatively few studies dedicated to investigating the statistical patterns of medium- to long-term sea ice distribution and its influencing factors.
In terms of the research on sea ice parameters in the Bohai Sea, these primarily encompass physical parameters such as sea ice concentration, sea ice area, and sea ice thickness, as well as dynamic parameters such as sea ice drift velocity. Regarding the investigation of sea ice concentration and sea ice area retrieval methods, Shi and Wang (2012a), Shi and Wang (2012b) introduced a regional optimized sea ice detection algorithm based on the spectral characteristics of sea ice reflection and MODIS data from February 12, 2010. This algorithm significantly enhanced sea ice detection in the Bohai Sea region. The authors coupled this with the analysis of ground temperature data from the National Centers for Environmental Prediction (NCEP) to quantify the interannual variations in sea ice area and regional sea ice characteristics during the winter of 2009-2010. Moreover, they examined the relationship between sea ice and climate variations in the Bohai Sea. Su et al. (2015) extracted texture features and surface temperature from MODIS images and used support vector machines to distinguish between sea ice and open water. They estimated the sea ice extent in Bohai Bay on January 15, 2010, achieving an accuracy of 87.17%. Su et al. (2019) proposed a sea ice information index based on 300 m resolution Sentinel-3 Ocean and Land Color Instrument (OLCI) images, which monitored the spatial and temporal distribution of Bohai Sea ice during the winter of 2017-2018, achieving an accuracy of 94.83%. This index can effectively extract sea ice extent from turbid water and is suitable for winter Bohai Sea ice monitoring. Li and Yang (2020) proposed a linear spectral unmixing method based on multiconstraint endmembers (LSU-MCE) for sea ice and sea water discrimination in the Bohai Sea using MODIS images from 2016 to 2017 with an accuracy of 98.25%. This method can eliminate interference caused by suspended sediment. Regarding sea ice thickness, Xie et al. (2006) conducted a one-year sea ice spectral measurement and analysis during a controlled experiment in the Bohai Sea from 2003 to 2005, studying the correlation between sea ice reflectance and thickness under different environmental conditions. Ji et al. (2007) derived a theoretical model for sea ice thickness based on airborne microwave radiometer (ABMR) data, calculated the detectable range of sea ice thickness by ABMR, and provided the detection results for Bohai Sea ice conditions. Yuan et al. (2012) proposed a sea ice thickness inversion model based on NOAA/AVHRR data by analyzing the relationship between sea ice thickness and reflectance, as well as the differences between sea ice and sea water. The average error of their model was below 30%, and it was applied to extract sea ice thickness in the Bohai Sea from 1987 to 2009. Liu et al. (2016) established a model between sea ice thickness and the shortwave broadband albedo of the geostationary ocean color imager (GOCI), which was applied to extract Bohai Sea ice thickness during the winters of 2012 to 2014. The relative error of their results compared to measured data was 14.2%. Zhu et al. (2022) achieved higher-precision automated extraction of Bohai Sea ice extent using MODIS data. They improved the sea ice thickness retrieval model based on reflectance indices and compared their results with measurements from oil platforms. This refinement led to a significantly reduced average error of 93% compared to the previous model. Sea ice drift velocity is one of the sea ice dynamic parameters. Sea ice drift in the Bohai Sea during winter causes severe economic losses, and the speed of sea ice drift is an important indicator for assessing Bohai Sea ice disasters. In recent years, research on sea ice drift in the Bohai Sea during winter has mainly focused on satellite remote sensing observations. However, the low spatial resolution and long revisit periods of polar and sun synchronous orbit satellites make them unsuitable for monitoring sea ice drift in the Bohai Sea. The research on sea ice drift in this region has been limited (Lang et al., 2014; Yan et al., 2019b). Lang et al. (2014) used the GOCI, which provides frequent spatial coverage and high spatial resolution, making it well suited for tracking sea ice drift in the Bohai Sea. They employed the maximum cross-correlation (MCC) method to achieve daily tracking of sea ice drift for 2011-2012. Yan et al. (2019b) conducted a free drift experiment in the Bohai Sea during the melting period (February 2017). By observing the movement trajectories of simulated isolated ice, ocean currents, and wind speeds, they obtained valuable insights into the motion patterns during both ice-free and freezing periods in the Bohai Sea.
The statistical analysis of sea ice distribution patterns is a pivotal in the monitoring of sea ice in the Bohai Sea. However, there is a substantial dearth of statistical analysis regarding the medium- to long-term distribution and changes in Bohai Sea ice. Previous research on the medium- to long-term patterns in the Bohai Sea primarily focused on one or a few sea ice physical parameters, and there have been almost no analyses pertaining to the medium- to long-term trends in sea ice dynamic parameters. Gong et al. (2022) utilized images from China’s second-generation polar orbiting meteorological satellites FY-3A/B/C to extract sea ice areas in the Bohai Sea and northern Yellow Sea from December 2008 to March 2019. They analyzed the spatiotemporal distribution characteristics of sea ice and its relationship with climate factors, ultimately developing a preliminary sea ice forecasting model based on climate factors. Gu et al. (2013) estimated the winter sea ice thickness and area in the Bohai Sea from 1987 to 2011 using satellite data from the National Oceanic and Atmospheric Administration (NOAA) and transformed them into a sea ice disaster index, categorizing different levels of sea ice disaster risk. Therefore, in the realm of statistical analysis regarding sea ice changes in the Bohai Sea, we must draw upon research experiences from polar regions and other seasonal ice areas. For instance, long-term monitoring of Arctic sea ice has revealed significant losses in multiyear ice, while seasonal ice continues to increase (Cai et al., 2021), resulting in thinner Arctic sea ice cover, which is more sensitive to atmospheric influences. Rigor and Wallace (2004) implemented statistical analyses of Arctic ice age and changes in summer sea ice extent, showing that ice age can explain variations in summer sea ice extent. Ke and Wang (2018), using CryoSat-2 altimetry data and OSI SAF sea ice concentration and sea ice type products, analyzed the seasonal and interannual variations in Arctic sea ice area, thickness, and volume from 2010 to 2017. They combined these findings with NCEP reanalysis data to explore the impact of Arctic temperature anomalies during the melting season and summer wind anomalies on sea ice changes. Hao et al. (2020) investigated abrupt changes and interannual variations in seasonal Arctic winter sea ice from 1979 to 2019. Cai et al. (2021) analyzed the changing trends in summer Arctic sea ice over 168 years in six regions of the Arctic and identified the primary driving factors behind the accelerated reduction in summer sea ice. Deng and Dai (2022), through the analysis of observational data and model simulations, discovered that the interaction between sea ice and the atmosphere increased the sea ice cover from the North Atlantic to the Barents-Kara Sea. For seasonal ice regions in mid-to-high latitudes, the nature of sea ice is significantly influenced by its geographical environment. The geographical environment determines the seasonal and interannual variations in sea ice. Mustapha and Saitoh (2008), utilizing seven years of satellite data from SSMI and SeaWiFS (1998-2004), studied the formation of sea ice along the coast of Hokkaido in the Okhotsk Sea and analyzed the interannual variations in sea ice coverage. Yi et al. (2011) obtained sea ice freeboard heights and sea ice thickness in the Weddell Sea during the period from 2003 to 2009 using ICESat data. Sea ice freeboard and thickness displayed pronounced seasonal variations, reflecting the annual growth and decay cycle of the pack ice. Kumar et al. (2021) conducted an analysis based on satellite and reanalysis measurements of the sea ice-ocean-atmosphere changes and trends in the Weddell Sea from 1979 to 2019, along with the factors influencing sea ice in different seasons. Min et al. (2021) quantified sea ice volume changes in Baffin Bay from 2011 to 2016. As evident, whether in polar regions or seasonal ice areas, understanding the interannual variations in parameters such as sea ice area and thickness is crucial. Furthermore, delving deeper into the factors affecting sea ice growth and decay and analyzing the primary influences of factors such as temperature, wind, and currents on sea ice changes is essential for gaining a better understanding of Bohai Sea ice and formulating appropriate protection measures. Therefore, it is imperative to conduct comprehensive statistical research on the medium- to long-term variations in Bohai Sea ice, focusing on the following aspects:
(1) Interannual variations in sea ice thickness and sea ice drift.
(2) The influence of temperature, wind, and current on various sea ice parameters, such as the relationship between sea ice physical parameters and temperature and wind, and the connection between sea ice dynamic parameters and wind and current fields. Temperature, wind fields, and current fields are collectively referred to as ocean dynamic parameters.
(3) Analysis of influencing factors at different stages of sea ice development, including whether the impacts of temperature and wind speed on sea ice physical parameters differ during the growth ice period, development ice period, and melting ice period.
To address these questions, in this study, we utilized a continuous 10-year dataset of high spatial resolution (500 m) and high temporal resolution (1 h) GOCI data during the winter seasons in the Bohai Sea from 2011 to 2021. We established a long-term standardized multiparameter dataset encompassing sea ice thickness, sea ice concentration, sea ice area, and sea ice drift. We investigated the statistical patterns of long-term distribution and changes in each sea ice parameter, as well as the correlations among these parameters. Finally, we developed statistical models that relate sea ice parameters at different stages to ocean dynamic factors and analyzed their primary driving factors.
2 Data and method
2.1 Study area
The Bohai Sea is between 37°N to 41°N latitude and 117°E to 121°E longitude. It is a semi enclosed inland sea surrounded by the provinces of Shandong, Hebei, Tianjin, and Liaoning (Yan et al., 2017). To the east, it connects with the Yellow Sea, with the demarcation line running from Laotieshan (38.72°N, 121.29°E) to Penglaijiao (37.83°N, 120.75°E). The Bohai Sea can be primarily divided into four main regions: Liaodong Bay, Laizhou Bay, Bohai Bay, and the Central Bohai Sea, as shown in Figure 1. Liaodong Bay is in the northern Bohai Sea, encompassing waters north of 39°20’N. It has relatively deeper waters, with a maximum depth of approximately 30 m, and it covers an area of approximately 28,000 km2. Laizhou Bay, located in the southern part of the Bohai Sea, includes waters south of 38°N. It has a maximum depth of over 18 m and covers an area of approximately 11,000 km2. Bohai Bay, situated in the western part of the Bohai Sea, encompasses waters west of 118°E longitude. It has a maximum depth of approximately 28 m and covers an area of approximately 14,000 km2. The Central Bohai Sea, the largest in terms of area and deepest in the Bohai Sea, covers an area of approximately 19,800 km2 and reaches a maximum depth of 78 m. Due to its distance from river mouths and the continental landmass, the Central Bohai Sea experiences less influence from land and river runoff. Sea ice in this region is primarily transported from Liaodong Bay and tends to be lighter in extent. Consequently, in studies related to sea ice conditions in the Bohai Sea, the Central Bohai Sea area is often grouped with Liaodong Bay.
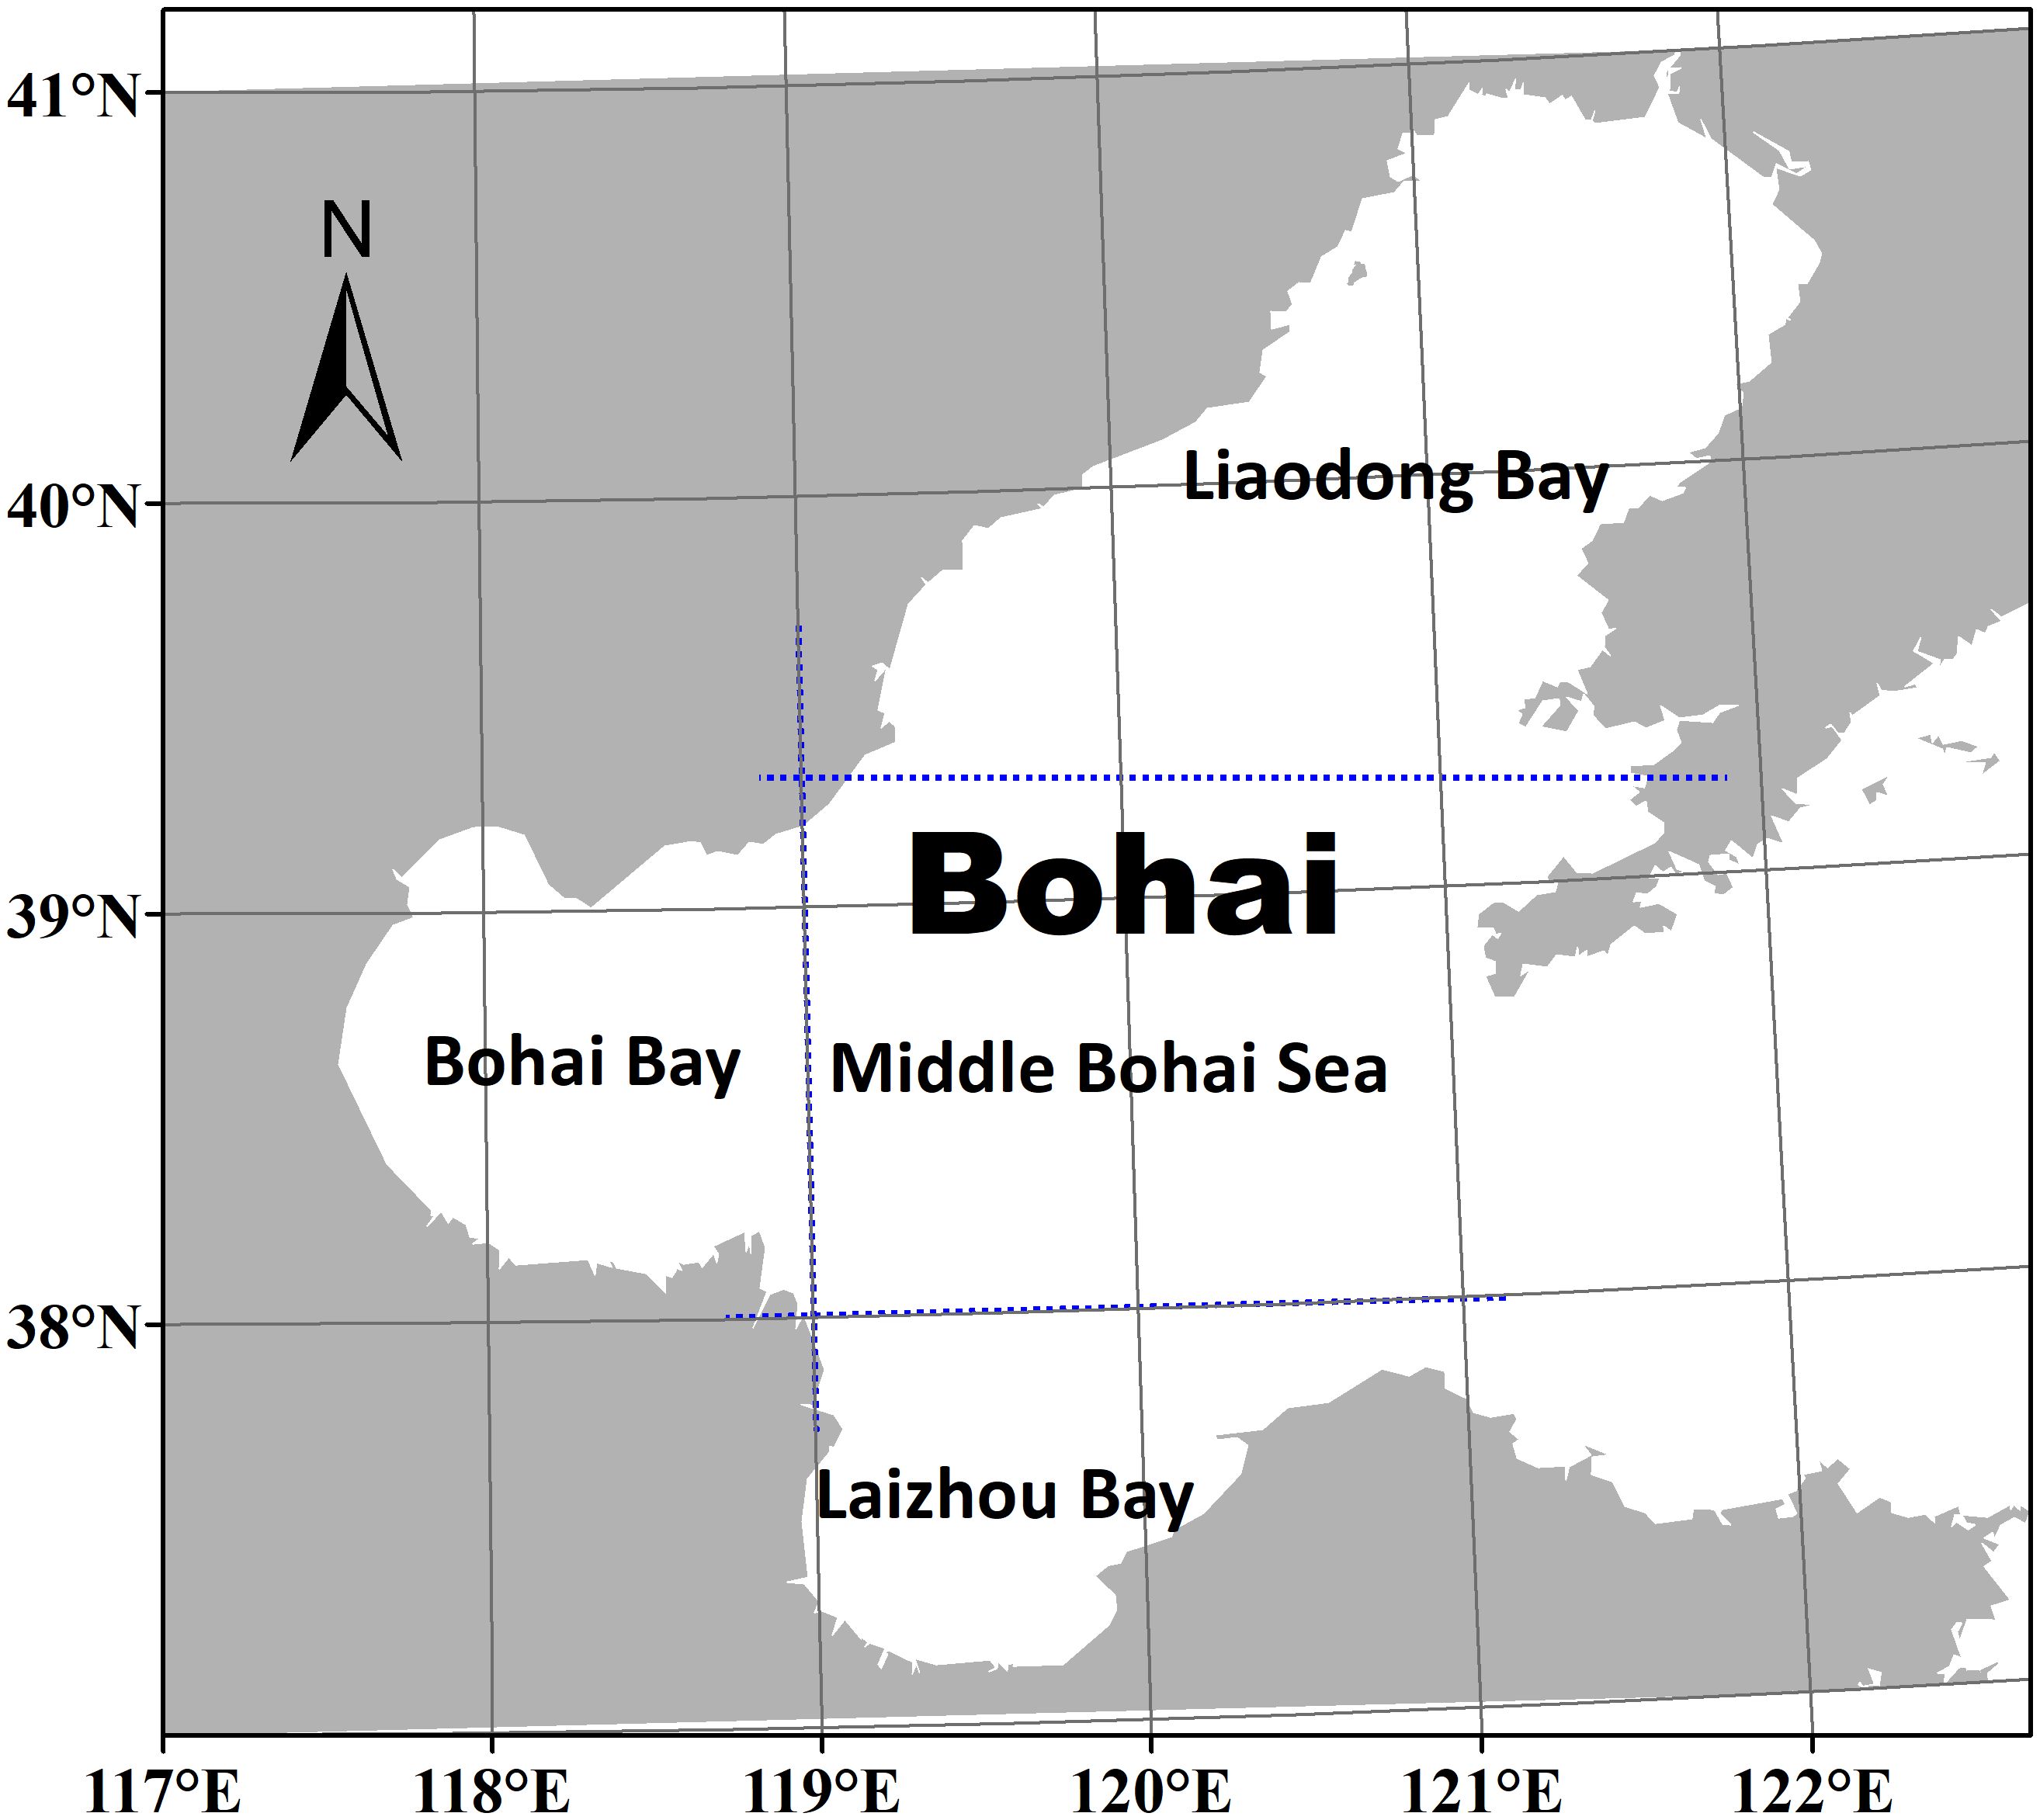
Figure 1 The geographical location of the Bohai Sea.
Liaodong Bay is the most severely affected by sea ice among the three bays in the Bohai Sea. In contrast, Bohai Bay and Laizhou Bay experience milder sea ice conditions. The ice period in all three bays varies little every year. Table 1 provides statistics on the initial and final dates of sea ice for the period from 2011 to 2021. Liaodong Bay, located in the northernmost part of China, experiences sea ice formation earliest in the Bohai Sea region. Sea ice appears along the northern coast of Liaodong Bay and gradually extends southward. The ice period in this bay lasts for approximately three months; ice typically starts to freeze in mid-December and substantially disappears by mid-March of the following year. During the development ice period, the maximum width of the coastal fast ice reaches 2 km, with a thickness ranging from 20 to 40 cm. Due to the influence of fast ice along the western coast, both Bohai Bay and Laizhou Bay have relatively fixed ice periods each year. Freezing phenomena usually begin around early January, and ice disappears by late February, resulting in an ice period of less than two months. The extents of sea ice in Bohai Bay and Laizhou Bay vary significantly between heavy ice years and light ice years. In heavy ice years, sea ice extends from the coastal fast ice to cover the entire bay. However, in light ice years, the ice period is characterized by coastal fast ice only.
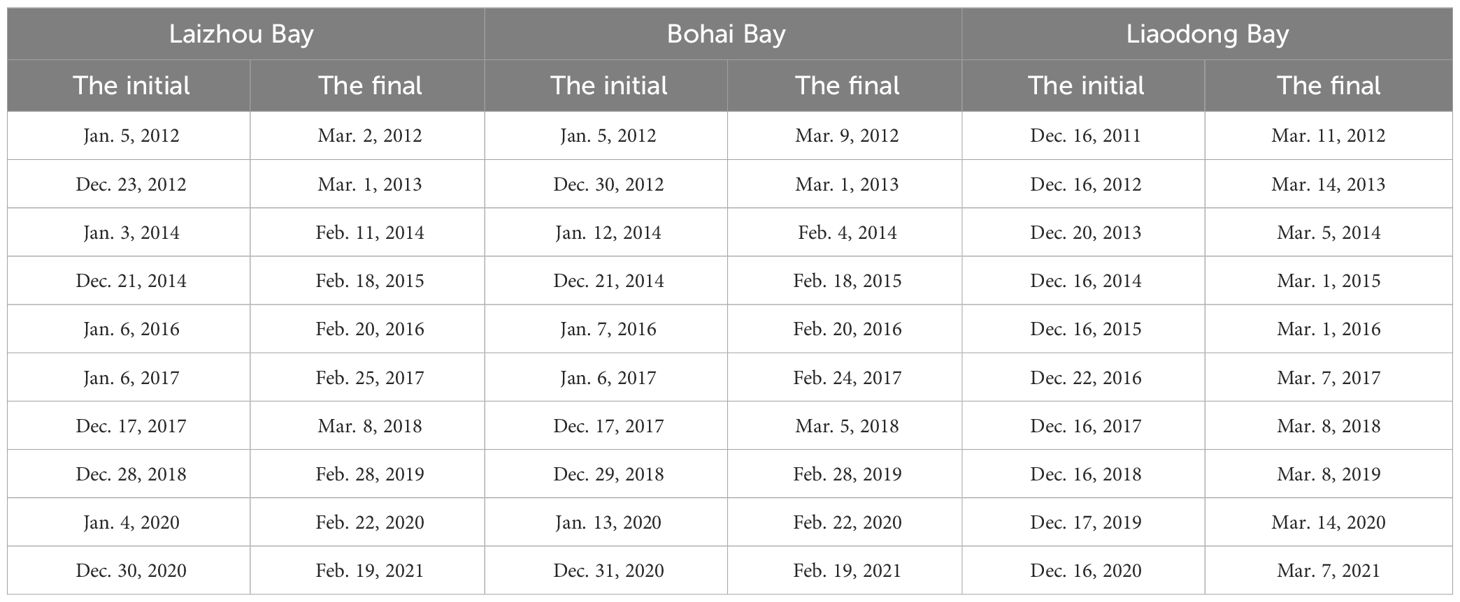
Table 1 The initial ice dates and final ice dates of various bays in the Bohai Sea.
2.2 Data
2.2.1 Geostationary ocean color image
Korea successfully launched the Communication Ocean and Meteorological Satellite (COMS) in 2010, which carried three sensors responsible for ocean meteorology, ocean monitoring, and satellite communication in the Ka band. The GOCI is the first Earth geostationary orbit ocean color remote sensing satellite, serving as one of the effective payloads on the COMS. Its primary mission is ocean monitoring (Yan et al., 2017).
The imaging area of GOCI is fixed, with a center position at 130°E, 36°N and a spatial resolution of 500 m. The original size of the GOCI images is 5568×5685 pixels. GOCI plays a crucial role in monitoring the dynamic changes in its fixed region, such as tidal dynamics, marine phenomena, red tide, river plumes, and sediment transport. GOCI image collection takes place between 8:15 and 15:45 Beijing time, with a time interval of 1 hour between two consecutive images. Considering the illumination and melting of sea ice caused by increased temperature, Bohai Sea ice experiments are often conducted between 10:00 and 12:00 Beijing time (Xie et al., 2006). In this study, the third GOCI image is used for sea ice concentration and sea ice thickness inversion, and the sea ice drift velocity is calculated between the third and fourth GOCI images. The bands and original image of GOCI are seen in the ‘Supplementary Material’ file. A total of 1806 GOCI L1B level data points were downloaded for this study. After excluding data affected by cloud cover and ice-free conditions, 376 scenes were used for sea ice physical parameter inversion, and 702 scenes were used for sea ice dynamical parameter inversion.
2.2.2 European center for medium-range weather forecasts
The ocean dynamics data in this study were obtained from the European Centre for Medium-Range Weather Forecasts (ECMWF) ERA5 reanalysis dataset (Hersbach et al., 2023), with a horizontal resolution of 0.25° and a temporal resolution of 1 hour. ERA5 is the fifth-generation reanalysis dataset developed by ECMWF, covering hourly estimates from 1959 to the present. The more ERA5 data description are seen in the ‘Supplementary Material’ file. The selected parameters include sea-level 2 m air temperature, sea-level 10 m wind speed, and surface ocean stokes current drift velocity in the Bohai Sea region.
2.3 Extraction of sea ice parameters based on GOCI
The monitoring of sea ice in the Bohai Sea primarily involves the extraction and analysis of parameters such as sea ice concentration, sea ice thickness, and sea ice drift velocity. To meet the operational needs of sea ice monitoring, this study employed standardized preprocessing techniques on a decade of GOCI data, specifically focusing on the characteristics of sea ice in the Bohai Sea. These preprocessing steps included atmospheric correction and sea ice range extraction. Based on existing inversion methods for Bohai Sea ice parameters using GOCI data (Lang et al., 2014; Liu et al., 2016), we followed a unified standard to extract various sea ice parameters. This involved establishing equations for solar shortwave albedo using GOCI data and extracting sea ice thickness, sea ice concentration, and sea ice area. Additionally, the maximum cross-correlation method was utilized to determine the sea ice drift velocity in the Bohai Sea. As a result, in this study, we constructed a standardized and normalized dataset of multiple sea ice parameters for the Bohai Sea, ensuring consistency and reliability among the data. Flowchart is seen in the ‘Supplementary Material’ file.
2.3.1 Data preprocessing
The GOCI provides L1B level data, which only includes denoising and geometric correction of the raw satellite-received data. Therefore, additional atmospheric correction and sea ice range selection are necessary for the GOCI data. To ensure the standardization and consistency of the preprocessing procedures and methods for the 10-year GOCI data, a uniform approach was applied.
2.3.1.1 Atmospheric correction
Atmospheric correction is crucial for eliminating various atmospheric effects during image acquisition and obtaining accurate sea ice reflectance, which is essential for inverting sea ice parameters. Yeom and Kim (2013) conducted atmospheric correction on GOCI data using the 6S model. He et al. (2013) applied the UV-AC algorithm for atmospheric correction on GOCI data and successfully extracted nearshore total suspended sediment concentrations. Ahn et al. (2012) utilized the SeaWiFS method for atmospheric correction on GOCI, effectively eliminating the impact of multiple scattering. This method has been integrated into the official GOCI Data Processing System (GDPS). In this study, the GDPS system, namely, the SeaWiFS method, was adopted for atmospheric correction, resulting in the GOCI L2C product with Ralyeigh scattering removed. Subsequently, the “dark pixel” method was applied to eliminate aerosols and other atmospheric effects from the obtained products. The “dark pixel” method is widely used in various scientific research and monitoring projects for atmospheric correction (Liu et al., 2016), with the aim of obtaining accurate surface reflectance data. Based on the aforementioned atmospheric correction methods, atmospheric-corrected GOCI images were obtained for further analysis.
2.3.1.2 Sea ice range selection
Optical remote sensing is susceptible to the influence of cloud and fog weather, making the determination of sea ice extent a crucial step in distinguishing sea ice, land, and open water. In optical remote sensing data, there are significant spectral differences between land, sea ice, and open water, making it relatively easy to distinguish them in the images. Therefore, in this study, we adopted a visual interpretation method to determine the extent of sea ice.
Sea ice parameters are mainly divided into sea ice physical parameters (sea ice thickness, sea ice area, and sea ice concentration) and sea ice dynamic parameters (sea ice drift velocity). In this study, a multiparameter dataset of Bohai Sea ice was established based on GOCI data during the service period.
2.3.2 Sea ice physical parameters
2.3.2.1 Sea ice thickness
Numerous studies have found a close correlation between sea ice thickness and sea ice albedo. In this study, an exponential function relating sea ice thickness to sea ice albedo was employed for thickness extraction. Initially, concurrent MODIS data with image acquisition time intervals not exceeding 35 minutes from GOCI data were selected to obtain the shortwave broadband albedo of sea ice. A relationship between MODIS shortwave broadband albedo and preprocessed reflectance in various GOCI data bands was established (Liu et al., 2016) , as shown in Equation 1:
Next, the relationship between sea ice thickness and sea ice shortwave broadband albedo was established using the equation proposed by Grenfell and Perovich (1984) based on sea ice optical theory. This model function is solely dependent on the physical properties of sea ice and is independent of the sensor, as shown in Equation 2:
where is the sea ice shortwave broadband albedo; is the value of sea ice albedo at the maximum sea ice thickness, set to 0.7 for the Bohai Sea; is the albedo of open water, set to 0.06; and is the albedo attenuation coefficient, set to 1.209. This study used the shortwave broadband albedo calculated from GOCI data in various bands to invert sea ice thickness using the above equation. The calculated sea ice thickness results for February 1, 2016 are shown in Figure 2A.
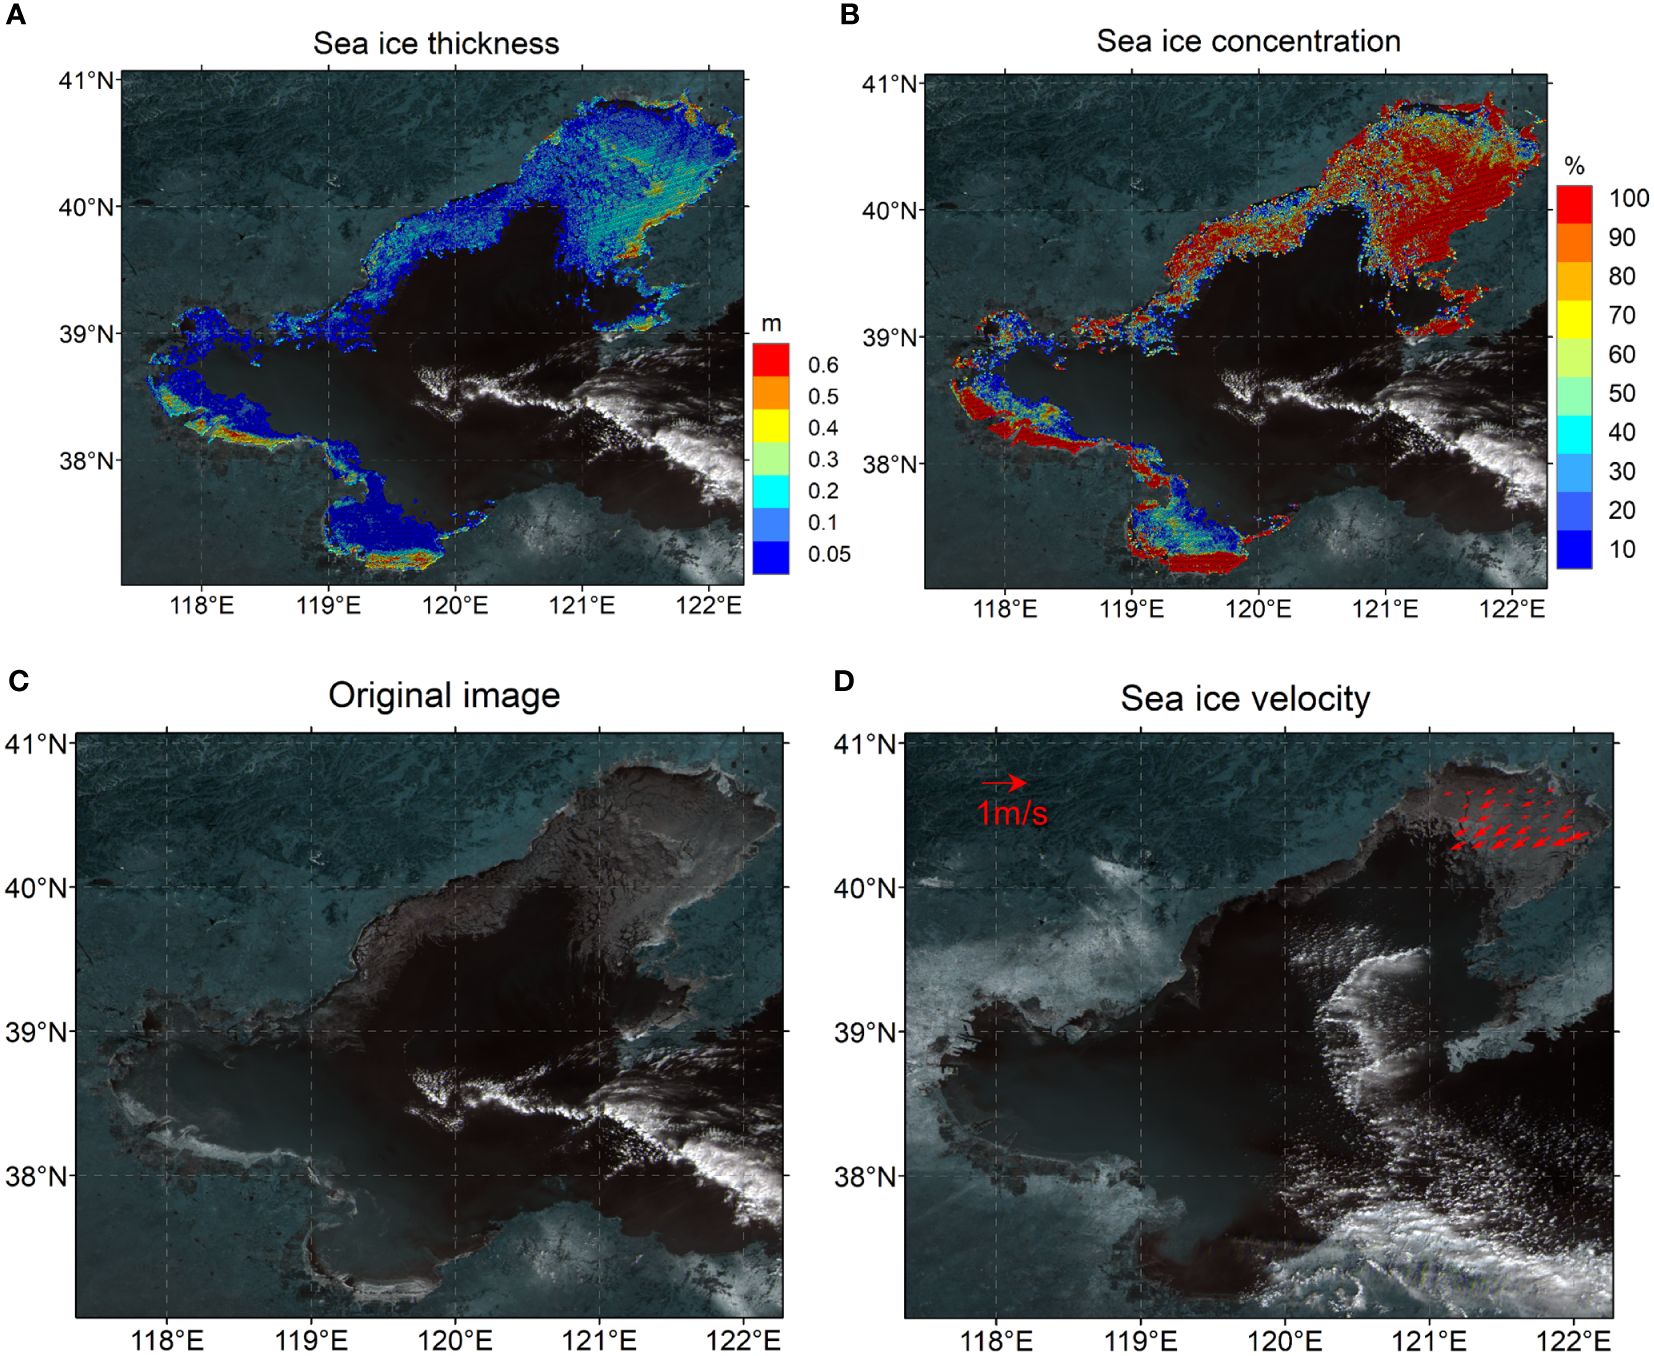
Figure 2 The results of sea ice parameter. (A) Sea ice thickness on February 1, 2016. (B) Sea ice concentration on February 1, 2016. (C) The original image on February 1, 2016. R: 555nm, G: 660nm, B: 680nm. (D) Sea ice drift on January 24, 2018.
2.3.2.2 Sea ice concentration and sea ice area
In this study, sea ice concentration was calculated using the shortwave mean values of sea ice and open water. The sea ice concentration for each pixel of GOCI data was obtained by taking the difference between the shortwave albedo of that pixel and the mean shortwave albedo of open water and then dividing it by the difference between the shortwave albedo of sea ice and the mean shortwave albedo of open water. The specific calculation formula is as shown in Equation 3:
In the formula, represents the shortwave albedo of open water, set to 0.06, and represents the shortwave albedo of sea ice, calculated through the mean value. If the sea ice concentration for a pixel is greater than 50%, it is considered to have sea ice, and the size of each pixel is 500 m × 500 m. From this, the sea ice area for each day can be computed. Figure 2B shows the calculated results for sea ice concentration and area on February 1, 2016.
Every winter, the State Oceanic Administration publishes a sea ice bulletin, which includes the maximum sea ice area in the Bohai Sea each year (Bulletin of China Marine Disaster, 2023). Table 2 provides a comparison between the maximum sea ice area reported in the bulletins for the years 2011 to 2021 and the maximum sea ice area from the dataset used in this study. The maximum sea ice area reported in the bulletins is approximately 3000 km2 higher than the data from the dataset. This difference is attributed to the fact that the dataset calculates sea ice area using a concentration threshold of 50%, while the sea ice bulletin reports the maximum ice floe area. Hence, this results in an error of approximately 3000 km2 due to the presence of marginal ice. Specifically, the years 2012, 2018, and 2019 exhibited errors exceeding 4000 km2. The maximum sea ice area reported in the Bohai Sea ice bulletin is derived from the outer boundary of the floe ice. On the other hand, the dataset constructed by GOCI calculates the maximum sea ice area based on the concentration threshold. In 2012, 2018, and 2019, the sea ice concentration in the marginal ice zone was relatively low; consequently, the dataset did not classify it as sea ice. The figure of comparison between the State Oceanic Administration and datasets for 2012, 2018 and 2019 are seen in the ‘Supplementary Material’ file.
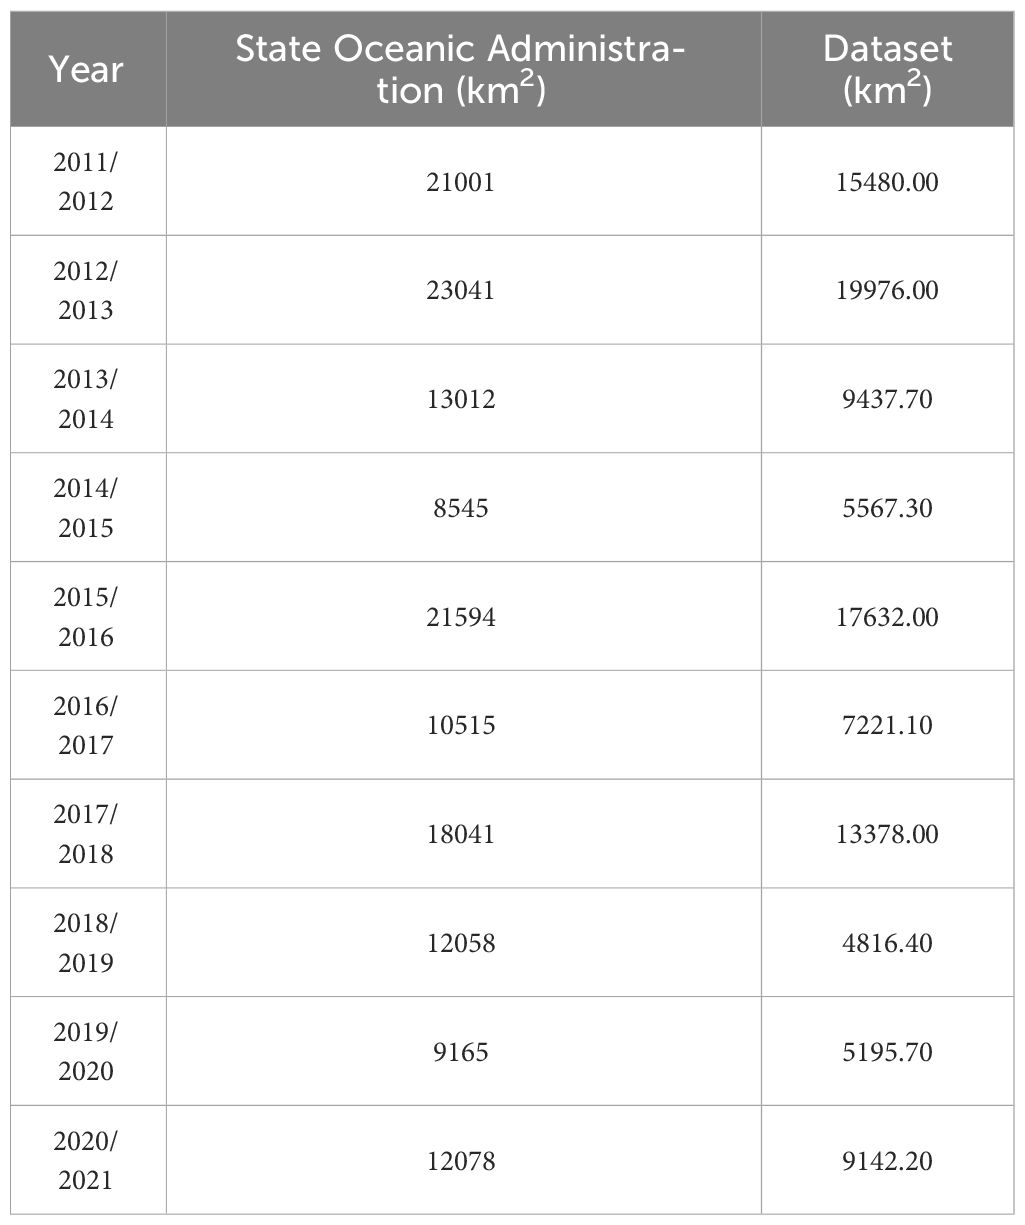
Table 2 Comparison between the maximum sea ice area from the State Oceanic Administration and the dataset.
2.3.3 Sea ice dynamic parameter
In this study, the maximum cross-correlation (MCC) method was employed for sea ice drift monitoring and tracking. This method utilizes the pixel differences of sea ice features to calculate correlation coefficients and establish correlations between two sequential images (Lang et al., 2014). First, a 5×5 median filter is applied to the preprocessed GOCI images to remove isolated noise while preserving the edge characteristics of the images and enhancing the tracking features of sea ice. Then, manually selected sea ice samples with distinct features are used for drift monitoring. The selection criteria include sea ice with evident concave-convex shapes, ice-water mixture regions, and high-concentration sea ice edge areas. The GOCI images are acquired at a time interval of 1 hour. In the first image, different sea ice feature points (x1, y1) are selected, and the corresponding best matching positions (x2, y2) are obtained in the second image by calculating the cross-correlation coefficients. Therefore, the sea ice drift velocity and direction can be obtained using the Equation 4:
where l is the side length of each pixel, which is 500 m; and t is the time interval between the two sequential images, which is 3600 s.
To obtain the overall movement trend of sea ice in the Bohai Sea, the kriging interpolation method (Lang et al., 2014) was utilized in this study to interpolate the sea ice drift velocity at the sample points. Kriging accounts for the spatial variability distribution at various spatial locations. The results are shown in Figure 2D.
3 Results
Based on the aforementioned sea ice parameter extraction process, in this study, we collected a multiparameter dataset of Bohai Sea ice from 2011 to 2021, including sea ice thickness, sea ice concentration, sea ice area, and sea ice drift velocity. Using this dataset, the temporal variations in Bohai Sea ice were analyzed, and the correlation between ice formation and melting processes with oceanic dynamic factors was investigated. These findings provide a better understanding of the trends in sea ice changes and allow for the assessment of the environmental impacts caused by fluctuations in Bohai Sea ice.
3.1 Physical parameters of sea ice
3.1.1 Statistical rule of sea ice distribution
Figure 3 presents the averages and maximum values of sea ice area and thickness over a span of 10 years. It is evident that there is a pronounced interannual decreasing trend in sea ice area over the course of a decade, with substantial fluctuations. The average sea ice area exhibits an annual decline of approximately 357.35 km2, while the maximum sea ice area experiences an annual decrease of about 1214.10 km2. In contrast, the interannual trend in sea ice thickness is less pronounced, with relatively minor variations. This phenomenon may be attributed to the fact that the Bohai Sea is situated in one of the world’s lowest-latitude seasonal ice zones. Over the ten-year period, the maximum recorded sea ice thickness does not exceed 25 cm, which contributes to the gradual nature of the observed decrease. On average, sea ice thickness diminishes by approximately 0.30 cm per year, while the maximum thickness experiences an annual reduction of around 0.56 cm.
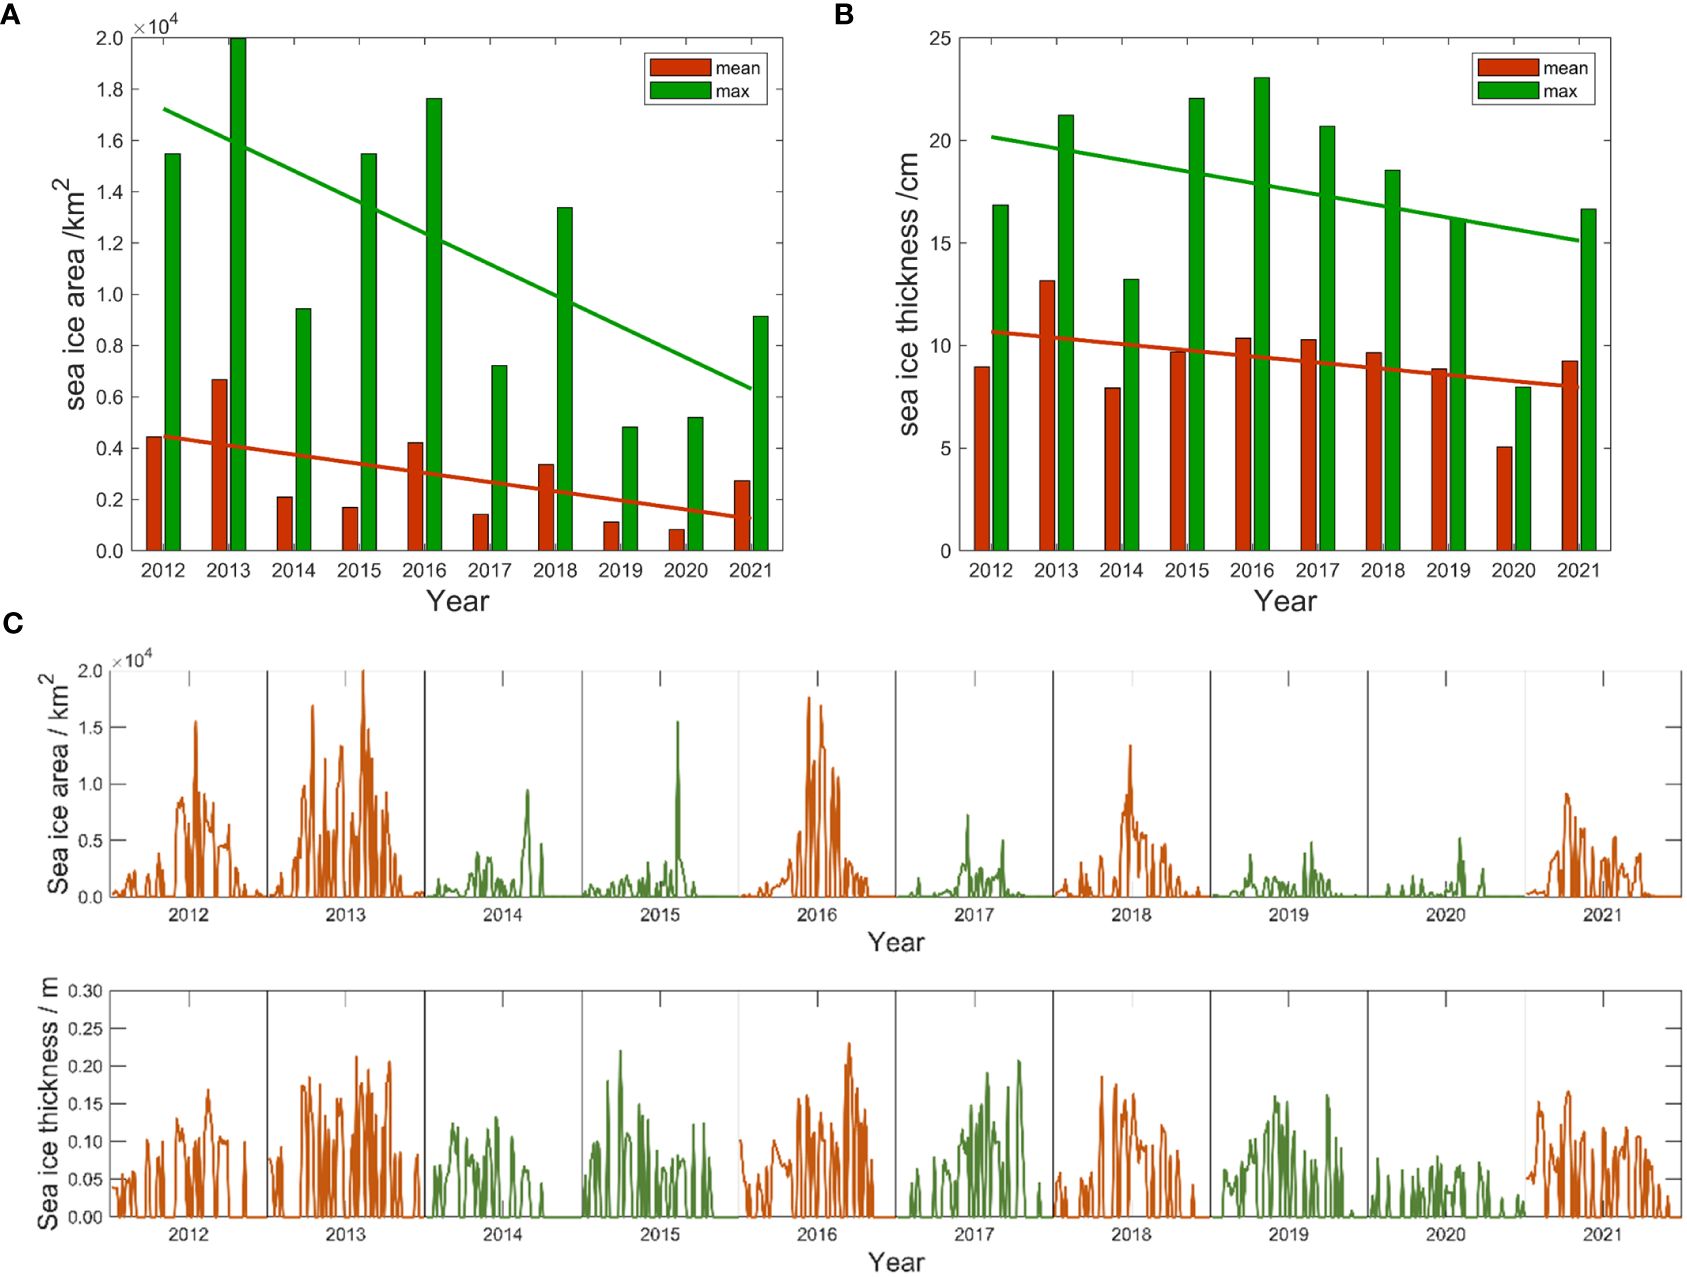
Figure 3 Decadal changes and variations in sea ice area and thickness. (A) Annual average and maximum sea ice area. (B) Annual average and maximum sea ice thickness. (C) Variations in the sea ice area and sea ice thickness. The orange denoting high sea ice extent years and green denoting low sea ice extent years.
By analyzing the winter data from December of each year to March of the following year (2011-2021), we observed a consistent ice period in the Bohai region, with clear interannual variations in sea ice area, as shown in Figure 3C. Notably, over the past five years (2017 to 2021), the sea ice area has significantly decreased compared to the preceding five years. Both 2018 and 2021 witnessed maximum sea ice areas reaching only 10,000 km². Accordingly, we divided the years into two categories: high sea ice extent years and low sea ice extent years. The years 2012, 2013, 2016, 2018, and 2021 were characterized by substantial sea ice areas, representing high sea ice extent years, with mean ice areas exceeding 2000 km². Among them, 2013 stands out with a remarkable maximum ice area of 17,000 km². During high sea ice extent years, the sea ice period began early, initiating sea ice formation in mid-December and concluding by mid-March. By January, the sea ice area had already reached its maximum value, demonstrating a consistent pattern in sea ice formation and melting. In 2014, 2015, 2017, 2019, and 2020, the Bohai Sea experienced a relatively low sea ice area, with mean sea ice areas mostly remaining below 2000 km², denoting these years as low sea ice extent years. Among them, 2020 had the smallest average sea ice area, measuring less than 1000 km²; in fact, it was the year with the smallest sea ice extent in the past decade. Low sea ice extent years exhibited distinct sea ice period patterns, starting from mid to late December, and the Bohai Sea ice area displayed notable fluctuations in January before reaching its peak in mid-February. The patterns of sea ice formation and melting varied significantly during these years. Table 3 provides a summary of the dates when the sea ice area reached its maximum value, with red denoting high sea ice extent years and black denoting low sea ice extent years. It is evident that during high sea ice extent years, the sea ice area reached its maximum value as early as January 8th, and in most years the peak sea ice area occurred around February 1st. Conversely, in low sea ice extent years, the sea ice area did not reach its maximum until approximately January 25th, and the peak sea ice area typically occurred around February 10th. Thus, compared to high sea ice extent years, the variations in sea ice area during low sea ice extent years generally lagged by approximately 10 days.
Table 3 Dates of the maximum sea ice area and sea ice thickness in the Bohai Sea from 2011 to 2021.
The interannual variations in Bohai Sea ice thickness were relatively small compared to the sea ice area trends, as shown in Figure 3C. With the exceptions of 2013 and 2020, the mean sea ice thickness for the other years fluctuated between 0.08 m and 0.10 m. Notably, 2013 had the highest average sea ice thickness over the past decade, reaching 0.13 m, while in 2020, the sea ice thickness was less than 0.08 m. Despite being low sea ice extent years, 2015, 2017, and 2019 had sea ice thicknesses mostly surpassing 0.10 m during mid-January and mid-February. Interestingly, the Bohai Sea ice thickness demonstrated varying degrees of growth during February each year. The dates when the sea ice thickness reached its maximum value differed between high sea ice extent years and low sea ice extent years, as presented in Table 3. High sea ice extent years typically experience their maximum ice thickness in early January or February, while low sea ice extent years see their peak ice thickness toward the end of January or February.
Sea ice in the Bohai Sea is an important freshwater resource in northern China; it has low salinity due to the significant precipitation of salts during its formation. The volume of sea ice is a crucial parameter for assessing the total sea ice resources in this region. The Bohai Sea is characterized as a seasonal ice zone with complex sea ice types, and its thickness and area vary rapidly due to monsoons and ocean currents. To determine the main factors affecting the total sea ice resources in the Bohai Sea, in this study, we investigated the correlations between sea ice volume, sea ice area, and sea ice thickness, as shown in Figure 4. The sea ice volume can be estimated by multiplying the sea ice area and sea ice thickness for a given day. The sea ice volume is highly correlated with the sea ice area, with a correlation coefficient of 0.9419. However, the correlation between sea ice volume and sea ice thickness is relatively low, at 0.5824. Hence, the total sea ice resources in the Bohai Sea region are primarily determined by sea ice area. This is attributed to the relatively thinner sea ice thickness during the winter in the Bohai Sea, which results in a lesser contribution to the overall sea ice resource.
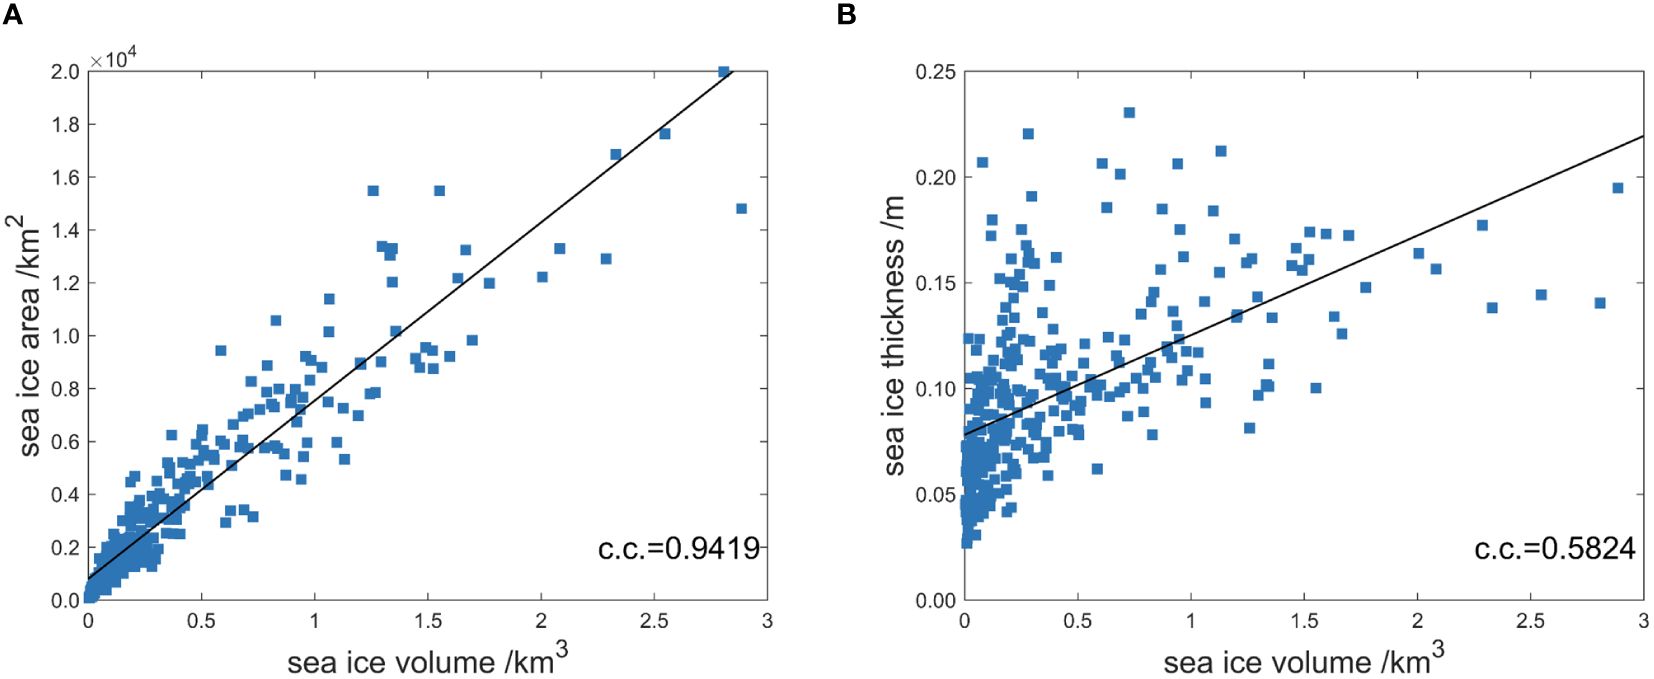
Figure 4 The correlation between sea ice volume and sea ice area and thickness. (A) Sea ice volume and sea ice area. (B) Sea ice volume and sea ice thickness.
3.1.2 Statistical analysis of the influence of ocean dynamic factors
The formation of sea ice is closely related to factors such as seawater density, salinity, water depth, turbulence, and freezing nuclei. However, the primary cause is the thermal coupling between the atmosphere and seawater, which cools the surface seawater temperature to the freezing point. The magnitude of the temperature decrease, and the duration of low temperatures directly influence the entire process of sea ice formation, development, and melting. Wind speed is also a significant factor that affects sea ice variability. In the Bohai Sea region, winter winds are relatively strong, which can lead to sea ice fracturing and movement, thereby affecting the distribution and thickness of sea ice. Additionally, wind speed can influence the flow and temperature distribution of seawater, further impacting the formation and disappearance of sea ice.
As shown in Figure 3C, the formation and melting of Bohai Sea ice follow roughly the same pattern each winter. Optical satellites are susceptible to weather conditions such as clouds and fog, leading to discontinuities in the extracted sea ice parameters based on GOCI data. To better analyze the annual variation in Bohai Sea ice and its correlation with oceanic dynamic factors, the average sea ice area and thickness for corresponding dates during each winter (December 15 to March 15 of the following year) were calculated to obtain the daily total sea ice area and thickness throughout the year (indicated by the black line in Figure 5), with February considered a 28-day period. Figures 5A, B shows that the growth of Bohai Sea ice generally undergoes three stages: the Growth Period, the Development Period, and the Melting Period:
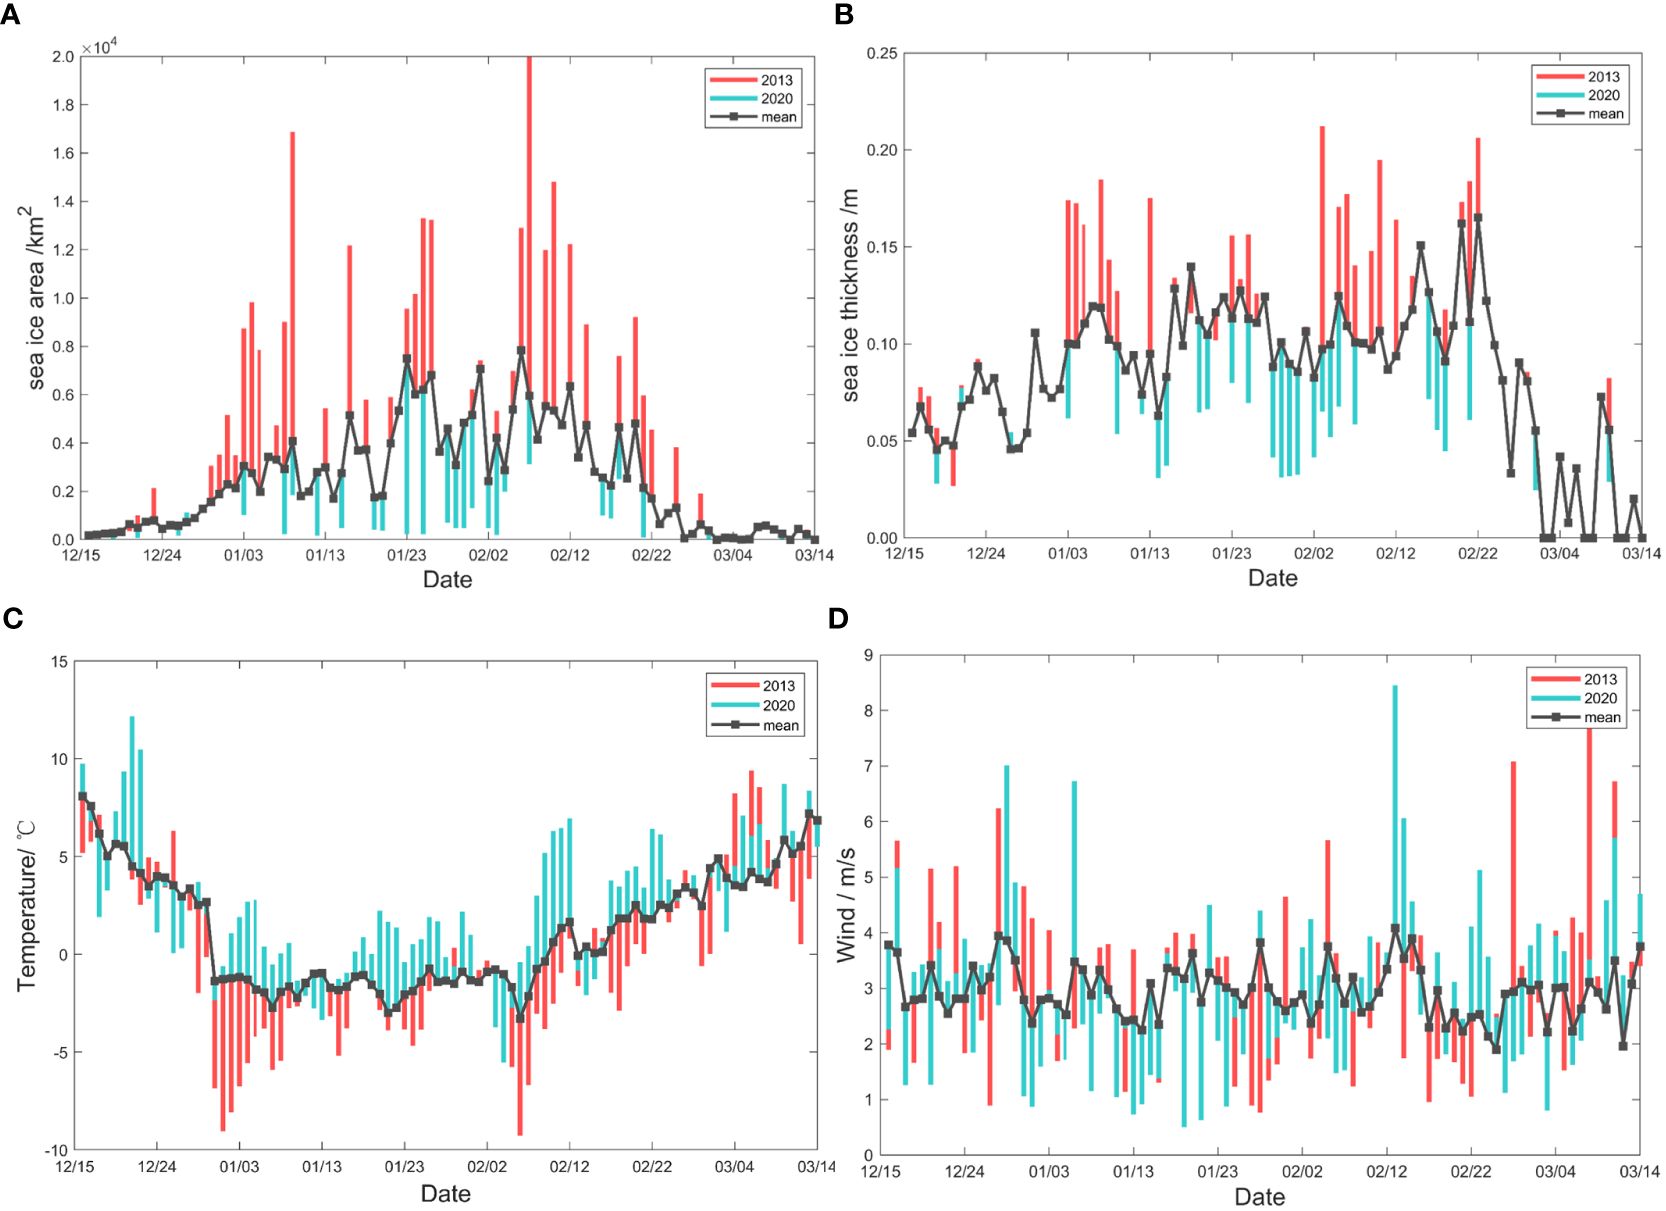
Figure 5 The annual variation in sea ice area, thickness, temperature and wind speed in the Bohai Sea from 2011 to 2021. The X-axis label in the figure is month/day. (A) Sea ice area. (B) Sea ice thickness. (C) Temperature. (D) Wind speed.
(1) The Growth Period: From late December to early January, the winter temperature in the Bohai Sea region continuously decreases (indicated by the black line in Figure 5C). The sea ice area in the Bohai Sea continues to increase, and the sea ice thickness exhibits a fluctuating upward trend, indicating the development stage.
(2) The Development Period: From mid-January to mid-February, the Bohai Sea experiences the development ice period. During this time, the winter temperature fluctuates around -3°C. The sea ice area remains relatively stable and reaches its maximum value for the year. The ice thickness fluctuates by approximately 0.10 m.
(3) The Melting Period: From mid-February to mid-March, the winter temperature in the Bohai Sea exhibits a fluctuating upward trend. The sea ice area gradually decreases over time, and the sea ice thickness experiences a significant increase followed by a gradual decrease.
The wind speed variation in the Bohai Sea region is not very pronounced, mostly ranging between 2.0 and 4.0 m/s (indicated by the black line in Figure 5D). However, by the end of December and mid-February, there are periods with relatively higher wind speeds, resulting in abnormal increases in both sea ice area and thickness, especially ice thickness. During the arrival of cold waves, the temperature in the Bohai Sea experiences a sudden drop, followed by a subsequent rise after the cold wave passes. As a result, the winter temperature in the Bohai Sea exhibits a fluctuating pattern of both decrease and increase, and correspondingly, the sea ice area and thickness show abrupt declines or increases when cold waves occur.
2013 was the year with the heaviest sea ice extent in the past decade, as indicated by the red line in Figures 5A, B. The maximum sea ice area reached 18,000 km2, and the sea ice thickness exceeded 0.20 m. The daily sea ice area remained higher than the ten-year average, while there were occasional instances of the sea ice thickness being lower than the ten-year average. As shown by the red line in Figure 5C, there were two severe cold waves in early January and early February of 2013, with the lowest temperatures approaching -10°C. During these cold wave periods, the sea ice area and thickness reached their annual peaks. The third peak of sea ice thickness in 2013 appeared around February 23rd when the Bohai Sea temperature continued to rise and remained at approximately 0°C. The sea ice continuously melted, and the wind speed reached 3.5 m/s, leading to the accumulation of broken sea ice, causing an abnormal increase in the ice thickness. As shown by the red line in Figure 5D, the wind speed in the Bohai region exceeded 7.0 m/s in late February and early March 2013, resulting in fluctuations in the sea ice thickness at approximately 0.08 m.
2020 was the year with the lightest sea ice extent, as shown by the blue line in Figures 5A, B. The sea ice area remained below 2000 km2 throughout January, and the maximum sea ice area during the entire ice period was less than 6000 km2. The highest ice thickness did not exceed 0.10 m, and the daily sea ice area was consistently below the average. The sea ice thickness was slightly greater than the average in late December and early March but lower than the average during the remaining time. As shown by the blue line in Figure 5C, the overall temperature in the Bohai Sea region in 2020 remained above -5°C. The most significant cold wave occurred in early February when the temperature dropped below -5°C, resulting in the maximum sea ice area and higher ice thickness for the year. In late December 2019 and mid-February 2020, there were also two large-scale temperature drops in the Bohai Sea, but they did not reach the freezing point of sea ice, so there were no significant increases in the sea ice area or thickness. In mid-January 2020, the Bohai Sea temperature remained unusually above 0°C, and the sea ice area almost reached its minimum, while the ice thickness reached its peak for the entire year. As shown by the blue line in Figure 5D, on February 12, 2020, the wind speed in the Bohai region reached 8.0 m/s, and the temperature surged to 7°C, but the ice thickness remained relatively high for the remainder of the year. Therefore, the Bohai Sea temperature and wind speed were closely related to the sea ice area and thickness. During the sea ice melting period, sea ice accumulation also impacted the sea ice thickness. In the subsequent discussion in Section 4.1, we assess the possibility of estimating sea ice area and thickness based on temperature and wind speed through statistical modeling.
3.2 Dynamic parameters of sea ice
Figure 6A shows the sea ice drift velocity in Liaodong Bay from 2011 to 2021 between 10:00 and 11:00 Beijing time each day. Figure 6B shows the frequency of sea ice drift in each direction. During this period, most of the sea ice drifted in the southwest direction, while a small portion drifted in the north direction, and the drift velocity was generally slow. The sea ice drift velocity was significantly influenced by the daily ocean dynamic parameters, and its distribution did not exhibit distinct interannual or annual characteristics. Therefore, subsequent research will focus on investigating the correlation between sea ice drift velocity and wind and drift current.
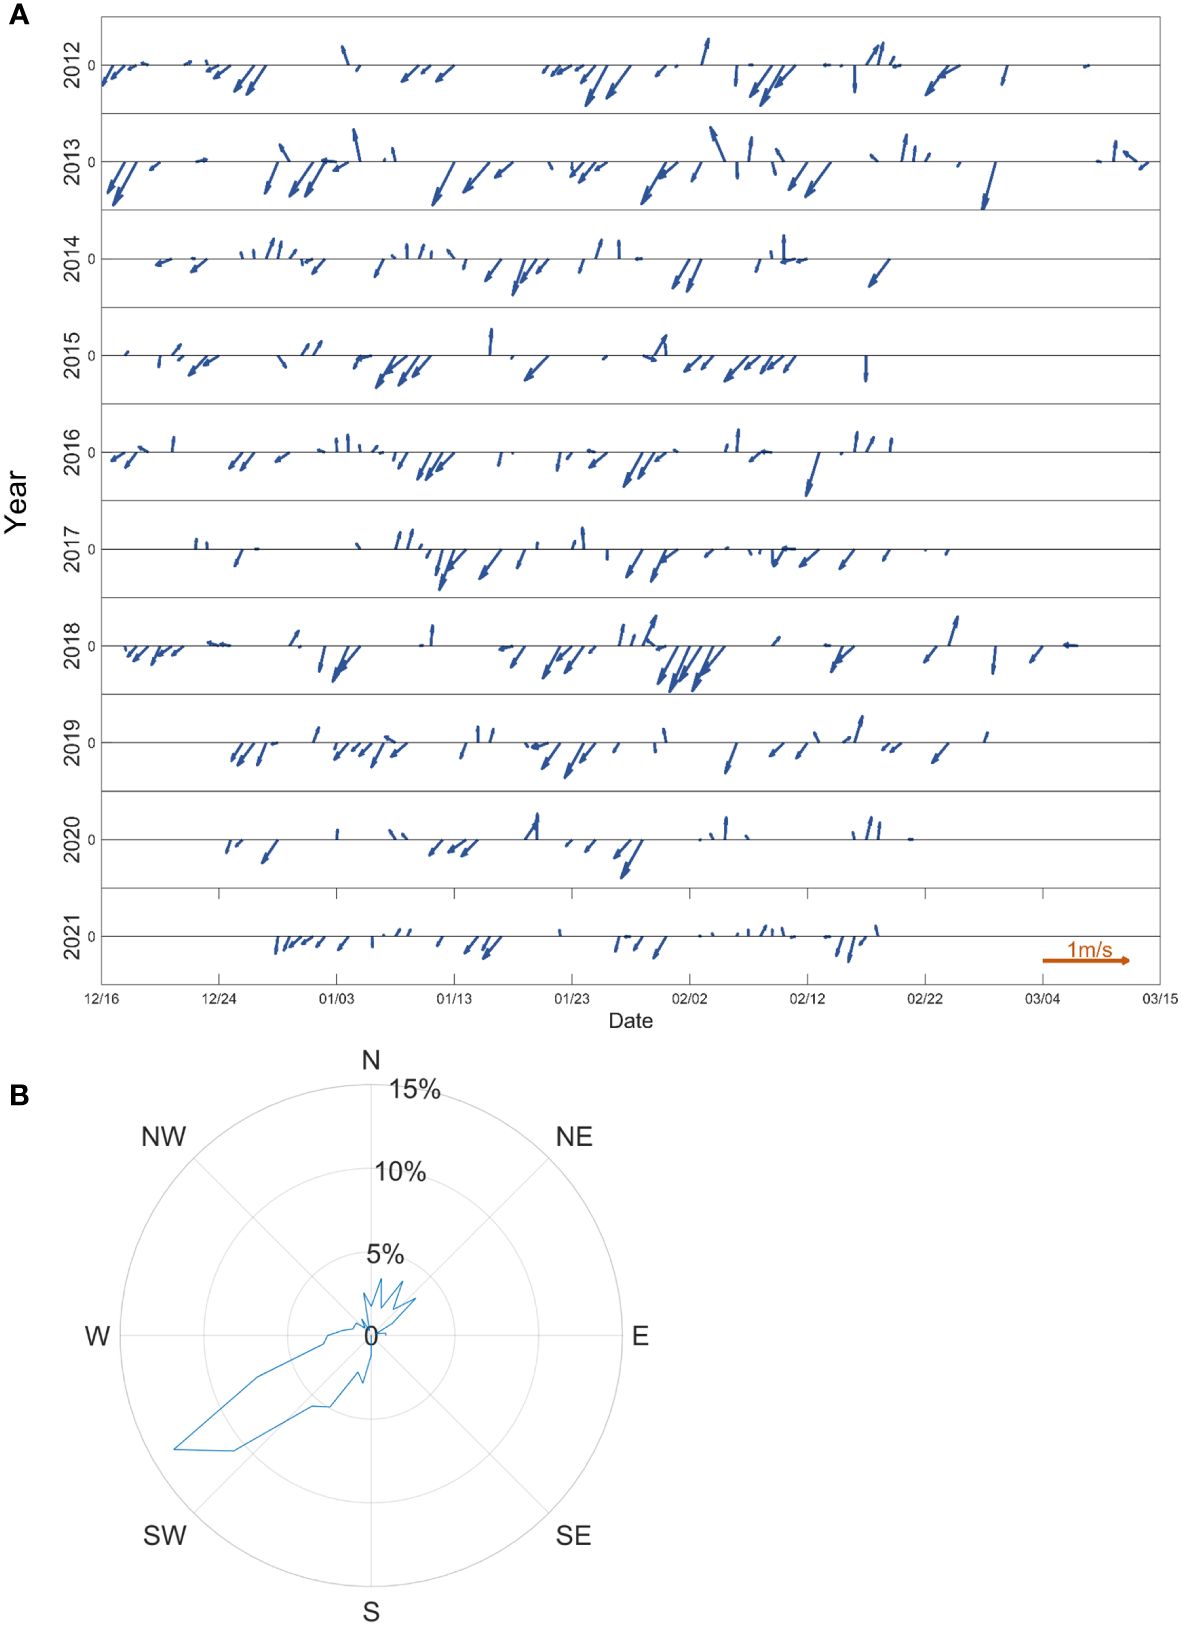
Figure 6 The sea ice drift velocity and the frequency of sea ice drift velocity in Liaodong Bay from 2011 to 2021. The X-axis label date is expressed as month/day (A) The sea ice drift velocity. (B) The frequency of sea ice drift velocity.
The spatial variability of sea ice drift velocity primarily encompasses the velocity divergence field and curl field, as well as the velocity gradient field. These fields, to a certain extent, reflect the interactions among sea ice elements, such as accumulation and dispersion. Simultaneously, they are intertwined with and influence sea ice thickness and concentration.
Sea ice drift divergence is defined as shown in Equation 5:
Sea ice drift curl is defined as shown in Equation 6:
The vector direction of curl corresponds to the normal direction of the sea ice drift velocity, and the sign of curl indicates the direction (clockwise or counterclockwise).
The gradient reflects variations in sea ice drift velocity and is defined as shown in Equation 7:
Considering the highest sea ice extent year of 2013 and the lowest sea ice extent year of 2020 as examples, representative data from the Growth Period, the Development Period, and the Melting Period were selected to calculate the divergence, curl and gradient in sea ice drift velocity, as shown in Table 4; Figure 7. During the winter ice period of 2013, with changes in sea ice thickness and concentration, the divergence of drift velocity showed relatively small variations, while the curl remained mostly constant. In the growth ice period, sea ice concentration and thickness were generally lower, resulting in larger drift velocity gradients. As the development ice period approached, the drift velocity gradient decreased with increasing sea ice thickness and concentration. During the melting ice period, the drift velocity gradient was relatively large at the sea ice edge, even when the thickness and concentration in that area were relatively high. In the winter sea ice period of 2020, there were minimal changes in sea ice thickness and concentration, and the divergence of drift velocity was slightly higher during the development ice period, while the curl remained relatively constant throughout the three periods. The sea ice concentration and thickness were relatively low during all three stages, resulting in consistently high values of the drift velocity gradient. Regardless of whether the sea ice extent was heavy or light, the divergence of sea ice drift velocity was slightly higher during the development ice period. This is because during the development ice period, the sea ice in the Bohai Sea continuously freezes, increasing the likelihood of ice collisions. The curl of the drift velocity remained almost unchanged during all three stages, and its influence on sea ice physical parameters can be considered negligible. High values of the drift velocity gradient were primarily observed at the edges of the sea ice. Within the interior of the sea ice area, where the concentration and thickness were high, the speed gradient was small. However, at the sea ice edge, where the interactions between sea ices were pronounced, even with high concentration and thickness, the speed gradient was relatively large. Thus, the interaction between the drift velocity and sea ice physical parameters in the Bohai Sea was relatively small and mainly manifested in the edge regions of the sea ice. This contrasts with the Okhotsk Sea, another seasonal ice zone, where Toyota et al. (2022) reported that sea ice in the southern part of the Okhotsk Sea is greatly influenced by sea ice drift processes. The primary reason for this difference seems to be that the edges of Liaodong Bay are mostly surrounded by land, with a less significant influence of ocean currents. The sea ice in these areas mainly forms as a result of freezing under cold conditions. Hence, in the subsequent discussion regarding the factors influencing sea ice parameters, we do not account for the interactions among sea ice elements but rather focus solely on the impact of ocean dynamic factors.
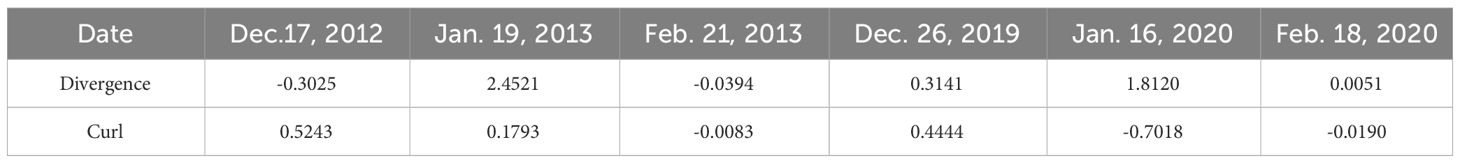
Table 4 Divergence and curl in sea ice drift velocity in the 2012/2013 and 2019/2020 winter.
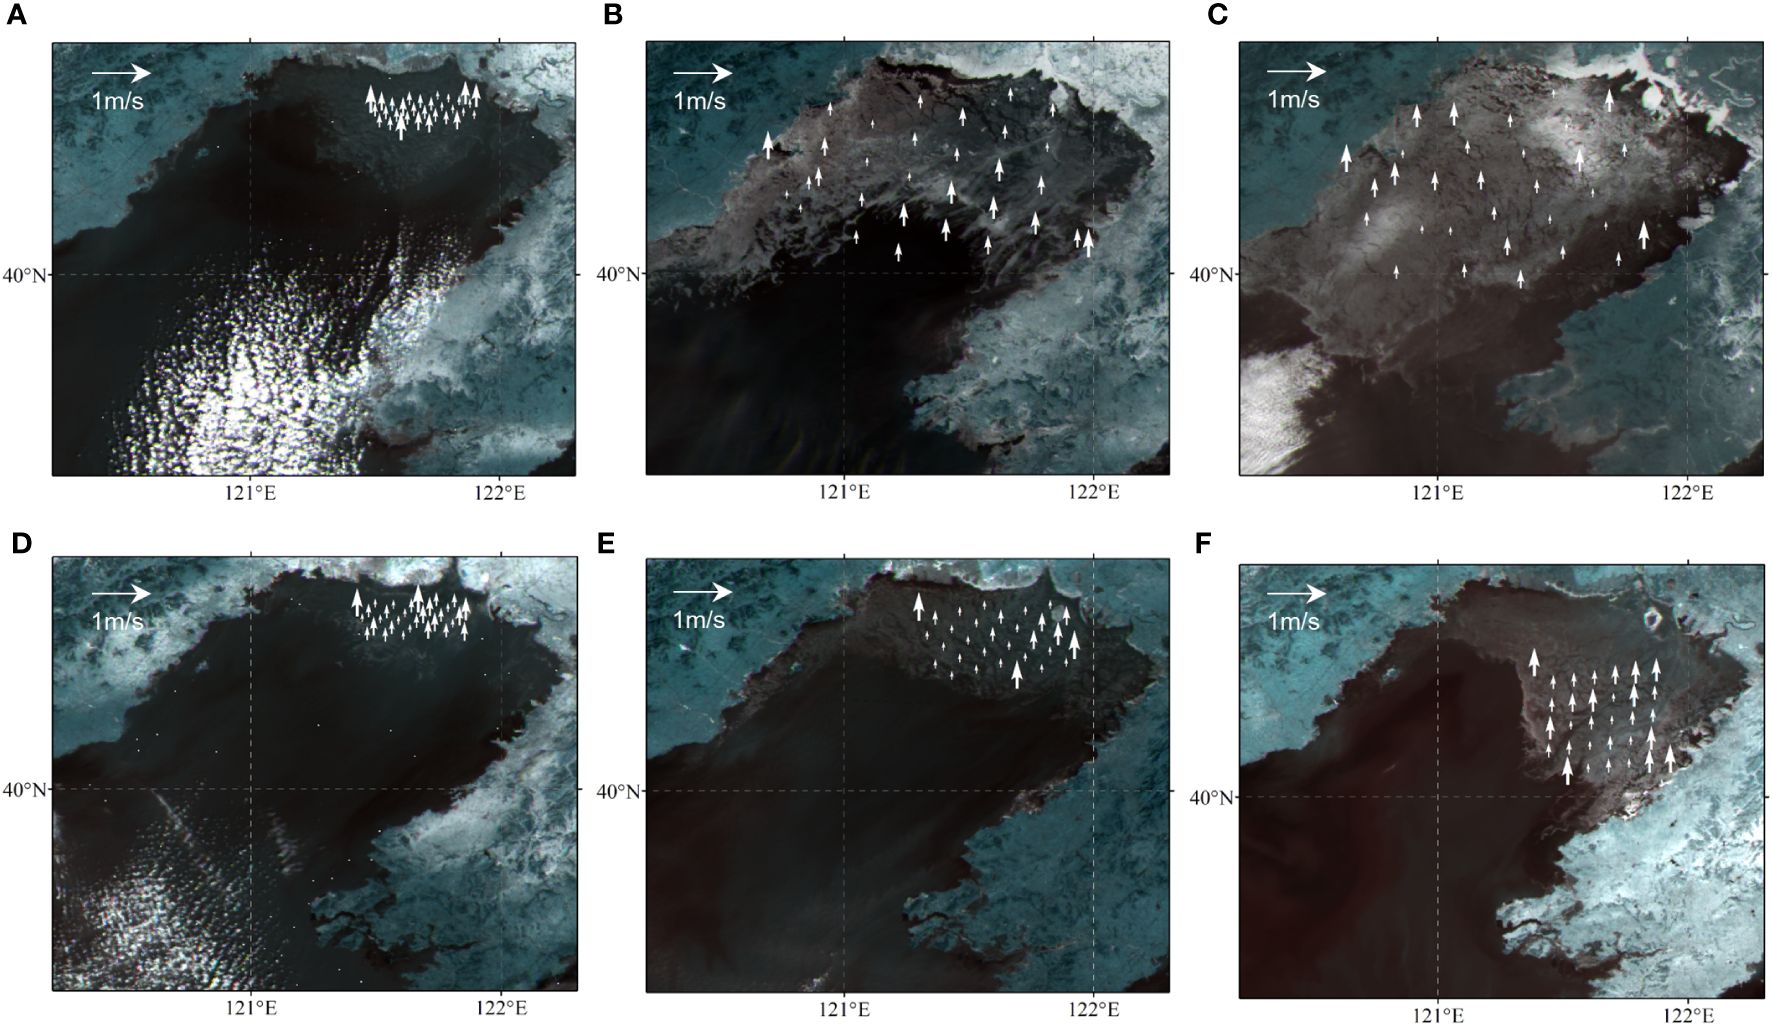
Figure 7 Gradient in sea ice drift velocity in the 2012/2013 and 2019/2020 winter. (A) Dec.17, 2012. (B) Jan. 19, 2013. (C) Feb. 21, 2013. (D) Dec. 26, 2019. (E) Jan. 16, 2020. (F) Feb. 18, 2020.
4 Discussion
In this study, we employed statistical modeling to investigate the mathematical relationships between sea ice parameters and ocean dynamic factors. This included assessing the degree to which sea ice area and thickness are influenced by temperature and wind speed during the growth ice period, development ice period, and melting ice period, as well as the impact of wind and drift current fields on sea ice drift. Based on these statistical models relating sea ice parameters to ocean dynamic factors, it is possible to enhance the prediction of sea ice disasters in the Bohai Sea and effectively formulate disaster prevention and mitigation measures.
4.1 Factors affecting sea ice physical parameters
Regarding the factors influencing sea ice variations, the most direct and crucial factor for Bohai Sea ice is undoubtedly the winter air temperature. The magnitude and duration of cooling of the sea surface temperature after ice formation directly impact the development of sea ice. Accumulated temperature is the total temperature conditions or heat resources provided by the climate for a specific natural process. It depends on both the starting temperature and the accumulation period. In meteorology, the cumulative value of the daily average temperature less than 0°C is usually referred to as the negative accumulated temperature. Previous studies have indicated a close correlation between the spatial distribution of negative accumulated temperature and sea ice conditions in the Bohai Sea each year (Li et al., 2013). However, previous research predominantly focused on the interannual variations in sea ice parameters in relation to accumulated temperature, with limited studies examining the daily sea ice changes in connection to the starting temperature and the accumulation period. Therefore, this study marks the first attempt to discuss the relationship between daily sea ice area and sea ice thickness in the Bohai Sea with respect to the starting temperature and the accumulation period. Moreover, as analyzed earlier, the influence of wind speed on sea ice physical parameters cannot be ignored. Therefore, in this study, we utilized a dataset of sea ice area and thickness in the Bohai Sea from ten winters spanning 2011 to 2021, establishing statistical models that consider ocean dynamic factors (accumulated temperature and wind speed) and their relation to sea ice area and thickness.
4.1.1 Accumulated temperature
The calculation of accumulated temperature requires determining the starting temperature and the accumulation period. In this study, the starting temperature was determined through a correlation analysis between the mean annual sea ice area and the accumulated temperature (AT) during the winter. As shown in Table 5, the correlation coefficient between the sea ice area and accumulated temperature below -4°C was the lowest, at -0.8806, whereas the highest correlation coefficient was below -1°C, with a value of -0.9468. There was a strong correlation between the sea ice area and the accumulated temperature. As shown in Table 5, the correlation between sea ice thickness and accumulated temperature below -1°C was the highest, with a value of -0.7835, while the lowest correlation was observed with accumulated temperature below -4°C, with a value of -0.7408. The correlation coefficients between sea ice thickness and accumulated temperature exhibited minimal variations with different starting temperatures, remaining stable at approximately -0.7600. The correlation between sea ice thickness and accumulated temperature was lower than that of sea ice area, with a maximum correlation coefficient 0.1633 lower than that of sea ice area.
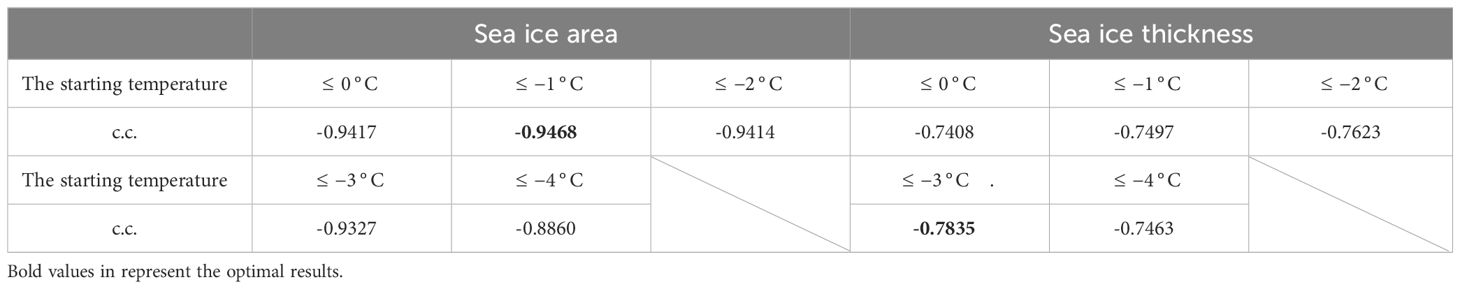
Table 5 The correlation between the sea ice in the Bohai Sea and different starting temperatures from 2011 to 2021.
The analysis of daily sea ice area also requires selecting an appropriate accumulation period for the accumulated temperature. In this study, we tested the correlation between different accumulation periods and sea ice area, as shown in Figure 8A. Initially, as the accumulation period increases, the correlation coefficient rapidly increases until it reaches a peak at 7 days. Afterward, the correlation coefficient slightly decreases. However, when the accumulation period reaches 13 days, the correlation coefficient starts to increase again, reaching its maximum value of -0.7030 at 19 days. Beyond 19 days, the correlation coefficient decreases with a further increase in the accumulation period. Therefore, using a 19-day accumulation period for the accumulated temperature is the most appropriate choice to establish the model. In Figure 8B, the correlation between daily average sea ice thickness and the accumulation period of accumulated temperature is shown. Like the sea ice area, as the accumulation period of accumulated temperature increased from 2 days to 5 days, the correlation coefficient rapidly increased. Subsequently, with further growth in the accumulation period, the correlation continued to increase but at a slower rate. Unlike sea ice area, the correlation between sea ice thickness and the accumulation period did not exhibit a decreasing trend with an increase in the number of days. The correlation coefficient remained relatively stable, reaching a plateau near -0.5251 when the accumulation period reached 40 days. The increase in sea ice thickness requires a longer and colder accumulation period. In the analysis of factors influencing sea ice thickness, a longer accumulation period is needed compared to that of sea ice area. Therefore, a 40-day accumulation period is the most appropriate choice to establish the empirical equation for sea ice thickness.
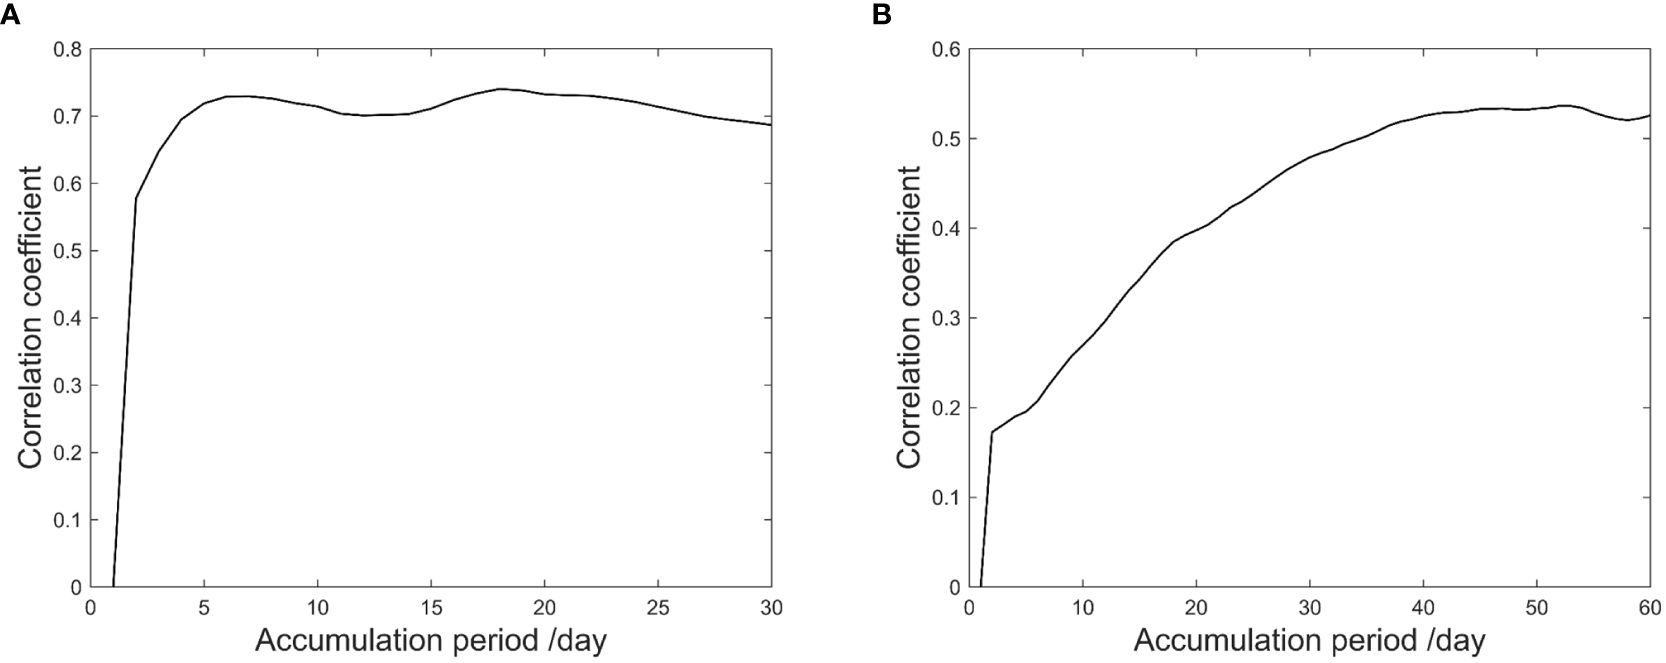
Figure 8 The correlation between the sea ice and accumulation period. (A) Sea ice area. (B) Sea ice thickness.
4.1.2 The statistical model
4.1.2.1 Sea ice area
As outlined in Section 3.1.2, the development of sea ice in the Bohai Sea can be categorized into three distinct phases: the Growth Period (December 15th - 31st), the Development Period (January 1st - February 15th), and the Melting Period (February 15th - March 15th). Each of these phases exhibits unique characteristics in terms of sea ice changes. Consequently, separate statistical models related to accumulated temperature (AT) and wind speed were constructed for each of these stages. In the dataset comprising matched data between Bohai Sea ice thickness and climate factors during winters from 2011 to 2021, 185 samples were randomly selected to establish the empirical equation for sea ice area. The formula for sea ice area is as shown in Equation 8, Equation 9 and Equation 10:
For the Growth Period:
For the Development Period:
For the Melting Period:
where S represents the sea ice area, is the accumulated temperature, is the wind speed.
During the Melting Period, sea ice exhibits complex behavior, with sea ice area rapidly changing in response to accumulated temperatures. Attempting to model this phase using a linear relationship resulted in significant errors. Consequently, this study employs an exponential relationship to represent the variation in sea ice area during the Melting Period, as shown in Equation 11:
After validating the model with the remaining matching data, a comparison between measured sea ice area and estimated sea ice area is illustrated using scatter plots, as shown in Figures 9A-D. It can be observed that, under the linear model, the goodness of fit for the statistical models in all three periods is quite satisfactory, with correlation coefficients exceeding 0.7300. Among them, the statistical model for the Development Period exhibits the best fit, with the highest correlation coefficient, while the Growth Period and Melting Period show relatively weaker fits. After refining the statistical model for the Melting Period, the correlation coefficient increases to 0.8107, and the average relative error (MRE) decreases by 5.11%. This indicates that the modified model can better represent the variation in sea ice area during the Melting Period. The improved segmented model is then applied to calculate sea ice for the entire winter, as shown in Figure 9D. The correlation coefficient reaches 0.8099, with an average relative error (MRE) of 0.0308. The results from the sea ice area statistical model closely align with the measured data, making it a valuable reference for sea ice forecasting models.
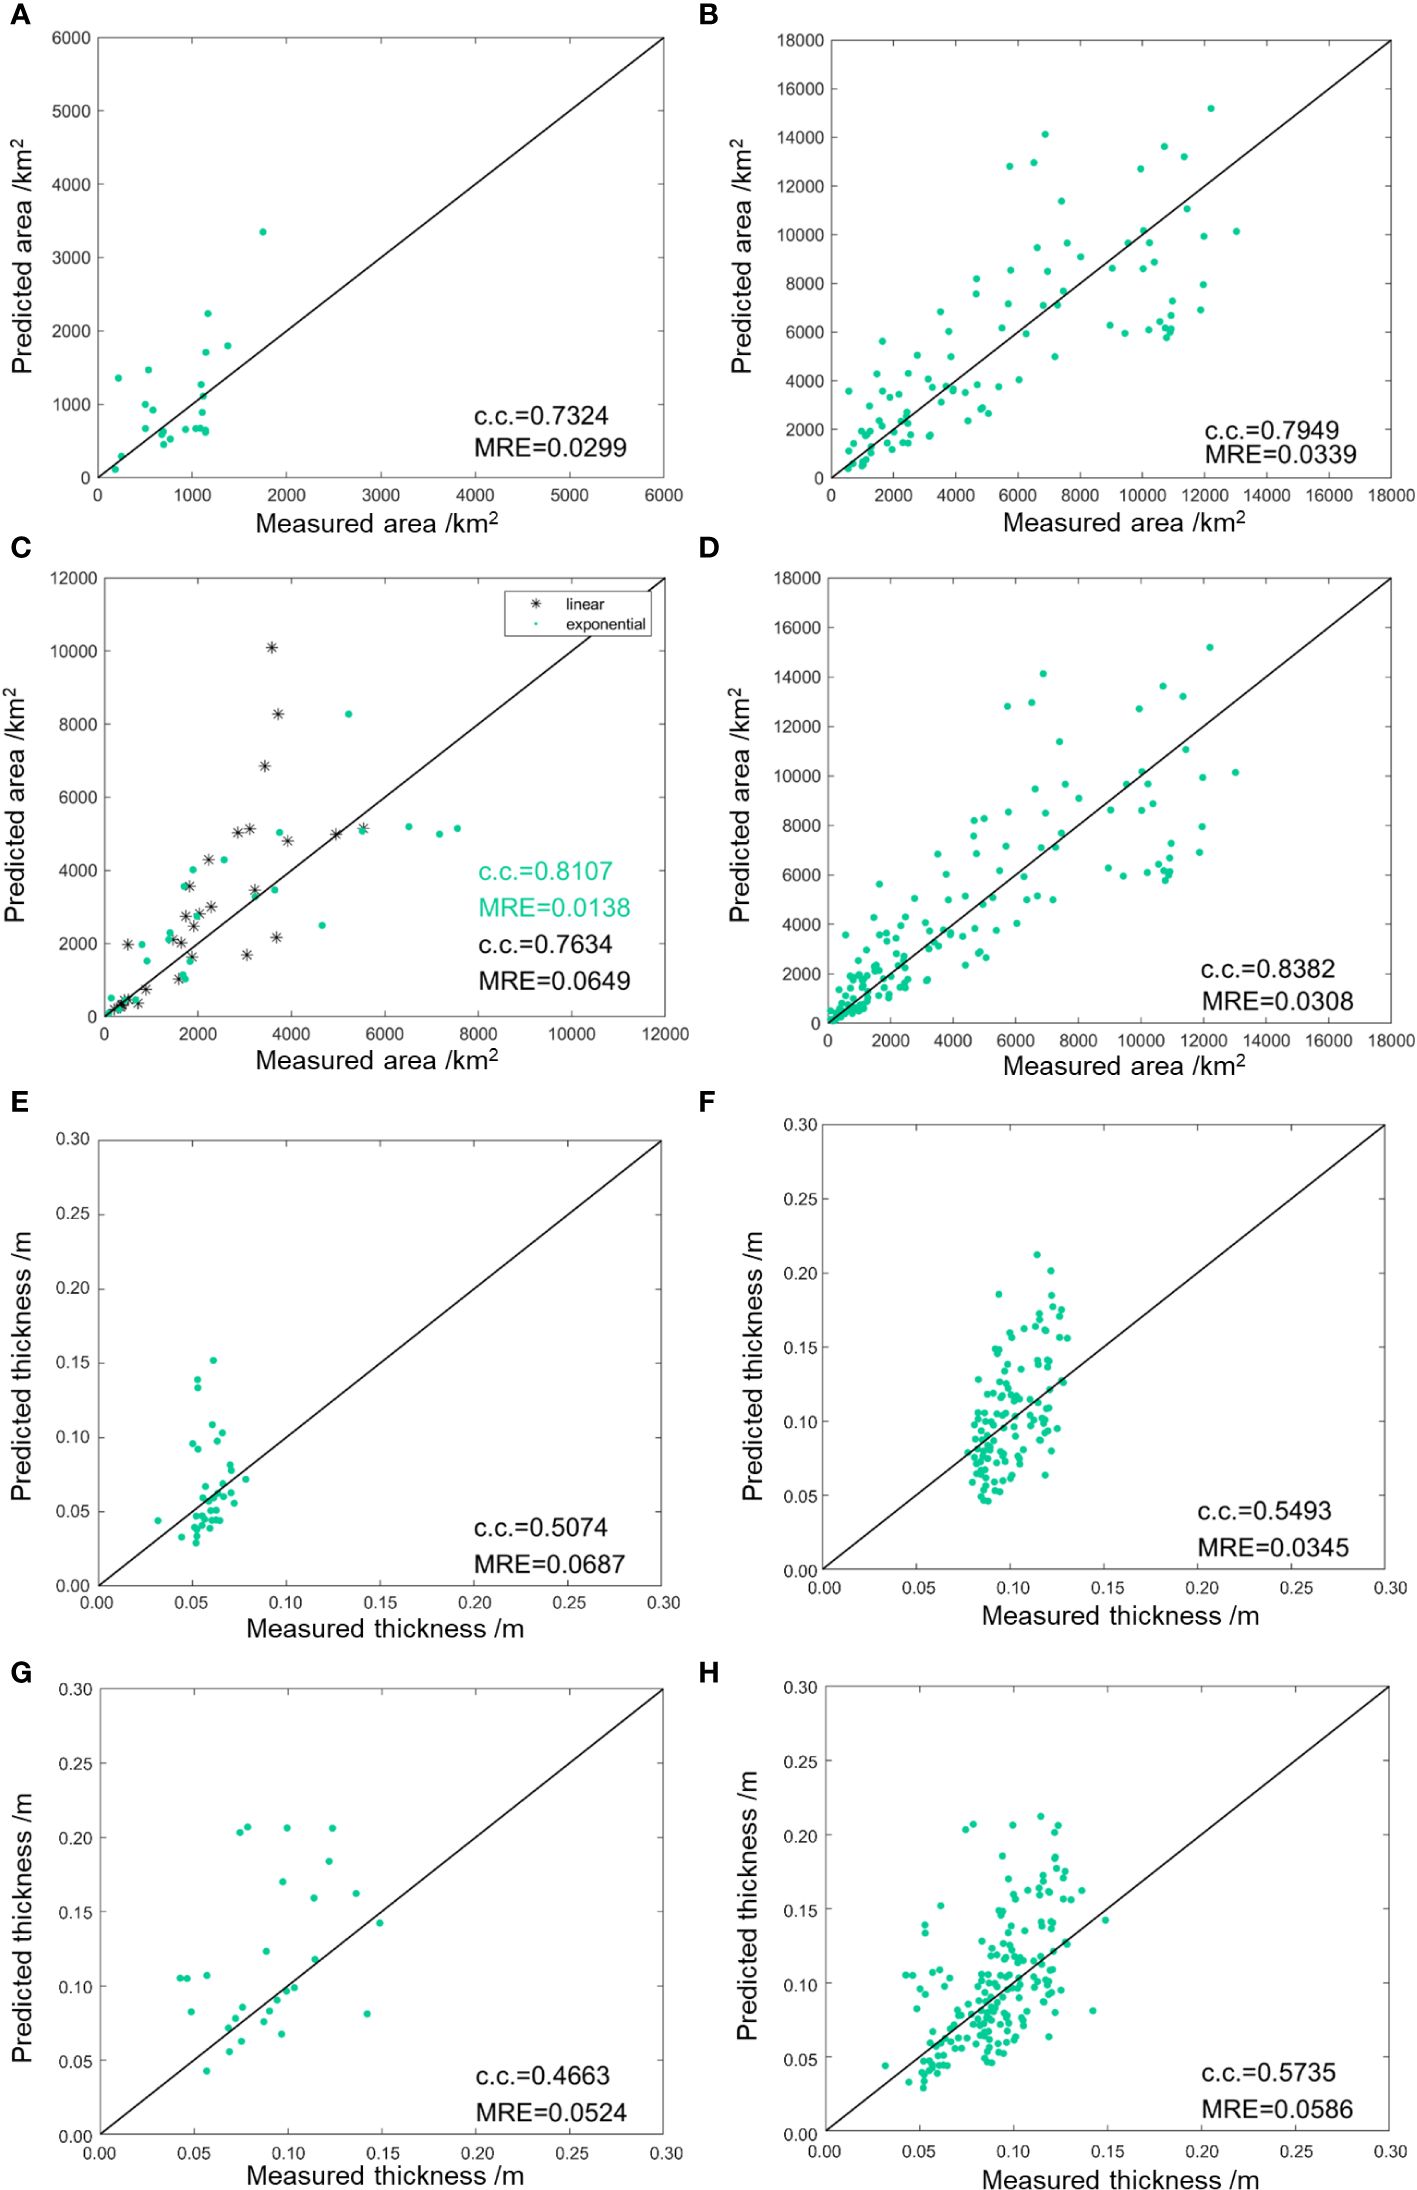
Figure 9 Measured result and predicted result. (A) Sea ice area in Growth Period. (B) Sea ice area in Development Period. (C) Sea ice area in Melting Period. (D) Sea ice area in all period. (E) Sea ice thickness in Growth Period. (F) Sea ice thickness in Development Period. (G) Sea ice thickness in Melting Period. (H) Sea ice thickness in all period.
4.1.2.2 Sea ice thickness
Like sea ice area, statistical models for sea ice thickness, based on the three stages of sea ice development and their correlation with accumulated temperature and wind speed, were established. A dataset consisting of matched data for Bohai Sea ice thickness and climate factors during the winter seasons from 2011 to 2021 was utilized, randomly selecting 185 samples to construct the statistical models for sea ice thickness, as shown in Equation 12, Equation 13 and Equation 14:
For the Growth Period:
For the Development Period:
For the Melting Period:
where H represents the sea ice thickness, is the accumulated temperature, is the wind speed.
The Bohai Sea is located in a seasonal ice zone, where sea ice thickness is relatively small. During the melting period, sea ice thickness exhibits only minor changes in terms of rate (Supplementary Figure S5 in the ‘Supplementary Material’ file). In this context, a linear relationship is sufficient to predict sea ice thickness during the thawing period.
The validation results of the empirical equation using 185 validation samples are shown in Figures 9E–H. The horizontal axis represents the actual measured values based on GOCI, while the vertical axis represents the estimated values from the empirical equation. It can be observed that the statistical models for sea ice thickness have lower accuracy compared to those for sea ice area. The correlation coefficients for the Growth Period and Development Period are approximately 0.5200, while for the Melting Period, it is 0.4663. This indicates that changes in sea ice thickness are more complex than sea ice area. As discussed in Section 4.1.1, sea ice thickness has different requirements regarding the starting temperature and accumulation period compared to sea ice area. Sea ice thickness necessitates a lower starting temperature and a longer accumulation period for thickness growth. An AT of less than -1°C over 19 days exhibits the highest correlation with sea ice extent, whereas sea ice thickness requires an AT of less than -3°C over 40 days. Therefore, sea ice thickness exhibits lower sensitivity to temperature, and its growth necessitates the accumulation of cold temperatures over an extended period. Simple linear relationships between AT and wind speed are insufficient for accurate sea ice thickness estimation. To achieve more precise predictions of sea ice thickness, further research into the physical laws governing sea ice formation and melting is required, potentially involving the inclusion of additional model parameters. When applying the segmented models to calculate sea ice thickness over the entire winter season, the results, as shown in Figure 9H, yield a correlation coefficient of 0.5735and an average relative error of 0.0586. This represents a reliable method for estimating sea ice thickness.
4.2 Relationship between sea ice dynamic parameters and ocean dynamic parameters
Sea ice drift is an essential component of ocean dynamics research and is primarily controlled by ocean currents, local winds, and internal ice stresses. Internal ice stresses can cause deformation and rotation of sea ice, but their short-term effect on sea ice drift can be considered negligible. In this study, sea ice drift matrices were extracted from two sets of sequential GOCI sea ice images with a time interval of 1 hour, allowing us to avoid the influence of internal ice stresses on sea ice drift. Therefore, the equation for sea ice drift velocity can be simplified to the relationship between wind and flow fields (Lang et al., 2014), as shown in Equation 15:
where is sea ice drift velocity; is drift current speed; is wind speed; and a and b are drag coefficients of wind and drift currents, respectively. Using the latitude-longitude grid of the Bohai Sea region as the reference, a coordinate system is established with latitude as the x-axis and longitude as the y-axis. The vector equation is decomposed into the Equation 16:
In this study, we extracted a total of 346 sea ice drift velocity samples from the GOCI covering the winters from 2011 to 2021 in the Bohai Sea region. These samples were then matched with wind and drift current data from ECMWF. Among these, 173 randomly selected samples were used for the inversion of drag coefficients for wind and drift current. The remaining 173 samples were utilized for validation. The result is in the following values for the drag coefficients of wind and drift current, as shown in Equation 17:
The Bohai Sea experiences distinct monsoonal climate patterns characterized by cold and dry winters. During the winter season, dry and cold air masses from Siberia and the Mongolian Plateau descend into the region, resulting in prevailing northwest and north winds. The dominant wind direction in the Bohai Sea is primarily from the northwest. Regarding the influence of oceanic currents, the marine flow system in the Bohai Sea is primarily composed of the remnant branches of the Yellow Sea Warm Current and coastal currents, as shown in Figure 10A. The dashed line represents the remnant branches of the Yellow Sea Warm Current, which intrude into the northern part of the strait, extending westward along the western coast of the Bohai Sea. Upon encountering the coastline, it bifurcates into two branches, one moving northward along the coast of western Liaodong and joining the coastal current along the coast of eastern Liaodong. This forms a weak clockwise circulation pattern. The Liaodong Coastal Current (LC) is located within Liaodong Bay and exhibits characteristics of density-driven flow, primarily flowing southward during the winter season. The southern branch of the remnant current shifts southward along Bohai Bay’s coast, converging with the Bohai Coastal Current (BC), which originates from the Yellow River estuary and flows eastward along the northern coast of Shandong Province, ultimately exiting the Bohai Sea through the southern straits. Examining the drag coefficients related to wind, it is clear that in the x-axis (eastward) direction, the drift velocity is significantly affected by y-axis (northward) winds. Conversely, in the y-axis direction, drift velocity is more influenced by x-axis winds. As discussed earlier, sea ice drift in the Bohai Sea is predominantly in the southwest direction, which is perpendicular to the prevailing winter monsoon winds. Therefore, the impact of wind fields in the Bohai region primarily involves altering the direction of sea ice drift. The analysis of the drag coefficients related to oceanic currents indicates that the influence of flow fields on sea ice drift is concentrated mainly along the y-axis. Thus, currents not only affect the direction of sea ice drift but also impact the magnitude of sea ice drift velocity. In the winter season, the current patterns in the Liaodong Bay area consist mainly of weak clockwise circulation. However, since the sea ice drift direction is predominantly southwestward, the influence of currents on sea ice drift in this region is more complex and warrants further investigation in future studies.
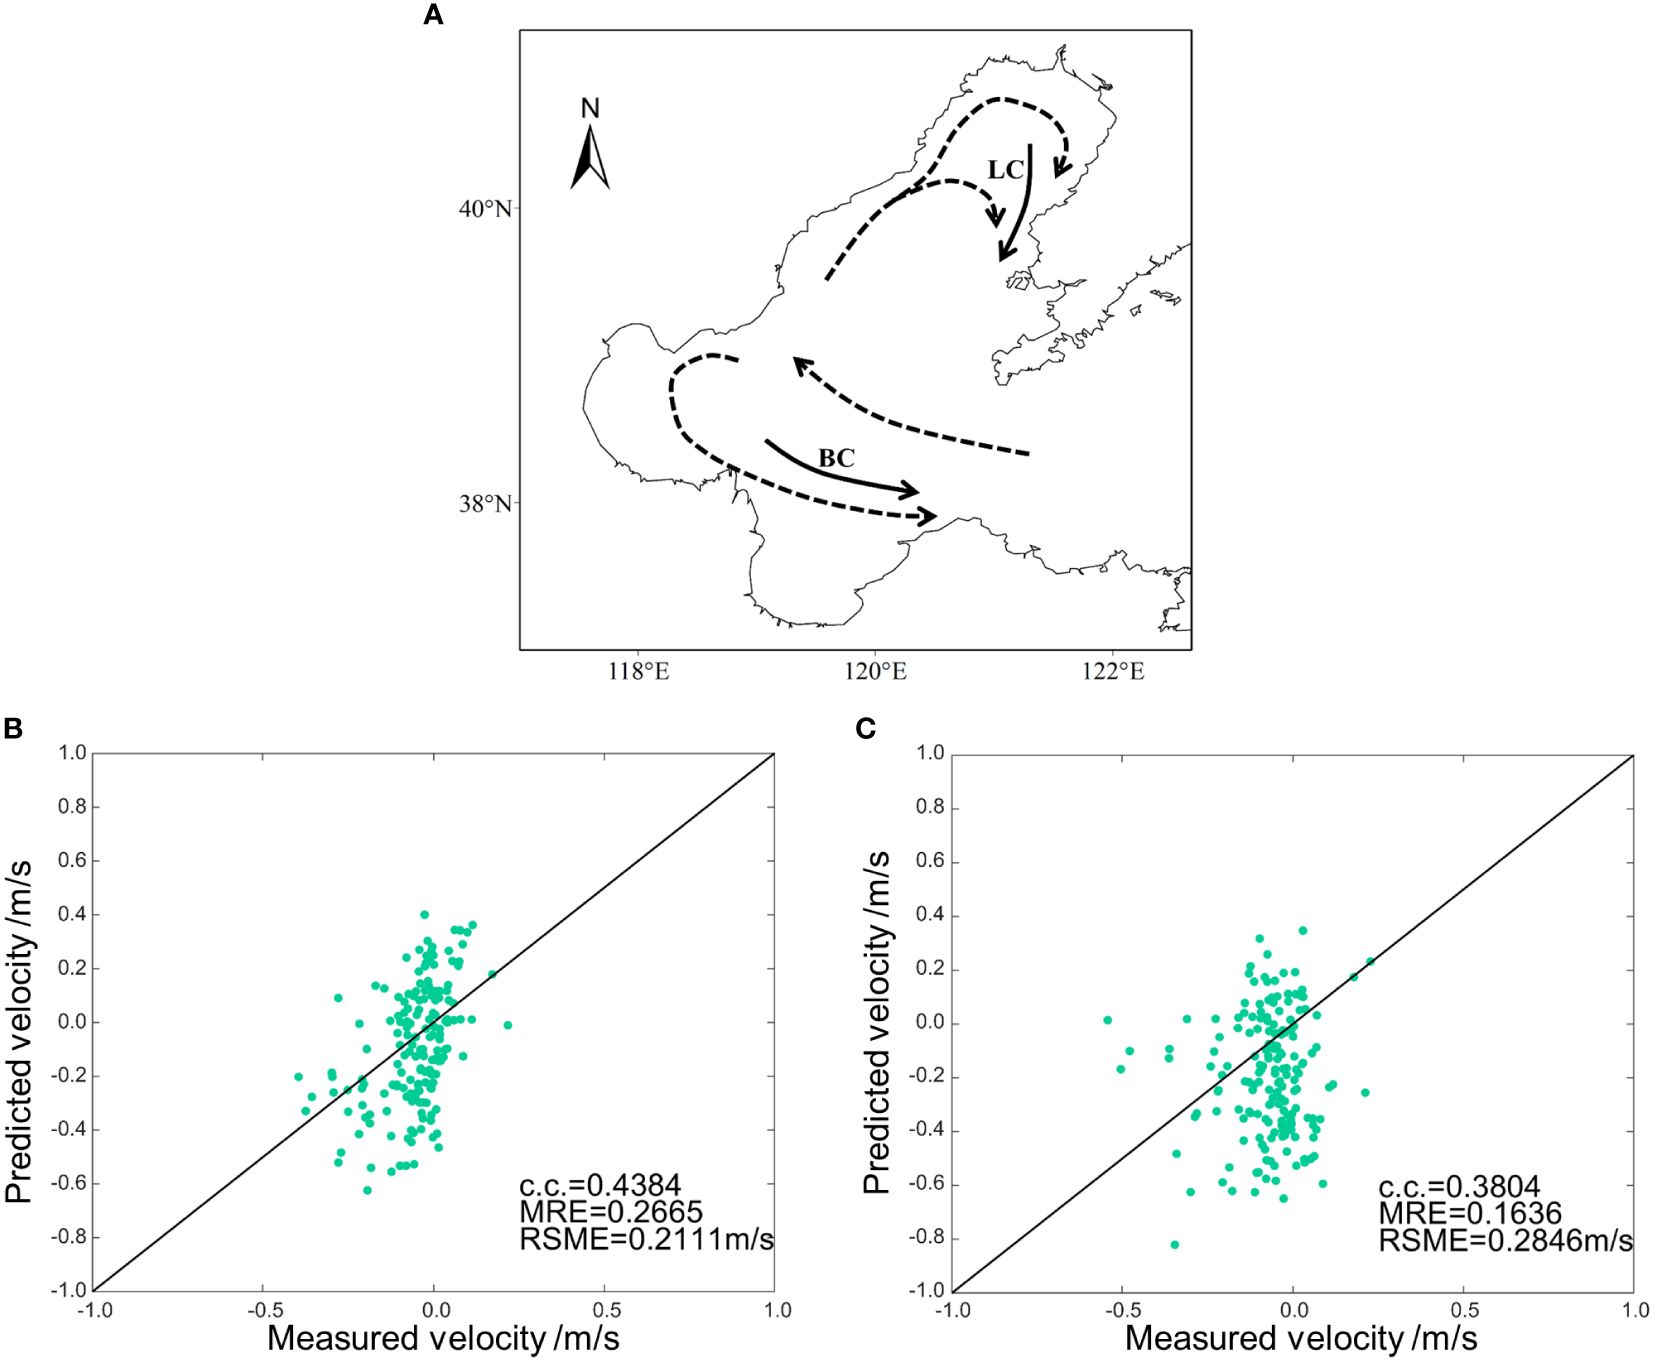
Figure 10 The current and velocity in the Bohai Sea. (A) Circulation and coastal current in the Bohai Sea. (B) Measured and predicted . (C) Measured and predicted .
The comparison between the measured and estimated data obtained from the validation samples is shown in Figures 10B, C. The correlation coefficients for the x and y directions are 0.3804 and 0.4384, respectively, indicating a significant level of error. This could be attributed to the simplicity of the model, as sea ice drift is a complex motion influenced by multiple factors. In this context, the model only considers its primary influencing factors, wind and drift currents. Additionally, the wind and drift current data used for modeling are based on ERA5 reanalysis data, which inherently contain some degree of error. In future work, consideration could be given to using field-observed data for modeling. From the inversion results, it is evident that the drag coefficient for the drift current is significantly larger than the drag coefficient for the wind, indicating that the drift current has a more pronounced impact on sea ice drift velocity compared to the wind, which aligns with the findings in the literature (Lang et al., 2014). Both drag coefficients are positive, implying that higher drift current and wind speeds lead to increased sea ice drift velocity.
5 Conclusions
The Bohai Sea and its coastal areas are important economic zones in China. Sea ice freezing and sea drift have varying degrees of impact on maritime shipping and maritime production, so it is very important to quantify and standardize high-resolution and high-precision sea ice monitoring in the Bohai Sea. Based on GOCI, in this study, we extracted a standardized dataset of sea ice parameters with high spatial resolution from 2011 to 2021 in the Bohai Sea, including sea ice thickness, sea ice concentration, sea ice area and sea ice drift velocity, quantitatively analyzed the 10-year statistical distribution of sea ice parameters, and discussed the influence of ocean dynamic factors on sea ice in the Bohai Sea. The research shows the following:
(1) The physical parameters of sea ice in the Bohai Sea have obvious interannual variations. The average sea ice area exhibits an annual decline of approximately 357.35 km2, and sea ice thickness diminishes by approximately 0.30 cm per year. According to the distribution of sea ice, 2012, 2013, 2016, 2018 and 2021 were classified as high sea ice extent years, and 2014, 2015, 2017, 2019 and 2020 were classified as low sea ice extent years. The development of sea ice in low sea ice extent years exhibited a lag of 10 days compared with that in high sea ice extent years. Every February, the sea ice thickness of the Bohai Sea exhibited different degrees of sudden growth. Temperature and wind speed were closely related to the physical parameters of sea ice.
(2) The sea ice drift velocity in the Bohai Sea showed no obvious interannual change, and the direction was mostly southwest. The representative data of the growth ice period, the development ice period, and the melting ice period in 2013 and 2020 were selected to analyze the relationship between the changes in sea ice dynamic parameters and the physical parameters of sea ice. The results showed that the divergence of drift velocity was slightly larger during the development ice period. The curl of the drift velocity was basically unchanged in the three periods. The drift velocity gradient was larger at the sea ice edge. The interaction between sea ice in the Bohai Sea is very little.
(3) The correlation between the starting temperature and the accumulation period with sea ice area and sea ice thickness was analyzed, and a statistical model of accumulated temperature and wind speed was established. Then, the accuracy of the model was verified. The model can provide reference for sea ice forecast in Bohai Sea. The statistical model of sea ice drift velocity was established by inverting the drag coefficient of wind and drift current, and its accuracy indicated a significant level of error. In future work, consideration could be given to using field-observed data for modeling.
These results showed that the main factors influencing sea ice were ocean dynamic factors: temperature and wind speed affected the sea ice physical parameters, and wind and drift current affected sea ice dynamic parameters. Based on this, we established a statistical model for the relationship between sea ice and ocean dynamic factors, strengthening the prediction of sea ice disasters and the formulation of immediate measures. It can be used to mitigate the impact of sea ice disasters on the local economy, ensure the safety of infrastructure in the Bohai Sea, and promote the exploration and development of resources in the region.
In this paper, the study of sea ice was focused on the Bohai Sea. In future work, we will focus on other seasonal ice regions and polar sea ice, advance our understanding of the change in global sea ice distribution, and improve and revise sea ice forecasting models.
Data availability statement
The original contributions presented in the study are included in the article/Supplementary Material. Further inquiries can be directed to the corresponding author.
Author contributions
RY: Conceptualization, Methodology, Writing – original draft. XZ: Supervision, Writing – review & editing. WB: Software, Writing – review & editing. NW: Validation, Writing – review & editing. YZ: Validation, Writing – review & editing. LB: Visualization, Writing – review & editing. HG: Visualization, Writing – review & editing. YL: Data curation, Writing – review & editing. FD: Data curation, Writing – review & editing. ML: Funding acquisition, Project administration, Writing – review & editing.
Funding
The author(s) declare financial support was received for the research, authorship, and/or publication of this article. This research was funded by Key Laboratory of Space Ocean Remote Sensing and Application under grant 2023CFO015, the National Natural Science Foundation of China under grant 41976173, 61971455, and 41976168; the Shandong Provincial Natural Science Foundation, China under grant ZR2019MD016, ZR2020MD095, ZR201910290171; the Shandong joint fund of National Natural Science Foundation of China under grant U2006207; and the Ministry of Science and Technology of China and the European Space Agency through the Dragon-5 Program under grant 57889.
Acknowledgments
The authors thank the Korea Ocean Satellite Center for providing the GOCI data. The ocean dynamic factors were provided by ECMWF ERA5. We thank all the captains, crew, and participants for their dedicated support.
Conflict of interest
The authors declare that the research was conducted in the absence of any commercial or financial relationships that could be construed as a potential conflict of interest.
Publisher’s note
All claims expressed in this article are solely those of the authors and do not necessarily represent those of their affiliated organizations, or those of the publisher, the editors and the reviewers. Any product that may be evaluated in this article, or claim that may be made by its manufacturer, is not guaranteed or endorsed by the publisher.
Supplementary material
The Supplementary Material for this article can be found online at: https://www.frontiersin.org/articles/10.3389/fmars.2024.1364889/full#supplementary-material
References
Ahn J. H., Park Y. J., Ryu J. H., Lee B., Oh I. S. (2012). Development of atmospheric correction algorithm for Geostationary Ocean Color Imager (GOCI). Ocean Sci. J. 47, 247–259. doi: 10.1007/s12601-012-0026-2
Bulletin of China Marine Disaster (2023). Available at: https://www.mnr.gov.cn/sj/sjfw/hy/gbgg/zghyzhgb/ (Accessed 2023).
Cai Q., Wang J., Beletsky D., Overland J., Ikeda M., Wan L. (2021). Accelerated decline of summer Arctic sea ice during 1850–2017 and the amplified Arctic warming during the recent decades. Environ. Res. Lett. 16, 034015. doi: 10.1088/1748-9326/abdb5f
Deng J., Dai A. (2022). Sea ice–air interactions amplify multidecadal variability in the North Atlantic and Arctic region. Nat. Commun. 13, 2100. doi: 10.1038/s41467-022-29810-7
Gong S., Chen W., Zhang C., Yan Q., Yang H. (2022). Variability of sea ice from 2008 to 2019 in the Bohai and Northern Huanghai Sea, China and the relationship with climatic factors. J. Ocean Univ. China 21, 1189–1197. doi: 10.1007/s11802-022-4948-8
Grenfell T. C., Perovich D. K. (1984). Spectral albedos of sea ice and incident solar irradiance in the southern Beaufort Sea. J. Geophysical Res.: Oceans 89, 3573–3580. doi: 10.1029/JC089iC03p03573
Gu W., Liu C., Yuan S., Li N., Chao J., Li L., et al. (2013). Spatial distribution characteristics of sea-ice-hazard risk in Bohai, China. Ann. Glaciol. 54, 73–79. doi: 10.3189/2013AoG62A303
Hao G., Su J., Vihma T., Huang F. (2020). Trends, abrupt shifts and interannual variability of the Arctic Wintertime Seasonal Sea Ice from 1979 to 2019. Ann. Glaciol. 61, 441–453. doi: 10.1017/aog.2020.68
He X., Bai Y., Pan D., Huang N., Dong X., Chen J., et al. (2013). Using geostationary satellite ocean color data to map the diurnal dynamics of suspended particulate matter in coastal waters. Remote Sens. Environ. 133, 225–239. doi: 10.1016/j.rse.2013.01.023
Hersbach H., Bell B., Berrisford P., Biavati G., Horányi A., Muñoz Sabater J., et al. (2023). Data from: ERA5 hourly data on single levels from 1940 to present. Copernicus Climate Change Service (C3S) Climate Data Store (CDS). doi: 10.24381/cds.adbb2d47
Ji Y. G., Zhang J., Meng J. M., Zhang Y. (2007). ABMR ice thickness model and its application to Bohai Sea in China. Prog. In Electromagnetics Res. 76, 183–194. doi: 10.2528/PIER07071003
Ke C., Wang M. (2018). Seasonal and interannual variation of thinkness and volume of the Arctic sea ice based on CryoSat-2 during 2010-2017. HaiyangXuebao 40, 1–13. doi: 10.3969/ji.ssn.0253-4193.2018.11.001
Kumar A., Yadav J., Mohan R. (2021). Seasonal sea-ice variability and its trend in the Weddell Sea sector of West Antarctica. Environ. Res. Lett. 16, 024046. doi: 10.1088/1748-9326/abdc88
Lang W., Wu Q., Zhang X., Meng J., Wang N., Cao Y. (2014). Sea ice drift tracking in the Bohai Sea using geostationary ocean color imagery. J. Appl. Remote Sens. 8, 083650–083650. doi: 10.1117/1.JRS.8.083650
Li Y., Su J., Wang Y. (2013). Variability of the pentadly average distance between the sea ice edge and the coast in the Bohai Sea and its key impact factors. Periodical Ocean Univ. China 43, 7–16. doi: 10.16441/j.cnki.hdxb.2013.07.002
Li Y., Yang D. (2020). Extraction of Bohai Sea ice from MODIS data based on multi-constraint endmembers and linear spectral unmixing. Int. J. Remote Sens. 41, 5525–5548. doi: 10.1080/01431161.2020.1734248
Liu W., Sheng H., Zhang X. (2016). Sea ice thickness estimation in the Bohai Sea using geostationary ocean color imager data. Acta Oceanologica Sin. 35, 105–112. doi: 10.1007/s13131-016-0910-1
Min C., Yang Q., Mu L., Kauker F., Ricker R. (2021). Ensemble-based estimation of sea-ice volume variations in the Baffin Bay. Cryosphere 15, 169–181. doi: 10.5194/tc-15-169-2021
Mustapha M. A., Saitoh S. I. (2008). Observations of sea ice interannual variations and spring bloom occurrences at the Japanese scallop farming area in the Okhotsk Sea using satellite imageries. Estuarine Coast. Shelf Sci. 77, 577–588. doi: 10.1016/j.ecss.2007.10.021
Rigor I. G., Wallace J. M. (2004). Variations in the age of Arctic sea-ice and summer sea-ice extent. Geophysical Res. Lett. 31, L09401. doi: 10.1029/2004GL019492
Shi W., Wang M. (2012a). Sea ice properties in the Bohai Sea measured by MODIS-Aqua: 1. Satellite algorithm development. J. Mar. Syst. 95, 32–40. doi: 10.1016/j.jmarsys.2012.01.012
Shi W., Wang M. (2012b). Sea ice properties in the Bohai Sea measured by MODIS-Aqua: 2. Study of sea ice seasonal and interannual variability. J. Mar. Syst. 95, 41–49. doi: 10.1016/j.jmarsys.2012.01.010
Su H., Ji B., Wang Y. (2019). Sea ice extent detection in the Bohai Sea using Sentinel-3 OLCI data. Remote Sens. 11, 2436. doi: 10.3390/rs11202436
Su H., Wang Y., Xiao J., Yan X. H. (2015). Classification of MODIS images combining surface temperature and texture features using the Support Vector Machine method for estimation of the extent of sea ice in the frozen Bohai Bay, China. Int. J. Remote Sens. 36, 2734–2750. doi: 10.1080/01431161.2015.1041619
Tao S. S., Dong S., Wang Z. F., Soares C. G. (2018). Intensity division of the sea ice zones in China. Cold Regions Sci. Technol. 151, 179–187. doi: 10.1016/j.coldregions.2018.03.010
Toyota T., Kimura N., Nishioka J., Ito M., Nomura D., Mitsudera H. (2022). The interannual variability of sea ice area, thickness, and volume in the Southern sea of Okhotsk and its likely factors. J. Geophysical Res.: Oceans 127, e2022JC019069. doi: 10.1029/2022JC019069
Xie F., Gu W., Ha S., Cui W., Chen W., Zhou C., et al. (2006). An experimental study on the spectral characteristics of one year-old sea ice in the Bohai Sea, China. Int. J. Remote Sens. 27, 3057–3063. doi: 10.1080/01431160600589153
Yan Y., Gu W., Xu Y., Li Q. (2019b). The in situ observation of modelled sea ice drift characteristics in the Bohai Sea. Acta Oceanologica Sin. 38, 17–25. doi: 10.1007/s13131-019-1395-5
Yan Y., Huang K., Shao D., Xu Y., Gu W. (2019a). Monitoring the characteristics of the Bohai Sea ice using high-resolution geostationary ocean color imager (GOCI) data. Sustainability 11, 777. doi: 10.3390/su11030777
Yan Y., Shao D., Gu W., Liu C., Li Q., Chao J., et al. (2017). Multidecadal anomalies of Bohai Sea ice cover and potential climate driving factors during 1988–2015. Environ. Res. Lett. 12, 094014. doi: 10.1088/1748-9326/aa8116
Yeom J. M., Kim H. O. (2013). Feasibility of using Geostationary Ocean Colour Imager (GOCI) data for land applications after atmospheric correction and bidirectional reflectance distribution function modelling. Int. J. Remote Sens. 34, 7329–7339. doi: 10.1080/2150704X.2013.817708
Yi D., Zwally H. J., Robbins J. W. (2011). ICESat observations of seasonal and interannual variations of sea-ice freeboard and estimated thickness in the Weddell Sea, Antarctica, (2003–2009). Ann. Glaciol. 52, 43–51. doi: 10.3189/172756411795931480
Yuan S., Gu W., Xu Y., Wang P., Huang S., Le Z., et al. (2012). The estimate of sea ice resources quantity in the Bohai Sea based on NOAA/AVHRR data. Acta Oceanologica Sin. 31, 33. doi: 10.1007/s13131-012-0173-4
Zhang X. L., Zhang Z. H., Xu Z. J., Li G., Sun Q., Hou X. J. (2013). Sea ice disasters and their impacts since 2000 in Laizhou Bay of Bohai Sea, China. Natural hazards 65, 27–40. doi: 10.1007/s11069-012-0340-0
Keywords: Bohai Sea, sea ice parameter, geostationary ocean color imager, long-term dataset, statistical models
Citation: Yan R, Zhang X, Bi W, Wang N, Zhao Y, Bi L, Guan H, Liu Y, Duan F and Liu M (2024) Extraction and analysis of the sea ice parameter dataset of the Bohai Sea from 2011 to 2021 based on GOCI. Front. Mar. Sci. 11:1364889. doi: 10.3389/fmars.2024.1364889
Received: 03 January 2024; Accepted: 12 April 2024;
Published: 26 April 2024.
Edited by:
Takafumi Hirata, Hokkaido University, JapanReviewed by:
Hailun He, Ministry of Natural Resources, ChinaLi Zhijun, Dalian University of Technology, China
Copyright © 2024 Yan, Zhang, Bi, Wang, Zhao, Bi, Guan, Liu, Duan and Liu. This is an open-access article distributed under the terms of the Creative Commons Attribution License (CC BY). The use, distribution or reproduction in other forums is permitted, provided the original author(s) and the copyright owner(s) are credited and that the original publication in this journal is cited, in accordance with accepted academic practice. No use, distribution or reproduction is permitted which does not comply with these terms.
*Correspondence: Meijie Liu, liu_meijie@163.com