Numerical modelling of the interaction between flexible net panels and fluids using SPH method
 Qian Shi
  Dawen Xue
 Lifeng Zhang
 Yun Pan
- School of Naval Architecture and Maritime, Zhejiang Ocean University, Zhoushan, China
This study addresses the challenge of simulating fluid flow around flexible net panels, which are critical components in aquaculture systems. Traditional grid-based Eulerian methods struggle with the complex deformations and interactions of such panels. To fill this gap, a numerical approach leveraging the Smoothed Particle Hydrodynamics (SPH) method is introduced. The proposed approach employs a knot-spring model to represent the flexible net panels. The nets are idealized as a structure of physical net-knots linked by virtual elastic springs. The SPH method is used to simulate the fluid flow, capturing the movement of the knots and the resulting deformation of the nets. The model's parameters and numerical schemes are detailed, along with the implementation process. The accuracy of the model is validated through comparisons with existing experimental and simulation data. The results indicate that the SPH-based approach accurately simulates the flow past flexible net panels, providing a detailed velocity distribution and deformation analysis. The study's findings demonstrate the potential of the SPH method for aquaculture engineering applications. The proposed approach offers a promising alternative to traditional methods, particularly in scenarios involving significant net deformation or interaction with other objects. The implications for the design and operation of aquaculture facilities are discussed, along with suggestions for future research directions.
1 Introduction
As the fundamental component in the aquaculture structures, the nets are of significant importance to the aquaculture by maintaining the aquaculture space as well as preventing fish from escaping. However, environmental loads such as currents and waves can pose risks to the nets, leading to a reduction in the volume of the aquaculture space or even net breakage, which can result in fish loss in aquaculture.
To address these challenges, extensive experimental investigations (Lader et al., 2007; Patursson et al., 2010; Tsukrov et al., 2011; Bi et al., 2013, 2018; Tang et al., 2018; Chen et al., 2023) focusing on the hydrodynamic drag and the drag coefficient of the net panel structures have been conducted. Based on the experimental results, computational methods have also been developed to analyze the hydrodynamic loads on the net panel structures. In general, two commonly used computational models for predicting hydrodynamic forces on nets are the Morison model (Løland, 1991; Zhao et al., 2007; DeCew et al., 2010) and the Screen model (Balash et al., 2009; Kristiansen and Faltinsen, 2012; Cheng et al., 2020). The Morison model represents the net as individual twines using truss or spring elements, and the twines and knots are assumed to be cylindrical and spherical units, respectively. The hydrodynamic loads on each unit are calculated based on drag and lift force coefficients, and the total unit forces on the net are subsequently extracted as the loads on the nets. The Screen model focuses on net panels or screens to calculate forces. Both models require input of flow field velocity and utilize drag and lift force formulas based on experimental coefficients.
Apart from hydrodynamic forces on the nets, the flow velocity distribution around aquaculture structures has also attracted a significant amount of attention. The presence of net structures reduces flow velocity downstream of permeable nets, resulting in a wake shielding effect (Lee et al., 2008; Patursson et al., 2010; Tang et al., 2011; Xu et al., 2013; Zhao et al., 2013; Cheng et al., 2020; Sim et al., 2021). In practical fish farming scenarios with multiple aquaculture structures, nets at different positions experience varying flow velocities, resulting in different forces due to the velocity-squared relationship in the hydrodynamic force formula. Furthermore, flow field characteristics determine the distribution of nutrients, waste, and dissolved oxygen in fish farms (Bi et al., 2014), making the investigation of flow fields around net structures as much important as the hydrodynamic loads.
As a matter of fact, the interaction between nets and the fluid is a two-way coupled fluid-structure interaction (FSI) process. The nets are affected by the flow under currents and waves, and at the same time, the nets, in turn, also affect the flow field, the coupled interaction influences structural responses, global movement of aquaculture structures, as well as flow characteristics, and water exchange.
In recent years, Computational Fluid Dynamics (CFD) has made significant advancements in addressing FSI problems, offering flexible and cost-effective numerical simulations compared to laboratory tests or field measurements. It is well recognized that combining CFD simulations and structural analyses can acquire more accurate structural responses than utilizing only structural analyses (Bi et al., 2014; Yao et al., 2016a). Additionally, results from CFD simulations provide valuable insights into the understanding of nutrients and materials transport (Oppedal et al., 2011; Alver et al., 2016) and pollutant distribution (Xu and Qin, 2020) in fish farms, making coupled FSI analyses a growing trend in hydrodynamic analyses of aquaculture net structures. Aiming at this, researchers have proposed various numerical approaches to simulate the fluid-structure coupling of nets. Bi et al. (2014) proposed a numerical approach with Ansys-Fluent, the porous media model and the lumped-mass model is combined to simulate the net motion and deformation as well as the flow velocity reduction and downstream shielding effects. In a similar vein, with the joint of CFD simulation and structural analysis, Yao et al. (2016a); Yao et al. (2016b) proposed a hybrid volume approach with mass-spring model and the super elements model, simulations of rigid and flexible net cages are carried out and detailed flow fields and net cage deformation are provided. Numerical frameworks based on Reef3D and combining screen force model, lumped mass models, and advanced simulation techniques have been used to model aquaculture structures in waves and currents (Martin et al., 2020a, 2022; Martin and Bihs, 2021). Other approaches involve the use of OpenFOAM and Code_Aster (Cheng et al., 2022), combining finite volume and finite element methods to handle fluid-structure interactions of nets and cage structures. The validation studies confirm that their simulation model can achieve reliable results.
Nevertheless, there is still a need for the development of methods to simulate the fluid-structure coupling of nets. In the above simulations, either the Morison model or the screen model are used for calculating the hydrodynamic forces, which require the input of drag and lift force coefficients. The coefficients are typically determined from experimental data and additional data-fitting algorithm, and this reliance on force coefficients may introduce uncertainty and sensitivity in the results. In addition, the simulation approaches mentioned above primarily rely on mesh-based methods. Although mesh-based simulations may be feasible in FSI problem of the nets, it can encounter challenges and limitations when dealing with the remeshing process of the structure and flow field when the nets deform, especially in large deformation. The mesh generation of the net structure is inherently challenging, and moreover, the remeshing process usually requires a significant amount of computational resources and time, and even may introduce inaccuracies or simulation failures such as mesh distortion in cases of large deformations.
In contrast, Smoothed Particle Hydrodynamics (SPH) a mesh-free technique based on a pure Lagrangian description. Originally developed for astrophysical applications by Lucy (1977) and Gingold and Monaghan (1977), it has been widely adapted to a range of problems in various disciplines. In this Lagrangian particle-based approach, the fluid and solid parts are modeled as a set of interacting particles that can move and evolve in space. Each particle represents small volumes of fluid and solid, their interactions are calculated to simulate the overall behavior, the fluid and solid properties such as density, pressure, and velocity are associated with each particle. The continuity, momentum, energy and equations are discretized and solved on these particles. As a mesh-free technique, the main advantage of the SPH method is to bypass the need for the numerical mesh to calculate spatial derivatives and avoid the problems associated with mesh tangling and distortion. Thus, the SPH method is particularly suitable for simulating fluid flows with complex geometries, deformations, and interactions. It can handle free surfaces, breakups, and merging of fluid elements, making it an effective tool for various applications such as fluid mechanics, computational fluid dynamics, and computer graphics.
In light of the above discussion, the objective of the study is to develop a numerical model based on SPH method to simulate the fluid-structure interaction between net panels and fluids. The model is demonstrated through various test cases, including rigid nets, flexible net motion, and fluid-structure interactions. The paper presents details of the numerical fluid and net models, followed by results from validation cases that assess the model’s performance. Finally, the study concludes with a summary of findings and potential directions for future research.
2 Numerical approach
2.1 SPH methods and DualSPHysics
As mentioned above, Smoothed Particle Hydrodynamics is a fully Lagrangian and mesh-free method which is widely applied in the field of solid and fluid mechanics. DualSPHysics is an open-source code based on the smoothed particle hydrodynamics (SPH) method. The DualSPHysics code (Crespo et al., 2015) was developed as an extension of the SPHysics code, and has been employed for studying various phenomena such as free-surface flow and fluid-structure interaction, etc. DualSPHysics was specifically designed to address real engineering problems, offering the flexibility to run on both CPUs and GPUs. It is capable of simulating systems with millions of particles within reasonable computation time, which provides a powerful tool for analyzing complex fluid dynamics scenarios.
In the open source code DualSPHysics, the following governing equations have been implemented.
Where t represents time, , position, , velocity, P, pressure, ρ, density, m, mass, c speed of sound, , the gravitational acceleration and the viscous term. The kernel function, , depends on the normalised distance between particles a and b. The Quintic kernel was adopted for the present study. The artificial viscosity is used here ( ). In addition, the density diffusion formulation proposed by Molteni and Colagrossi (2009) is applied.
The system is closed by the addition of Tait’s equation of state
where γ =7 is the polytropic constant and , is the reference density and the numerical speed of sound. More details about formulation can be found in Crespo et al. (2015) and more particular parameters that have been used in the simulations of this work can be found in Tan et al. (2023).
2.2 Net panel model
In aquaculture structures, nets typically consist of a large number of individual twines, thus directly modeling each twine can be computationally impractical. For improving the calculation efficiency while maintaining the similarity of the physical model, the mesh grouping method (Bessonneau and Marichal, 1998; Huang et al., 2019), which is a replacement of multiple meshes with less number of equivalent meshes, is commonly used in the numerical simulation and physical model test of net structures. In this approach, an equivalent net model is used to represent the actual prototype net in the simulation. The net solidity of the equivalent net model is set as the same of the prototype net.
By selecting an appropriate mesh grouping factor (λ), which represents the ratio between the twine length of the numerical net (ls) and the actual net (l0), accurate results for analyzing the hydrodynamics of nets can be obtained while significantly improving the calculation speed. Using the mesh grouping method allows for more efficient simulations of net structures, reducing the computational burden while preserving the essential characteristics of the nets. This approach provides a practical and effective means of studying the hydrodynamics of nets in aquaculture systems.
After mesh grouping, as shown in Figure 1, in this study, the net is considered to be composed of multiple cruciform elements, and each cruciform element of the net is treated as an individual object, which is regarded as the physical net-knot with mass and volume, the net-knots are connected through virtual springs without mass and volume. In this model, all external forces such as drag, gravity, and buoyancy, are concentrated solely on the net-knots. The virtual springs represent internal forces resulting from the elasticity of the springs between the knots. By considering the net as a collection of net-knots connected by virtual springs, the model captures the essential behavior of the net’s deformation and response to external forces. This approach allows for the accurate simulation of the net’s dynamics while maintaining computational efficiency.

Figure 1 Illustration of nets in an aquaculture structure, mesh grouping process and knot-spring model in this study. (A) actual aquaculture net (B) equivalent net in simulation (C) net cruciform elements (D) knot-spring model.
2.3 Equation of motion of the knots
The movement of the net-knots makes the deformation of the entire flexible net structure. The total force acting on the net, denoted as F, can be divided into the internal and external forces. The internal force arises from the elasticity of the springs that connect the net-knots, these forces are responsible for maintaining the structural integrity of the net and are derived from the interactions between neighboring knots.
On the other hand, the external forces encompass various factors such as drag, gravity, and buoyancy. These forces act on each individual net-knot and contribute to the overall behavior of the net.
The basic form of the movement equation of each knot is
where m is for mass of the knot, q for the time-dependent vector of nodal displacements, Fd for the hydrodynamic drag acting on the knots, Fg is the gravity, and Fb for buoyancy forces.
For the internal force, it is considered proportional to a degree of displacement. The internal force can be described as
where k is for the stiffness of the spring, n for the unit vector along the line of spring, r for the position vector between the neighboring knots, for magnitude of the position vector, and l0 for the original spring length.
External forces, which work on each of the net-knots from the outside environment, are the drag, buoyancy and gravity force. It is worth noting that in this study, since the springs are regarded as massless and without volume, the external forces primarily act on the net knots, especially with regard to the hydrodynamic drag resulting from fluid interactions. As shown in Figure 2, the black circles and yellow circles represent fluid particles and net knot particles, respectively, while the red circle stands for the support domain of each target particle i, and the particle j is the neighboring particle in the support domain of particle i. When the particle j is outside the support domain of particle i, the interaction cannot be considered, which means particle j has no influence on particle i. Thus, for the fluid particles fall into the support domain of the knot particle i, the force density acting on the knot particle i from the fluid particles can be calculated as

Figure 2 The sketch for the particle interactions between fluids and net knots.
Where represents the force density vector acting on the knot particle i, is the viscosity coefficient of fluid particle j acting on particle i. and are the velocity vectors of particle i and particle j, respectively.
In this way, the hydrodynamic drag can be directly calculated based on the integration of pressure and viscous force over the knot area, without relying on specific hydrodynamic force formula.
As for the springs, it is modeled within Moordyn module, which is already coupled in DualSPHysics codes. With this module, the main task to model the net is to write a script for creating of the knot geometry, the arrangement of net knots and the connections between them with mooring lines (stand for the springs). The coupling procedure of fluids and net-knots is shown in Figure 3. The fluid and knot in the computational domain are first discretized as particles and initialized with their own properties. The governing equations of continuum mechanics based on SPH method are solved first in every time step. The motions and rotations are then passed to MoorDyn and used as input for the mooring line fairlead kinematics. MoorDyn solves the mooring line behaviour during the time step, computes the forces at the fairlead connections, which are transferred back to DualSPHysics. The internal forces of the mooring lines are added in DualSPHysics to obtain the final resulting force acting onto the knots. Thus, the parameters of every particle are updated to the next timestep.
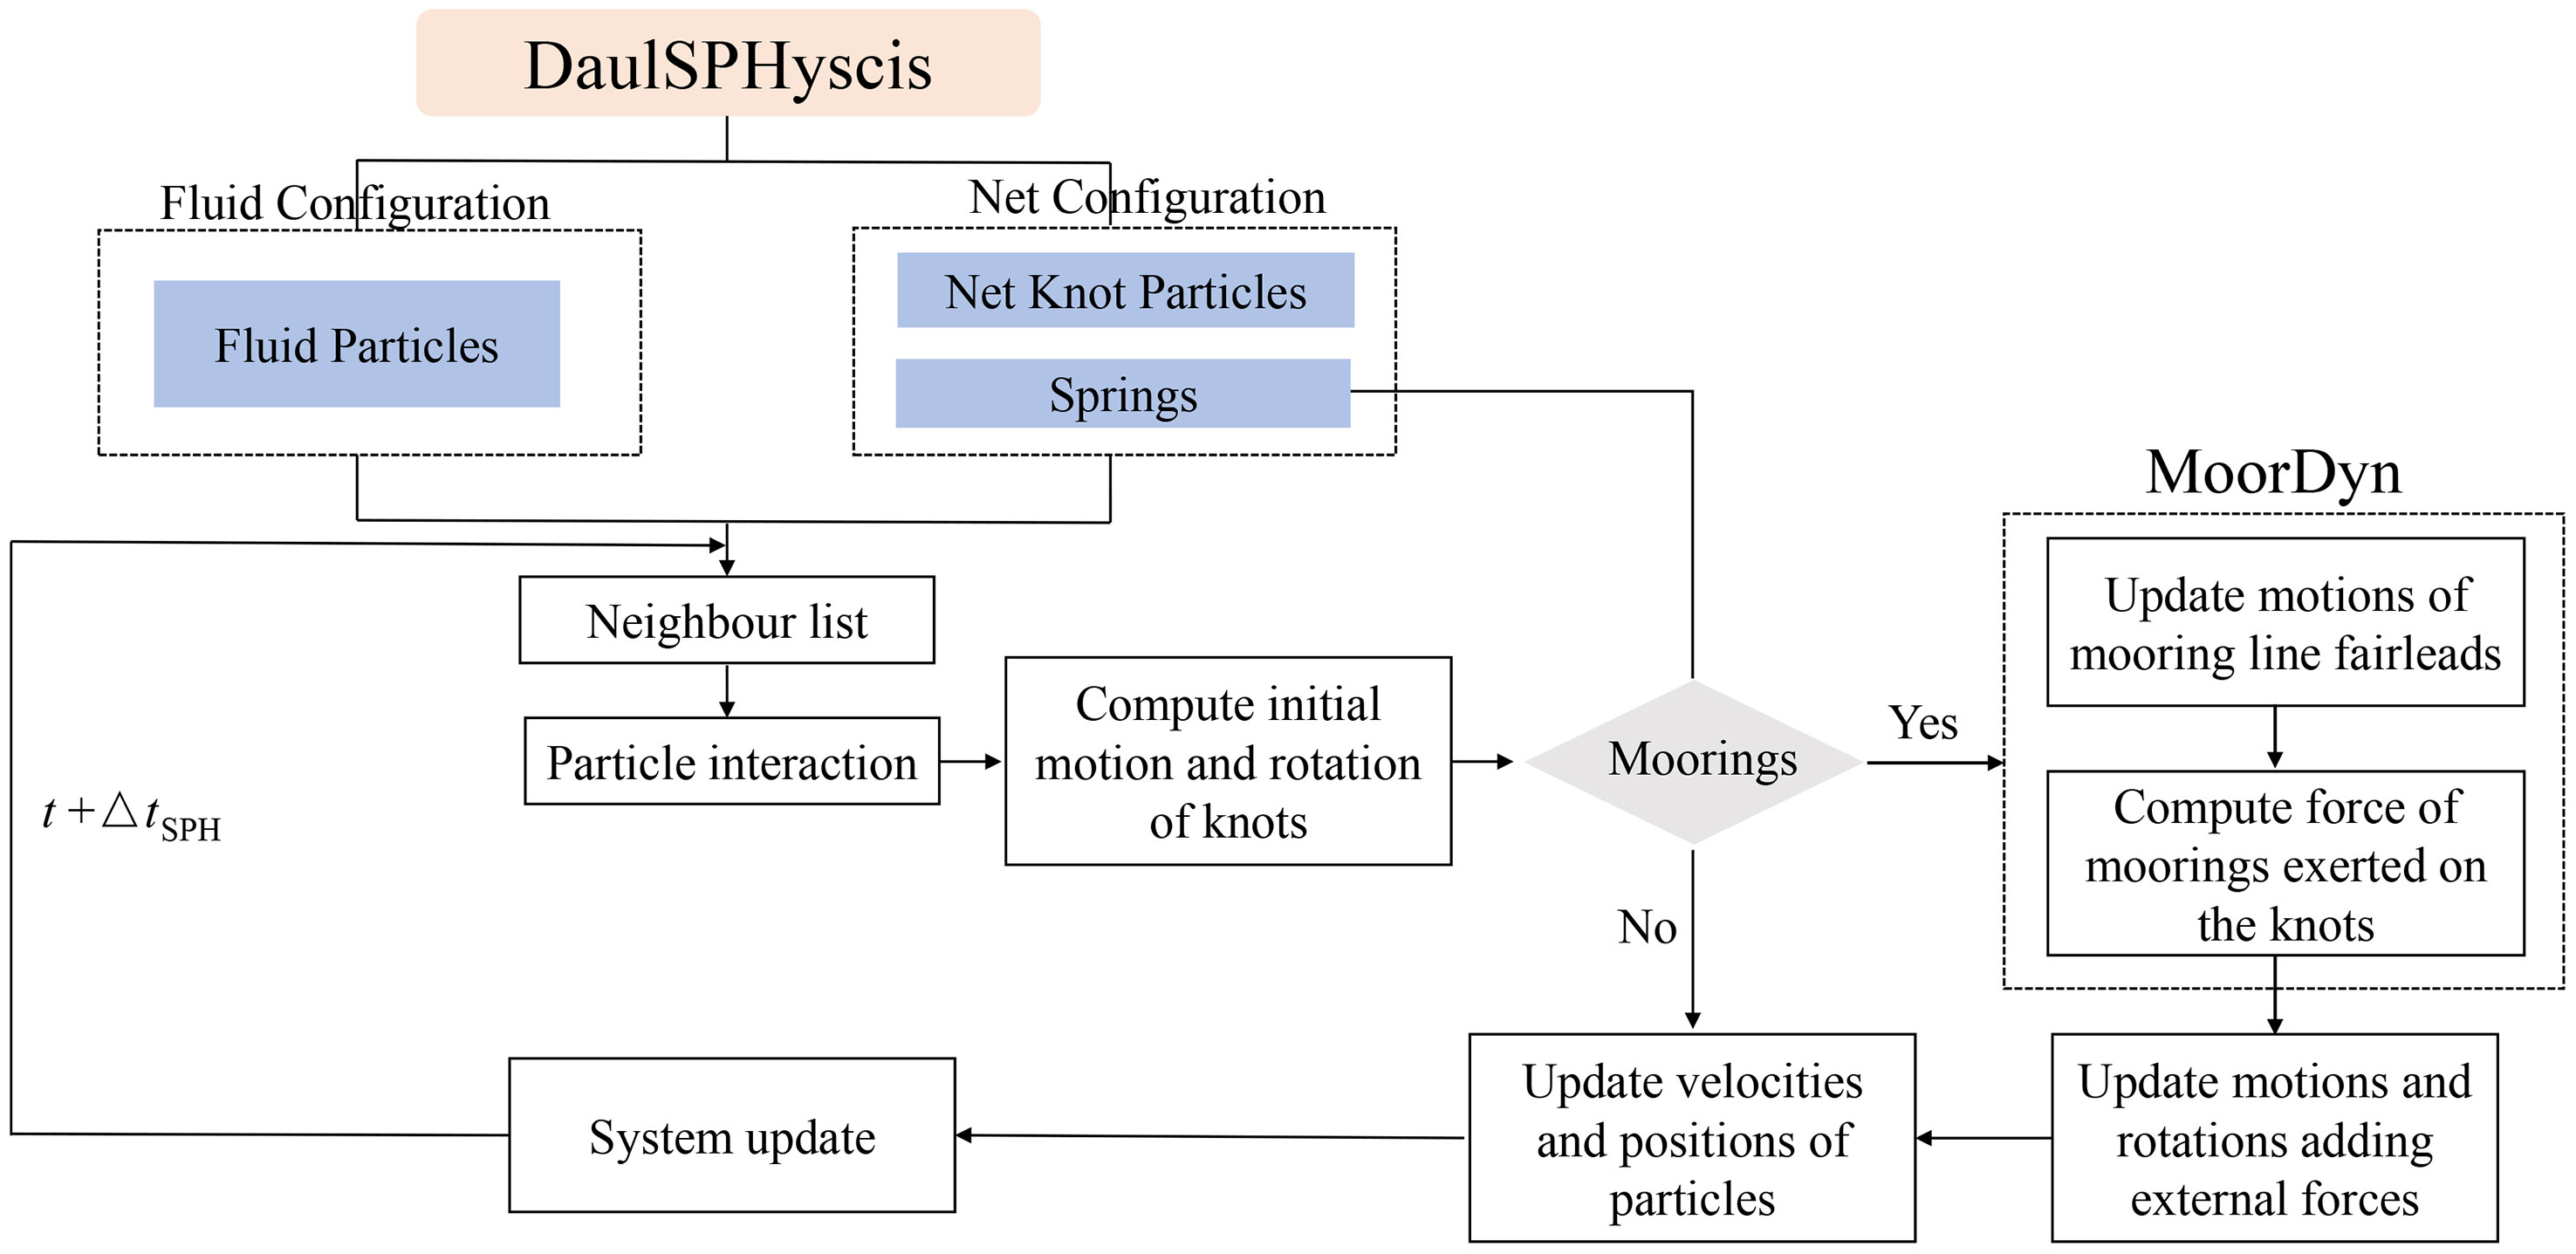
Figure 3 Flow chart of the two-way coupling procedure between the fluids and net knots within DualSPHysics and MoorDyn.
3 Validation of the numerical model
3.1 Determination of the net-knot shape
The accuracy of the simulation relies on accurately representing the cruciform elements of the net through the net-knots, as the movements of these knots determine the net’s deformation. It is crucial to ensure that the net-knot structure possesses equivalent mass, weight, and environmental loads as the original cruciform elements.
To achieve this, the net-knots need to experience the same hydrodynamic drag, gravity, buoyancy forces, and elastic forces from the springs as the forces exerted on the cruciform elements. Typically, the knot is approximated as a sphere, but maintaining the same forces becomes challenging with this shape. To address this, the first focus of this part is on examining the equivalent knot shape and size of a single cruciform element structure in the net panel. On this basis, to account for the interaction among the net twines, the equivalent knot shape of the net panel composed of multiple cruciform elements are tested.
3.1.1 Single cruciform element equivalence
Three different shapes (sphere, circular plate, and square plate) are tested as representations of the cruciform elements. Experimental investigations (Lader et al., 2014) and numerical studies (Bi et al., 2017; Wang et al., 2022) have been conducted on the cruciform structures. Detailed geometric dimensions of the elements are shown in Figure 4 and Table 1.

Figure 4 The net model with different configurations: the cruciform element and the equivalent knot shapes(up); a net panel with 5×5 net twines and its equivalent net model using different knot shapes(bottom).
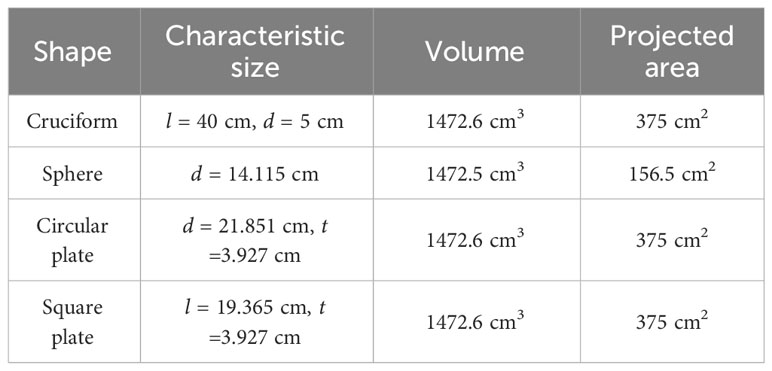
Table 1 Geometric dimensions of the net elements with different shapes.
Maintaining the same gravity and buoyancy between the knots and the cruciform elements can be achieved by ensuring they have the same volume. However, the hydrodynamic drag is influenced not only by the drag coefficients of the knot structure but also by the projected area. In order to study the hydrodynamics and flow around the four element structures, the DualSPHysics code is employed in this study. As depicted in Figure 5, the net element is positioned at the origin of a 3D Cartesian coordinate system. The computational domain is 4m×2m×2m, which is equivalent to 80d × 40d × 40d. The net elements and the walls are discretized using modified dynamic boundary (English et al., 2022) particles, the uniform-size particle strategy is considered to ensure the accuracy of the flow field in the wake and the far-field area, and the particle spacing dp is set to 0.005m, resulting in approximately 100 particles in the cross section of the cruciform element, and a total of approximately 1.28 × 10⁸ SPH particles. Thanks to the GPU version of DualSPHysics and a Tesla A100 (80G) GPU-card, it is able to speed up the simulation in 22.5 hours of real time to model 1 second of physical time.
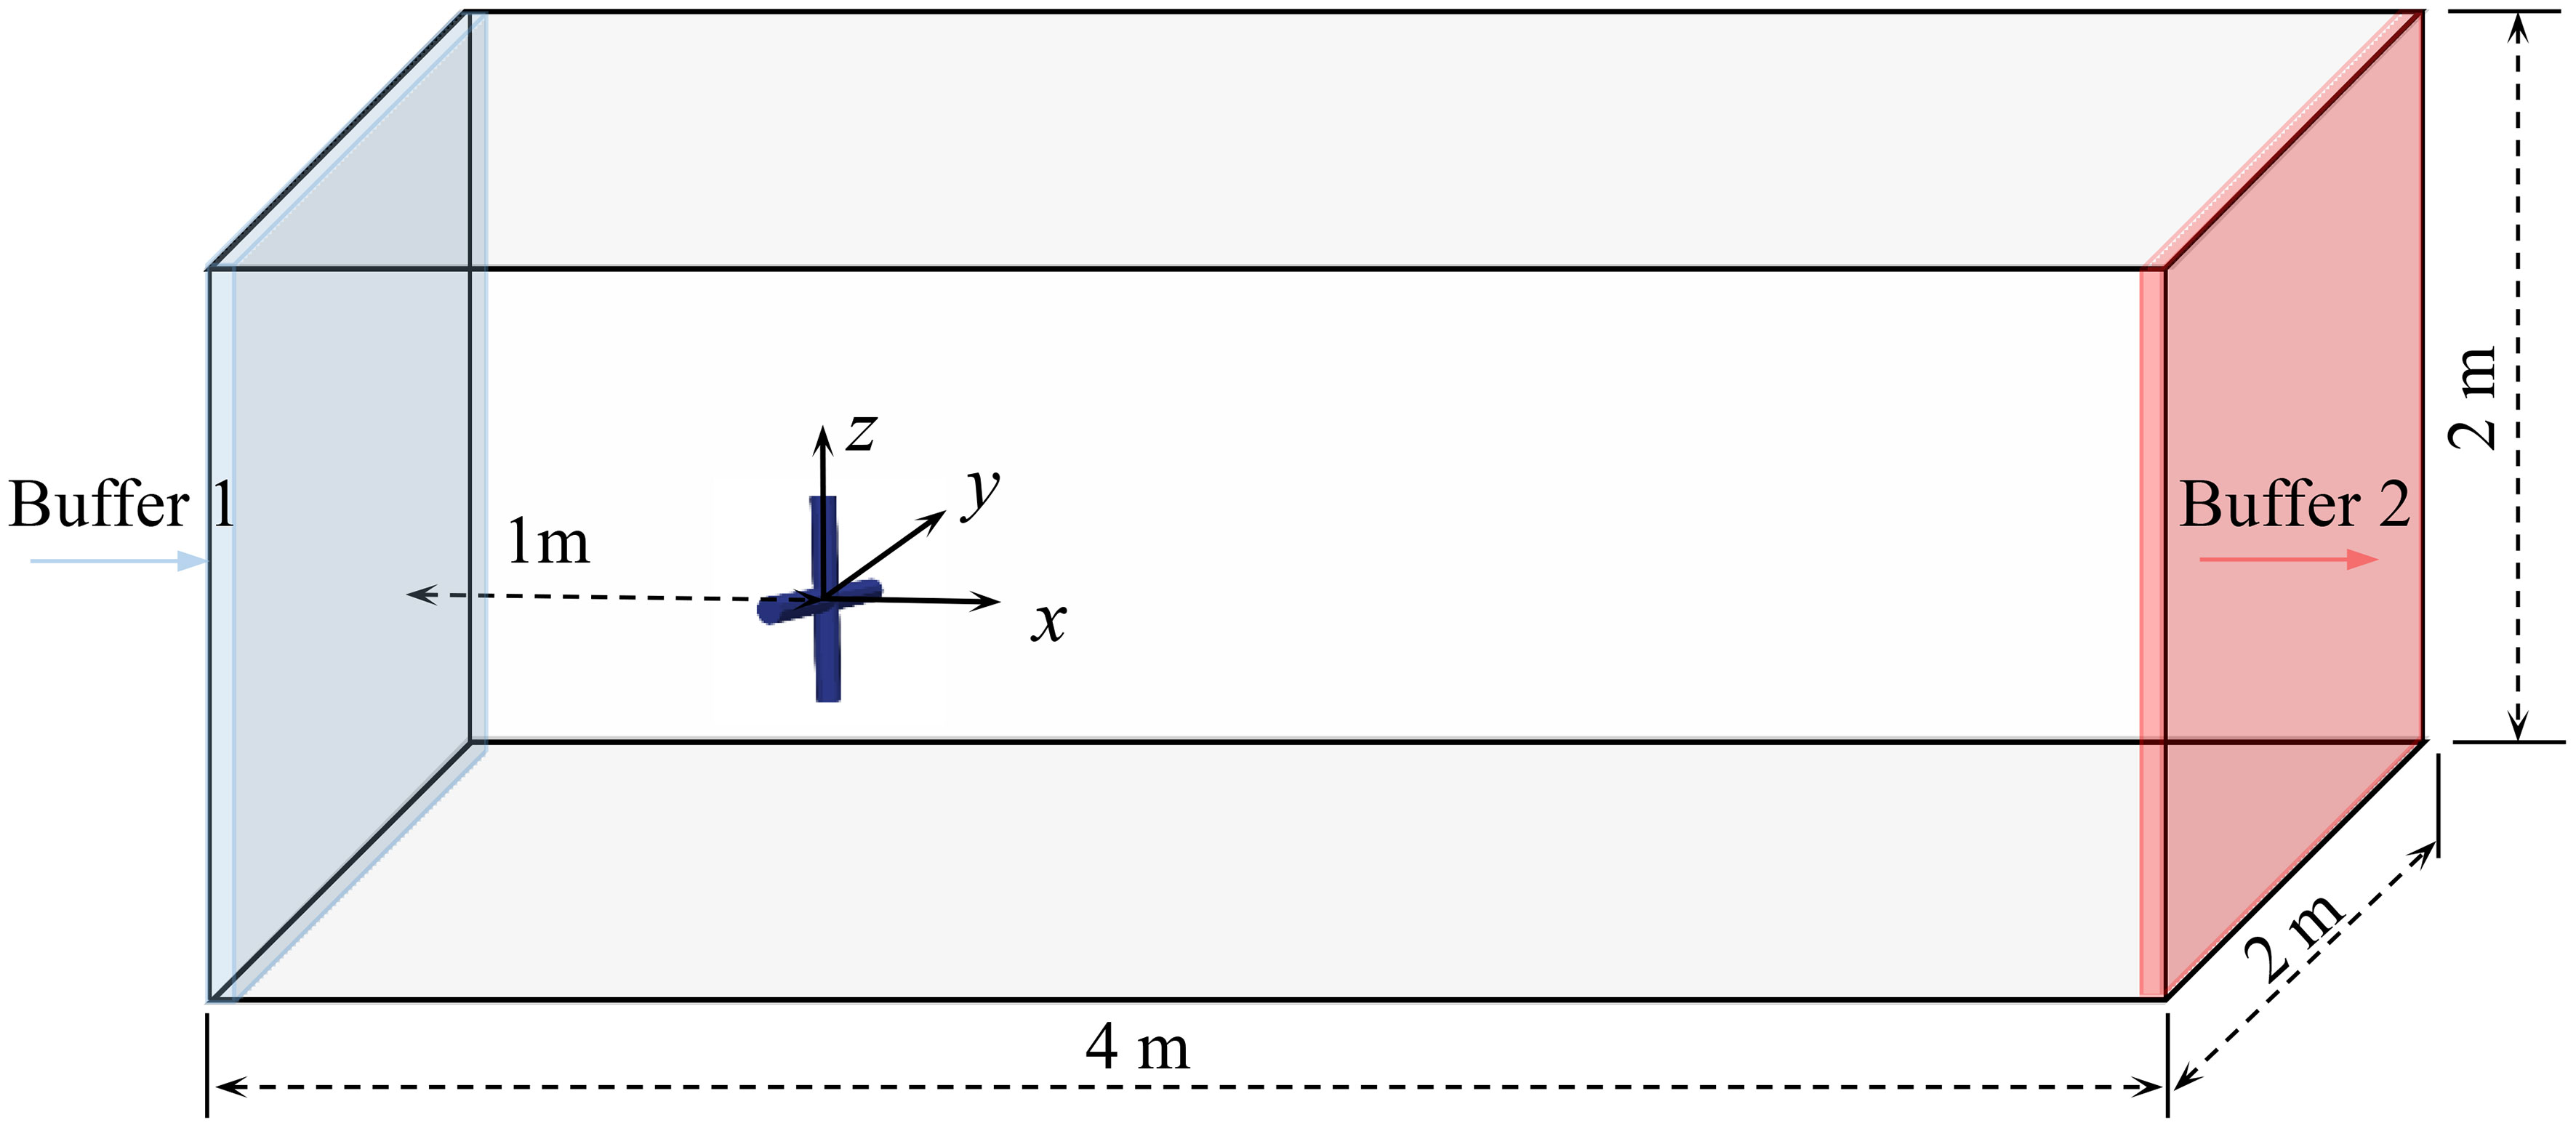
Figure 5 Computational domain of the net element.
The fluid domain is set with open boundary conditions (Tafuni et al., 2018) for the inlet and outlet. The inlet zone, referred to as Buffer 1, has the same height as the fluid domain and a width of four particle layers. This is done to enforce full kernel support during the particle approximation. A Dirichlet boundary condition for the velocity is imposed in the inlet zone, with the x-velocity set to a constant value U∞. The outlet zone, Buffer 2, has the same dimensions as Buffer 1, and the velocity of the outlet particles is obtained by extrapolating the fluid velocity at the respective ghost nodes and applying the linear correction. In order to minimize boundary effects, the top, bottom, front and back sides of the domain are set as moving wall condition with the velocity of U∞, and periodic boundary conditions are applied to avoid the solid wall particles moving out of the domain. The smoothing length is set to h = 1.5 dp. Particle shifting and delta-SPH are utilized, with the former being particularly important for achieving a near-uniform particle distribution in the wake (Figure 6), and the latter used to reduce oscillations in the density field inherent to the SPH method.
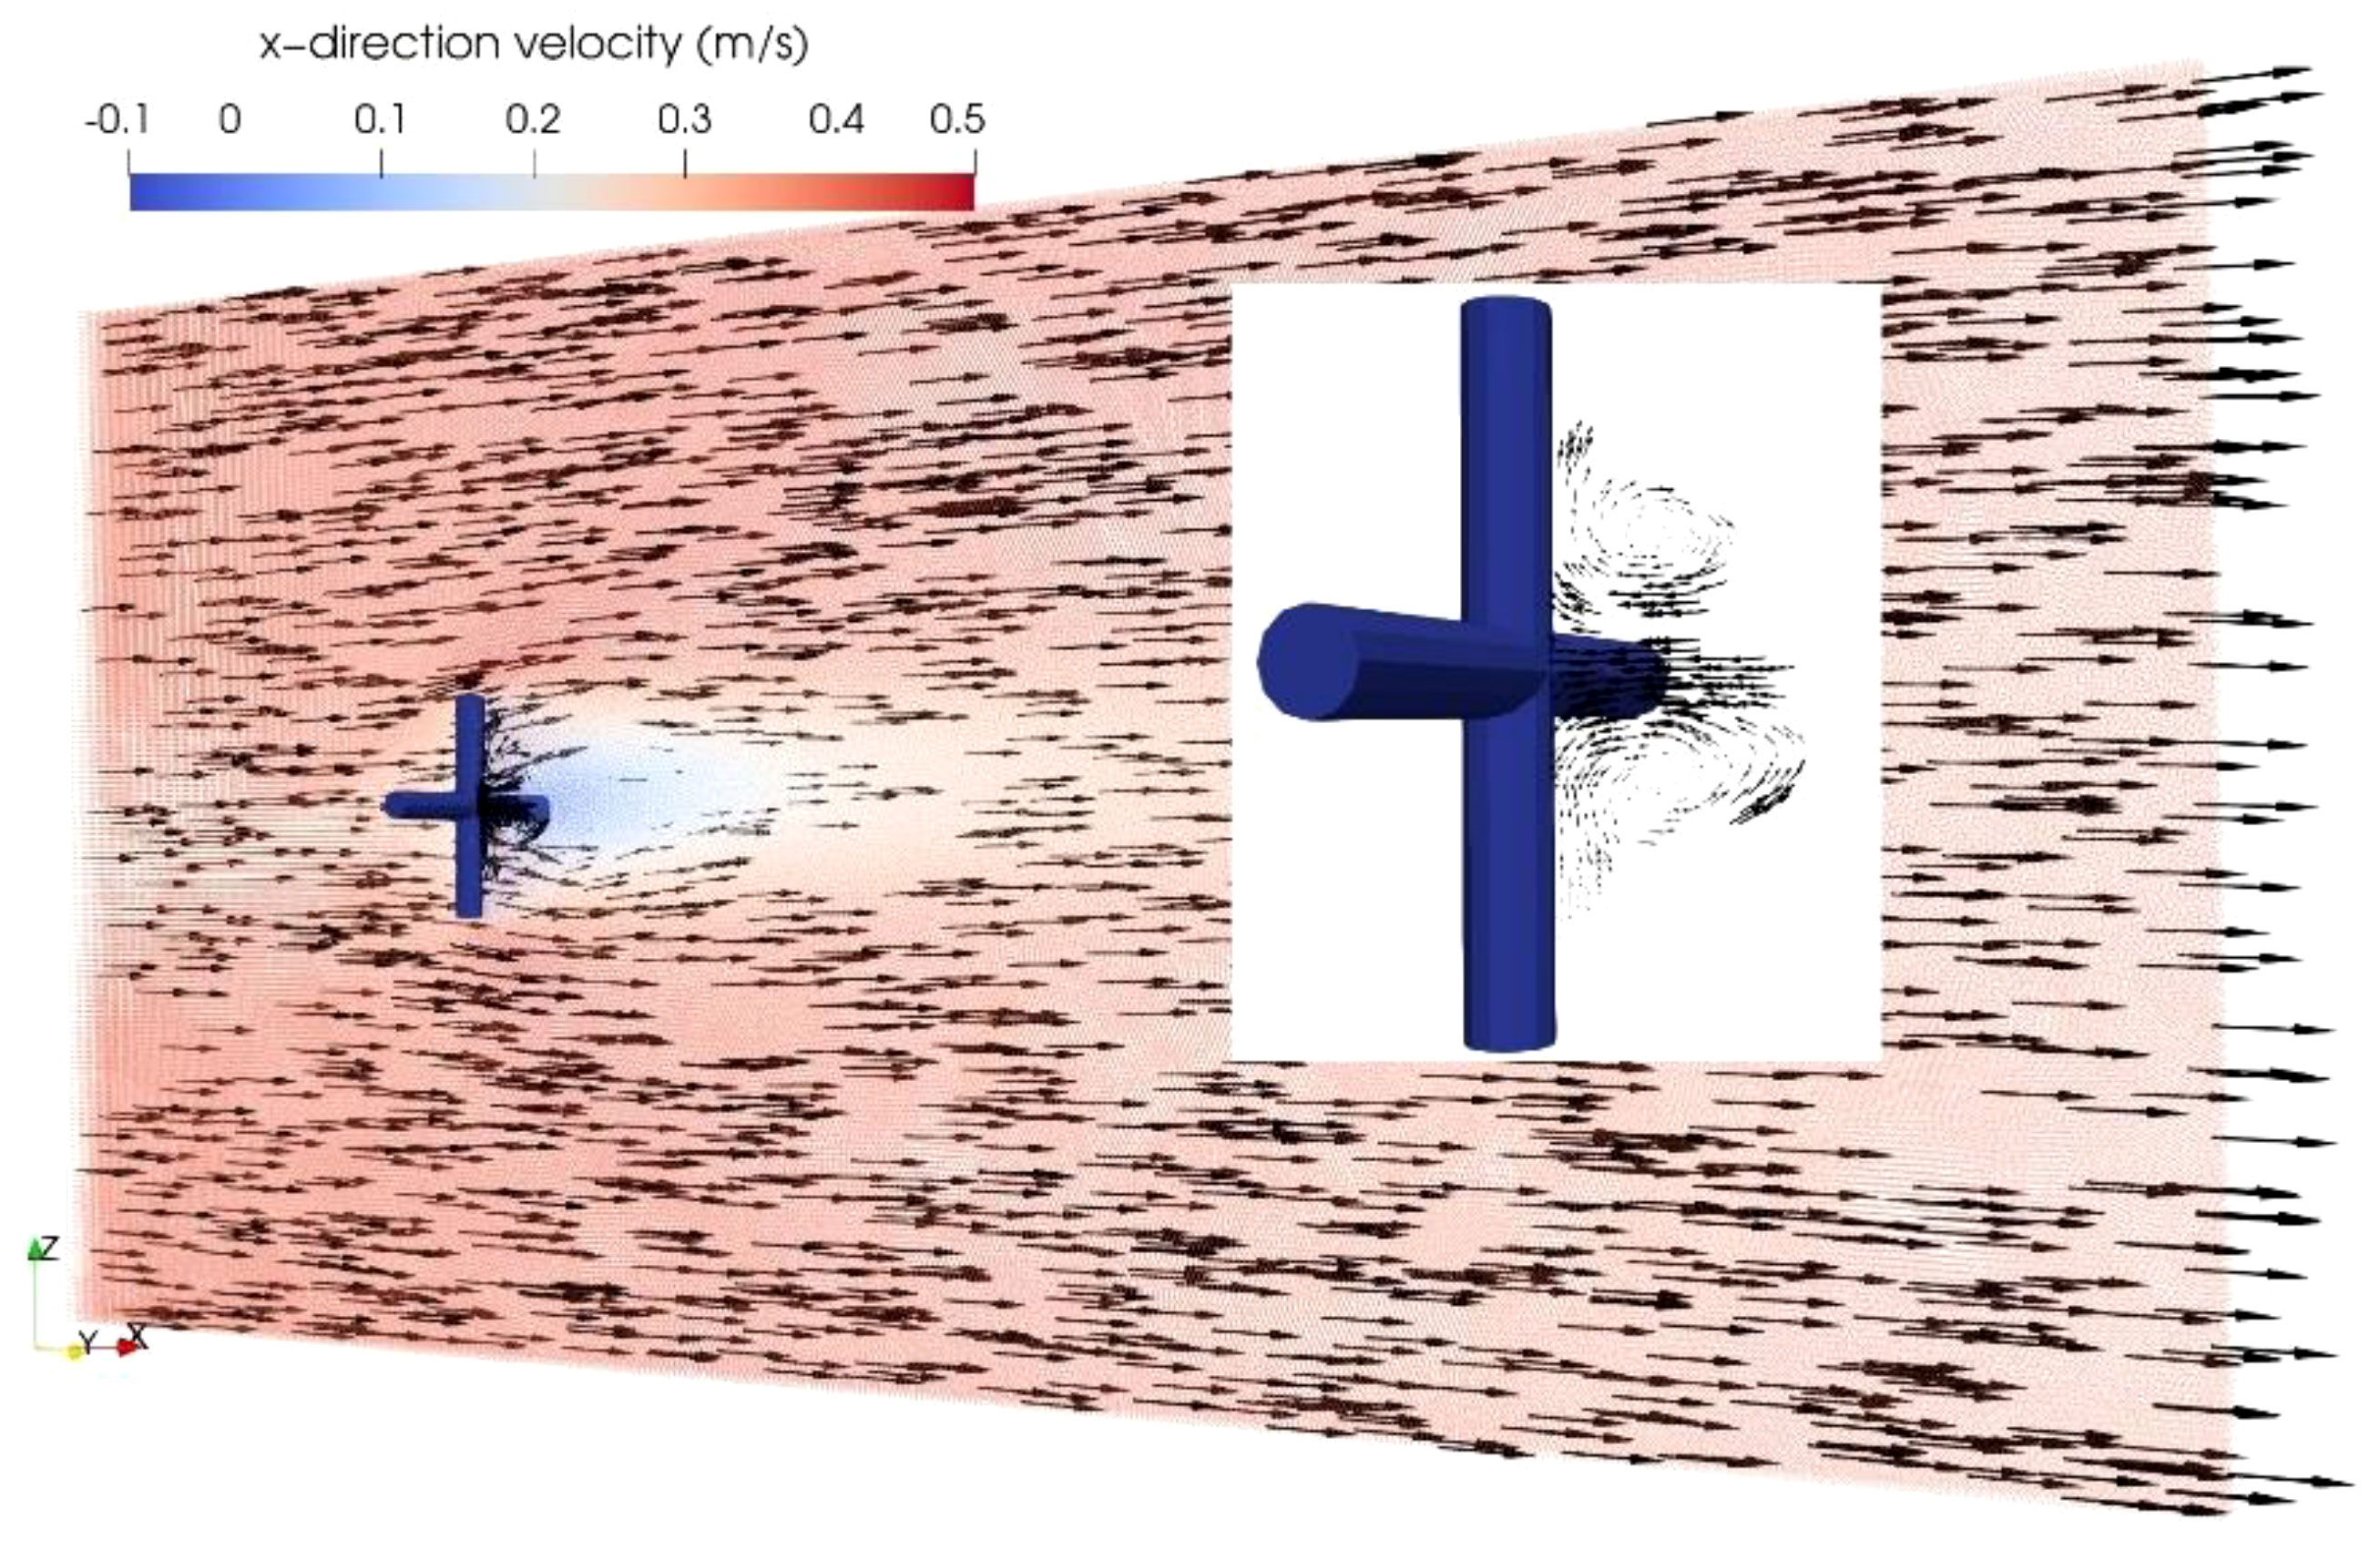
Figure 6 Streamlines on the symmetric plane.
Based on the previous experiments (Lader et al., 2014) and simulations (Bi et al., 2017; Wang et al., 2022), four velocities (U∞ = 0.41, 0.60, 0.80, 1.01 m/s) of the inflow are tested. The drag coefficient results for the cruciform element are compared between the existing data and current simulation in Figure 7. Overall, the drag coefficients of the cruciform element differ by 0.95−6.67% between the experimental results from Lader et al. (2014) and 2.92−15.77% on average between the numerical results from Bi et al. (2017) and Wang et al. (2022). Despite these differences, the discrepancies are small, indicating the simulation method is acceptable for further study.
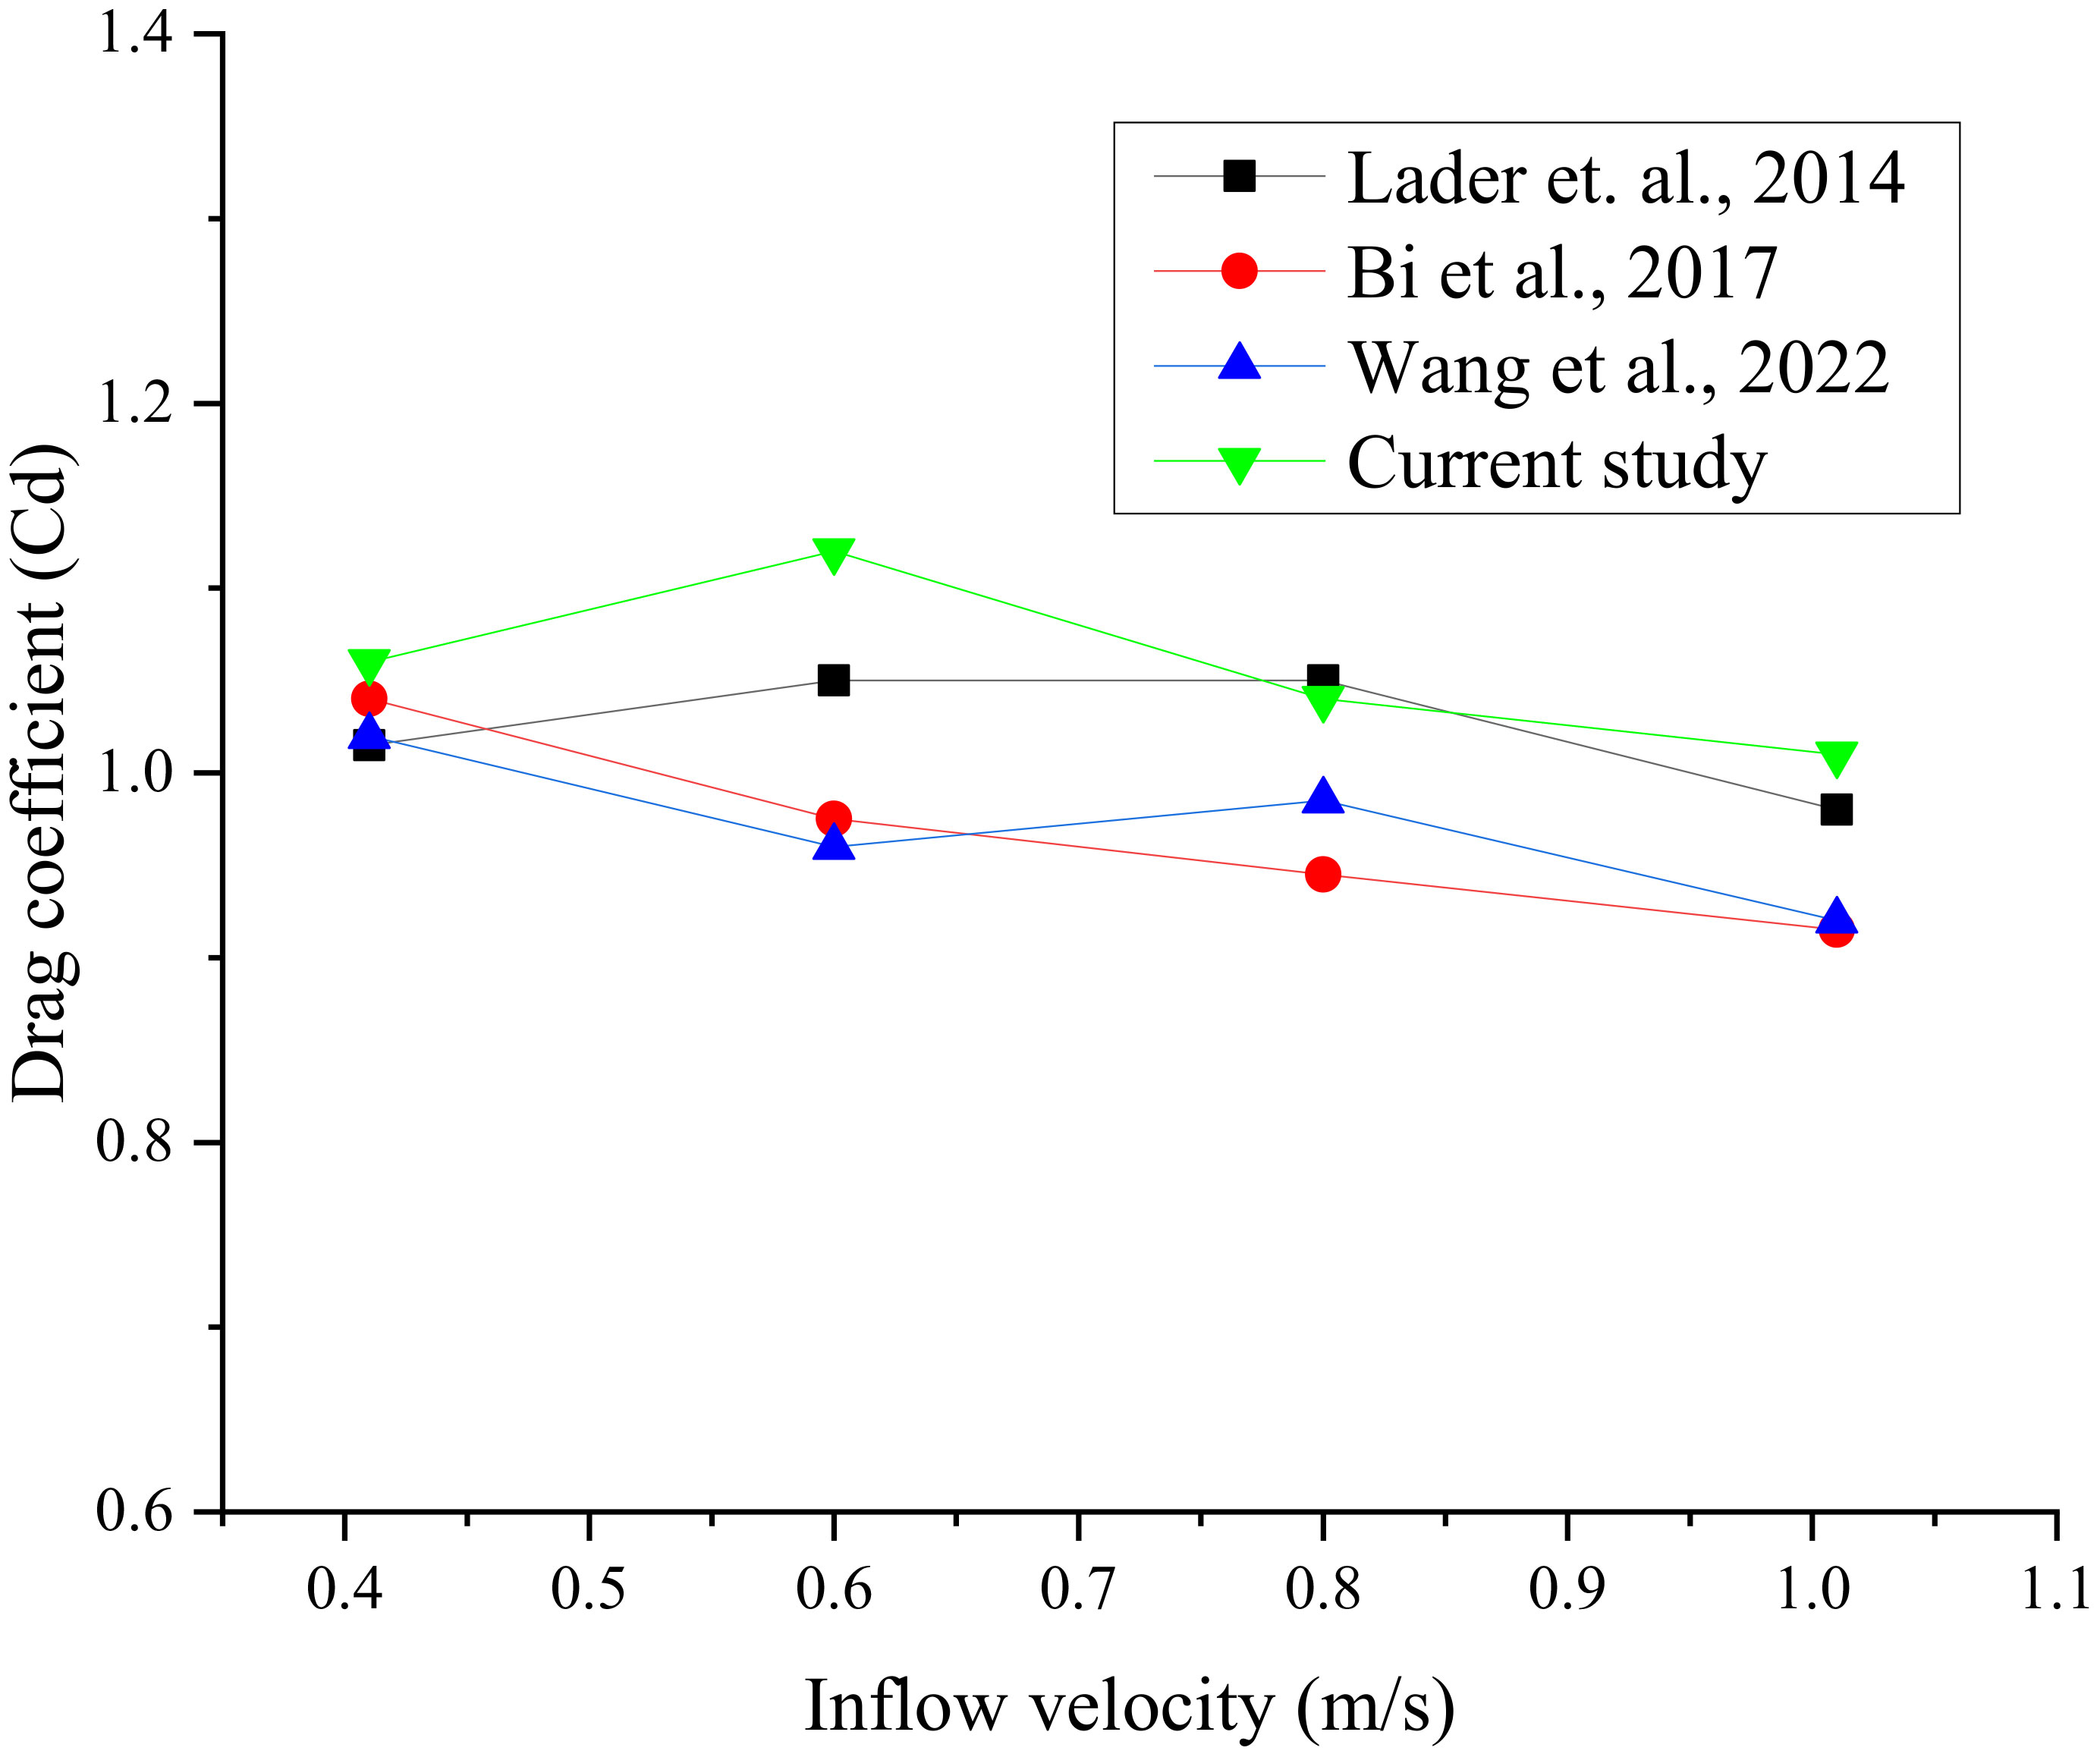
Figure 7 Drag coefficient vs. Inflow velocity on a cruciform element.
In addition, a comparison of the drag coefficient and the hydrodynamic drags among different net element structures is presented in Table 2. It can be found that the drag coefficient of the cruciform element is close to 1, while the sphere element has a drag coefficient close to 0.5, and the circular and square plate elements have drag coefficient near 1.1. Considering the projected area in the streamwise direction, due to the smaller drag coefficient and projected area, the hydrodynamic drag of the sphere element is significantly smaller than that of cruciform element. The drag of the circular and square plate element is similar to that of the cruciform element. Overall, the hydrodynamic drag varies by 4.46−12.26% between the cruciform and the square plate elements, with the smallest difference observed among the three net element shapes.
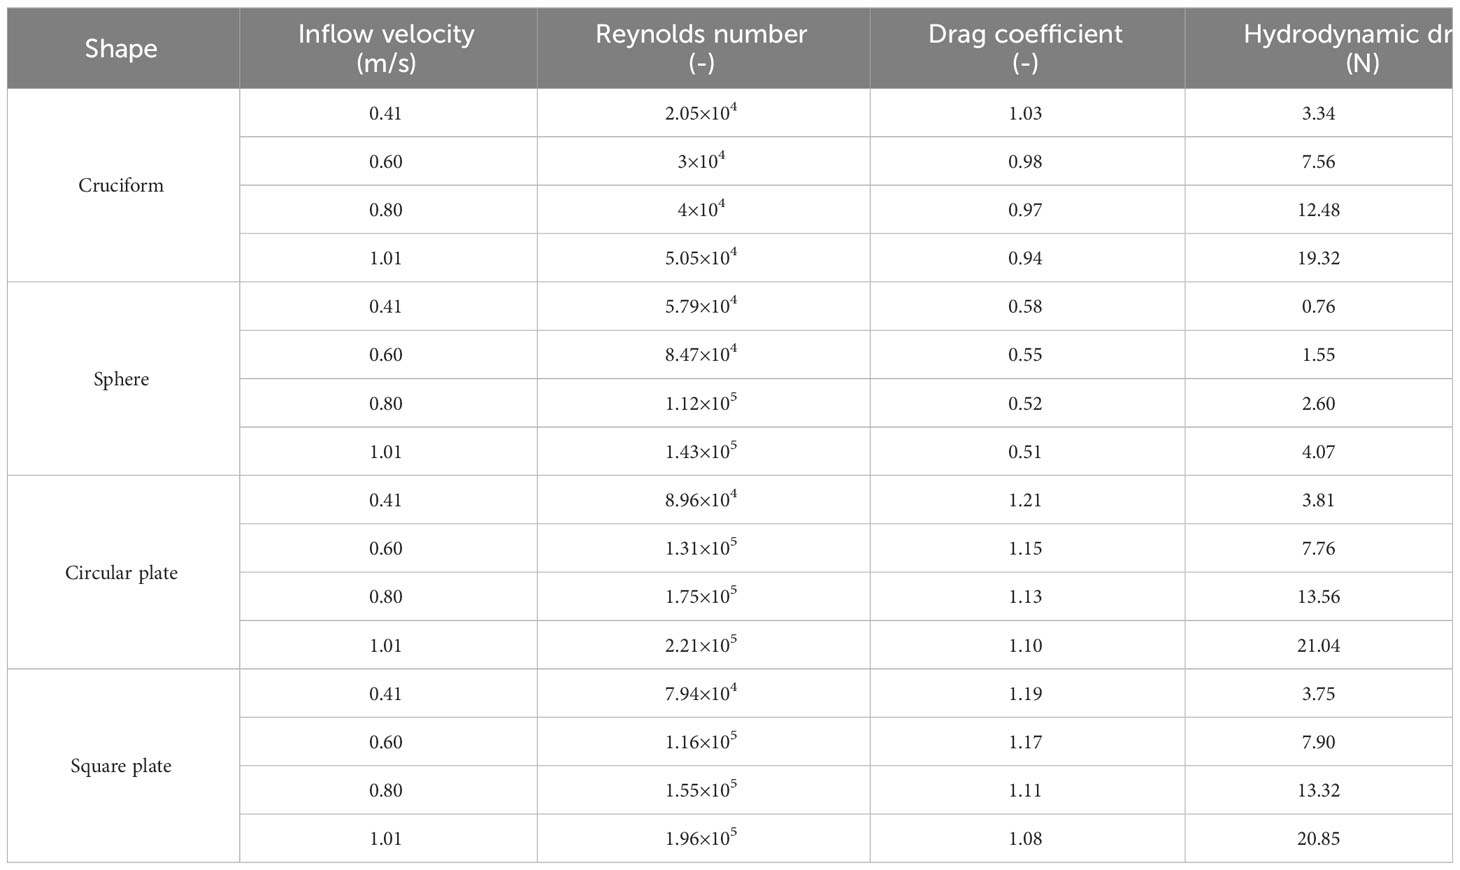
Table 2 Hydrodynamic parameters of different net element structures.
3.1.2 Multiple cruciform elements equivalence
To account for the interaction among the net twines, it is necessary to study the flowfield and hydrodynamics of multiple cruciform elements, and meanwhile the equivalent knot shape of the net panel composed of multiple cruciform elements are also tested. In order to conserve computational resources and enhance computational efficiency, a simple 0.1m ×0.1m net panel with a 5×5 net twines is specifically chosen in this study as shown in Figure 4. The twine length(l0) and diameter(d0) of the net panel is 2cm and 0.35cm, respectively, resulting a solidity . Based on the equivalent method mentioned in last section, the sizes of each equivalent net model using different knot shapes are as follows, the diameter for the sphere-shaped knot is 0.88cm, the diameter and thickness for the circle plate-shaped knot is 1.27cm and 0.27cm, while the side length for the square plate-shaped knot is 1.13cm and 0.27cm. To test the hydrodynamic performance and flow characteristics of each net model, four simulations are carried out where each net panel is vertically positioned in the center of a numerical flume experiencing a current speed of 0.5 m/s.
The flow velocity distributions on the symmetric plane for different net model simulations are depicted in Figure 8. For the original net panel, the fluid is accelerated around the cruciform elements, while it slows down in the regions upstream and downstream of the net panel. The wake extends a considerable distance downstream of the net, with a width slightly greater than the projected width of the net panel. Compared for the equivalent nets, the flow field distribution is generally similar, except for the net with sphere-shaped knots, which shows a significant difference. The reason can be attributed to the factors discussed in last section: the sphere-shaped knot has a lower drag coefficient, and the smaller projected area of the sphere knots, which leads to a less hydrodynamic drag. The weak interaction between the net panel and the fluid will, thus, lead to a less distinct wake effect.
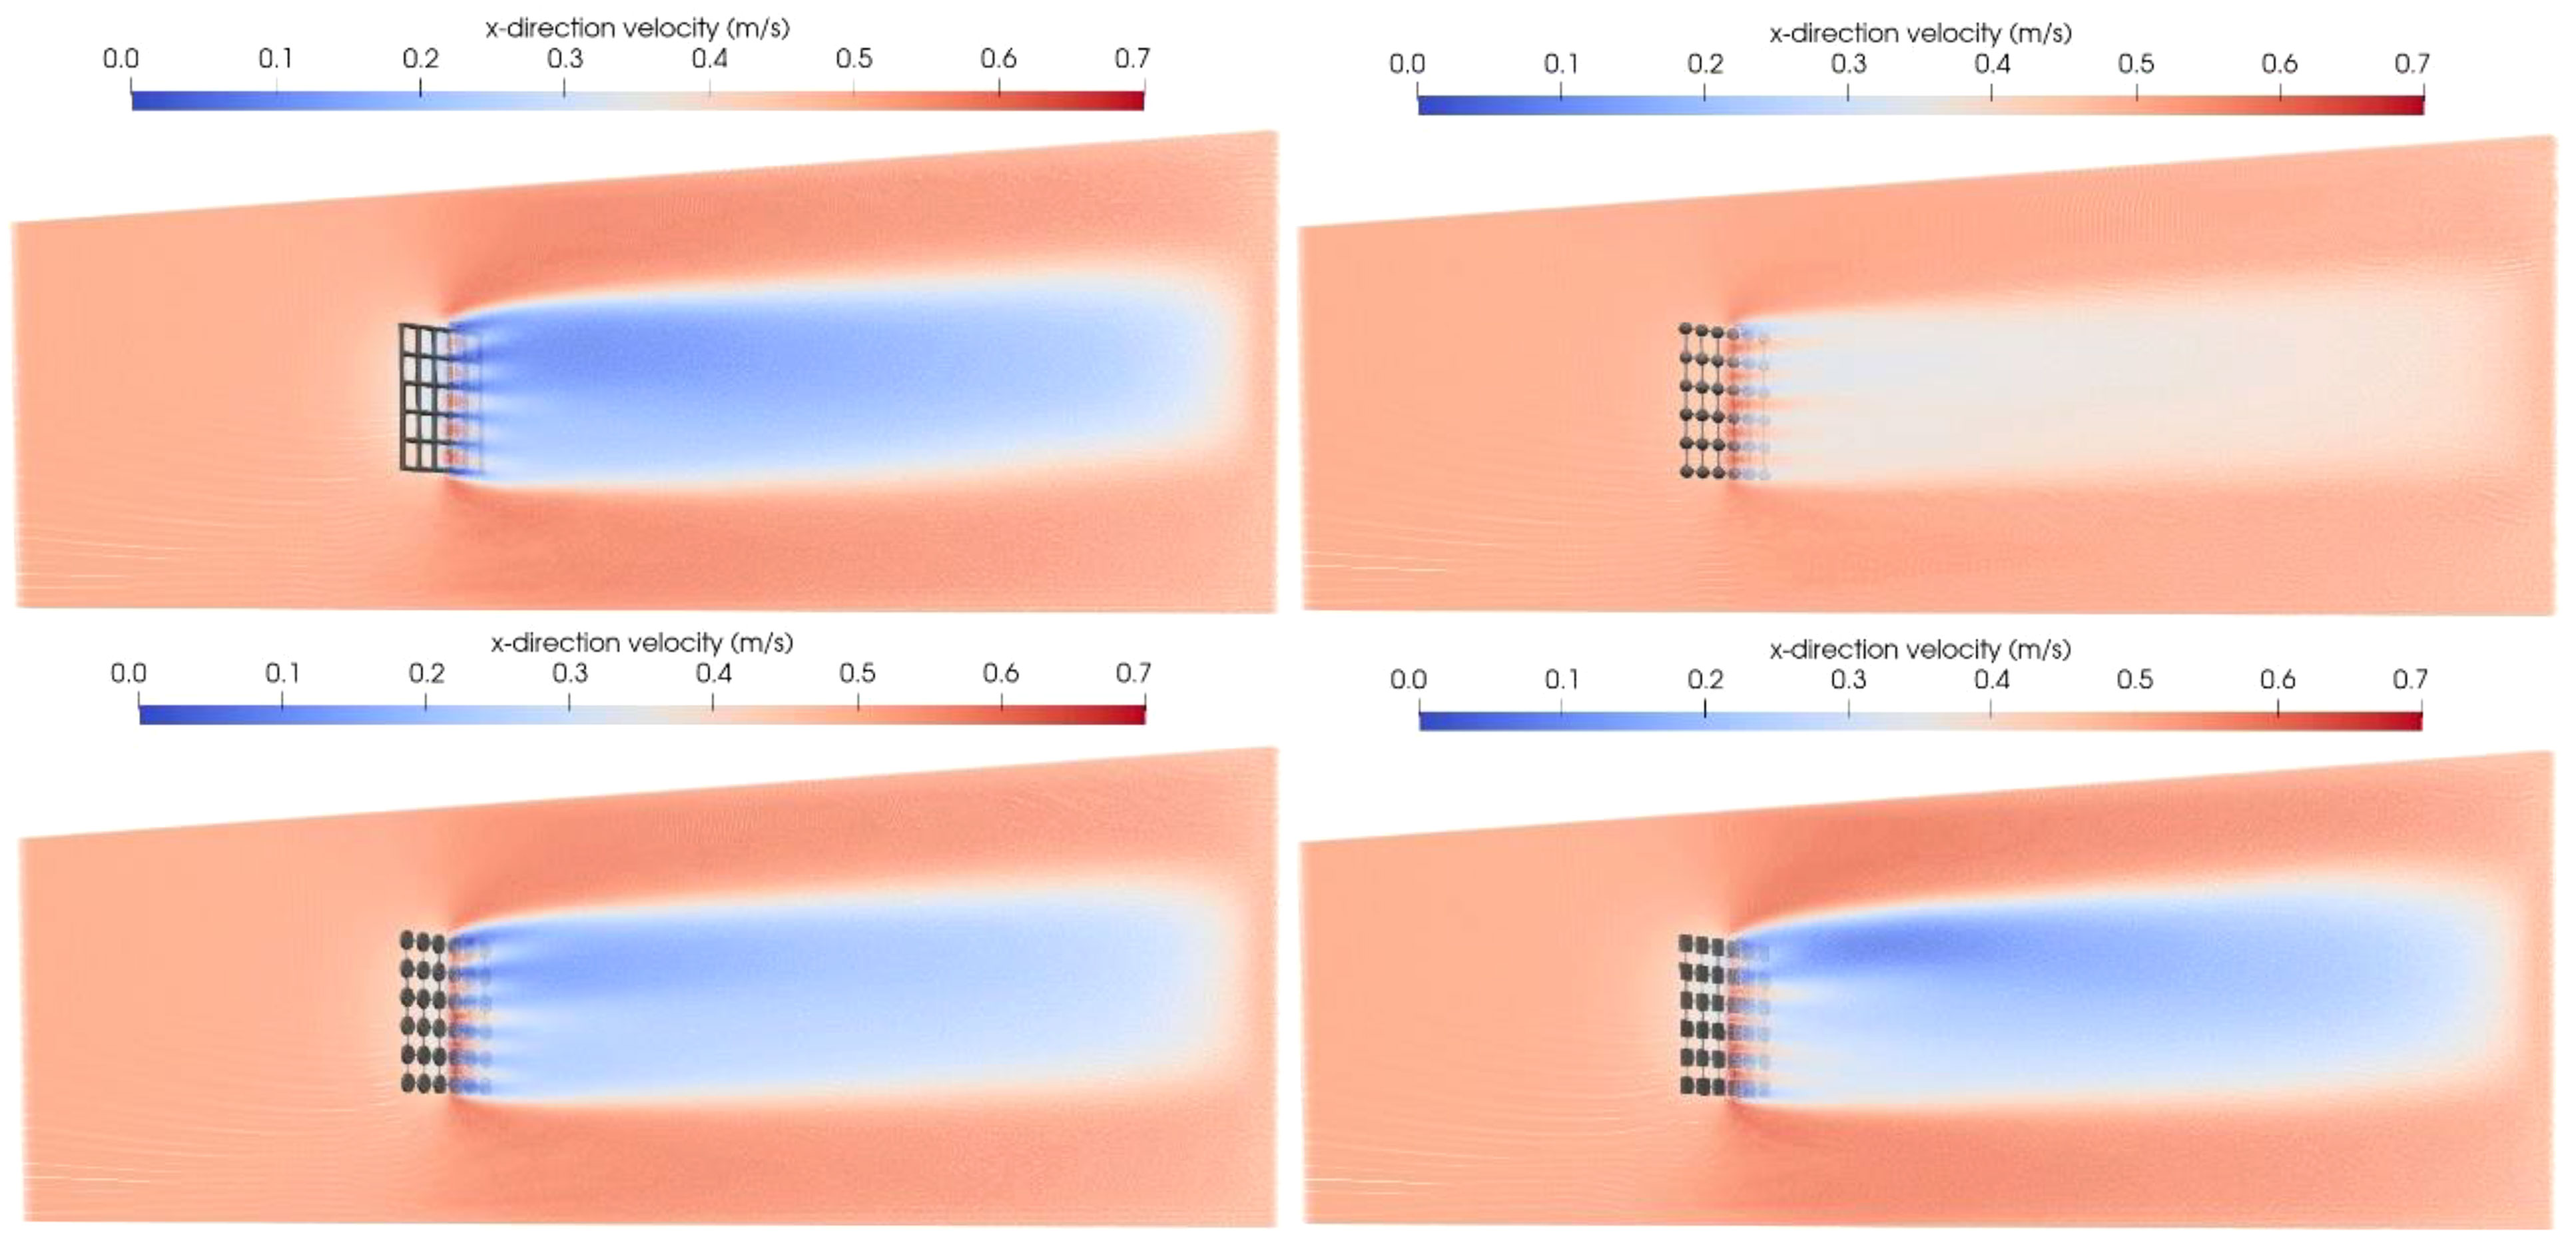
Figure 8 Flow velocity distribution on the symmetric plane for different net models.
The hydrodynamic drag for different net models is depicted in Figure 9, the drag on the original net panel, which consists of cruciform elements, is approximately 0.6N. According to the hydrodynamic drag calculation formula, , the drag coefficient for the net panel is 0.48, which is in accordance with the investigation of Føre et al. (2020). In comparison, the hydrodynamic drag for the sphere-shaped knot net is significantly smaller as explained previously. However, nets with circle and square plate-shaped knots experience quite larger hydrodynamic drag, approximately 1.45 times the drag of the original net with cruciform elements. The authors attribute this discrepancy to the difference in net solidities between the original net and the numerical equivalent net model. As shown in Figure 4, the original 0.1m×0.1m net is modeled by 36 circle or square plate-shaped knot elements. It should be noted that in the numerical model, a cruciform element of the net panel is equivalent to a net knot structure. This simplification works well for the internal net with a complete cruciform shape, but for the four boundary edges, due to the incomplete cruciform element, using the same circle or square plate knot structure for the boundary nets will result in the increased net solidity. Thus, the ratio of the projected area of the circle or square knots to the outline area of the net panel, i. e., the net solidity, is , which is almost 1.4 times the original net, resulting in a reasonable value for the higher hydrodynamic drags. One potential approach to address this issue that readily comes to mind is to adjust the size and shape of the equivalent knots that represent the boundary nets. However, the determination of these parameters is an important topic for future research, which is beyond the scope of this paper.
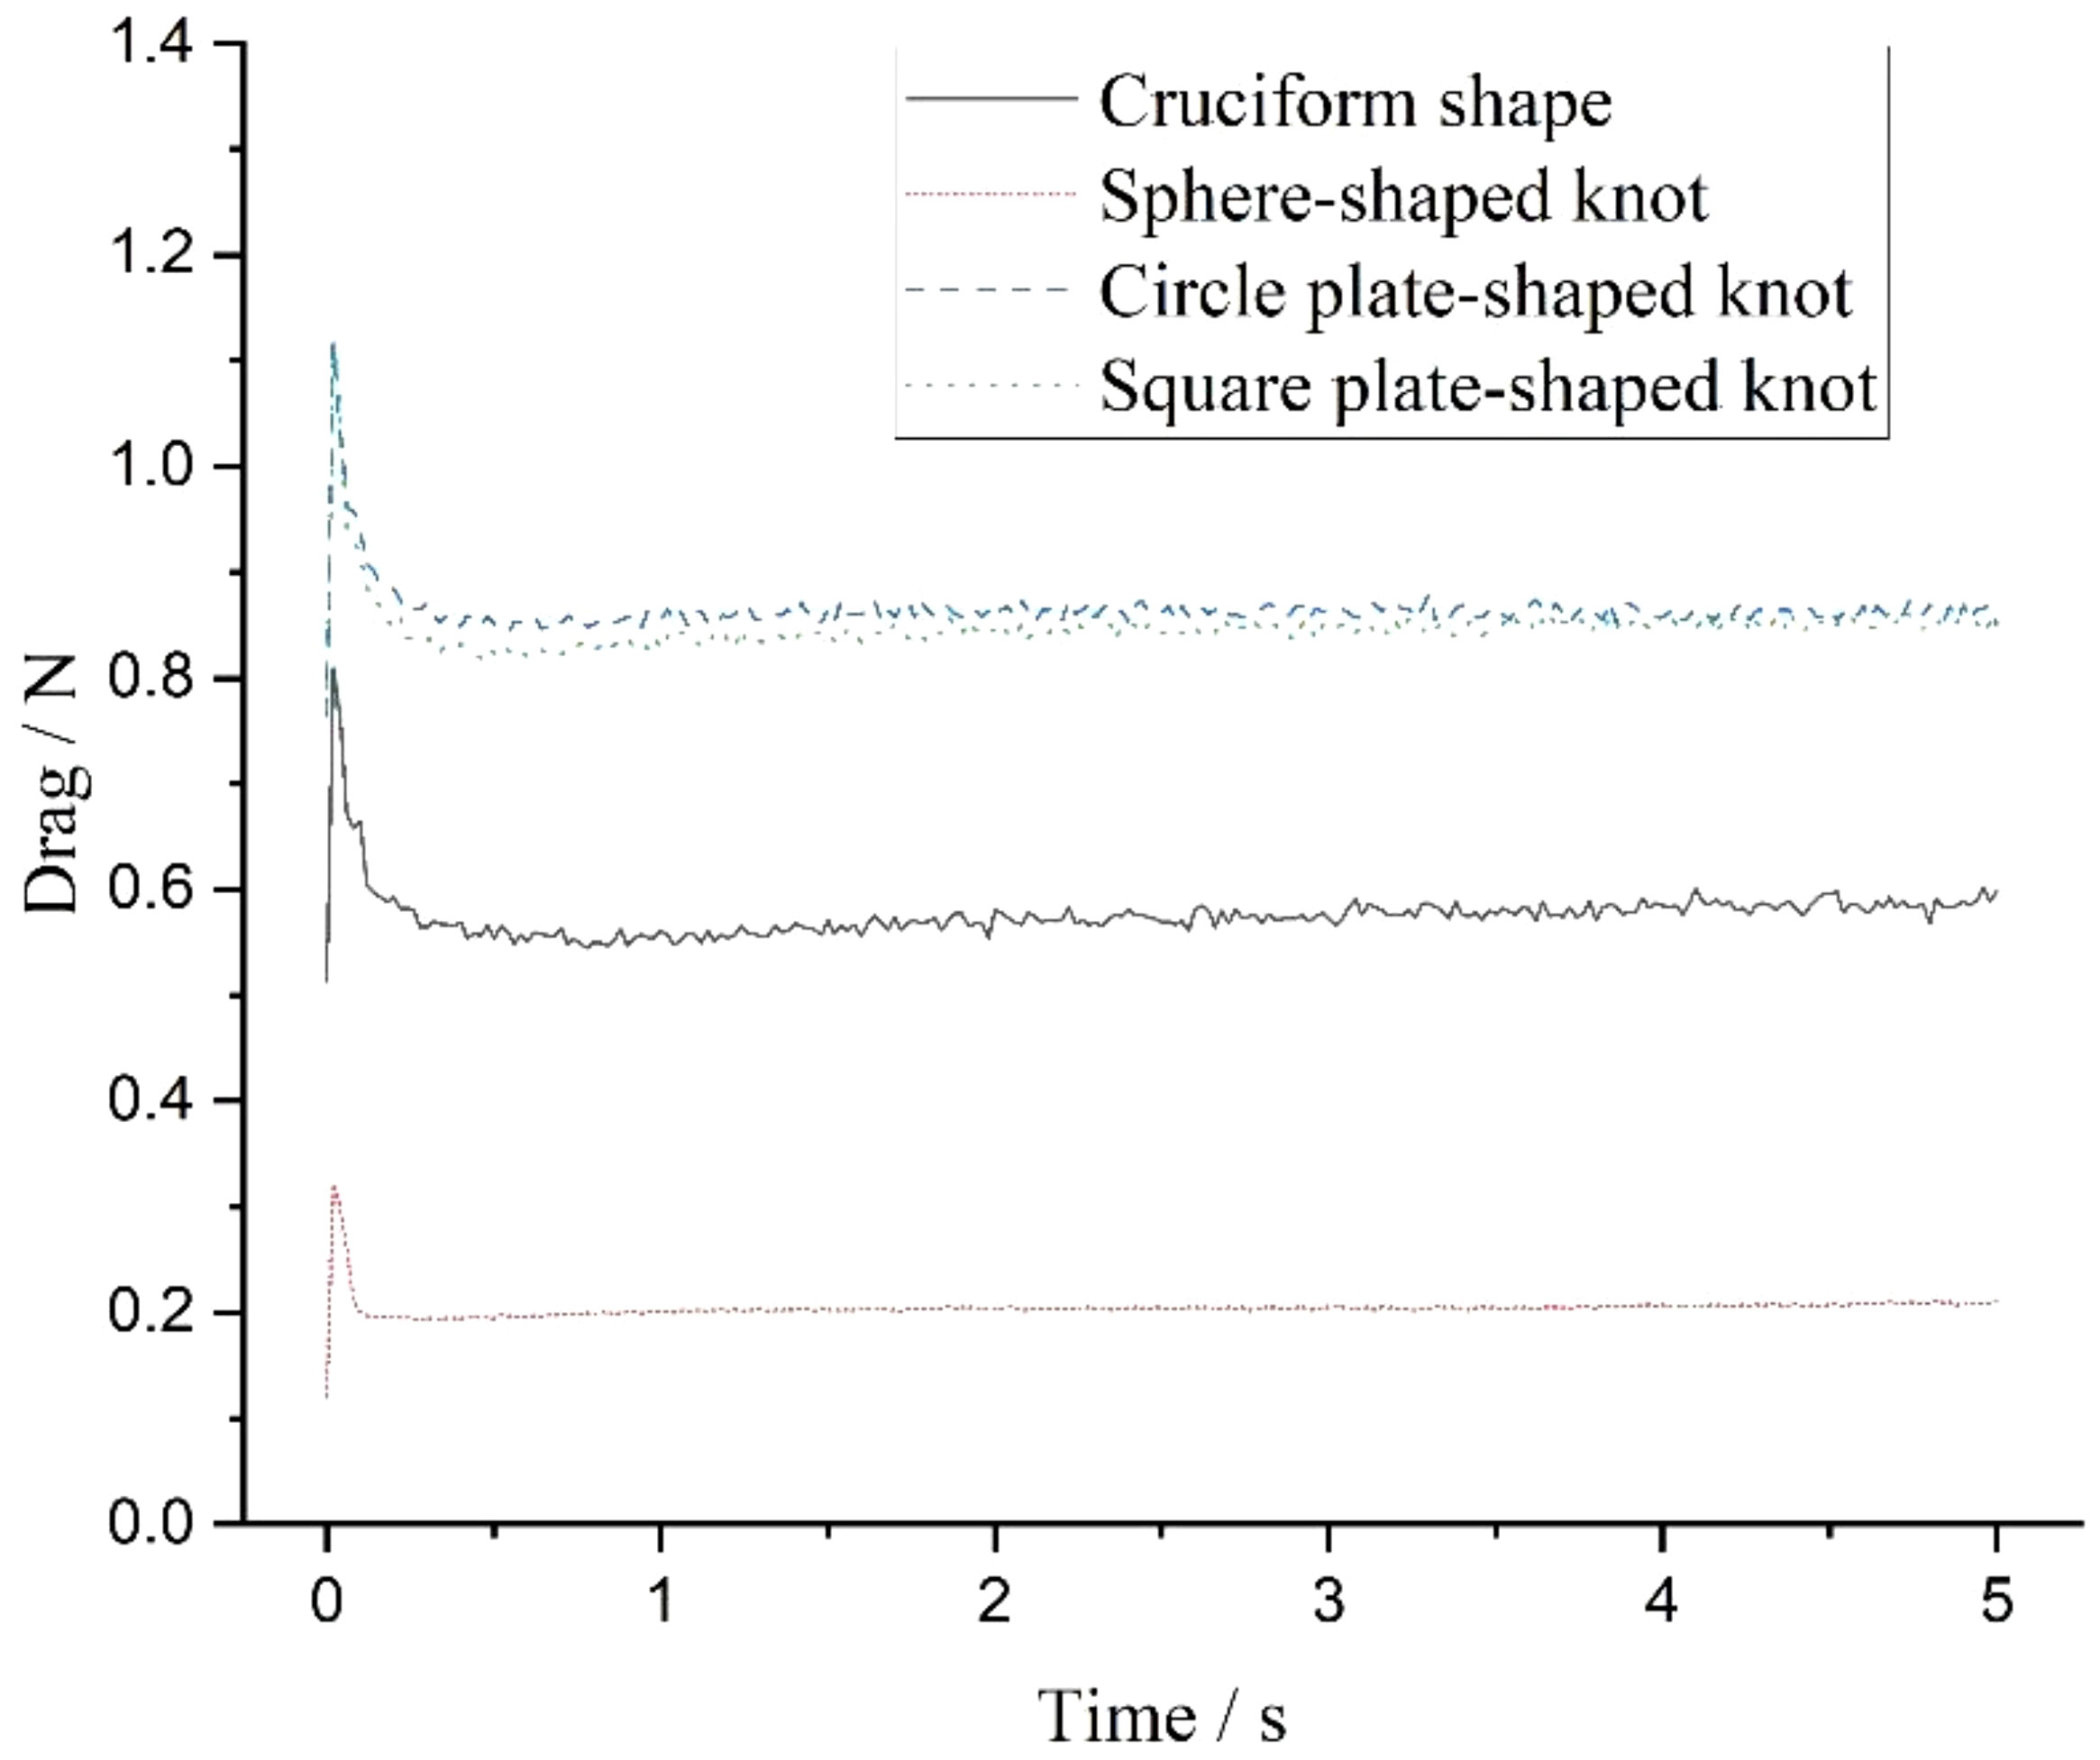
Figure 9 Hydrodynamic drag on different net models.
From the perspective of flowfield characteristics and hydrodynamic drag, both the circle and square plate-shaped knots appear acceptable for representing the net cruciform elements. However, in the extreme case where the characteristic length of the cruciform element (d) equals the length of the net element (l), resulting in a solidity of 1, the net structure becomes non-permeable and forms a solid square plate. Therefore, it is reasonable to conclude that the square plate structure is the best to represent the net cruciform element. For the subsequent study, the square plate shape is chosen as the net-knot structure.
3.2 Hydrodynamics of a rigid net
In this section, the experiment study conducted by Patursson et al. (2010) and simulation study is used as a reference to validate the present simulating method. The focus is on comparing the hydrodynamic drag coefficient and the flow velocities behind a rigid net panel under several inflow velocities and attack angles with the experiment data.
3.2.1 Case setup
According to Patursson et al. (2010), the rigid net in the experiment is made of a 1 m by 1 m knotless nylon net with twine diameter d0 = 2.8mm, twine length l0 = 29mm, and the solidity . In this study, according to Martin et al. (2020b), a mesh grouping factor λ = 3.45 is used, which makes the numerical net with twine diameter ds = 9.7mm, twine length ls= 100mm. After that, based on the previous section, a square plate knot structure with l= 42.89mm, t= 7.97mm is are used to represent the cruciform element, which results in the original net being composed of 121 knot elements arranged in a square plate pattern.
The computational domain of 4.5m × 3.66m × 2.44m is shown in Figure 10, and the geometrical center of the net is kept at (1m, 1.83m, 1.22m). Similar with last section, the inlet and outlet of the fluid is set as open boundary conditions, four different inflow velocities (0.125, 0.25, 0.5, 0.75m/s) and two different angles of attack, i.e. α = 90° and 45° are investigated. Here, 90° indicates that the flow is aligned with the normal direction of a net panel. The uniform-size particle of dp is set to 0.0065m, result in a total SPH particles of 1.46 × 10⁸.
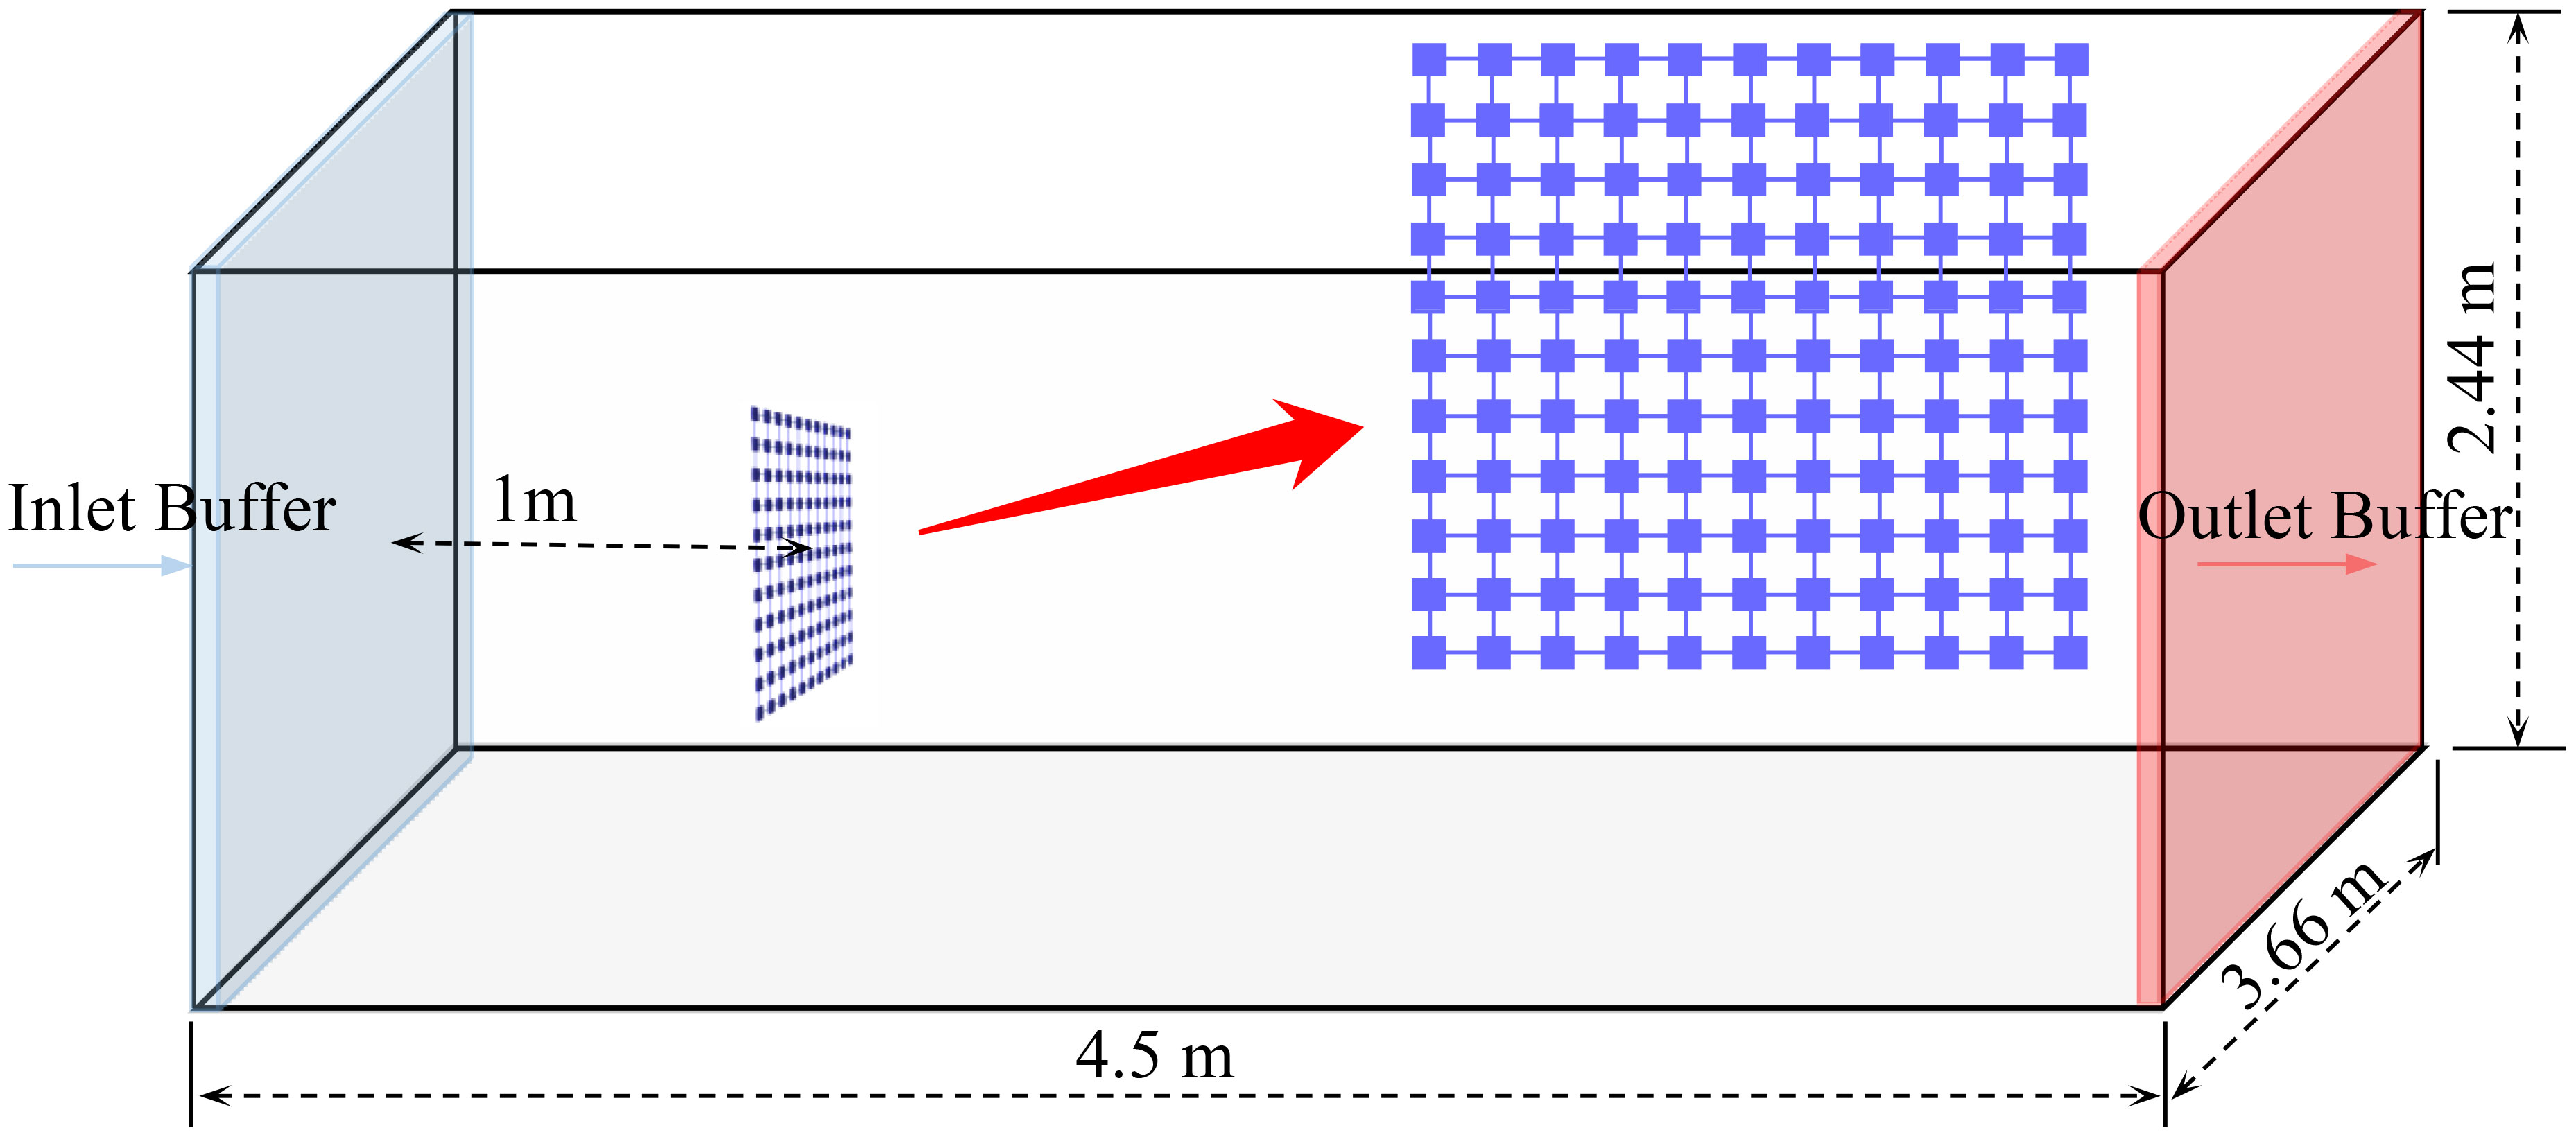
Figure 10 Computational domain of the rigid net.
3.2.2 Results and discussion
Figure 11 illustrates the velocity contour slice of the domain through the symmetry plane for α= 90° and 45°, with an inflow velocity of . In the case of α = 90°, the fluid is accelerated around the net panel, while it slows down in the region upstream and downstream of the net. The wake of the net is clearly observed, extending for a considerable distance behind the net panel and exhibiting a width similar to the projected width of the net panel. As the angle of attack decreases from 90° to 45°, due to the weakening interaction between the fluid and the net panel, the flow acceleration around the net decreases, resulting in a decrease in the maximum flow velocity. Additionally, the extent of the wake reduces as the angle of attack decreases.
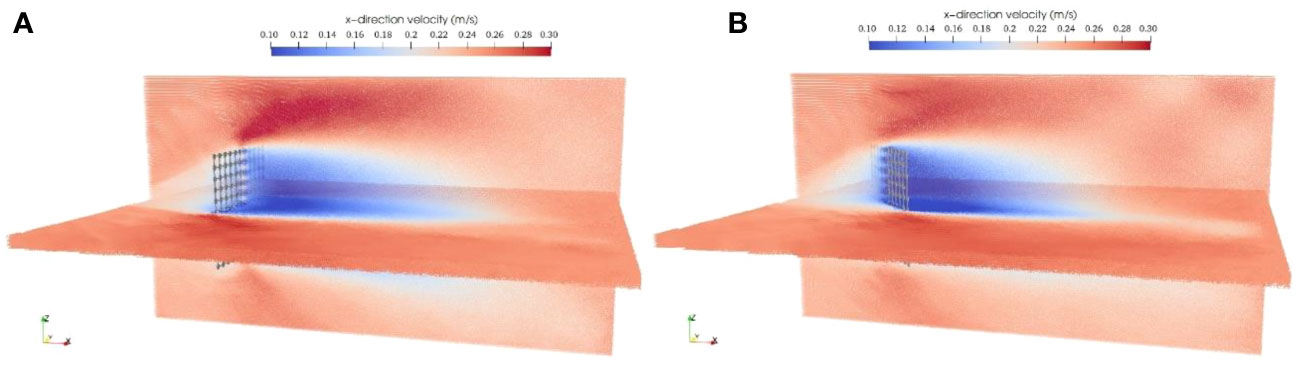
Figure 11 Velocity field on the symmetric plane in steady current flow for u∞= 0.25 m/s (A) α = 90°. (B) α = 45°.
Figure 12 presents the comparison between experimental (Patursson et al., 2010) and numerical drag coefficients for the different inflow velocities at two angles of attack. The hydrodynamic drag coefficients on nets are calculated as
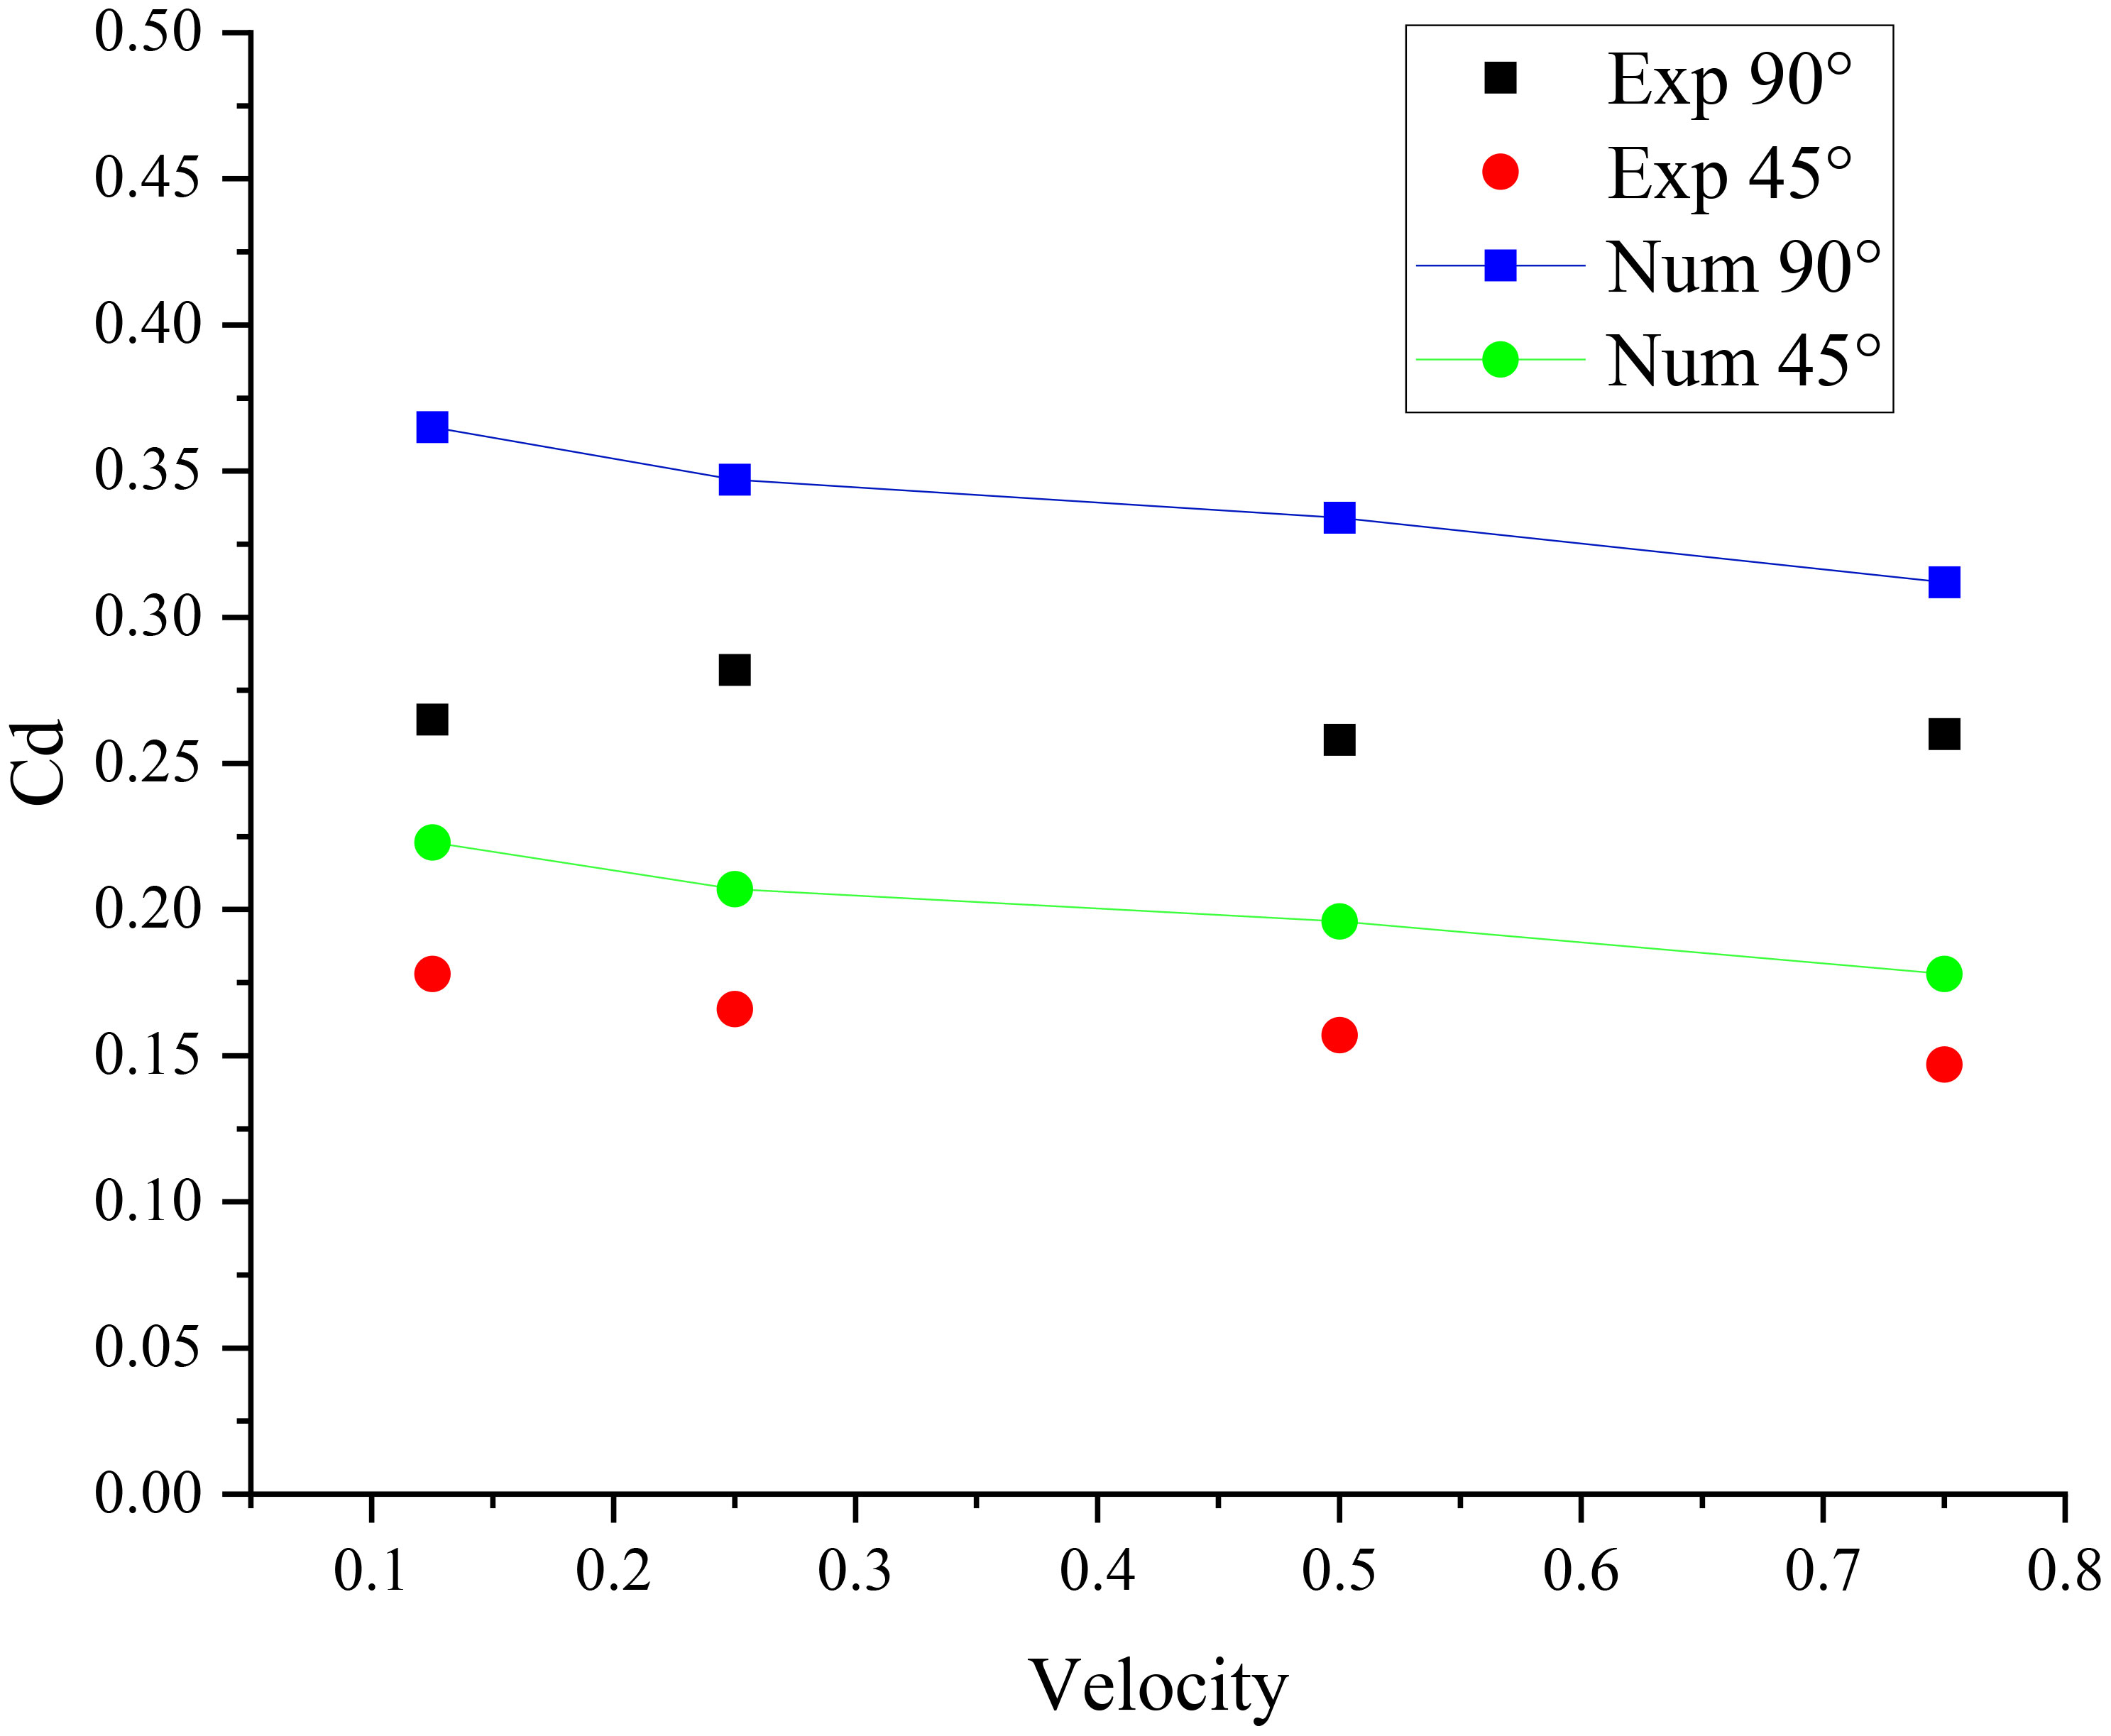
Figure 12 Drag coefficients for different inflow velocities.
where Fd is the hydrodynamic drag on the net, is the fluid density, is inflow velocity and A is the outline area of the net panel.
It can be seen from Figure 12 that the computed drag coefficient decreases with the increasing inflow velocity, which is in accordance with the experiment results. However, the computed drag coefficients are slightly higher than the experimental measurements for all the simulated cases, ranging from approximately 1.2 to 1.3 times the experimental values. As explained in last section, the authors attribute this discrepancy to the difference in net solidities between the actual net and the present numerical net model. To be specific, the original 1m×1m net is modeled by 121 square plat knot elements with a side length of 42.89mm (Figure 10), as a result, the ratio of the projected area of the knots to the outline area of the net panel, i. e., the net solidity, . The solidity of the numerical net is 1.21 times the actual net in the experiments, which results in a reasonable value for the slightly elevated calculated coefficients.
The distribution of the streamwise velocity through the net panel is shown in Figure 13. It clearly shows the momentum loss of the fluid through the front and back of the net. The interaction between the fluid and the net panel causes a continuous reduction in flow velocity, which starts in front of the net, extends through the net panel, and persists for some distance behind the net until reaching a level approximately 20% lower than the incoming flow. After that, the flow velocity gradually recovers to the magnitude of the free stream velocity. As the angle of attack decreases from 90° to 45°, the weakened interaction between the fluid and the net panel causes a weaker momentum loss behind the net panel. The computed velocity at the probe 2.5m behind the net panel is slightly higher than the measured velocity by Patursson et al. (2010). The maximum deviation between the numerical and experimental velocity is 2.3%, which indicates that the velocity reduction behind the net is predicted well by the numerical model.
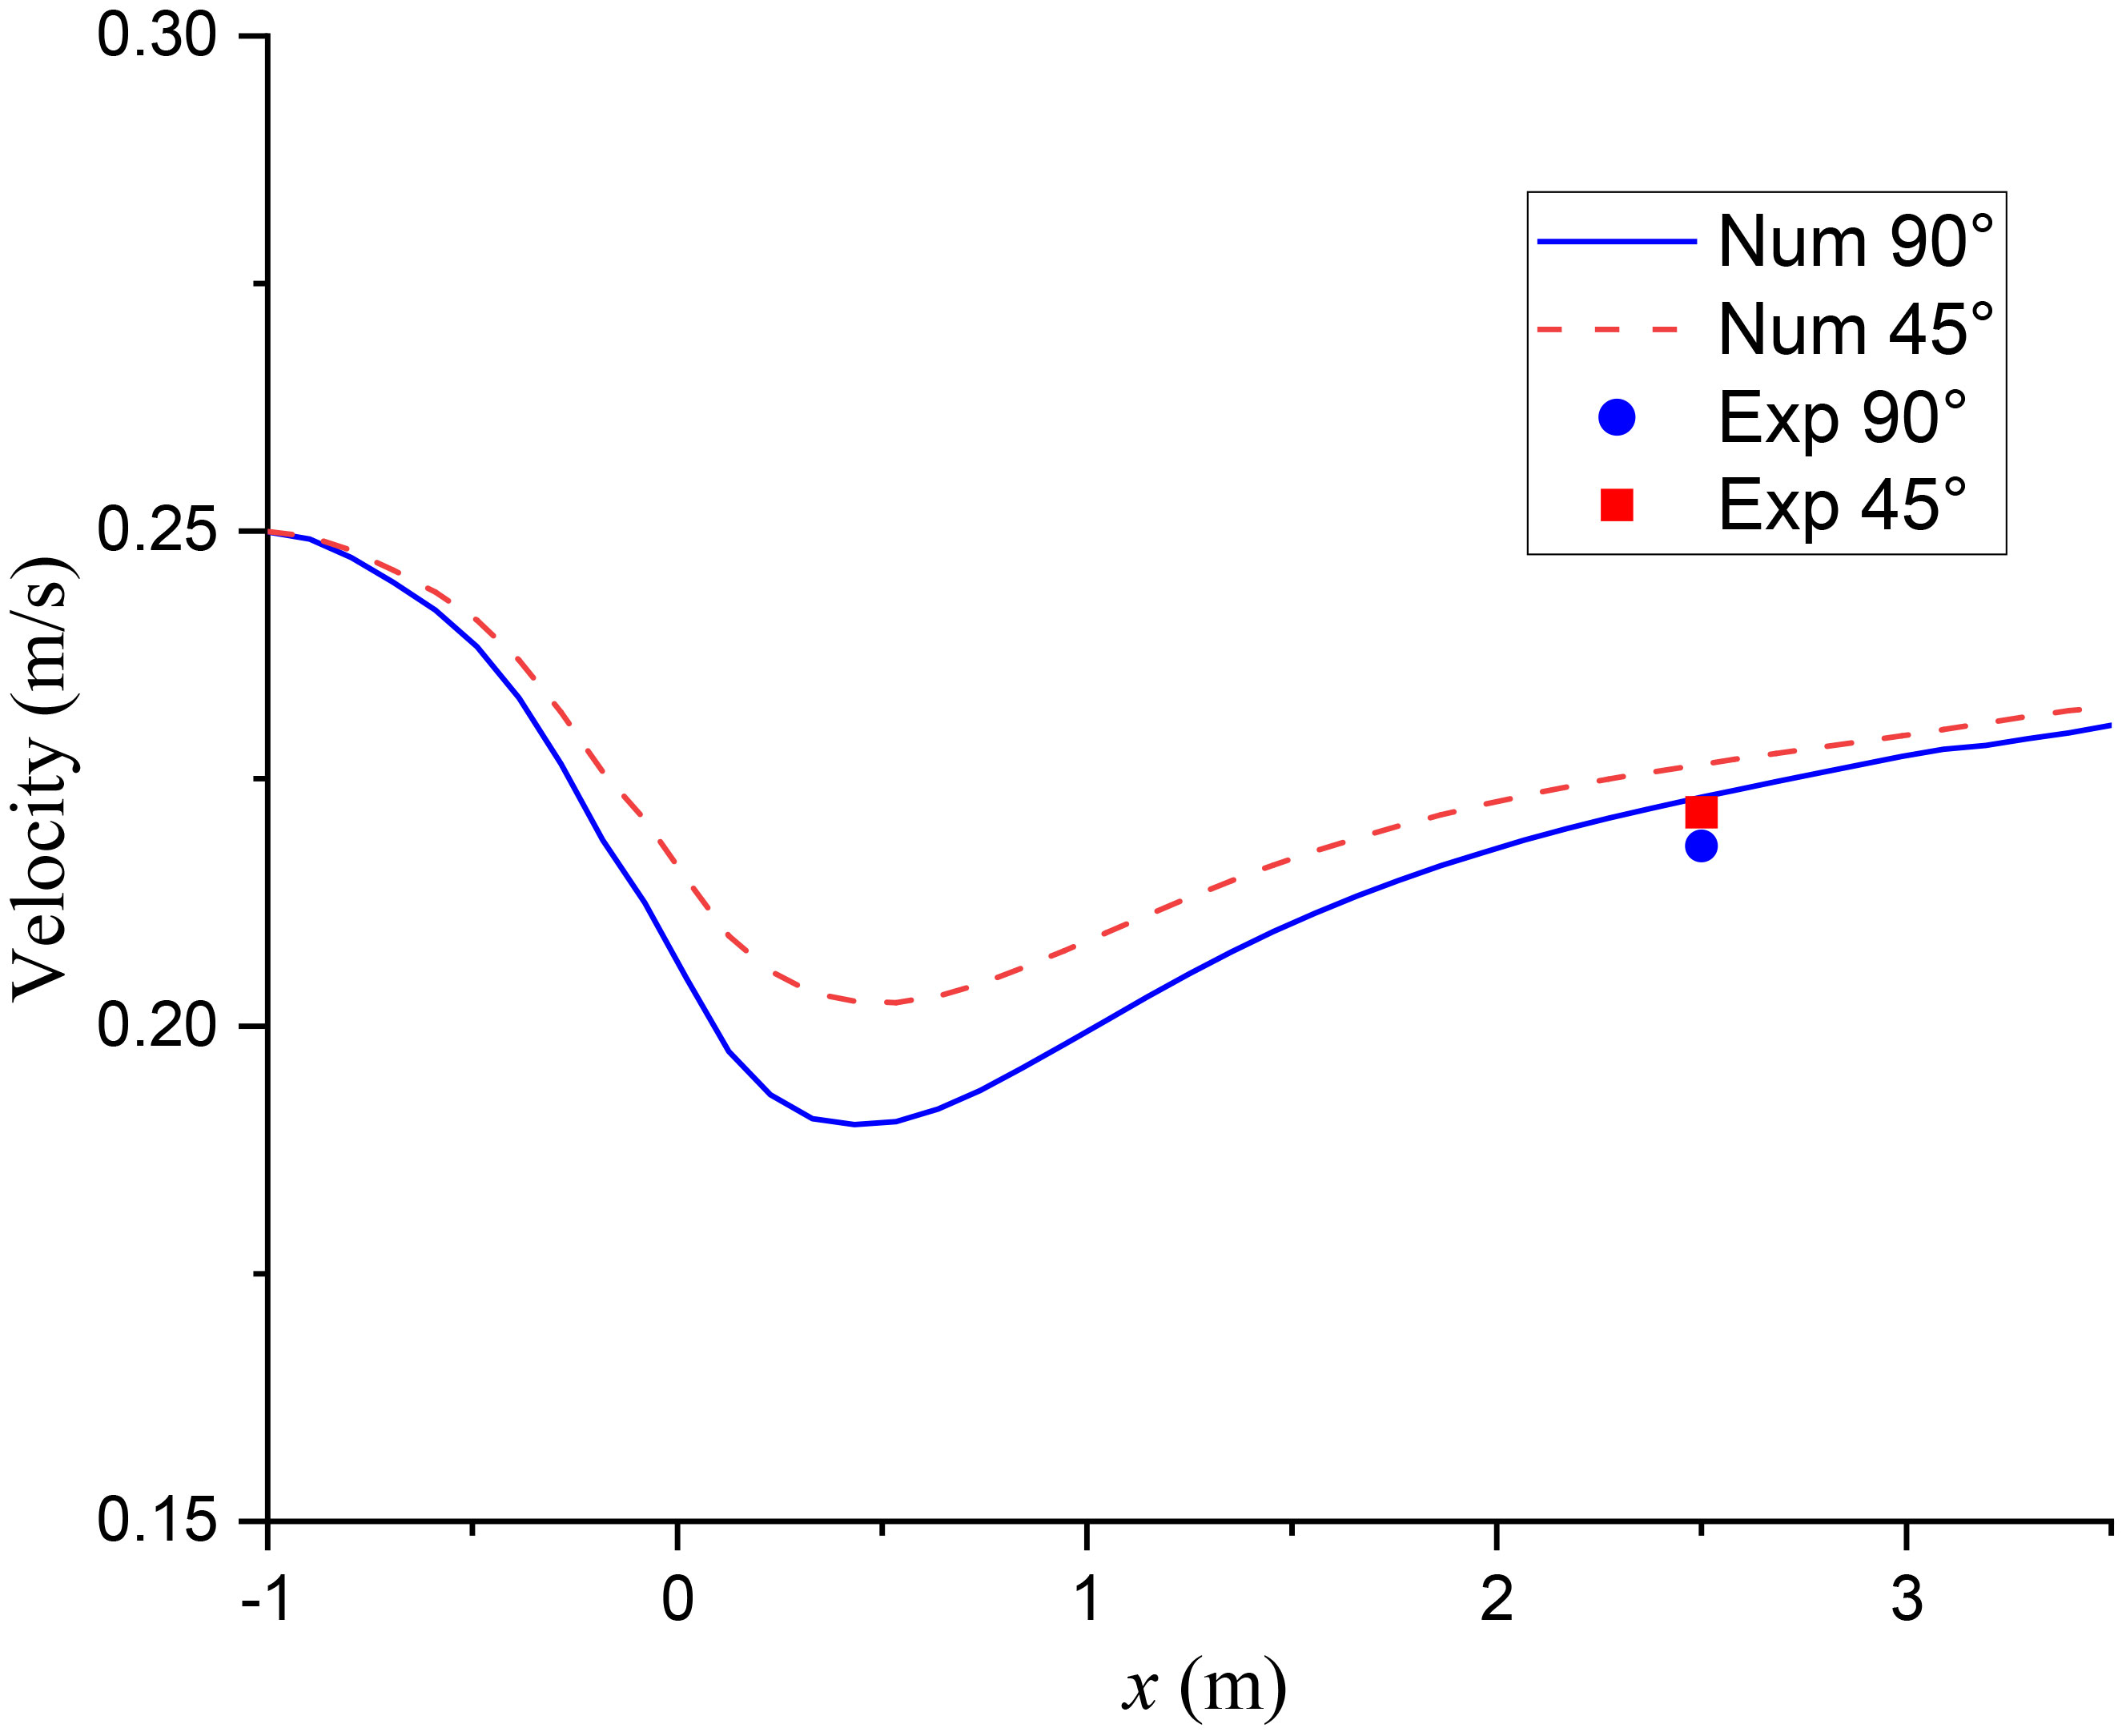
Figure 13 Streamwise velocity distribution along the centerline through the net panel for u∞= 0.25 m/s.
3.3 Hydrodynamics and deformation of a flexible net
3.3.1 Case setup
The simulation case for the flexible net is based on the experiments conducted by Bi et al. (2014). In their study, a knotless polyethylene net measuring 0.3m × 0.3m with 15 meshes in width and 15 meshes in height was tested. The twine diameter was 2.6mm, and the twine length was 20mm. The net was positioned vertically in the water, with its width centered in the flume. The top of the net panel was attached to a fixed steel bar, while a sinker system consisting of a 0.3m long, 6mm diameter steel bar with a density of 8610 kg/m3 was mounted at the bottom of the net. The experiments were carried out in a flume of 0.45m wide with 0.4m water depth.
Similarly, in the simulation, the numerical net is represented by square plate knot structures with dimensions of l =10.19mm, t =2.04mm, resulting a net solidity of , which is almost the same as the actual net( ). The computational domain is 1.3m × 0.45m × 0.4m. The simulation domain and the net model is shown in Figures 14 and 15. Similar to the previous section, open boundary conditions are set at the inlet and outlet of the fluid, two inflow velocity conditions of 0.17 and 0.226m/s are tested. The uniform-size particle of dp is set to 0.0012m, result in a total SPH particles of 1.35 × 10⁸.
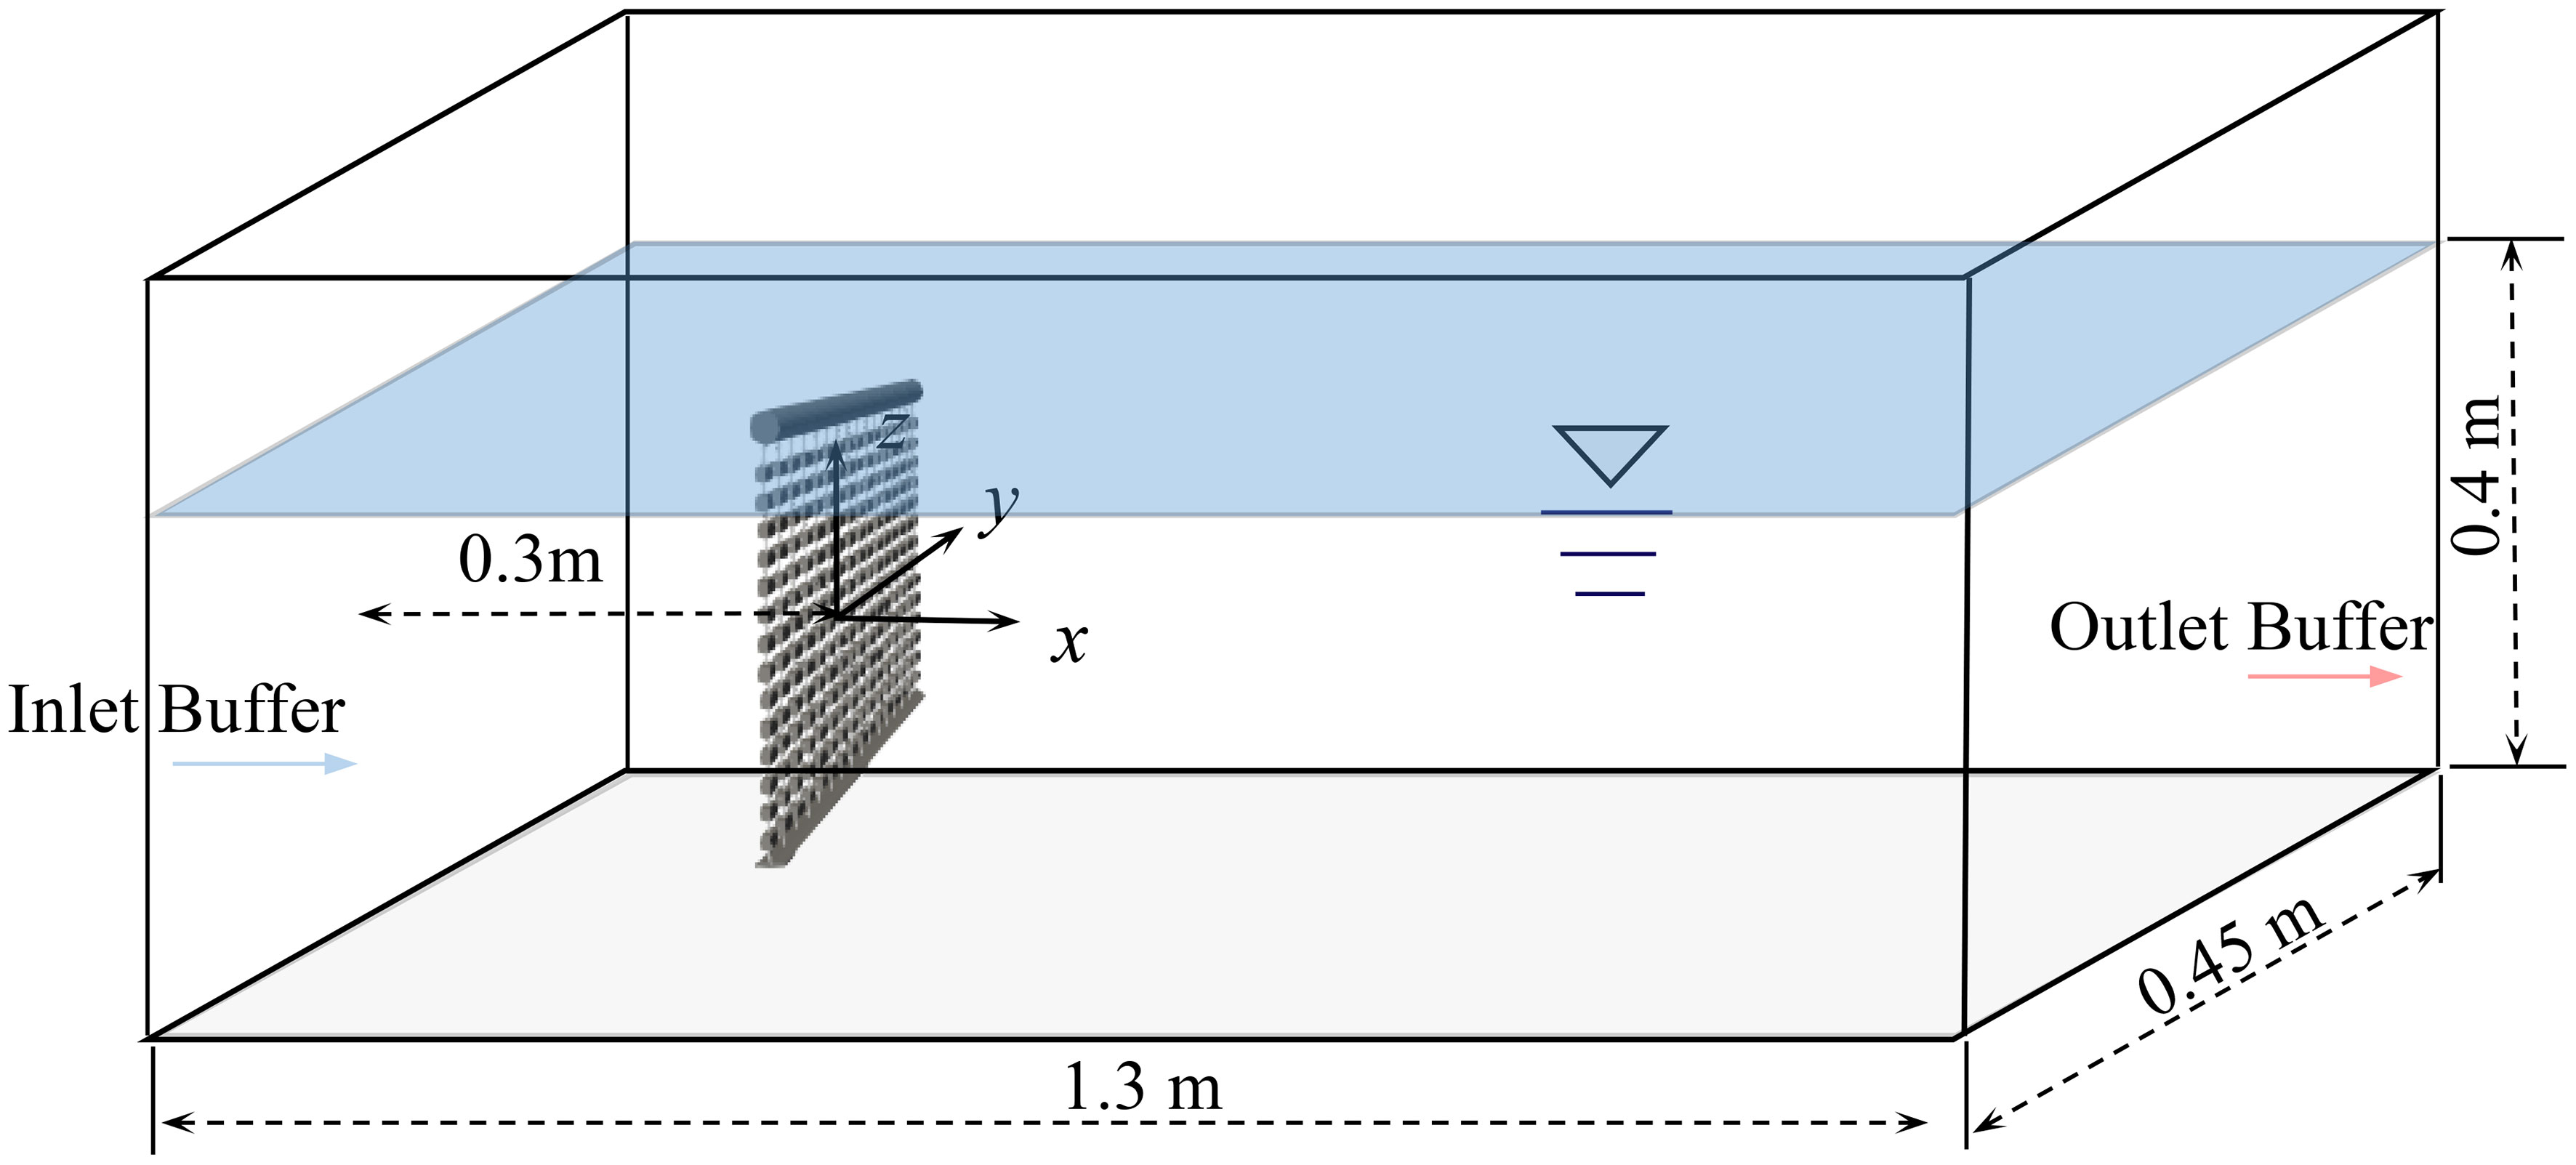
Figure 14 Computational domain of the flow past single flexible net.

Figure 15 Sketch of the flexible net panel: Experiment model (left, Bi et al., 2014); Numerical model (right).
3.3.2 Results and discussion
The drag forces acting on the flexible net at different inflow velocities are compared with the experimental and simulated data by Bi et al. (2014). As shown in Table 3, in general, the present numerical results are in accordance with the reference data, with a maximum relative error of 10% between their experimental results and a maximum relative error of 8% between their simulations. However, the calculated drag forces are slightly greater than the corresponding data, resulting a larger deformation of the net panel (see Figure 16). One possible explanation for this overestimation is the difference in net material parameters between the modeled net and the original net. While the net solidity in the numerical model closely matches that of the actual net, other material properties such as density and elasticity modulus may differ. Unfortunately, these specific parameters were not provided in the study by Bi et al. (2014), which limits our ability to precisely match the material behavior in the simulations.
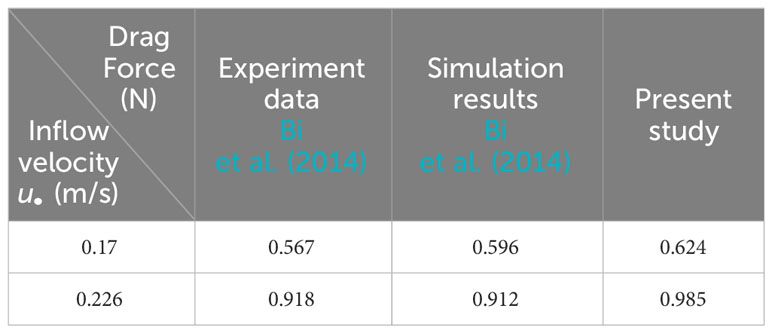
Table 3 Comparison of the drag force on the single net panel.
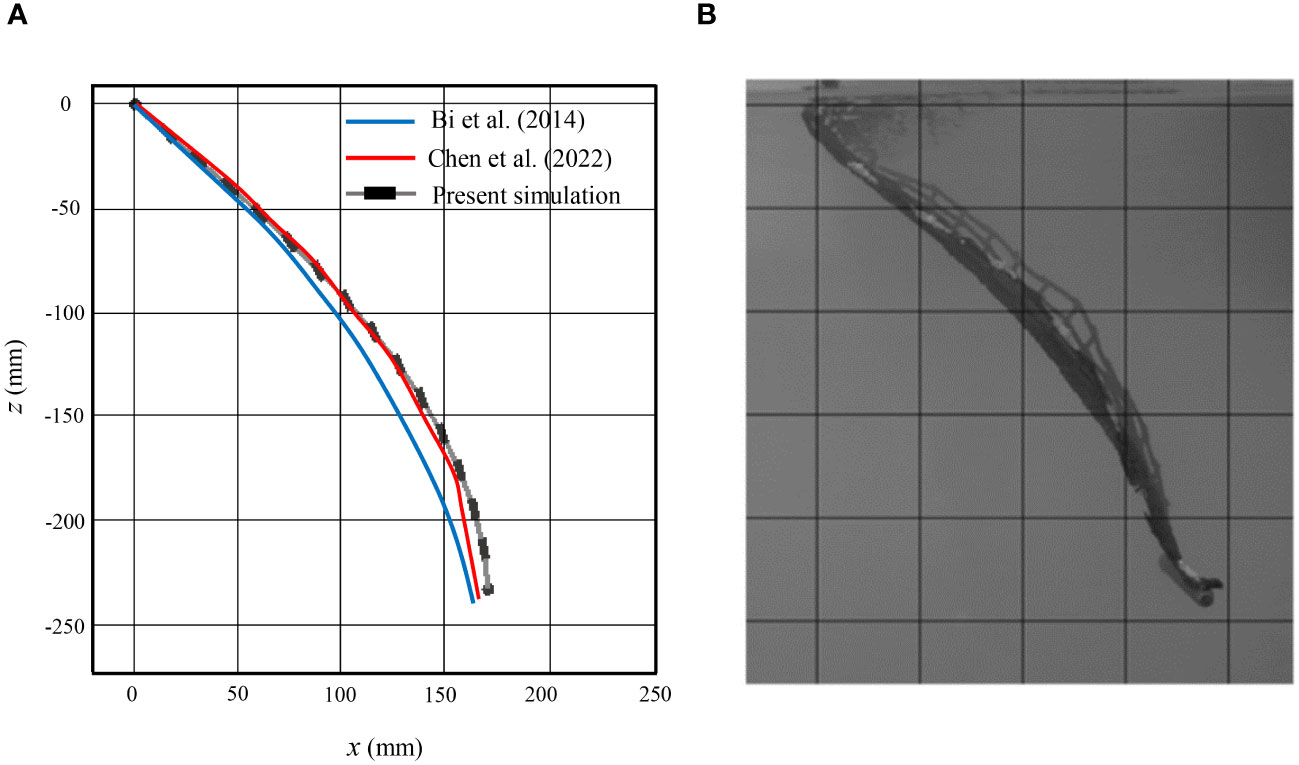
Figure 16 Deformation of a single flexible net for inflow velocity of 0.226 m/s: (A) Comparison between different simulation results. (B) Experimental results by Bi et al. (2014).
The comparisons of the deformation of a single flexible net between different simulations and experiment is shown in Figure 16, where the net structures are modeled using lumped-mass method in Bi et al. (2014) and finite element method in Cheng et al. (2022). It is observed that the deformation of the net is slightly larger than that predicted by Bi’s model as mentioned in the previous section. However, it is in a better agreement between the present simulation and Cheng’s simulation as well the laboratory experiments. This provides confidence in the accuracy of the numerical model for simulating the interaction between flow and flexible nets.
In addition to the drag force and deformation of the flexible net, the flow field around the net is also presented. The contour plots in Figures 17, 18 demonstrate the flow characteristics on the horizontal symmetric plane and the vertical symmetric plane. Due to the blockage effect of the net, the fluid is accelerated around and beneath the net panel, while it decelerates in the upstream and downstream regions. There is a small region of the velocity reduction upstream of the net, while a rather large velocity reduction wake region is observed downstream the net, indicating the pronounced shielding effect of the net. The wake region near the net is slightly wider than the projected width of the net panel and it becomes narrower along the centerline with increasing distance from the flexible net.

Figure 17 Flow-velocity distribution around a single flexible net for inflow velocity of 0.17 m/s: (A) contours on the horizontal plane of Z = -0.15 m and (B) contours on the vertical plane of Y= 0 m.
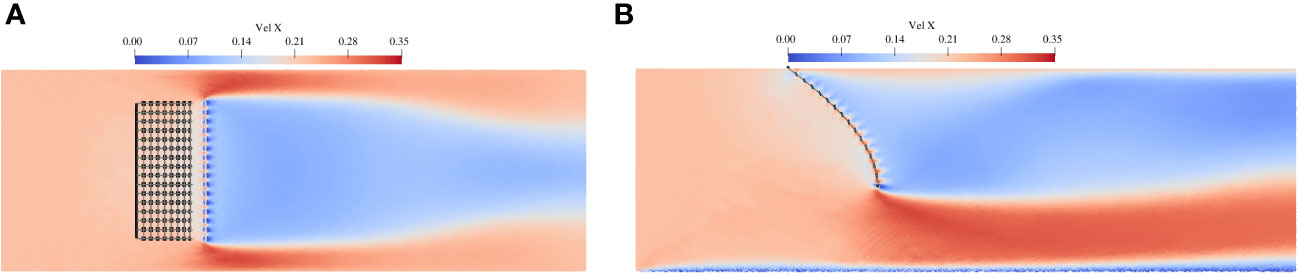
Figure 18 Flow-velocity distribution around a single flexible net for inflow velocity of 0.226 m/s: (A) contours on the horizontal plane of Z = -0.15 m and (B) contours on the vertical plane of Y= 0 m.
Figure 19 shows the velocity distribution in front of and downstream the single net. The interaction between the fluid and the net panel leads to the reduction of the current velocity, reaching a level approximately 10%–15% lower than the incoming flow. Beyond this point, the current velocity gradually increases to match the magnitude of the free stream velocity. The flow velocity obtained from the present study is in good agreement with the experimental data and simulations. The maximum difference between the present results and the experimental and simulation data is 6.5%. Comparing the momentum loss of the flow between case 3.2 (rigid net) and case 3.3 (flexible net), it is observed that the velocity of the flexible nets is higher than that of the rigid nets. This indicates that the flexible net exhibits a lesser shielding effect due to the deformation of the net panel.
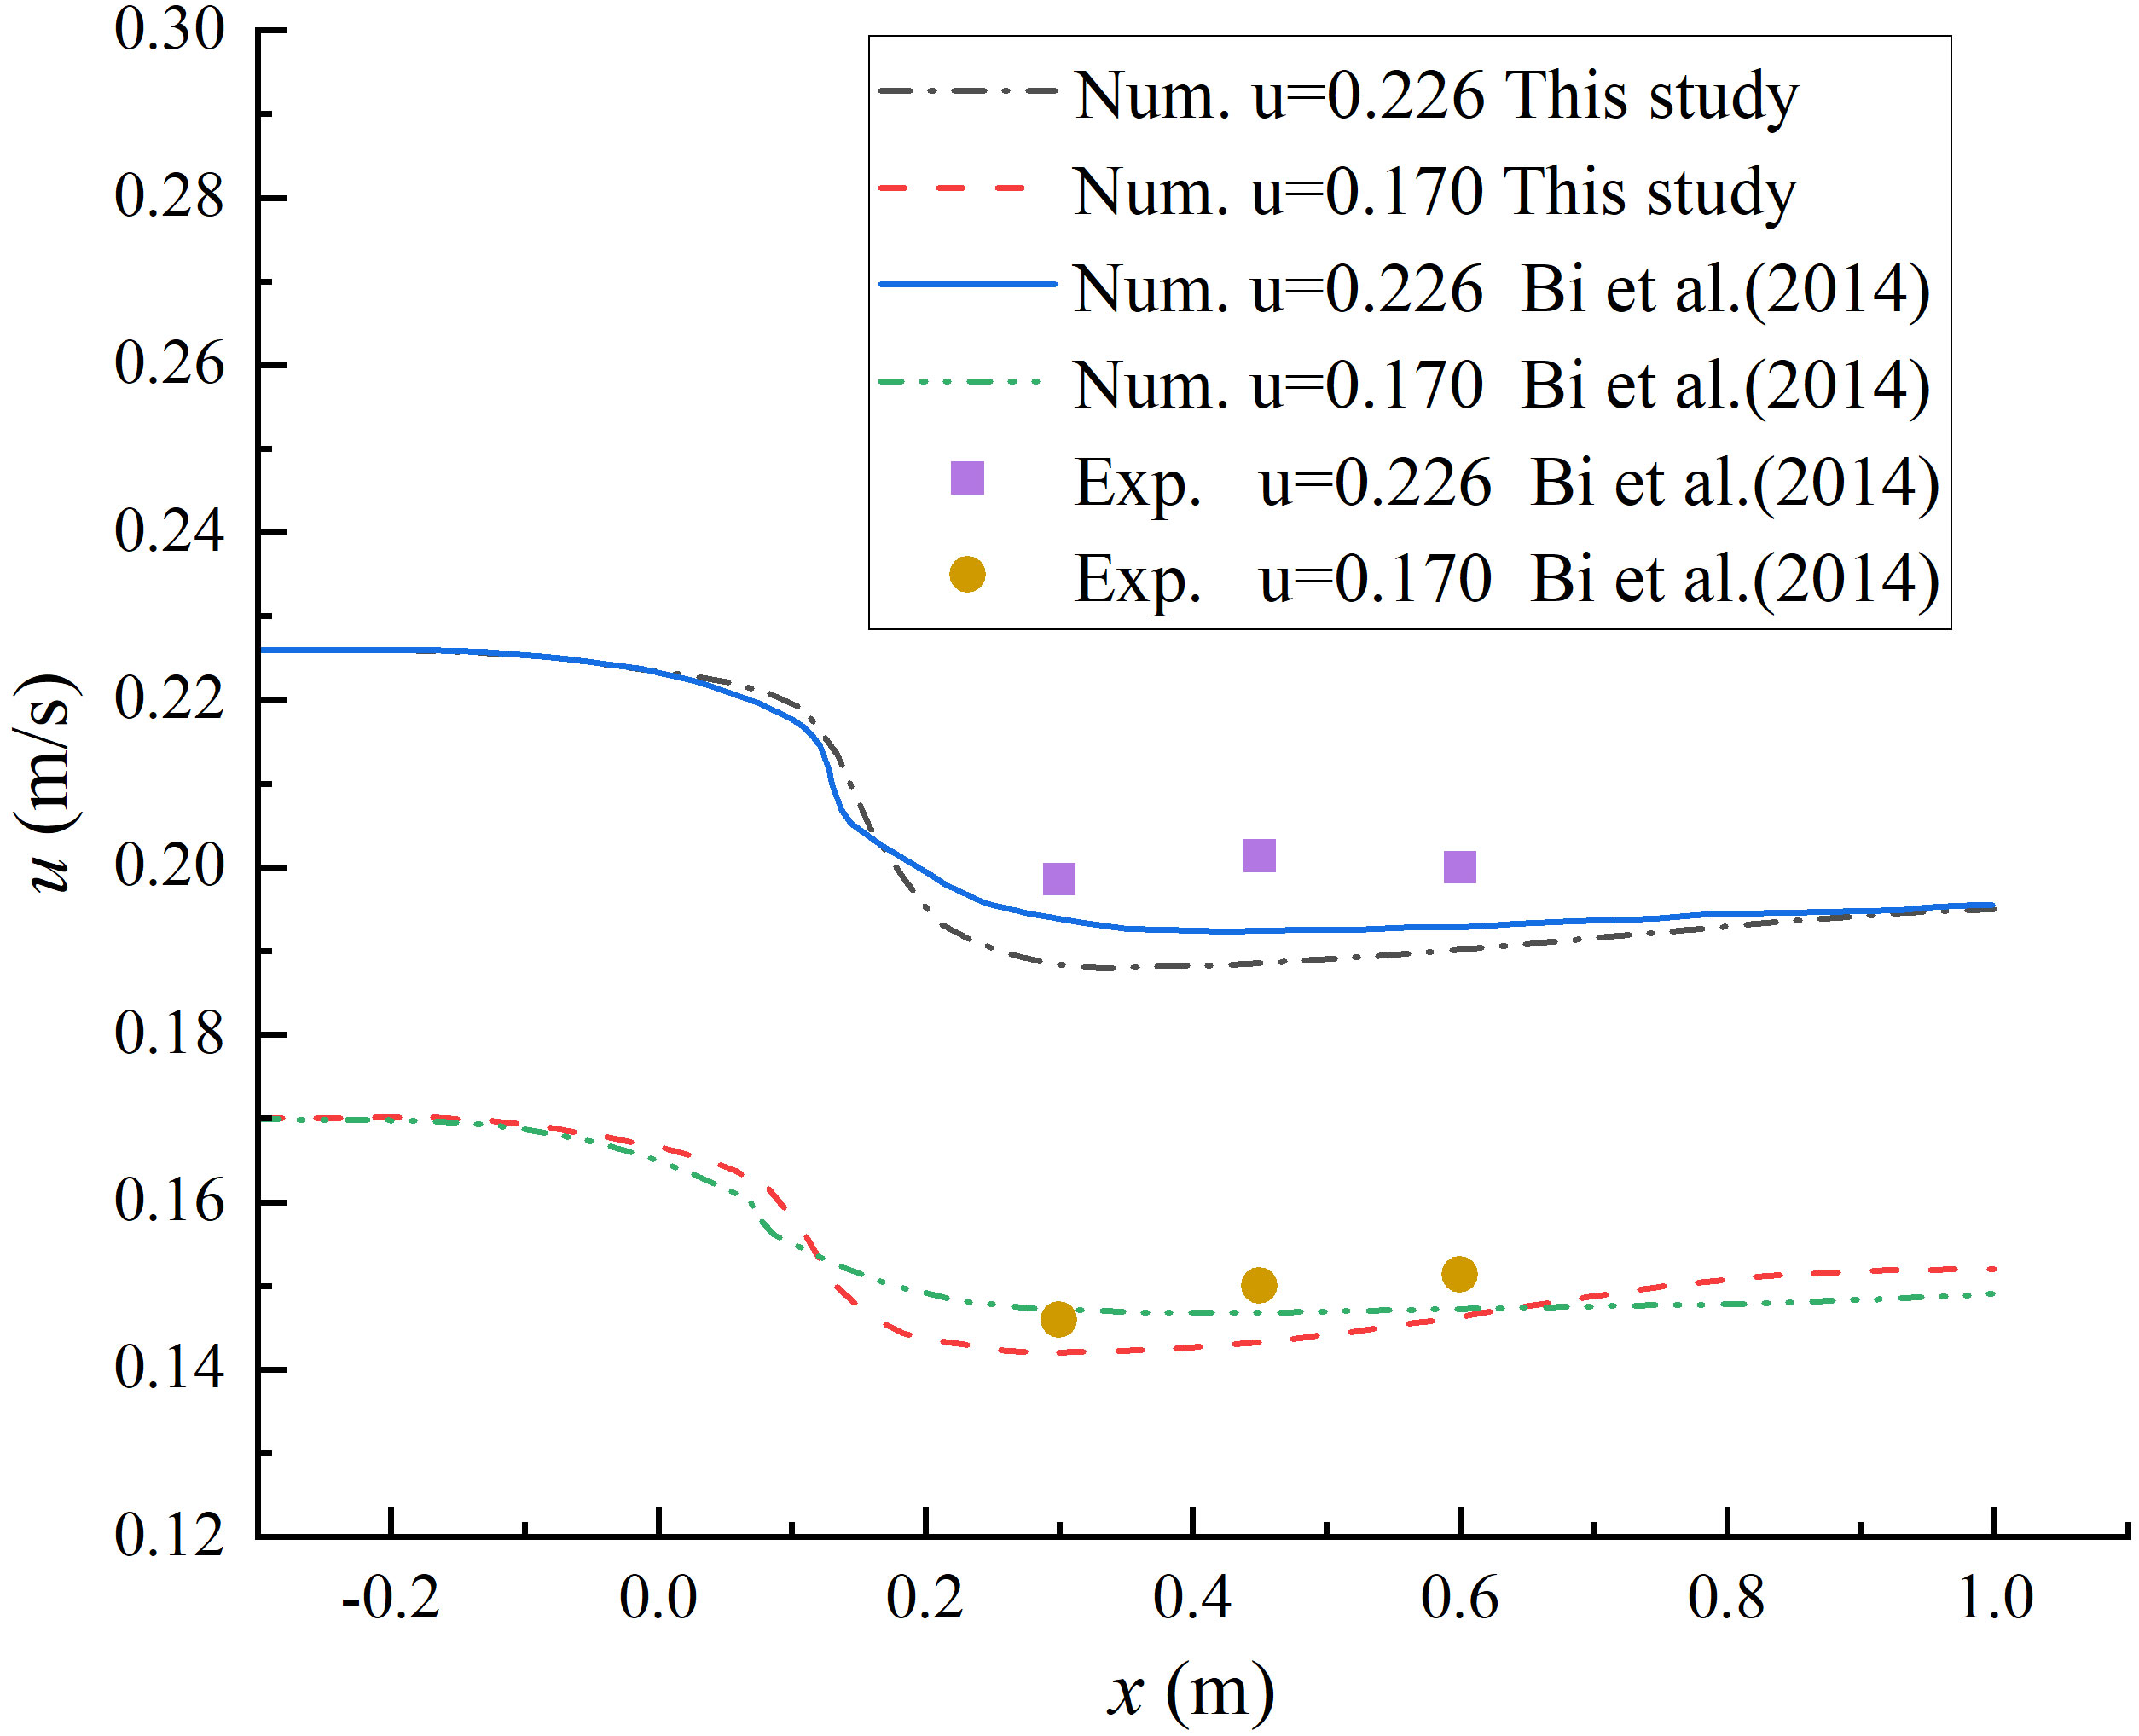
Figure 19 Comparison of the flow velocity distribution in front of and downstream the single net.
3.4 Hydrodynamics and deformation of two flexible nets
3.4.1 Case setup
The final simulation case is the flow past two flexible nets, and it is also based on Bi et al. (2014). The configuration of the two nets are the same as described in section 3.3, with a spacing distance of 0.3m, as shown in Figure 20. The numerical results obtained from this simulation will be validated using the experiments and simulations described earlier.
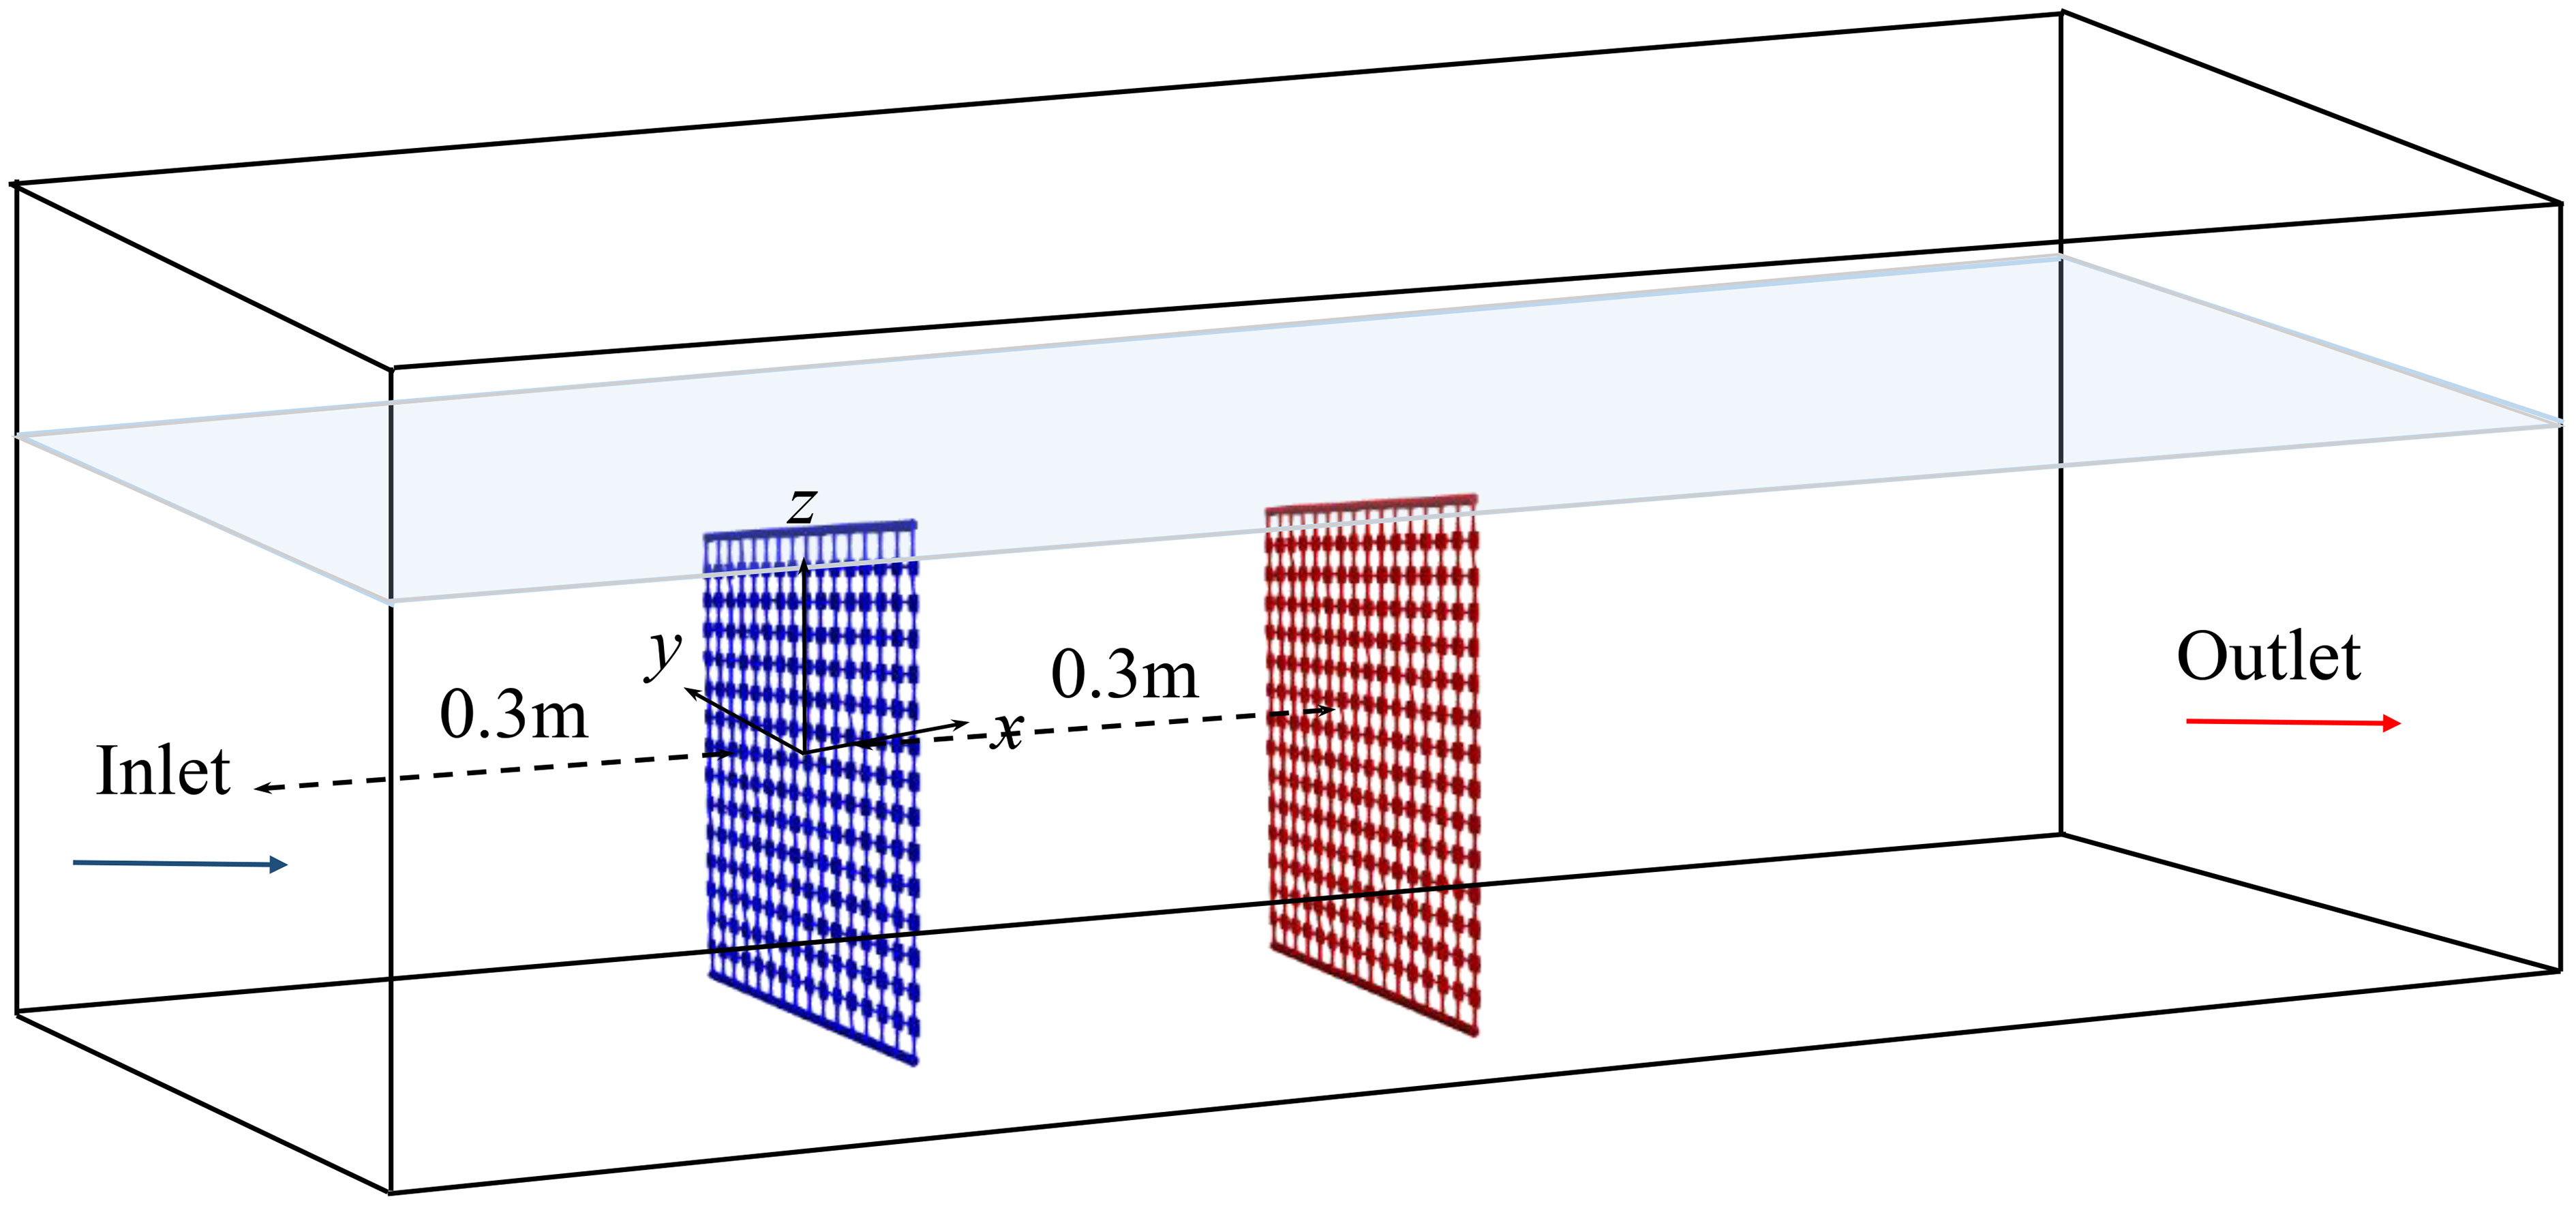
Figure 20 Computational domain of the flow past two flexible nets.
3.4.2 Results and discussion
As shown in Figure 21, the presented model can reproduce the results from Bi et al. (2014) and Cheng et al. (2022) in the deformations of the two flexible net panels. Comparing the numerical results with those of Bi and Cheng, it is observed that the predicted deformation of the first net in the present study is slightly larger, while the deformation of the second net is slightly smaller. As discussed in section 3.3, the calculated drag force on the first net in this study is slightly higher than that predicted by Bi and Cheng’s models, indicating a stronger interaction between the current and the first net, resulting in a larger deformation. Consequently, the velocity reduction in the wake of the first net is greater, leading to a slower flow velocity upstream of the second net and consequently a smaller deformation of the second net. Overall, the present simulation exhibits good agreement with the numerical and experimental results.
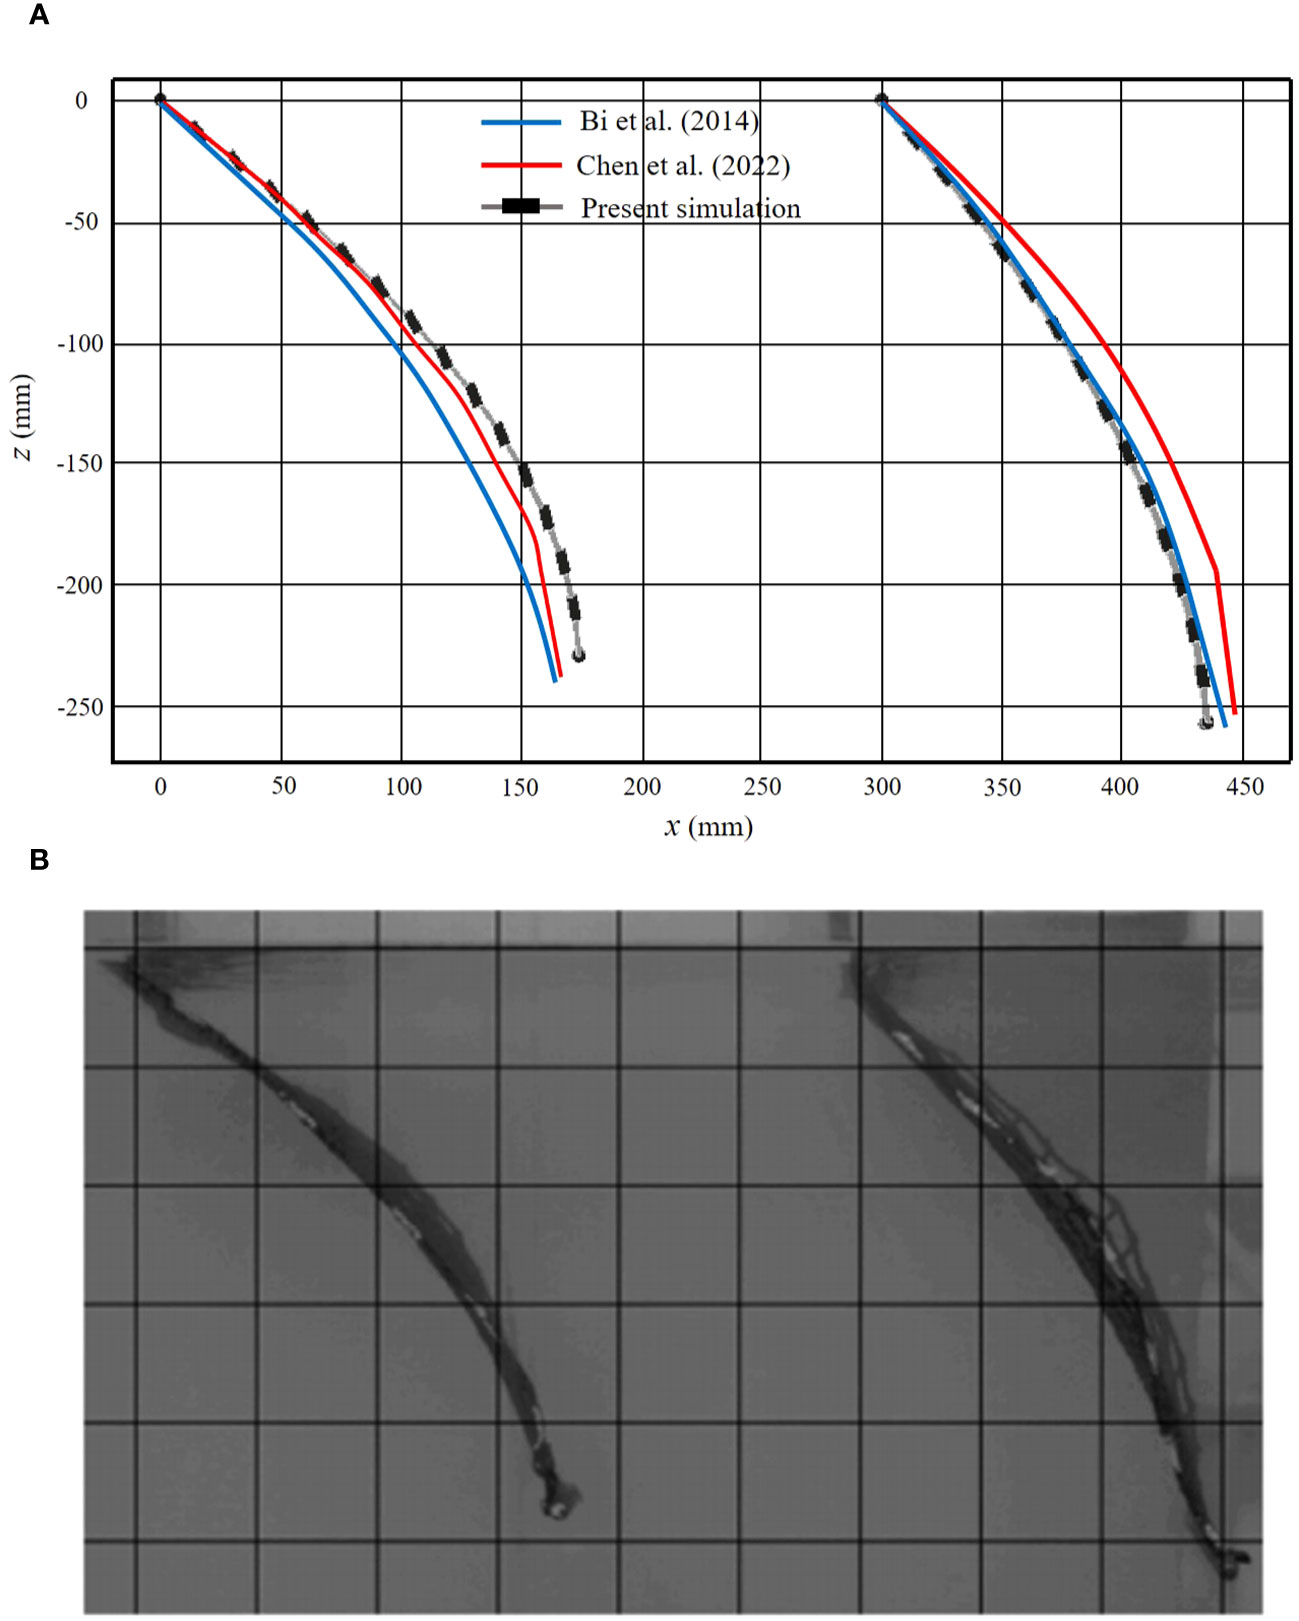
Figure 21 Deformation of two single flexible nets for inflow velocity of 0.226 m/s: (A) Comparison between different simulation results. (B) Experimental results by Bi et al. (2014).
Figures 22, 23 show the flow field around the two flexible net panels on the horizontal plane of Z = -0.15 m and the vertical plane of Y= 0 m. It can be observed that the flow velocity increases obviously below and on both sides of the net panels, while decreases after the flow passes each net panel. Comparing the cases of velocity between 0.17m/s and 0.226 m/s, it can be found that the deformation of the nets becomes larger as the current velocity increases, indicating a stronger interaction between the flow and net panels. Furthermore, there are significant differences in the deformations of the two flexible nets for both cases. This discrepancy highlights the shielding effects caused by the upstream net on the downstream net. In other words, the deformation of the downstream net is much smaller than that of the upstream net.
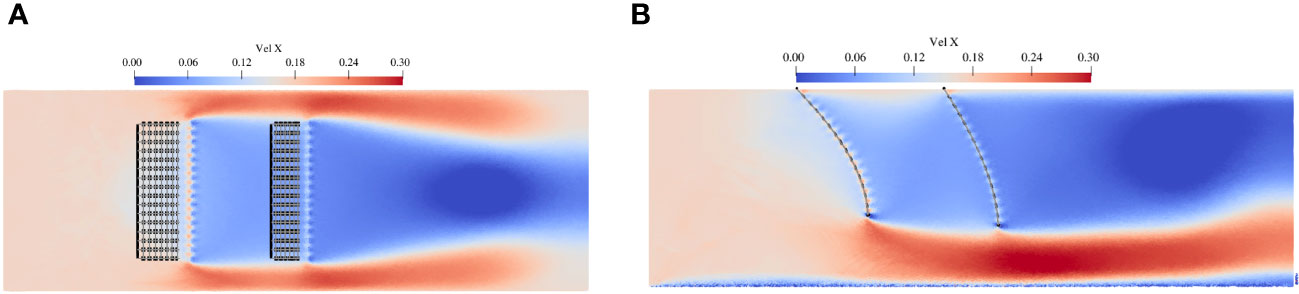
Figure 22 Flow-velocity distribution around two flexible nets for inflow velocity of 0.17 m/s: (A) contours on the horizontal plane of Z = -0.15 m and (B) contours on the vertical plane of Y= 0 m.
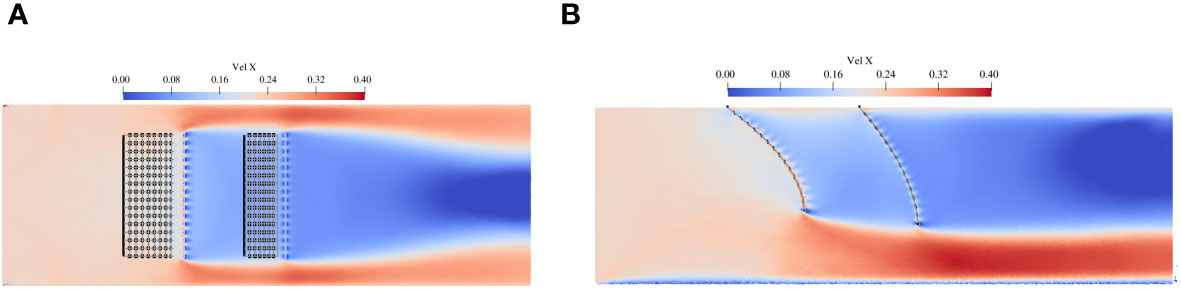
Figure 23 Flow-velocity distribution around two flexible nets for inflow velocity of 0.226 m/s: (A) contours on the horizontal plane of Z = -0.15 m and (B) contours on the vertical plane of Y= 0 m.
Figure 24 illustrates the comparison of the flow velocity distribution in front of and downstream of the two nets. An obvious reduction in flow velocity is observed along the line passing through the two flexible nets in the streamwise direction. The maximum difference between the present results and Bi’s data is approximately 7.5% for the case with the velocity of 0.17 m/s and 4.5% for the velocity of 0.226 m/s. The maximum flow velocity reductions downstream from the two nets are 26.3% for the case with a velocity of 0.226 m/s and 27.5% for a velocity of 0.17 m/s, respectively. Additionally, the flow velocity decreases by approximately 13% when passing each net panel.
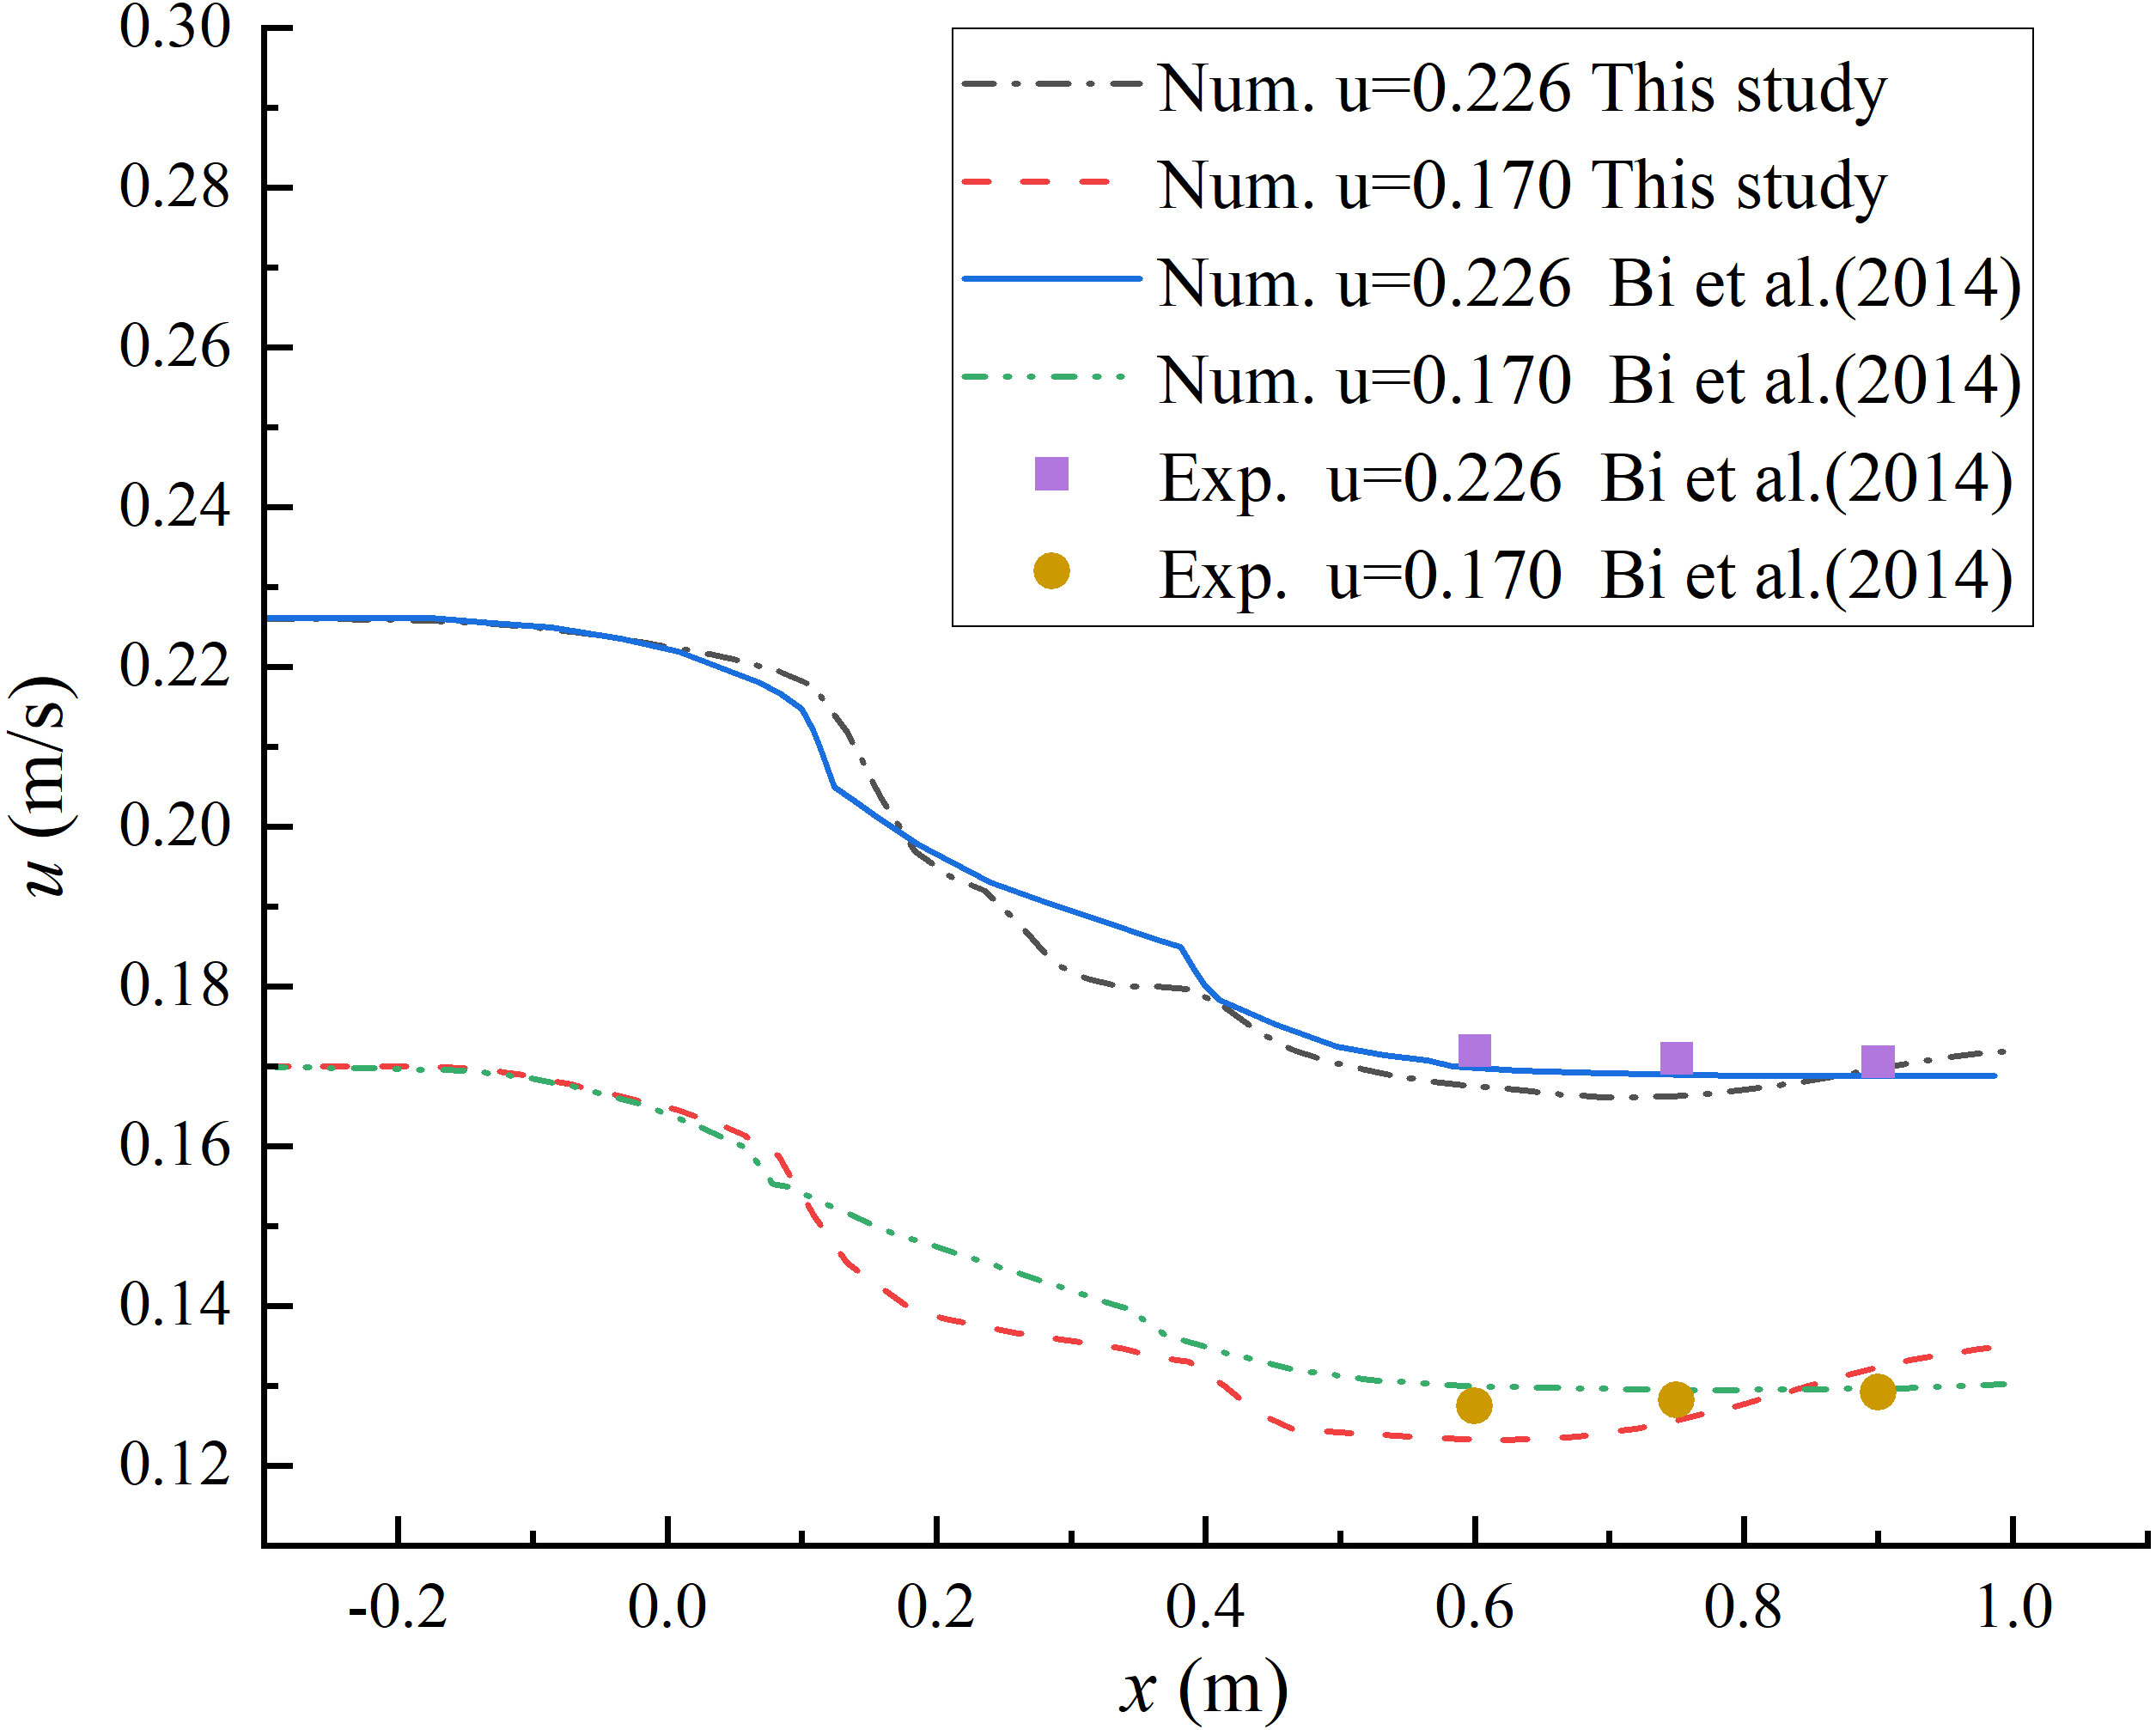
Figure 24 Comparison of the flow velocity distribution in front of and downstream the two nets.
Overall, the comparison of the deformation and the flow velocity reduction of the two flexible nets in this simulation with existing numerical and experimental data presents satisfactory results.
4 Conclusions
The presented paper introduces a new approach for modelling the flow through fish net panels using SPH method. In this approach, the net panel is represented by a structure of actual knots and virtual springs. The hydrodynamic forces on the net are determined through the interaction between the fluid and the net knots. This modeling approach offers several advantages over traditional methods such as the Morison force model or screen force model, for it removes the unknown force coefficients, which are typically determined from experimental data and additional data-fitting algorithm in the force formulation. This reliance on force coefficients can introduce uncertainty and sensitivity in the results. The SPH method also has the advantage over mesh-based Eulerian methods that it can handle the challenge when the nets are in large deformation or collide against other objects.
The proposed numerical model is validated against various existing experiments and simulations involving fixed and flexible net panels in steady currents. Both qualitative and quantitative analyses are conducted to assess the model’s performance. Overall, the present model demonstrates reasonable accuracy in predicting hydrodynamic drags on the net, velocity reductions in the wake, and the deformation of the nets. This indicates that it is acceptable to represent the cruciform element of the net with square plate knots, and with an appropriate representation method, the current loads, net deformations, and disturbed flow velocities can be well predicted.
However, the computations also reveal a significant dependence of the net solidity (Sn) on the loads, deformations, and velocity reductions of the nets. This highlights the need for future research to develop a more applicable method for modeling the boundary nets. Additionally, further validations under complex wave and current-wave conditions should be considered to enhance the robustness of the model.
Data availability statement
The raw data supporting the conclusions of this article will be made available by the authors, without undue reservation.
Author contributions
QS: Methodology, Validation, Writing – original draft. DZ: Data curation, Software, Validation, Writing – review & editing. DX: Data curation, Writing – review & editing. NZ: Writing – review & editing, Validation. LZ: Data curation, Investigation, Supervision, Writing – review & editing. YP: Conceptualization, Funding acquisition, Visualization, Writing – review & editing.
Funding
The author(s) declare financial support was received for the research, authorship, and/or publication of this article. This study is financially supported by the National Natural Science Foundation of China (No. 52101330), National College Students’ innovation and entrepreneurship training program (No. 202310340006), Central Guidance for Local Science and Technology Development Fund Projects (No. 2023ZY1021), Science and Technology Plan Projects of Zhoushan (No. 2023C03004). Zhejiang Ocean University Talent Introduction Research Fund Project (No. 11185091622, JX6311180623), Zhoushan Dinghai District Science and Technology Plan Project (No. 2022C31009)
Acknowledgments
The SPH simulations were carried out with the open-source code, DualSPHysics, to which the authors are most grateful.
Conflict of interest
The authors declare that the research was conducted in the absence of any commercial or financial relationships that could be construed as a potential conflict of interest.
Publisher’s note
All claims expressed in this article are solely those of the authors and do not necessarily represent those of their affiliated organizations, or those of the publisher, the editors and the reviewers. Any product that may be evaluated in this article, or claim that may be made by its manufacturer, is not guaranteed or endorsed by the publisher.
References
Alver M. O., Skøien K. R., Føre M., Aas T. S., Oehme M., Alfredsen J. A. (2016). Modelling of surface and 3D pellet distribution in Atlantic salmon (Salmo salar L.) cages. Aquacult. Eng. 72, 20–29. doi: 10.1016/j.aquaeng.2016.03.003
Balash C., Colbourne B., Bose N., Raman-Nair W. (2009). Aquaculture Net drag force and added mass. Aquacultural Engineering. 41, 14–21. doi: 10.1016/j.aquaeng.2009.04.003
Bessonneau J. S., Marichal D. (1998). Study of the dynamics of submerged supple nets (applications to trawls). Ocean Engineering. 25, 563–583. doi: 10.1016/S0029-8018(97)00035-8
Bi C., Balash C., Matsubara S., Zhao Y., Dong G. (2017). Effects of cylindrical cruciform patterns on fluid flow and drag as determined by CFD models. Ocean Engineering. 135, 28–38. doi: 10.1016/j.oceaneng.2017.02.032
Bi C., Zhao Y., Dong G., Wu Z., Zhang Y., Xu T. (2018). Drag on and flow through the hydroid-fouled nets in currents. Ocean Eng. 161, 195–1204. doi: 10.1016/j.oceaneng.2018.05.005
Bi C., Zhao Y., Dong G., Xu T., Gui F. (2013). Experimental investigation of the reduction in flow velocity downstream from a fishing net. Aquacultural Engineering. 57, 71–81. doi: 10.1016/j.aquaeng.2013.08.002
Bi C., Zhao Y., Dong G., Xu T., Gui F. (2014). Numerical simulation of the interaction between flow and flexible nets. J. Fluids Structures 45, 180–201. doi: 10.1016/j.jfluidstructs.2013.11.015
Chen Q., Bi C., Zhang Z., Zhao Y. (2023). Hydrodynamic effect of different biofouling types on aquaculture netting. Ocean Eng. 279, 114430. doi: 10.1016/j.oceaneng.2023.114430
Cheng H., Li L., Aarsæther K. G., Ong M. C. (2020). Typical hydrodynamic models for aquaculture nets: A comparative study under pure current conditions. Aquacultural Engineering. 90, 102070. doi: 10.1016/j.aquaeng.2020.102070
Cheng H., Ong M. C., Li L., Chen H. (2022). Development of a coupling algorithm for fluid-structure interaction analysis. Ocean Engineering. 243, 110208. doi: 10.1016/j.oceaneng.2021.110208
Crespo A. J. C., Domínguez J. M., Rogers B. D., Gómez-Gesteira M., Longshaw S., Canelas R., et al. (2015). DualSPHysics: Open-source parallel CFD solver based on Smoothed Particle Hydrodynamics (SPH). Comput. Phys. Commun. 187, 204–216. doi: 10.1016/j.cpc.2014.10.004
DeCew J., Tsukrov I., Risso A., Swift M. R., Celikkol B. (2010). Modelling of dynamic behavior of a single-point moored submersible fish cage under currents. Aquacultural Engineering. 43, 38–45. doi: 10.1016/j.aquaeng.2010.05.002
English A., Domínguez J., Vacondio R., A. J., Stansby P., Lind S., et al. (2022). Modified dynamic boundary conditions (mDBC) for general purpose smoothed particle hydrodynamics (SPH): application to tank sloshing, dam break and fish pass problems. Comput. Particle Mechanics 9, 911–925. doi: 10.1007/s40571-021-00403-3
Føre H., Endresen P., Norvik C., Lader P. (2020). “Hydrodynamic loads on net panels with different solidities,” in ASME 2020 39th International Conference on Ocean, Offshore and Arctic Engineering. doi: 10.1115/OMAE2020-18875
Gingold R., Monaghan J. (1977). Smoothed particle hydrodynamics: theory and application to non-spherial stars. Monthly Notices R. Astronomical Soc. 181, 375–389. doi: 10.1093/mnras/181.3.375
Huang L., Li Y., Ni Y., Cheng H., Wang X., Wang G., et al. (2019). “Study on the influence of mesh grouping on numerical simulationresults of fish cages,” in ASME 2019 38th International Conference on Ocean, Offshore and Arctic Engineering, OMAE 2019-95706. doi: 10.1115/OMAE2019-95706
Kristiansen T., Faltinsen O. M. (2012). Modelling of current loads on aquaculture net cages. J. Fluids Structures. 34, 218–235. doi: 10.1016/j.jfluidstructs.2012.04.001
Lader P., Enerhaug B., Fredheim A., Klebert P., Pettersen B. (2014). Forces on a cruciform/ sphere structure in uniform current. Ocean Engineering. 82, 180–190. doi: 10.1016/j.oceaneng.2014.03.007
Lader P., Jensen A., Sveen J. K., Fredheim A., Enerhaug B., Fredriksson D. (2007). Experimental investigation of wave forces on net structures. Appl. Ocean Res. 29, 112–127. doi: 10.1016/j.apor.2007.10.003
Lee C. W., Kim Y. B., Lee G. H., Choe M. Y., Lee M. K., Koo K. Y. (2008). Dynamic simulation of a fish cage system subjected to currents and waves. Ocean Engineering. 35, 1521–1532. doi: 10.1016/j.oceaneng.2008.06.009
Løland G. (1991). Current forces on and flow through fish farms (Doctoral thesis) (Norwegian Institute of Technology Trondheim, Norway).
Lucy L. (1977). A numerical approach to the testing of fusion processes. Astronomical J. 82, 1013–1024. doi: 10.1086/112164
Martin T., Bihs H. (2021). A non-linear implicit approach for modelling the dynamics of porous tensile structures interacting with fluids. J. Fluids Structures. 100, 103168. doi: 10.1016/j.jfluidstructs.2020.103168
Martin T., Kamath A., Bihs H. (2020b). A Lagrangian approach for the coupled simulation of fixed net structures in a Eulerian fluid model. J. Fluids Structures 94(2020), 102962. doi: 10.1016/j.jfluidstructs.2020.102962
Martin T., Tsarau A., Bihs H. (2020a). A numerical framework for modelling the dynamics of open ocean aquaculture structures in viscous fluids. Appl. Ocean Res. 106, 102410. doi: 10.1016/j.apor.2020.102410
Martin T., Wang G., Bihs H. (2022). Numerical Modelling of the Interaction of Moving Fish Nets and Fluid. J. offshore mechanics arctic Eng. 144, 011901. doi: 10.1115/1.4051088
Molteni D., Colagrossi A. (2009). A simple procedure to improve the pressure evaluation in hydrodynamic context using the SPH. Comput. Phys. Commun. 180, 861–872. doi: 10.1016/j.cpc.2008.12.004
Oppedal F., Dempster T., Stien. L. H. (2011). Environmental drivers of Atlantic salmon behaviour in sea-cages: a review. Aquaculture 311, 1–18. doi: 10.1016/j.aquaculture.2010.11.020
Patursson Ø., Swift M. R., Tsukrov I., Simonsen K., Baldwin K., Fredriksson D. W., et al. (2010). Development of a porous media model with application to flow through and around a net panel. Ocean Engineering. 37, 314–324. doi: 10.1016/j.oceaneng.2009.10.001
Sim J., Cheng H., Aarsæther K. G., Li L., Ong M. C. (2021). Numerical Investigation on the Cage-to-Cage Wake Effect: A Case Study of a 4 × 2 Cage Array. J. Offshore Mechanics Arctic Engineering. 143, 051301. doi: 10.1115/1.4049831
Tafuni A., Domínguez J. M., Vacondioc R., Crespo A. J. C. (2018). A versatile algorithm for the treatment of open boundary conditions in Smoothed particle hydrodynamics GPU models. Comput. Methods Appl. Mechanics Engineering. 342, 604–624.
Tan Z., Sun P., Liu N., Li Z., Lyu H., Zhu R. (2023). SPH simulation and experimental validation of the dynamic response of floating offshore wind turbines in waves. Renewable Energy. 205, 393–409. doi: 10.1016/j.renene.2023.01.081
Tang H., Huang C., Chen W. (2011). Dynamics of dual pontoon floating structure for cage aquaculture in a two-dimensional numerical wave tank. J. Fluids Structures. 27, 918–936. doi: 10.1016/j.jfluidstructs.2011.06.009
Tang H., Xu L., Hu F. (2018). Hydrodynamic characteristics of knotted and knotless purse seine netting panels as determined in a flume tank. PloS One 13, e0192206. doi: 10.1371/journal.pone.0192206
Tsukrov I., Drach A., DeCew J., Robinson Swift M., Celikkol B. (2011). Characterization of geometry and normal drag coefficients of copper nets. Ocean Engineering. 38, 1979–1988. doi: 10.1016/j.oceaneng.2011.09.019
Wang G., Martin T., Huang L., Bihs H. (2022). Modeling the Flow Around and the Hydrodynamic Drag on Net Meshes Using reef3d. J. offshore mechanics arctic Eng. 144, 011902. doi: 10.1115/1.4051408
Xu Z., Qin H. (2020). Fluid-structure interactions of cage based aquaculture: from structures to organisms. Ocean Eng. 217, 107961. doi: 10.1016/j.oceaneng.2020.107961
Xu T., Zhao Y., Dong G., Li Y., Gui F. (2013). Analysis of hydrodynamic behaviors of multiple net cages in combined wave-current flow. J. Fluids Structures. 39, 222–236. doi: 10.1016/j.jfluidstructs.2013.02.011
Yao Y., Chen Y., Zhou H., Yang H. (2016a). Numerical modeling of current loads on a net cage considering fluid–structure interaction. J. Fluid Struct. 62, 350–366. doi: 10.1016/j.jfluidstructs.2016.01.004
Yao Y., Chen Y., Zhou H., Yang H. (2016b). A method for improving the simulation efficiency of trawl based on simulation stability criterion. Ocean Engineering. 117, 63–77. doi: 10.1016/j.oceaneng.2016.03.031
Zhao Y., Bi C., Dong G., Gui F., Cui Y., Xu T. (2013). Numerical simulation of the flow field inside and around gravity cages. Aquacultural Eng. 52, 1–13. doi: 10.1016/j.aquaeng.2012.06.001
Keywords: SPH method, flexible net panel, fluid-structure interaction, hydrodynamic drag coefficient, flow-velocity reduction
Citation: Shi Q, Zhao D, Xue D, Zhang N, Zhang L and Pan Y (2024) Numerical modelling of the interaction between flexible net panels and fluids using SPH method. Front. Mar. Sci. 11:1365857. doi: 10.3389/fmars.2024.1365857
Received: 05 January 2024; Accepted: 28 March 2024;
Published: 17 April 2024.
Edited by:
Emilio Notti, National Research Council (CNR), ItalyReviewed by:
Shuchuang Dong, The University of Tokyo, JapanQiang Chen, Florida International University, United States
Copyright © 2024 Shi, Zhao, Xue, Zhang, Zhang and Pan. This is an open-access article distributed under the terms of the Creative Commons Attribution License (CC BY). The use, distribution or reproduction in other forums is permitted, provided the original author(s) and the copyright owner(s) are credited and that the original publication in this journal is cited, in accordance with accepted academic practice. No use, distribution or reproduction is permitted which does not comply with these terms.
*Correspondence: Lifeng Zhang, zhanglifeng@pku.edu.cn; Yun Pan, panyunhk@zjou.edu.cn