Deep learning–assisted biodiversity assessment in deep-sea benthic megafauna communities: a case study in the context of polymetallic nodule mining
 Daphne Cuvelier
 Martin Zurowietz
 Tim W. Nattkemper
- 1Institute of Marine Sciences - Okeanos, University of the Azores, Horta, Portugal
- 2Biodata Mining Group, Faculty of Technology, Bielefeld University, Bielefeld, Germany
Introduction: Technological developments have facilitated the collection of large amounts of imagery from isolated deep-sea ecosystems such as abyssal nodule fields. Application of imagery as a monitoring tool in these areas of interest for deep-sea exploitation is extremely valuable. However, in order to collect a comprehensive number of species observations, thousands of images need to be analysed, especially if a high diversity is combined with low abundances such is the case in the abyssal nodule fields. As the visual interpretation of large volumes of imagery and the manual extraction of quantitative information is time-consuming and error-prone, computational detection tools may play a key role to lessen this burden. Yet, there is still no established workflow for efficient marine image analysis using deep learning–based computer vision systems for the task of fauna detection and classification.
Methods: In this case study, a dataset of 2100 images from the deep-sea polymetallic nodule fields of the eastern Clarion-Clipperton Fracture zone from the SO268 expedition (2019) was selected to investigate the potential of machine learning–assisted marine image annotation workflows. The Machine Learning Assisted Image Annotation method (MAIA), provided by the BIIGLE system, was applied to different set-ups trained with manually annotated fauna data. The results computed with the different set-ups were compared to those obtained by trained marine biologists regarding accuracy (i.e. recall and precision) and time.
Results: Our results show that MAIA can be applied for a general object (i.e. species) detection with satisfactory accuracy (90.1% recall and 13.4% precision), when considered as one intermediate step in a comprehensive annotation workflow. We also investigated the performance for different volumes of training data, MAIA performance tuned for individual morphological groups and the impact of sediment coverage in the training data.
Discussion: We conclude that: a) steps must be taken to enable computer vision scientists to access more image data from the CCZ to improve the system’s performance and b) computational species detection in combination with a posteriori filtering by marine biologists has a higher efficiency than fully manual analyses.
1 Introduction
Polymetallic nodules occur in all Oceans at abyssal depths (>4000 m), but are most abundant in the Pacific Ocean. Within the north-east Pacific, the Clarion-Clipperton fracture Zone (CCZ) hosts the most extensive nodule fields that cover 6 million km² and stretch from 5° to 20° N and 115° to 160° W, covering over 1% of the world’s surface (Jones et al., 2021). Due to their high metal content and the relatively straightforward collection by hydraulic separation from surrounding soft sediment (Oebius et al., 2001), they have spiked an economic interest since the 1960–1970’s (Jones et al., 2017). So far, 17 license areas for polymetallic nodule exploration have been approved by the International Seabed Authority (ISA) within the CCZ, each up to 75,000 km2 in size (Wedding et al., 2013; Jones et al., 2017) and in 2021, the first polymetallic nodule collector test took place in the BGR and GSR areas (https://www.deme-group.com/news/metal-rich-nodules-collected-seabed-during-important-technology-trial published 22 April 2021, accessed 9/02/2022).
Nodules offer hard substrata in an otherwise soft sediment environment and host a specific nodule-associated fauna. More than 60% of megafauna depend on the nodules for attachment and survival (Amon et al., 2016; Vanreusel et al., 2016; Simon-Lledó et al., 2019a). In order to be able to quantify the impact of potential deep-sea mining on nodule associated fauna, there is an urgent need for extensive ecological baselines to understand the natural biodiversity, variation (spatial and temporal) and possible resilience of fauna to mining impacts. With regard to megafauna abundance and diversity assessments, imagery plays an important role to cover large areas. A recently presented CCZ checklist contains 436 named species from a total of 5578 recorded across the CCZ, amounting to an estimated 92% of species new to science (Rabone et al., 2023). The latter study takes into account all size classes including less conspicuous species that are not visible on imagery, but megafauna species make up 28% of the list (Rabone et al., 2023). The larger-sized megafaunal compartment shows quite some variation within license areas (e.g. Simon-Lledó et al., 2019b; Uhlenkott et al., 2023) and across regional scales, depicting a link with depth and its associated variables as well as geomorphology and nodule coverage (Vanreusel et al., 2016; Cuvelier et al., 2020; Simon-Lledó et al., 2023a). As mining affects extremely large seafloor areas, information on spatial variation in biodiversity is essential to comprehend the ecosystem, its functioning and possibilities to recover. This information is also fundamental to assess the usefulness of refuge areas and the similarity to or representativity of the Areas of Particular Environmental Interest (APEI’s), where mining will not be permitted (Lodge et al., 2014). For these areas to be effective, there needs to be an overlap in faunal composition and connectivity, which is likely to be linked to resource availability (i.e. nodule size and density) (Cuvelier et al., 2018).
Imagery is a less biased technique for quantifying biodiversity than sampling since it does not depend on accessibility, is a non-invasive tool and permits covering large surfaces (Cuvelier et al., 2012). In a post-mining scenario, it represents the ultimate monitoring tool in a possible rugged terrain. Moreover, it is cost-effective and easily replicable, on condition that imagery platform deployment techniques and sampling set-up are comparable (Schoening et al., 2020). The counterpart is that a huge amount of imagery is collected, often adding up to tens of thousands of pictures of the seafloor, that need to be analysed to adequately quantify the benthic fauna and its diversity. As illustrated in (Piechaud et al., 2019), a single AUV dive of 22 h can result in 150,000 digital images collected. The main difficulty with images from the abyssal nodule fields is that an image often features multiple morphospecies from different taxonomic groups on an irregular background with alternating hard and soft substrata. Accuracy of biodiversity assessments in these ecosystems tends to increase with sample size, in this case the amount of seafloor visualized; estimates of taxon richness, based on imagery analyses, require larger sample size and were shown to stabilise at 1000–1500 m2 of continuous seafloor coverage with >500 individuals (Simon-Lledó et al., 2019b).
To address the issue of having to analyse large image collections for representative biodiversity assessments, be it in marine or terrestrial environments, new computational tools have been developed and proposed over the last 5 to 10 years. The process of detecting objects (such as megafauna and deep-sea benthos) in images and assigning taxonomic labels to them is referred to as annotation. To make this time-consuming and tedious process more efficient, online image and video annotation tools have been proposed such as SQUIDLE+ (Proctor et al., 2018), VIAME (Dawkins et al., 2017) or BIIGLE (Langenkämper et al., 2017; Zurowietz and Nattkemper, 2021). In the case of benthic biodiversity community assessment, as considered here, the amount of image data collected often greatly exceeds the capacity of visual inspection by domain experts and the potential of machine learning–based annotation has gained interest over the last decade (e.g. Schoening et al., 2012; Möller and Nattkemper, 2021; Mbani et al., 2023; Yamada et al., 2023). To respond to the growing amounts of imagery, the BIIGLE system has been equipped with the MAIA tool (Machine learning Assisted Image Annotation) (Zurowietz et al., 2018; Zurowietz and Nattkemper, 2020) and cloud storage so users can upload their image data into the BIIGLE cloud, and analyse their image data more efficiently, employing machine learning. Automated object detection tools can reduce the time needed to analyse huge volumes of images by an estimated 50% (Zurowietz et al., 2018), allowing to collect biodiversity data more efficiently. This becomes even more important in the context of potential underwater mining activities, where selected areas will be visited repeatedly and more images will be recorded, not only to detect species and describe the community composition and diversity (baseline) but also to monitor the changes (impact assessment and subsequent surveys). In order to efficiently integrate tools such as MAIA in effective image data analysis workflows it must be investigated how well these machine learning tools are suited to assist the annotation of the accumulating data, how much posterior quality control is required and how performant the species detection is. In contrast to other related works, we mainly focused on the task of detecting fauna rather than the classification of pre-selected image patches. Considering the fact that one single image has an average footprint of 7 m2 with more than 24 million pixels, the screening of thousands of images for fauna or objects-of-interest can be considered a crucial part of the bottleneck problem in image annotation.
The performance and effectiveness of the MAIA in BIIGLE system in megafaunal assessments in a deep-sea mining context was tested with data collected at different altitudes from the abyssal nodule fields and with different degrees of disturbance caused by prior dredging (to simulate a mechanical disturbance of a potential mining action). The system was applied in different runs for different tasks, such as general object detection or the detection of one particular taxon and tested for different volumes of training data.
2 Materials and methods
2.1 Study site
The Clarion-Clipperton Fracture Zone (CCZ) located in the abyssal equatorial Pacific is the world’s largest mineral exploration region featuring polymetallic nodules. Currently, there are 17 contracts for mineral exploration covering 1.2 million km² (Jones et al., 2017) (Figure 1). In April–May 2019, the SO268 expedition (Haeckel and Linke, 2021) to the eastern CCZ carried out a small-scale disturbance experiment with a 1.5 m wide chain dredge in the BGR (Federal Institute for Geosciences and Natural Resources, Germany) license area (Figure 1). This dredge was towed 11 times over an area of ca. 100 x 500 m, creating ~5 cm deep dredge tracks. The area was surveyed with the Ocean Floor Observation System (OFOS) tow-cam before the disturbance (SO268/2_100-1 - OFOS05) (Purser et al., 2021a) and 17–18 days after the impact (SO268/2_160-1 - OFOS11) (Purser et al., 2021b) and 12 (SO268/2_164-1 - OFOS12) (Purser et al., 2021c) (Figures 1C, 2). The OFOS tow-cam was equipped with a Canon EOS 5D Mark IV still camera with 24 mm lens and 3 lasers spaced 40 cm apart. Towing speed was 0.5 knots and one image was taken every 10 seconds at an altitude of ca. 1.5 m above the seafloor with an image resolution of 6720 × 4480 pixels.
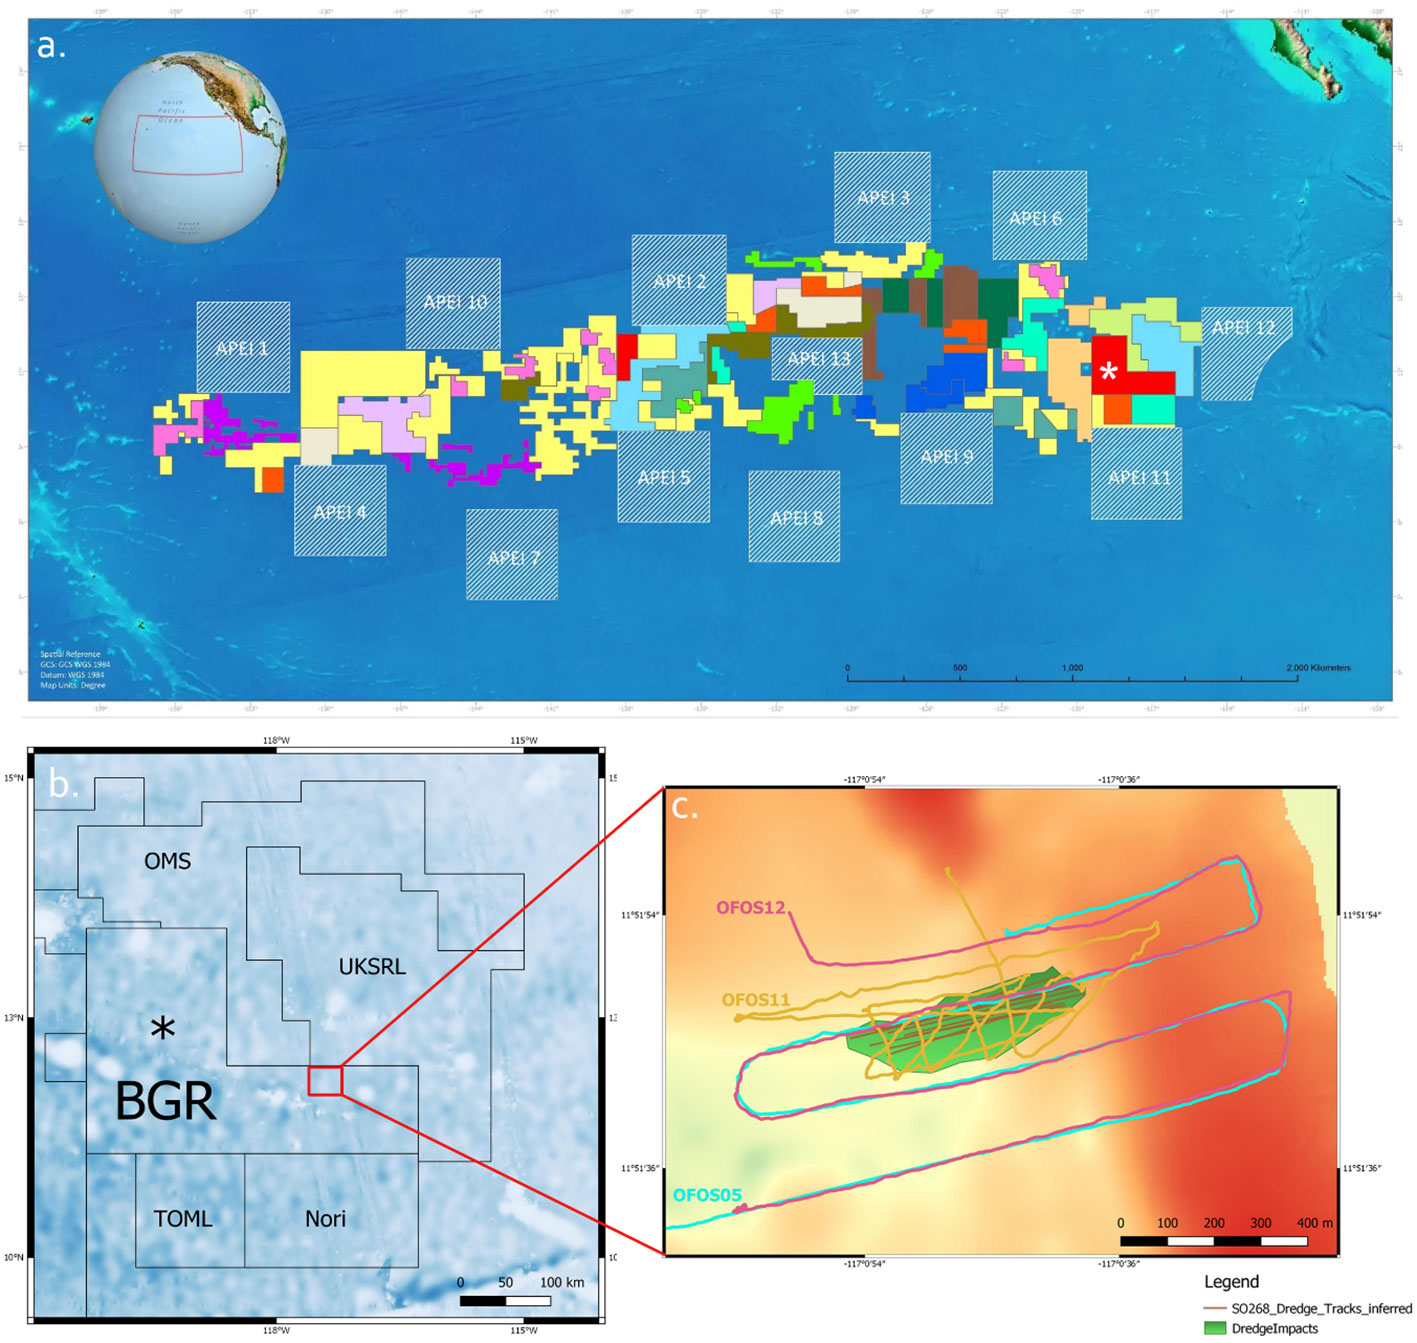
Figure 1 (A) Clarion-Clipperton Fracture zone and the exploration and reserved areas from the International Seabed Authority (ISA) (May 2023). BGR area is indicated with *. (B) Localisation of work area (red square) within the BGR license area of the eastern CCZ and (C) Dredge experiment tracks with the shape of the impacted area (green) and the OFOS transects before (SO268/2_100-1 - OFOS05) and after (SO268/2_160-1 - OFOS11) and (SO268/2_164-1 - OFOS12) the dredge disturbance.
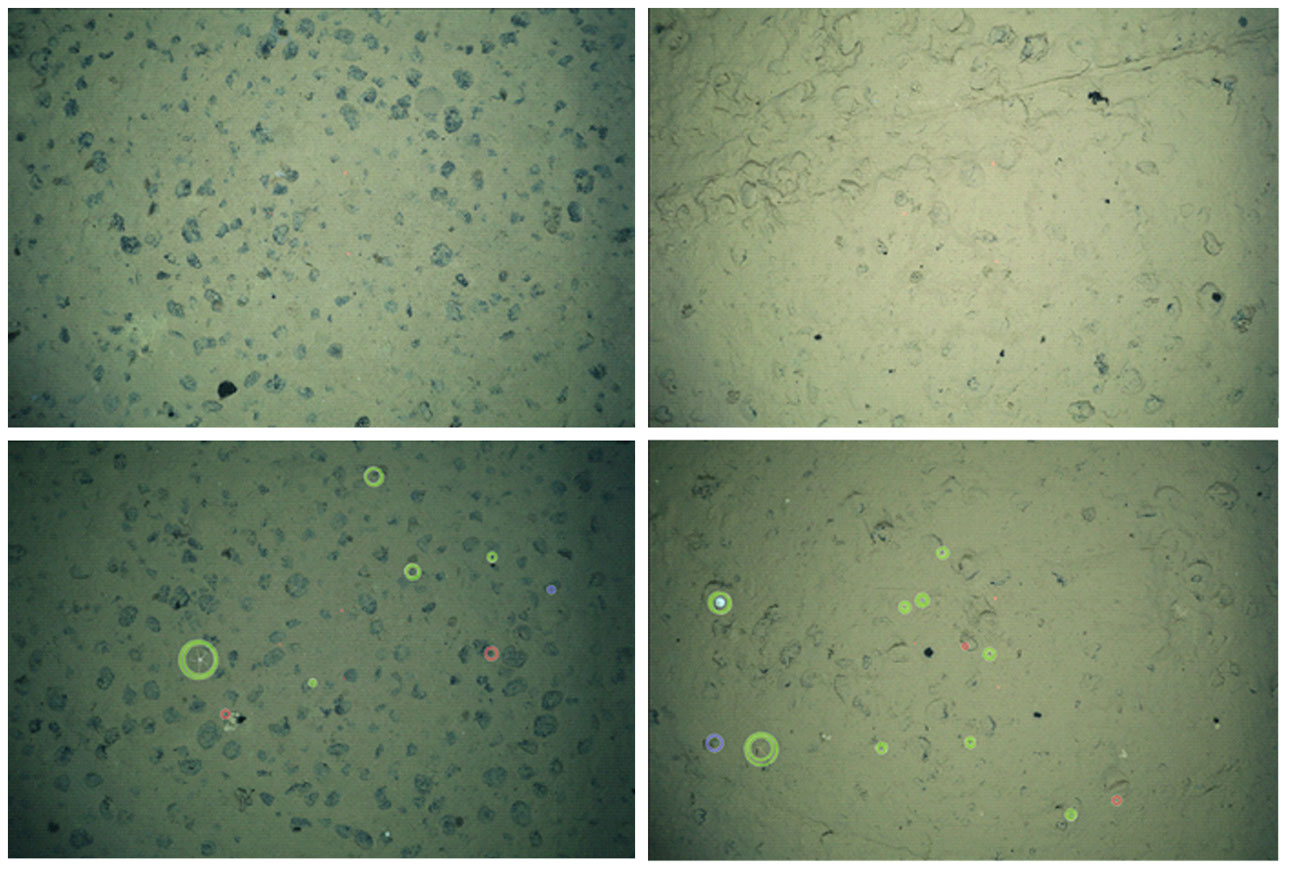
Figure 2 The dataset contained images from before and after the dredge experiments; the left panel shows an undisturbed view of a nodule field and its fauna as automatically detected by MAIA (lower panel), while the right panel shows clear disturbance patterns from the dredge experiment (a dredge track) and the sediment (re)deposition. For interpretation of colour codes used, see Figure 4.
2.2 Data collection
In this study, we used the data collected during the three different dives mentioned above (see Table 1 for an overview). One dataset is referred to as image dataset S (source data) (1813 images, from two transects (SO268/2_160-1 - OFOS11) and (SO268/2_164-1 - OFOS12)) and the second dataset is referred to as T (target data) (343 images from dive (SO268/2_100-1 - OFOS05)). The average visual area of the images in the dataset T is 7.1 m². The S dataset was collected in a lower distance to the ground, showing a visual area of average size 6.2 m² and was used in training for automated analysis of dataset T. Image annotation, i.e. location of fauna and taxonomic assignment, was carried out using BIIGLE. Example images from undisturbed and dredged regions are shown in Figure 2 to illustrate the impact of the dredging.
Table 1 Origin and details about the two image transect datasets T and S used in this study.
Dataset S was annotated by four different expert users and the smaller dataset T by one expert user. Fauna was annotated at a higher taxonomic level, mostly Classes, e.g. Ophiuroidea, Crinoidea, Holothuroidea, Alcyonacea, some Families (e.g. Deimatidae (Holothuroidea), Isididae (Alcyonacea)) and some with regard to their ecology (e.g. free-living ophiuroids, stalked Porifera) (Figure 3). The same faunal taxon catalogue was used containing in situ photographic examples from the CCZ of the taxa to annotate. The full list of semantic labels used for annotating both datasets S and T can be found in the Supplementary Table 1. In dataset S, a number of 67 different labels were attributed and 57 labels in dataset T (see Supplementary Mataterial Table 1). The most abundant higher taxonomic groups/classes (>600 annotations per group) were used to perform follow-up MAIA experiments (Figure 3, Table 2). Holothuroidea with <100 annotations were included for comparison purposes. Selected classes comprised Ophiuroidea, Alcyonacea, Actiniaria/Corallimorpharia, Bryozoa and Holothuroidea. Abundances of both datasets are given in Table 2. Grouped annotations for Porifera were, despite their high abundances, not included here due to high intra-class/intra-phylum variation (Figure 3).
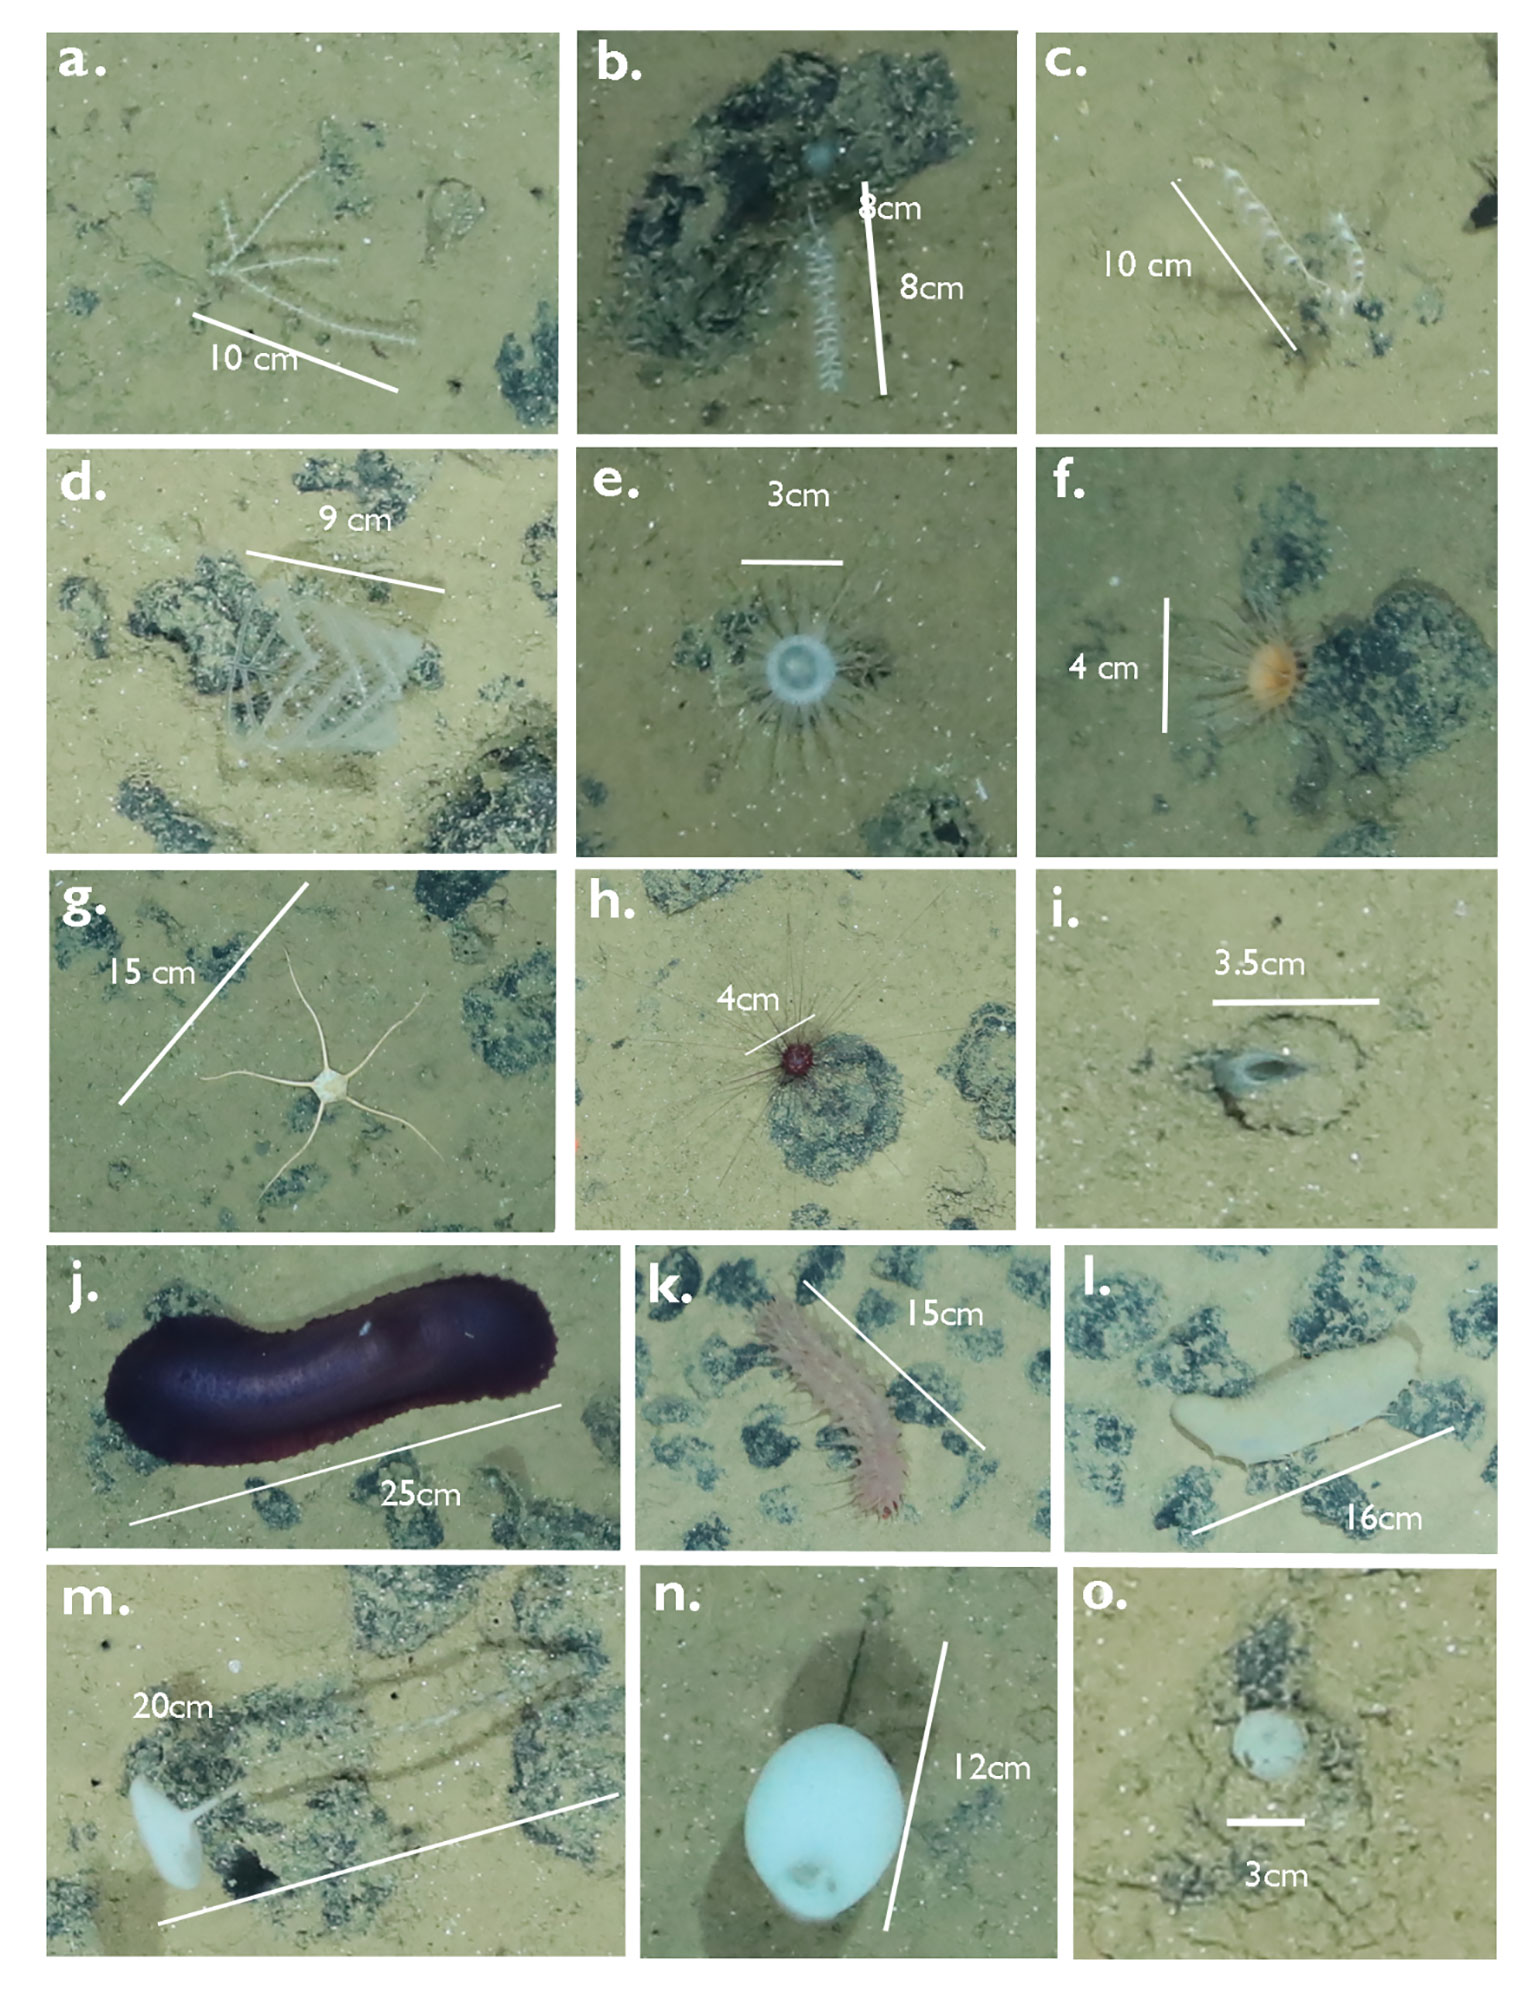
Figure 3 Taxa from the BGR license area (images taken during SO268) in the CCZ, demonstrating different taxa and morphological variability. Scales were added for size reference. (A–C): Alcyonacea (Anthozoa, Cnidaria), (D) Antipatharia (Anthozoa, Cnidaria) and (E, F) Actiniaria (Anthozoa, Cnidaria). (G) Ophiuroidea (Echinodermata) and (H, I) Echinoidea (Echinodermata), (J–L) Holothuroidea (Echinodermata), (M, N) stalked Hexactinellida (Porifera) and (O) a non-stalked Porifera.
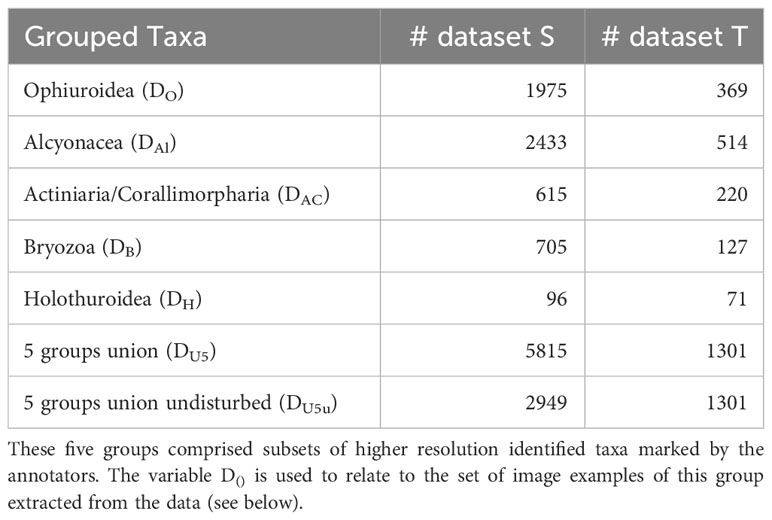
Table 2 The five taxonomic groups selected from the list of all taxa and categories (67 in dataset S and 57 in dataset T).
2.3 MAIA
The MAIA system is designed as a multi-step process that aims to combine the visual experience of domain expert users and machine learning–based computer vision in an efficient way inside the BIIGLE system. One objective in the development was to lower the barrier for machine learning–based marine image analysis for users without a computer science background.
The MAIA system is described in brief here and for a more detailed explanation we refer to the original publications (Zurowietz et al., 2018; Zurowietz and Nattkemper, 2020). MAIA in BIIGLE offers a way to use existing annotations as training data for the machine learning algorithm, skipping some of the steps described in the original publications. The training data is used to train the deep neural network Faster R-CNN (Ren et al., 2015) with pre-trained weights of the COCO dataset, which is then employed for detecting objects of interest in the full image dataset. In the final step of MAIA, the detected objects, referred to as annotation candidates, are presented to the user for rapid manual classification in the LARGO grid view of BIIGLE. Here, the users select and assign labels to image patches showing objects of interest. As the detection task is driven by the selection of the training data, the process is adaptive to different marine image annotation tasks and can reduce the amount of time spent for image object annotation (Zurowietz et al., 2018). Other approaches similar to MAIA have been proposed by other groups such as Yamada et al. (2023) or the CoralNet system (Couch et al., 2019; Chen et al., 2021), however, those were not aiming for detection and classification in deep sea benthic communities for biodiversity assessment. In this study, MAIA was used in two different set-ups by selecting different training data. In the first set-up, MAIA was used to detect any kind of object on the ground, which is referred to as general object detection. This is especially relevant for biodiversity baseline studies, when the researchers must conduct a primary census of the species biodiversity and richness. Here, MAIA was trained with the annotation data from dataset S, referred to as D67 (i.e. the dataset including 67 taxa). In the second set-up, MAIA was used to detect five taxonomic groups Ophiuroidea, Alcyonacea, Actiniaria/Corallimorpharia, Bryozoa and Holothuroidea individually. To this end, MAIA was trained with the data from each group in five separate runs. The five individual training datasets were referred to as DO, DAl, DAC, DB and DH (with O = Ophiuroidea, Al = Alcyonacea etc., see Table 2). These experiments addressed the hypothetical case of specific interest in one particular group of organisms with potential indicator value. In addition, MAIA was applied to detecting the union of all five groups, referred to as “5 groups union” or DU5. Subsequently, DU5 was filtered for images showing the undisturbed (i.e. non-dredged, see Figure 2) seafloor and this subset, referred to as “5 groups union undisturbed” or DU5u, was used for training to test whether undisturbed images of this subset were better suited for training than the disturbed ones. Based on the results of these two set-ups, we discuss MAIA’s performance in the context of mining-related environmental monitoring.
Since the annotation of training data is an expensive (human resources and time) and tedious procedure, the question of how much MAIA’s performance benefits from increasing amounts of training data was addressed. To study the impact of this factor, we conducted experiments with differently-sized subsets of the training data, i.e. using only 10, 50 100, … training samples. The effects of these limitations to the training data are shown in the next section. and compared the results.
3 Results
The performance of MAIA in the different set-ups using multiple sets of training data (as described above) was measured counting True Positive detections (TP), False Positives (FP) and False Negatives (FN) using the standard receiver operator characteristics:
recall = TP/(TP + FN) and precision = TP/(TP + FP).
True Positives were the detections that matched the annotations (match or found), while False Negatives were the annotations missed by the automated detection tool (miss) (Figure 4). For the general object detection in the first set-up, MAIA was trained with dataset D67 from image collection S and applied for general object detection in image collection T. The results from this experiment are shown in the first row of Table 3. Some of the false negative-cases looked rather similar to the true positive-cases, but nonetheless were occasionally overlooked (Figure 4). For the false positive cases, i.e. those that were not manually annotated previously but were detected by the algorithm, often these were either Lebensspuren (past-imprints of organisms’ presence), unidentifiable objects (often unclear if it is an organism or not), organisms which may be dead, or organisms that previously escaped our attention due to any of the above similarities. We report a recall of 90.1% and 13.4% precision for the described experiment, meaning that 90.1% of the manually annotated organisms were also detected by MAIA. The precision shows the percentage of automatically detected objects that were also detected manually. This implies a false positive rate of 86.6% in the general object detection. Indeed, many potentially interesting objects were detected by MAIA, but were considered less relevant by the human annotators since these were mostly non-biological features (e.g. nodules) or non-identifiable objects.
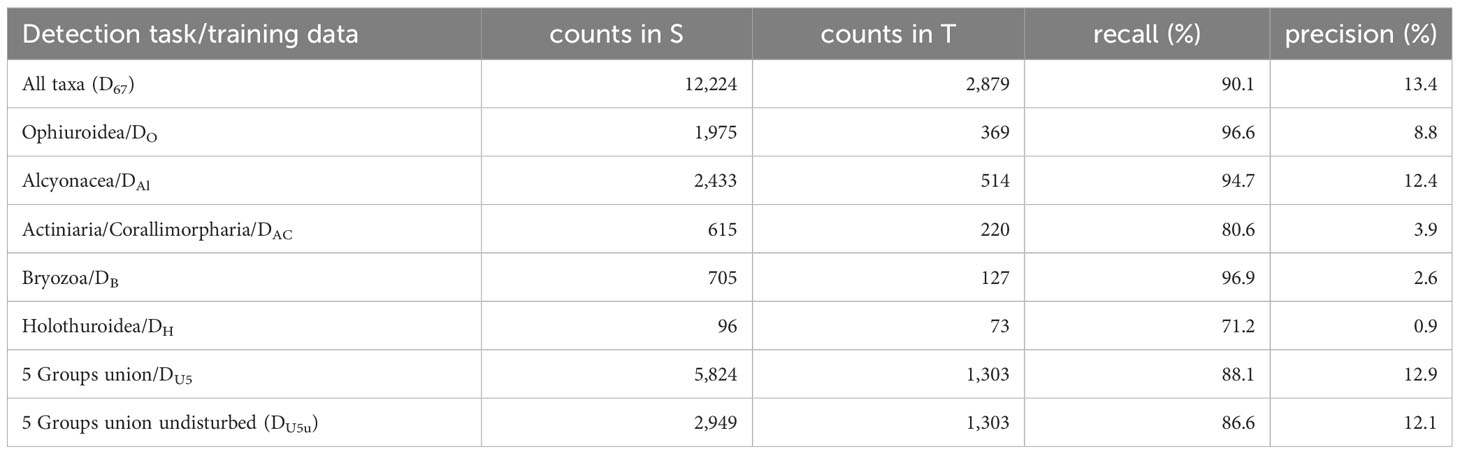
Table 3 The recall and precision values are presented for the general object detection (“All taxa”), the individual MAIA runs for detecting particular groups (second to sixth row), the general object detection trained only the union of the five groups (“All 5 groups”) and the training with the union of the five groups excluding images with disturbed sea floor (“All 5 Groups undisturbed”).
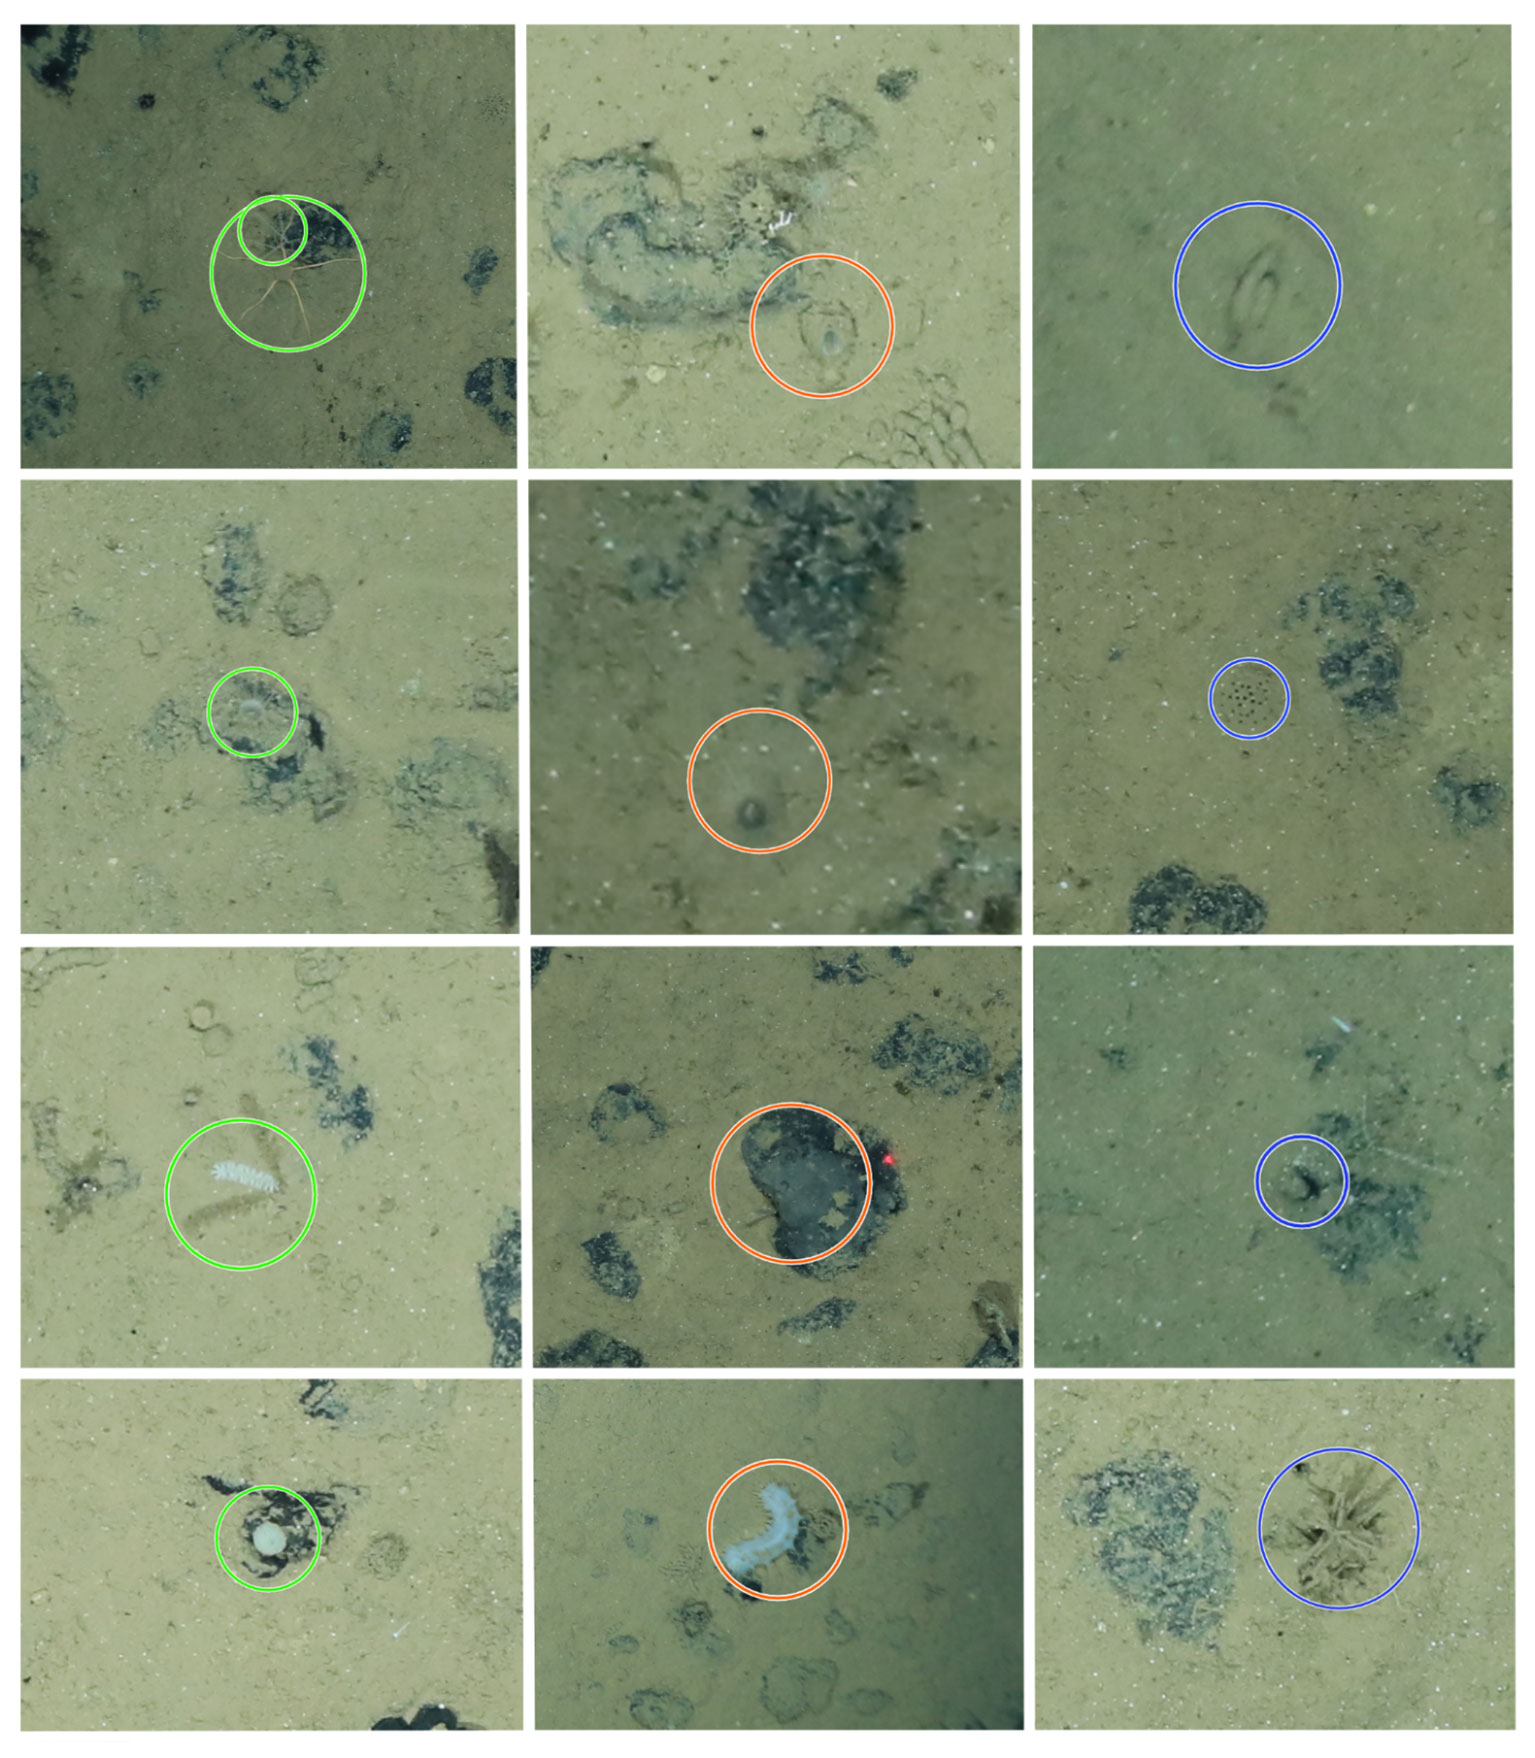
Figure 4 Images of correctly found organisms (True Positives, green, left column), missed ones (False Negatives, orange, center column) and newly detected ones (False Positives, blue, right column). Left column from top to bottom feature: Ophiuroidea + Alcyonacea (Primnoidea) (Figures 3A, G), Actiniaria/Corralimorpharia, Alcyonacea (Isididae), (possibly stalked) Porifera. Middle column, from top to bottom feature: Echinoidea (Irregularia) (Figure 3I), Actiniaria/Corallimorpharia, encrusting Porifera and Holothuroidea (Synallactidae). Right column from top to bottom feature objects that could be organisms or dead organisms, or Lebenspuren, reason why they were not manually annotated to begin with: Lebensspuren (Holothuroidea feacal casts) or Holothuroidea, Paleodictyon nodosum pattern (unknown if it is a Lebensspuren burrow, organism in burrow or a trace fossil (Rona et al., 2009), unknown, carnivorous Porifera (Cladorhizidae) - unclear if the organism is alive or dead due to brown colour.
Next, we analysed the recall of MAIA for each of the 57 label classes in T in this general object detection set-up. For each class, TP and FN were determined by matching the positions of the object detection with their positions as previously annotated by an expert user. In the context of MAIA, all annotations weare circles and we defined two annotations to be matching if the Euclidean distance between the center points is less than the greater radius (also taking conflicting matches into account, for details see (Zurowietz, 2022). As a general object detection was performed without classification, FP cannot be determined for single Classes. Using these counts of TP and FN, the recall for each Class was computed and the results were shown in Figure 5 on the right. 38 out of 57 labels were detected with a recall > 85% and 16 out of 57 had a perfect recall of 100%. The three most difficult categories with a recall below 40% were “Fossil”, “Jellyfish”, “Pennatulacea” and “Holothuroidea”. These categories were represented with relative low numbers in the training data, i.e. 1 (Fossil), 1 (Jellyfish), 5 (Pennatulacea) or 5 (Holothuroidea) but many other label classes with lower observations in the training set S were observed with much higher recall values in T (see Figure 5), e.g Actinopterygii (2 training samples/100% recall) or Ophiuroidea (19 training samples/95% recall). In general, we did not observe a clear relationship between the number of training samples of a class and the MAIA performance for the same class in this general object detection set-up. Some results were surprising, as some of the top missed label classes consisted of larger organisms that are easily detected with the human eye. For example, Holothuroidea, which are generally recognisable because of their size, shape and colours (Figures 3J–L), had on average a low recall (54%), and were not easily picked up by the algorithm. Other echinoderms performed rather well (Figure 5): Echinoidea at 86% with Infraclass Irregularia (Figure 3I) at 96% recall and, from another Echinoidea Infraclass, the Family Aspidodiadematidae at 100% (Figure 3H); Ophiuroidea attained a 95% recall. Alcyonacea soft coral families were also well detected: Isididae (Figure 3B), Taiaroidea, both at 100% recall, Primnoidea 97% recall (Figures 3A, C) and other Alcyonacea 96% recall. Other Anthozoa classes, such as Antipatharia had a 83% recall (Figure 3D) and Actiniaria (e.g. Figures 3E, F), a very abundant and diverse taxon, had a 86% recall. Overall, Porifera were well detected, with the non-stalked (Figure 3O) reaching 88% and stalked sponges at 96% (Figures 3M, N) and other (not clear if stalked or not) Porifera at 94%.
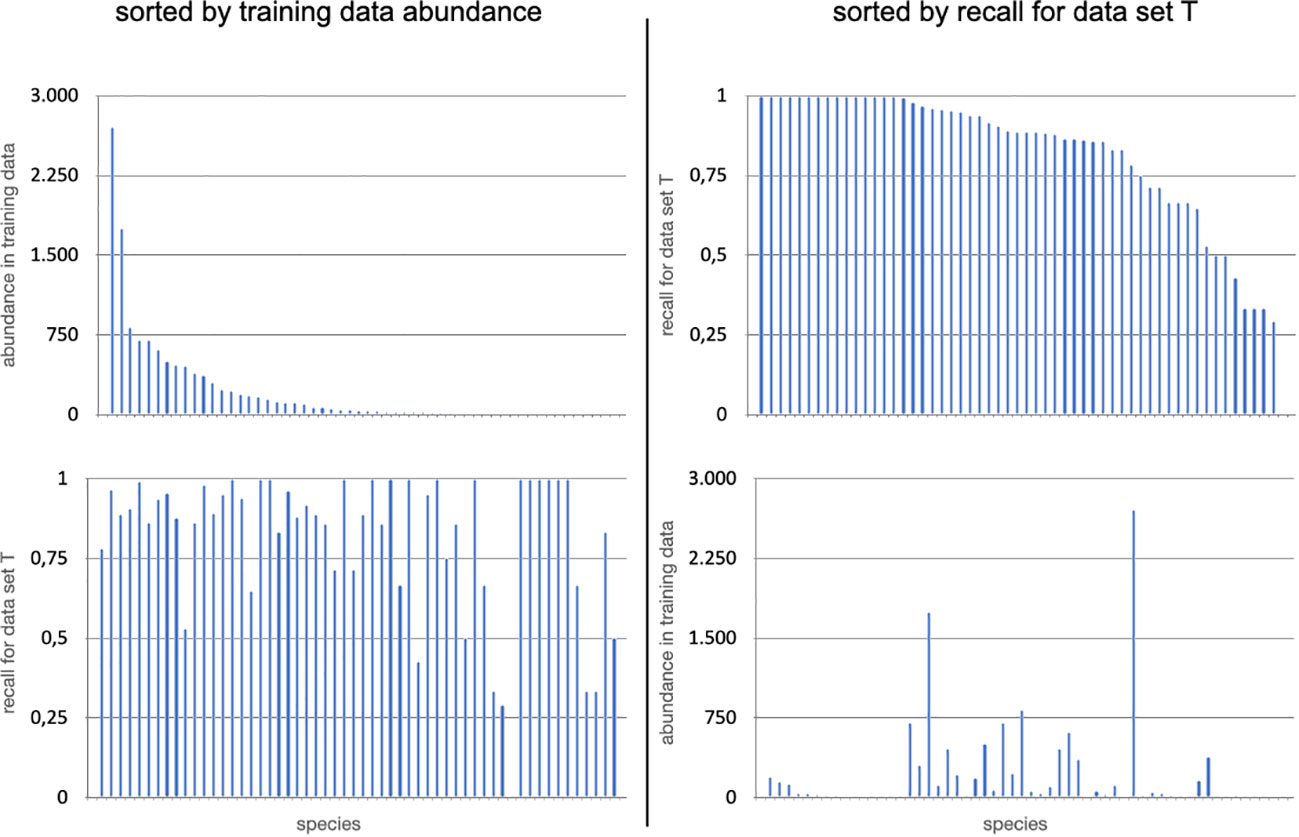
Figure 5 On the top left, the abundances for all 57 classes annotated in image dataset T by the experts are shown in decreasing order according to their annotation abundances in the dataset D67 from dataset S. On the bottom left, the corresponding recall values computed for results obtained in dataset T are shown for the plot below in the same order. On the top right, the result recall values of the MAIA object detection are shown for all classes in decreasing order. In the bottom right plot the corresponding abundances in the expert annotations in the training dataset D67 are shown.
In the second set-up, we investigated if the performance of MAIA increases when the system is applied to only a single group of taxa. To acquire a more specific model, MAIA was applied to Ophiuroidea, Alcyonacea, Actiniaria/Corallimorpharia, Bryozoa and Holothuroidea with the related training datasets DO, DAl, etc. and the performance was evaluated with recall and precision (see Table 3). The recall for the groups were compared to the results in the general object detection set-up trained with D67. To this end, the macro-average recall for each group was computed (see Supplementary Table 2). The term macro-average recall refers to the average recall which is not computed as the average recall over all individual samples but over the class-specific averages. So label classes with smaller numbers of observations are considered on the same level than classes with larger numbers of observations.
In each of the five runs, no significant increase in performance was observed. Instead, each increase in recall was traded for a significant decrease of precision (see Table 3). When comparing the performances with the first set-up for general object detection (see first row in Table 3 and Supplementary Table 2), we observed that Ophiuroidea, Alcyonacea and Holothuroidea were detected with higher recall but a lower precision (compared to the general object detection D67). Holothurians were detected with a low 54% recall in the general object detection when MAIA was trained with D67 and 71.2% (with a very low precision) when MAIA was trained with DH. Similarly, Bryozoans were detected with 91% recall in the general object detection and 96.9% in the group specific MAIA application. In contrast to that, the recalls for Alcyonacea and Actiniaria/Corallimorpharia decreased from 98% to 94% and 86% to 80%, respectively, compared to the general object detection (see Supplementary Table 2). When MAIA was trained with DU5, for the detection of all five taxonomic groups we observed 88.1% recall and 12.9% precision, so again results similar to the training with D67. No improvement for training with data DU5u which was filtered for undisturbed regions was found, with a 86.6% recall and 12.1% precision for this training data.
Finally, we investigated MAIA’s performance (recall and precision) for incrementally growing volumes of training data in all set-ups (Figure 6). In case of learning a general object detection using the complete dataset D67 of all taxa, MAIA reaches the best performance with 8,000 or more training samples but does not benefit from further increase in samples (see top left in Figure 6). The precision stays rather stable, slightly above 10% for all training datasets with 500 or more training samples and does not improve for increasing numbers of samples. Similar results occur when MAIA is again trained for general object detection, but with the data from the union of the five taxonomic groups (DU5) and the subset featuring undisturbed images (DU5u) (result plots are shown in Supplementary Figure 1).

Figure 6 MAIA was trained with different data volumes generated as subsets of different sizes from the three datasets D67, DO, DAl, DAC, DB and DH. The orange lines display the precision, the blue lines display the recall. The dotted lines mark the 80% recall and 10% precision as a reference. X-axis=number of annotations, Y-axis=%.
When MAIA is trained for the individual groups, we observe slightly different trends for increasing numbers of training samples in Figure 6. The Ophiuroidea group performance increases until 200–500 annotations, similar to the Bryozoa and the Alcyonacea that show an increase until 500 annotations and then the learning does not improve with more data. The Actiniaria/Corallimorpharia group seem to reach their peak performance quite early, after 200 training samples. Interestingly, we observe a small drop down of MAIA’s performance for 50 samples which could be explained by overfitting problems, i.e. the network adapts too much to the low amount of training data and shows low generalization performance.
The trained MAIA system was evaluated to perform with an average annotation time of 111 s/image. For comparison, a traditional purely manual annotation on a subset of 35 images from our data with identification to a comparable taxonomic level as wielded by MAIA, took between 94 and 172 s/image when annotated by a highly trained observer. The discrepancy between minimum and maximum time was related to the changing abundances of faunal organisms per image which is clear by the high standard deviation (an average of 123 ± 30 s/image). There is a significant positive relationship between the time spent annotating an image and the faunal abundance observed (r=0.91, p<0.001) as well as the richness (r=0.78, p<0.05).
4 Discussion
The vastness of the seafloor areas of interest to deep-sea mining is huge with the CCZ alone spanning 6 million km2. A recent checklist for the CCZ region, comprising all size fractions, included 28% megafauna species and showed that over 88% of species sampled in the CCZ region are undescribed (Rabone et al., 2023). While megafauna species are most easily observed based on imagery due to their larger size (>1 cm), they are also the least abundant species and are rarely collected (Rabone et al., 2023). As such, rare taxa (≤3 records) represented one third of the total morphospecies richness in APEI6 (Simon-Lledó et al., 2019b). The recent publication of a morphospecies catalogue for the larger CCZ region shows the difficulties in attributing species names to the megafauna observed (Simon-Lledó et al., 2023b).
In order to allow for quantifiable organism detection and identification, images need to be collected at an optimal altitude ~1.5 m above the seafloor, which limits the area covered by a single image acquisition (Schoening et al., 2020). With 5–10 m2 footprints each, tens of millions of images are necessary to cover a potential yearly mining area (200–400 km2/year) (Sharma, 2017; Smith et al., 2020), which is unworkable. Recent studies have shown that estimations of megafauna species richness need at least sample units covering 1000–1500 m2 when more than 500 individuals are present to stabilise, i.e. to approach the real species richness, with significantly higher richness detectable in samples >1000 m2 (Simon-Lledó et al., 2019b, 2020). Due to high spatial variation observed across the CCZ (Vanreusel et al., 2016; Simon-Lledó et al., 2019b; Cuvelier et al., 2020; Uhlenkott et al., 2023; Simon-Lledó et al., 2023a), replicates remain indispensable, thus adding up to several thousands of images that remain to be analysed to estimate representative biodiversity. Within this context, the usefulness of the MAIA machine learning tool as a detection system can be extremely valuable and is hereby assessed.
Recently, many studies have applied automated workflows and deep-learning techniques to deep sea data and discussed their performances, e.g. (semi-)automated nodule segmentations (Schoening et al., 2016; Peukert et al., 2018; Dumke et al., 2018; Gazis et al., 2018; Gazis and Greinert, 2021) and the classification of nodule associated fauna (Mbani et al., 2023). Our study is the first to address practicality and applicability of computational species detection in assessing biodiversity in mining-related monitoring scenarios. Most related works on machine learning-based underwater biodiversity assessment focus more on the classification of hand selected image patches, which is of course very relevant (Piechaud et al., 2019; Durden et al., 2021). Nevertheless, given the fact that many (rare) species in the images will not be represented in a training data set, the computational general detection of fauna without a detailed taxonomic classification is pertinent and valuable as it would make the time-consuming and error-prone visual screening of the entire images obsolete. This process could be replaced by a much more efficient browsing of image patches (selected by a general object detection) and their manual classification to taxonomic categories. We believe that ongoing contributions aiming at detection or classification of underwater taxa will finally provide the basis for the development of efficient full- or semi-automatic workflows customised to special scientific contexts. As MAIA is already available to more than 3,000 registered BIIGLE users (on biigle.de), this study gives some insights into the potentials and limitations of machine learning–assisted annotation in deep-sea monitoring.
4.1 Quality assessment
MAIA achieves high recall values when carrying out the general species detection, i.e. detecting any kind of fauna, and as such assessing the overall faunal abundance. While there is still no consensus on what is an acceptable error rate in ecology (Piechaud et al., 2019), we can state that our general species detection happens with satisfactory accuracy (> 90% for all taxa). When increasing the number of training samples, the precision slightly improves (reaching 13.4% with final result obtained using all data). So theoretically, further improvement can be envisioned when adding more image annotation data. Looking at the current trends in machine learning–based computer vision, it seems likely that new strategies such as self-supervised learning methods can make use of huge numbers of non-labelled marine image data for learning purposes in this context. As a consequence, one may conclude that, in our particular ecological context, all underwater and marine image data from the CCZ should be combined in order to provide the best possible training database to develop AI models. A successful combination of data would depend on the application of standards in labeling, metadata and platform (e.g. ROV, AUV) operation protocols.
In general, our levels of recall, sometimes also referred to as accuracy or sensitivity, are comparable to or higher than numbers reported in other studies attempting to automatically detect and classify deep-sea megafauna (Schoening et al., 2012). The precision is a measure for the (mis-)match between automated and manual annotation location and is thus a measure for the False Positives. Our low precision levels can be attributed to the fact that the nodule fields analysed here feature an irregular background pattern due to the differences in soft sediment and hard substrates (nodules), their contrasts, textures and colours. Additionally, the high numbers of rare morphotypes can cause increased False Positives in the more common morphotypes, due to the increased variation, which is thus reflected by a lower precision. However, we observed that within these False Positives, MAIA also finds potentially interesting objects and patterns, including environmental features (e.g. nodules, Lebensspuren) or organisms that were previously left unlabelled because of human doubts or identification issues. In this perspective, MAIA can be used as a re-evaluation tool to narrow down object identification and include additional detections in a morphospecies catalogue.
The comparison of MAIA trained with different training data sets shows that the best recall values are obtained with the largest number of training data. But the performance gain for including more training data diminishes after a certain amount. Interestingly, the MAIA precision for the single taxonomic groups (DAl, DO, etc.) is lower when trained with this special training data than for the general object detection. So the detection of taxonomic subsets or groups benefits from the additional training data even if these data points represent other species and morphologies. This observation further supports the necessity to collect or compile as much data as possible, beyond individual license areas and operators (academia and contractors). In contrast to observations reported by Piechaud et al. (2019), we cannot confirm that the performance generally increases for selected smaller subset of classes.
Large differences in morphological shapes of organisms, as observed here for e.g. Echinoidea and Porifera, remain one of the biggest challenges in automated species identification (Wäldchen et al., 2018). Similarly, and rather surprisingly, because easily detected by the human eye, was the low detection rate for Holothuroidea (<90%). While traditionally hard to identify to species level based on imagery alone, sea cucumbers are generally easily recognisable, occurring in many shapes, sizes and colours and, except for several morphospecies, are rarely inconspicuous. One way to address this in the future is the implementation of feedback loops to prompt users to add additional training samples for particular less represented classes. The challenge for machine learning tools here lies in grouping the considerable differences in morphology, shape, some more sediment-coloured and others brightly coloured. Beside the inter-species morphological differences, intraspecific changes in morphology exist for Porifera and Cnidaria, which show contractile/expansive behaviour when feeding or reacting to stimuli such as tides, pressure and respiration (Kahn et al., 2020). Individual animal modeled forms with morphometric indices could enhance correct classifications (e.g Aguzzi et al., 2011), but represent a disproportionate amount of work in a species rich environment with many rare organisms. Additionally, the performance of these models is still limited by habitat variations and are thus less applicable in a complex and textured, irregular habitat.
The MAIA algorithm appeared to learn quickly for Alcyonacea and Ophiuroidea detections, which might be due to the repetitive patterns of polyp organisation in the former and symmetrical patterns for the latter. Additionally, Alcyonacea are most often whitish in colour which gives an enhanced contrast when compared to the substrate background.
This study also provides a first look into the effect of sediment coverage on the network performance. After removing the sediment-impacted images from the training data, we surprisingly did not see a strong effect on the network performance except a small decrease in classification accuracy which may be explained by a lower number of training data (S).
4.2 Efficiency
The time needed by a highly trained observer to manually annotate a subset of images in BIIGLE was significantly correlated with the abundance of fauna as well as with the richness. While the average manual annotation speed - when restricted to a higher taxonomic level (Class or Family) - was not significantly slower than automated MAIA detections, observer errors and lapses in concentration must be taken into account. Increasing taxonomic resolution, i.e. identification to (morpho-)species level, besides implying a different level of accuracy and difficulty for the annotator, increases taxon richness and thus time necessary for manual annotation of each image. Similarly, if a lesser trained observer would perform the same task of manual annotation, time spent per image will increase significantly. For comparison, in Zurowietz and Nattkemper (2021) a median gap between two consecutive annotations from one user was reported to be 40.3 seconds according to the records in the entire BIIGLE database. To date, this number is updated to 45.0 seconds, based on the most recent BIIGLE database (11.2 million image annotations as of November 2023). As the average number of annotations for the images in data set T is 8.39, we estimate the predicted annotation time per image to be 378 s/image for an average skilled user. To further decrease the required time, one can a) find ways to further reduce the number of false positives (for instance by improving the image quality) or b) improve the MAIA filtering interface for the users by grouping image patches into clusters of similar morphology, so users can correct or delete image patches in chunks. The annotation time of 123 ± 30 s/image measured in this study falls considerably below the above estimated average annotation time that we have computed from the BIIGLE database. One reason for this considerable difference may be the advanced skill level of the annotators having collaborative experience for working in the area. Another reason could be that the images may show less objects of interest with a higher foreground-background contrast than the average marine image in the BIIGLE database.
4.3 Human factor
Based on the results presented here, we want to highlight the advantages of using an automated detection tool, but with the emphasis that a human factor is indispensable to guide and correct the machine learning tools. Often, computer vision algorithms must be designed specifically to detect and classify particular targets against different background types (Purser et al., 2009; Aguzzi et al., 2011). Here, we show that for global baseline assessments, MAIA can be used efficiently to quantify overall faunal abundance and assist in assessing the diversity of organisms. In current times, where data is accumulating faster than the processing power or human resources of many research institutions, computational solutions and machine learning tools can prove elemental for effective data exploitation (Matabos et al., 2017). Accessible automated tools, as those described here, can accelerate time-consuming image analyses and can be used to even the playing field in attributing technical and human capacity to deep-sea research, exploration and monitoring, which is one of the main causes of inequity among institutes and countries (Bell et al., 2023).
Additional human intervention in the design and subsequent quality control is still required to obtain representative ecological metrics as well as to program or adjust the settings of the imagery collecting platform (e.g. importance of altitude in concept drift: (Langenkämper et al., 2020; Schoening et al., 2020)). Regarding imagery annotations, training is crucial both for scientists as well as machine learning tools. Training of deep-sea scientists in recognising and identifying taxa based on imagery and a posteriori attribution of morphospecies labels after automated classification in higher taxonomic groups is an important way forward. Initiatives such as SMarTar-ID (Howell et al., 2020) and open access megafauna atlases (Simon-Lledó et al., 2023b) are therefore indispensable for standardization, uniformisation and learning. A hybrid computer-vision/human approach appears to combine the best of both worlds.
5 Conclusion
In light of the above discussion, we conclude that the annotation of large marine image collections from environmental impact monitoring can be supported by not only deep learning–based taxonomic classification but also by deep learning–based object detection. The free available web tool MAIA in BIIGLE delivers promising results with sufficient recall with a small speed-up compared to a manual annotation by a highly trained expert. For less-experienced users, the speed-up is more significant as well as a gain in usability and consistency. Future research has to address speed up in post processing (i.e. filtering false positives) and increasing precision in object detection in order to further increase the efficiency and effectiveness in this approach.
Data availability statement
The datasets presented in this study can be found in online repositories. The names of the repository/repositories and accession number(s) can be found below: Annotated imagery data for this study are available in BIIGLE can be accessed upon request, as well as the generated datasets used in Figures 5 and 6. Seafloor images are available in PANGAEA: (Purser et al., 2021a; Purser et al., 2021b; Purser et al., 2021c). Seafloor images of undisturbed and disturbed polymetallic nodule province seafloor collected during RV SONNE expeditions SO268/1 + 2. PANGAEA, https://doi.org/10.1594/PANGAEA.935856.
Author contributions
DC: Conceptualization, Formal analysis, Investigation, Methodology, Visualization, Writing – original draft, Writing – review & editing. MZ: Conceptualization, Formal analysis, Investigation, Methodology, Visualization, Writing – original draft, Writing – review & editing. TN: Conceptualization, Formal analysis, Investigation, Methodology, Visualization, Writing – original draft, Writing – review & editing.
Funding
The author(s) declare financial support was received for the research, authorship, and/or publication of this article. This work was developed with funding through the projects MiningImpact (grant no. 03F0707A-G, 03F0812C) by the German Federal Ministry of Education and Research (BMBF), Mining2/0002/2017 and Mining2/0005/2017, granted by FCT/MCTES and Direção-Geral de Politica do Mar (DGPM) through the Joint Programming Initiative Healthy and Productive Seas and Oceans (JPIO). DC was co-financed by the Operational Program AZORES 2020, through the Fund 01-0145-FEDER-000140 “MarAZ Researchers: Consolidate a body of researchers in Marine Sciences in the Azores” of the European Union. MZ was supported by the German Research Foundation DFG under the grant agreement number 442032008 (NFDI4Biodiversity). This work received national funds through the FCT -Foundation for Science and Technology, I.P., under the project UIDB/05634/2020 and UIDP/05634/2020 and through the Regional Government of the Azores through the initiative to support the Research Centres of the University of the Azores and through the project M1.1.A/REEQ.CIENTÍFICO UI&D/2021/010. This work was supported by the BMBF-funded de.NBI Cloud within the German Network for Bioinformatics Infrastructure (de.NBI) (031A537B, 031A533A, 031A538A, 031A533B, 031A535A, 031A537C, 031A534A, 031A532B).
Acknowledgments
We would like to thank the crew of RV Sonne, the scientific crew and chief scientists (Matthias Haeckel and Peter Linke) of SO268 and Yasemin Bodur as responsible for the OFOS on-board. We thank the additional image annotators from the S dataset (in alphabetical order): Lilian Boeringher, Sofia Ramalho and Tanja Stratmann. We acknowledge the financial support of the German Research Foundation (DFG) and the Open Access Publication Fund of Bielefeld University for the article processing charge.
Conflict of interest
The authors declare that the research was conducted in the absence of any commercial or financial relationships that could be construed as a potential conflict of interest.
The author(s) declared that they were an editorial board member of Frontiers, at the time of submission. This had no impact on the peer review process and the final decision.
Publisher’s note
All claims expressed in this article are solely those of the authors and do not necessarily represent those of their affiliated organizations, or those of the publisher, the editors and the reviewers. Any product that may be evaluated in this article, or claim that may be made by its manufacturer, is not guaranteed or endorsed by the publisher.
Supplementary material
The Supplementary Material for this article can be found online at: https://www.frontiersin.org/articles/10.3389/fmars.2024.1366078/full#supplementary-material
Supplementary Table 1 | label tree for fauna annotations. Labels exclusively occurring in datasets S or T are marked as such.
Supplementary Table 2 | macro-average recall for taxon groups in for the general object detection.
Supplementary Figure 1 | MAIA was trained with different data volumes generated as subsets of different sizes from the three data sets D67, DU5 and DU5u. The red lines display the precision, the blue lines display the recall. The dotted lines mark the 80% recall and 10% precision, which might be considered a minimum performance necessary for an automatic system.
References
Aguzzi J., Costa C., Robert K., Matabos M., Antonucci F., Juniper S. K., et al. (2011). Automated image analysis for the detection of benthic crustaceans and bacterial mat coverage using the VENUS undersea cabled network. Sensors (Basel Switzerland) 11, 10534–10556. doi: 10.3390/s111110534
Amon D. J., Ziegler A. F., Dahlgren T. G., Glover A. G., Goineau A., Gooday A. J., et al. (2016). Insights into the abundance and diversity of abyssal megafauna in a polymetallic-nodule region in the eastern Clarion-Clipperton Zone. Sci. Rep.-UK 6, 30492. doi: 10.1038/srep30492
Bell K. L. C., Quinzin M. C., Amon D., Poulton S., Hope A., Sarti O., et al. (2023). Exposing inequities in deep-sea exploration and research: results of the 2022 Global Deep-Sea Capacity Assessment. Front. Mar. Sci. 10. doi: 10.3389/fmars.2023.1217227
Chen Q., Beijbom O., Chan S., Bouwmeester J., Kriegman D. (2021). “A new deep learning engine for CoralNet,” in 2021 IEEE/CVF International Conference on Computer Vision Workshops (ICCVW), Montreal, BC, Canada, 3693–3702. doi: 10.1109/ICCVW54120.2021.00412
Couch C. S., Beijbom O., Oliver T. A., Vargas-Angel B., Schumacher B. D., Brainard R. E. (2019). Leveraging automated image analysis tools to transform our capacity to assess status and trends of coral reefs. Front. Mar. Sci. Sec. Ocean Observation 6. doi: 10.3389/fmars.2019.00222
Cuvelier D., de Busserolles F., Lavaud R., Floc’h E., Fabri M. C., Sarradin P. M., et al. (2012). Biological data extraction from imagery - how far can we go? A case study from the Mid-Atlantic Ridge. Mar. Environ. Res. 82, 15–27. doi: 10.1016/j.marenvres.2012.09.001
Cuvelier D., Gollner S., Jones D. O. B., Kaiser S., Arbizu P. M., Menzel L., et al. (2018). Potential mitigation and restoration actions in ecosystems impacted by seabed mining. Front. Mar. Sci. 5. doi: 10.3389/fmars.2018.00467
Cuvelier D., Ribeiro P. A., Ramalho S. P., Kersken D., Martinez Arbizu P., Colaço A. (2020). Are seamounts refuge areas for fauna from polymetallic nodule fields? Biogeosciences 17, 2657–2680. doi: 10.5194/bg-17-2657-2020
Dawkins M., Sherrill L., Fieldhouse K., Hoogs A., Richards B., Zhang D., et al. (2017). “An open-source platform for underwater image and video analytics,” in IEEE Winter Conference on Applications of Computer Vision (WACV), Santa Rosa, CA, USA. 898–906. doi: 10.1109/WACV.2017.105
Dumke I., Nornes S. M., Purser A., Marcon Y., Ludvigsen M., Ellefmo S. L., et al. (2018). First hyperspectral imaging survey of the deep seafloor: high-resolution mapping of manganese nodules. Remote Sens. Environ. 209, 19–30. doi: 10.1016/j.rse.2018.02.024
Durden J. M., Hosking B., Bett B. J., Cline D., Ruhl H. A. (2021). Automated classification of fauna in seabed photographs: The impact of training and validation dataset size, with considerations for the class imbalance. Prog. Oceanography 196. doi: 10.1016/j.pocean.2021.102612
Gazis I. Z., Greinert J. (2021). Importance of spatial autocorrelation in machine learning modeling of polymetallic nodules, model uncertainty and transferability at local scale. Minerals 11. doi: 10.3390/min11111172
Gazis I. Z., Schoening T., Alevizos E., Greinert J. (2018). Quantitative mapping and predictive modeling of Mn nodules ‘ Distribution from hydroacoustic and optical AUV data linked by random forests machine learning. Biogeosciences 15, 7347–7377. doi: 10.5194/bg-15-7347-2018
Haeckel M., Linke P. (2021). RV SONNE Fahrtbericht/Cruise Report SO268 - Assessing the Impacts of Nodule Mining on the Deep-sea Environment: NoduleMonitoring, Manzanillo (Mexico) – Vancouver (Canada), 17.02. – 27.05.2019. GEOMAR Report, N. Ser. 059 (Kiel, Germany: GEOMAR Helmholtz-Zentrum für Ozeanforschung Kiel), 359 + Appendix (in all 802). pp. doi: 10.3289/GEOMAR_REP_NS_59_20
Howell K. L., Davies J. S., Allcock A. L., Braga-Henriques A., Buhl-Mortensen P., Carreiro-Silva M., et al. (2020). A framework for the development of a global standardised marine taxon reference image database (SMarTaR-ID) to support image-based analyses. PLoS One 14, e0218904. doi: 10.1371/journal.pone.0218904
Jones D. O. B., Kaiser S., Sweetman A. K., Smith C. R., Menot L., Vink A., et al. (2017). Biological responses to disturbance from simulated deep-sea polymetallic nodule mining. PLoS One 12, (2). doi: 10.1371/journal.pone.0171750
Jones D. O. B., Simon-Lledó E., Amon D. J., Bett B. J., Caulle C., Clément L., et al. (2021). Environment, ecology, and potential effectiveness of an area protected from deep-sea mining (Clarion clipperton zone, abyssal pacific). Prog. Oceanography 197. doi: 10.1016/j.pocean.2021.102653
Kahn A. S., Pennelly C. W., McGill P. R., Leys S. P. (2020). Behaviors of sessile benthic animals in the abyssal northeast Pacific Ocean. Deep-Sea Res. Part II: Topical Stud. Oceanography 173, 104729. doi: 10.1016/j.dsr2.2019.104729
Langenkämper D., Van Kevelaer R., Purser A., Nattkemper T. W. (2020). Gear-induced concept drift in marine images and its effect on deep learning classification. Front. Mar. Sci. 7. doi: 10.3389/fmars.2020.00506
Langenkämper D., Zurowietz M., Schoening T., Nattkemper T. W. (2017). BIIGLE 2.0 -browsing and annotating large marine image collections. Front. Mar. Sci. 4. doi: 10.3389/fmars.2017.00083
Lodge M., Johnson D., Le Gurun G., Wengler M., Weaver P., Gunn V. (2014). Seabed mining: international seabed authority environmental management plan for the clarion-clipperton zone. A Partnership Approach. Mar. Policy 49, 66–72. doi: 10.1016/j.marpol.2014.04.006
Matabos M., Hoeberechts M., Doya C., Aguzzi J., Nephin J., Reimchen T. E., et al. (2017). Expert, Crowd, Students or Algorithm: who holds the keyto deep-sea imagery ‘big data’ processing? Methods Ecol. Evol. 8, 996–1004. doi: 10.1111/2041-210X.12746
Mbani B., Buck V., Greinert J. (2023). An automated image-based workflow for detecting megabenthic fauna in optical images with examples from the clarion-clipperton zone. Sci. Rep. 13, 8350. doi: 10.1038/s41598-023-35518-5
Möller T., Nattkemper T. W. (2021). ALMI - A generic active learning system for computational object classification in marine observation images. Sensors. 21 (4). doi: 10.3390/s21041134
Oebius H. U., Becker H. J., Rolinski S., Jankowski J. A. (2001). Parametrization and evaluation of marine environmental impacts produced by deep-sea manganese nodule mining. Deep Sea Res. Part II Top. Stud. Oceanogr. 48, 3453–3467. doi: 10.1016/S0967-0645(01)00052-2
Peukert A., Schoening T., Alevizos E., Köser K., Kwasnitschka T., Greinert J. (2018). Understanding mn-nodule distribution and evaluation of related deep-sea mining impacts using AUV-based hydroacoustic and optical data. Biogeosciences 15, 2525–2549. doi: 10.5194/bg-15-2525-2018
Piechaud N., Hunt C., Culverhouse P. F., Foster N. L., Howell K. L. (20192019). Automated identification of benthic epifauna with computer vision. Mar. Ecol. Prog. Ser. 615, 15–30. doi: 10.3354/meps12925
Proctor R., Langlois T., Friedman A., Mancini S., Hoenner X., Davey B. (2018). “Cloud-based national on-line services to annotate and analyse underwater imagery,” in IMDIS 2018 International Conference on Marine Data and Information Systems, Vol. 59, 49.
Purser A., Bergmann M., Lundälv T., Ontrup J., Nattkemper T. W. (2009). Use of machine-learning algorithms for the automated detection of cold-water coral habitats: A pilot study. Mar. Ecol. Prog. Ser. 397, 241–251. doi: 10.3354/meps08154
Purser A., Bodur Y. V., Ramalo S., Stratmann T., Schoening T. (2021a). Seafloor images of undisturbed and disturbed polymetallic nodule province seafloor collected along OFOS profile SO268/2_100-1 RV SONNE SO268/2 cruise [dataset]. PANGAEA. doi: 10.1594/PANGAEA.935884
Purser A., Bodur Y. V., Ramalo S., Stratmann T., Schoening T. (2021b). Seafloor images of undisturbed and disturbed polymetallic nodule province seafloor collected along OFOS profile SO268/2_160-1 RV SONNE SO268/2 cruise [dataset]. PANGAEA. doi: 10.1594/PANGAEA.935891
Purser A., Bodur Y. V., Ramalo S., Stratmann T., Schoening T. (2021c). Seafloor images of undisturbed and disturbed polymetallic nodule province seafloor collected along OFOS profile SO268/2_164-1 RV SONNE SO268/2 cruise [dataset]. PANGAEA. doi: 10.1594/PANGAEA.935892
Rabone M., Joris H. W., Wiklund H., Simon-Lledó E., Horton T., Glover A. G., et al. (2023). How many metazoan species live in the world’s largest mineral exploration region? Curr. Biol. 33 (12), 1–14. doi: 10.1016/j.cub.2023.04.052
Ren S., He K., Girshick R. B., Sun J. (2015). Faster R-CNN: towards real-time object detection with region proposal networks. IEEE Trans. Pattern Anal. Mach. Intell. 2015, 1137–1149. doi: 10.1109/TPAMI.2016.2577031
Schoening T., Bergmann M., Ontrup J., Taylor J., Dannheim J., Gutt J., et al. (2012). Semi-automated image analysis for the assessment of megafaunal densities at the Artic deep-sea observatory HAUSGARTEN. PloS One 7. doi: 10.1371/journal.pone.0038179
Schoening T., Kuhn T., Jones D. O. B., Simon-Lledó E., Nattkemper T. W. (2016). Fully automated image segmentation for benthic resource assessment of poly-metallic nodules. Methods Oceanography. 15–16, 78–89. doi: 10.1016/j.mio.2016.04.002
Schoening T., Purser A., Langenkämper D., Suck I., Taylor J., Cuvelier D., et al. (2020). Megafauna community assessment of polymetallic nodule fields with cameras: Platform and methodology comparison. Biogeosciences 17, 3115–3133. doi: 10.5194/bg-17-3115-2020
Sharma R. (2017). “Assessment of distribution characteristics of polymetallic nodules and their implications on deep-sea mining. Chapter 8,” in Deep-Sea Mining: Resource Potential, Technical and Environmental Considerations. (NewYork: Springer), 1–535. doi: 10.1007/978-3-319-52557-0
Simon-Lledó E., Bett B. J., Huvenne V. A. I., Schoening T., Benoist N. M. A., Je R. M., et al. (2019b). Megafaunal variation in the abyssal landscape of the clarion clipperton zone. Prog. Oceanography 170, 119–133. doi: 10.1016/j.pocean.2018.11.003
Simon-Lledó E., Bett B. J., Huvenne V. A. I., Schoening T., Benoist N. M. A., Jones D. O. B. (2019a). Ecology of a polymetallic nodule occurrence gradient : implications for deep-sea mining. Limnology Oceanography 64 (5), 1–12. doi: 10.1002/lno.11157
Simon-Lledó E., Diva J. A., Bribiesca-Contreras G., Cuvelier D., Durden J. M., Ramalho S. P., et al. (2023a). Carbonate compensation depth drives abyssal biogeography in the northeast Pacific. Nat. Ecol. Evol. 7, 1388–1397. doi: 10.1038/s41559-023-02122-9
Simon-Lledó E., Diva J. A., Bribiesca-Contreras G., Cuvelier D., Durden J. M., Ramalho S. P., et al. (2023b). Abyssal Pacific Seafloor Megafauna Atlas (1.0) (Geneva, Switzerland: CERN). doi: 10.5281/zenodo.8172728
Simon-Lledó E., Pomee C., Ahokava A., Drazen J. C., Leitner A. B., Flynn A., et al. (2020). Multi-scale variations in invertebrate and fish megafauna in the mid-eastern clarion clipperton zone. Prog. Oceanography 187. doi: 10.1016/j.pocean.2020.102405
Smith C. R., Tunnicliffe V., Colaço A., Drazen J. C., Gollner S., Levin L. A., et al. (2020). Deep-Sea misconceptions cause underestimation of seabed-mining impacts. Trends Ecol. Evol. 35, 853–857. doi: 10.1016/j.tree.2020.07.002
Uhlenkott K., Meyn k., Vink A., Martinez P. A. (20232023). A review of megafauna diversity and abundance in an exploration area for polymetallic nodules in the eastern part of the clarion clipperton fracture zone (North East Pacific), and implications for potential future deep-sea mining in this area. Mar. Biodiversity 53, 22. doi: 10.1007/s12526-022-01326-9
Vanreusel A., Hilario A., Ribeiro P. A., Menot L., Martinez P. A. (2016). Threatened by mining, polymetallic nodules are required to preserve abyssal epifauna. Sci. Rep.-UK 6, 26808. doi: 10.1038/srep26808
Wäldchen J., Rzanny M., Seeland M., Mäder P. (2018). Automated plant species identification—Trends and future directions. PLoS Comput. Biol. 14, e1005993. doi: 10.1371/journal.pcbi.1005993
Wedding L. M., Friedlander A. M., Kittinger J. N., Watling L., Gaines S. D., Bennett M., et al. (2013). From principles to practice: a spatial approach to systematic conservation planning in the deep sea. Proc. R. Soc B 280, 20131684. doi: 10.1098/rspb.2013.1684
Yamada T., Massot-Campos M., Prugel-Bennett A., Pizarro O., Williams S. B., Thornton B. (2023). “Guiding labelling effort for efficient learning with georeferenced images,” in (IEEE) Transactions on Pattern Analysis & Machine Intelligence. IEEE, Vol. 45. 593–607. doi: 10.1109/TPAMI.2021.3140060
Zurowietz M. (2022). Large-Scale Marine Image Annotation in the Age of the Web and Deep Learning. PhD thesis (Bielefeld: Universität Bielefeld). doi: 10.4119/unibi/2965874
Zurowietz M., Langenkämper D., Hosking B., Ruhl H. A., Nattkemper T. W. (2018). MAIA—A machine learning assisted image annotation method for environmental monitoring and exploration. PloS One 13. doi: 10.1371/journal.pone.0207498
Zurowietz M., Nattkemper T. W. (2020). Unsupervised knowledge transfer for object detection in marine environmental monitoring and exploration. IEEE Access 8, 143558–143568. doi: 10.1109/ACCESS.2020.3014441
Keywords: marine imaging, biodiversity, benthic communities, computer vision, deep learning
Citation: Cuvelier D, Zurowietz M and Nattkemper TW (2024) Deep learning–assisted biodiversity assessment in deep-sea benthic megafauna communities: a case study in the context of polymetallic nodule mining. Front. Mar. Sci. 11:1366078. doi: 10.3389/fmars.2024.1366078
Received: 05 January 2024; Accepted: 26 March 2024;
Published: 17 April 2024.
Edited by:
Marina R. Cunha, University of Aveiro, PortugalReviewed by:
Giorgio Castellan, National Research Council (CNR), ItalyNils Piechaud, Norwegian Institute of Marine Research (IMR), Norway
Copyright © 2024 Cuvelier, Zurowietz and Nattkemper. This is an open-access article distributed under the terms of the Creative Commons Attribution License (CC BY). The use, distribution or reproduction in other forums is permitted, provided the original author(s) and the copyright owner(s) are credited and that the original publication in this journal is cited, in accordance with accepted academic practice. No use, distribution or reproduction is permitted which does not comply with these terms.
*Correspondence: Daphne Cuvelier, daphne.v.cuvelier@uac.pt; Martin Zurowietz, m.zurowietz@uni-bielefeld.de; Tim W. Nattkemper, tim.nattkemper@uni-bielefeld.de