Tensioned flexible riser vibrations under wave excitation, an investigation on the scale effect
 Yunli Feng
 Sunwei Li2*
 - 1School of Naval Architecture and Marinetime, Zhejiang Ocean University, Zhoushan, China
- 2Institute for Ocean Engineering, Shenzhen International Graduate School, Tsinghua University, Shenzhen, China
- 3School of Environment, Tsinghua University, Beijing, China
In order to study the scale effect in wave-structure interactions and the role that structure-related parameters (tension T or bending stiffness EI) plays, riser model tests under regular waves were conducted using the model with multiple geometric scales (1:15, 1:12 and 1:9) in a wave basin. The riser model used is a novel structural design combing the outer polyvinyl chloride pipe with the core steel rod which could be simplified as a cantilever beam. Different initial tension T acting on the riser are tested by adjusting the slotted weight. The results show that the amplitude varies in a cubic fashion with the distance from the fixed end. In addition, the influence of the wave period and top tension T on the amplitude are investigated, which ultimately leads to a dimensionless number π1 = KCd·TL2/EI where KC is the classical Keulegan–Carpenter number (KC), EI shows the bending stiffness of the riser model and L gives the pipe length. With the KC number revised to take the distance from the fixed end into the calculation, this parameter provides a good measure in estimating the amplitudes of the riser vibrations induced by the waves.
1 Introduction
The exploitation of offshore oil and gas resources is gradually shifted from shallow waters (<125m) to deep sea areas (125m~1500m) and ultra deep sea areas (>1500m) (Manning, 2016). The riser system which connects the floating offshore platform with underwater equipment hence plays a significant role. The dynamics of the marine riser not only shows the reliability of engineering projects installed offshore, but also impacts the marine hydrodynamic environment and ecosystems as the riser interacts with seawater and presents the condition for the near-surface marine biology. Changes in the hydrodynamic environment, such as wave and current characteristics, can alter the migration, diffusion, and transformation patterns of marine pollutants. More importantly, once the marine riser is damaged, it will cause serious environmental pollution. For example, the Diamond Offshore’s marine riser connection failed during operations on April 22, 2002; Discoverer Enterprise drilling vessel’s riser ruptured in the Gulf of Mexico in 2003, leading to significant economic loss and environmental damages (Chang et al., 2018).
According to DNV-RP-F204 concerning the riser fatigue estimations, there are three main sources of riser fatigue failures: 1) waves, 2) low frequency motion, and 3) vortex-induced vibrations (VIV). Comparing to the fatigue damages induced by waves, the vibrations of risers under the influences of low-frequency motion of the platforms and vortices have been studied extensively (Jauvtis and Williamson, 2004; Zhang et al., 2020; Gao et al., 2021). Discovers made in such studies have been taken into consideration in the structural design. The vibrations and structural responses of the riser system under waves, on the other hand, are seldom investigated. British Petroleum, for example, monitored the full-scale drilling riser’s response during a drilling campaign in the Gulf of Mexico between 13th April and 11th July in 2007 (Joseph et al., 2017). The acceleration spectrum shows the excitation is from VIV, drilling string rotation and wave induced motion. The measured peak frequency is 0.0866 Hz which is identified to be the response frequency of VIV, but it also falls in the typical wave frequency range. In addition, Huang et al. (2022) discussed a variety of models all revealing the significant wave induced vibrations of TTR and SCR. Liang et al. (2023) compared the wave-induced fatigue and VIV-induced fatigue of a free-hanging riser numerically. Luo (2022) studied the fatigue characteristics of subsea wellhead connector considering the action of riser wave-induced vibrations. Consequently, the structural design of the riser preventing the wave-induced vibrations is not as thorough as the designs concerning the VIV. The further study is significant on the underlying mechanisms of the wave-induced vibrations and could advance our understanding of the fluid-structure interactions and help better develop and utilize the ocean.
Due to the unacceptable cost for the full-scale experiment, the investigation on the riser vibration mainly relies on the scaled-down experiment. For example, Lee and Allen tested two scaled top-tensioned, flexible cylindrical structures’ VIV (Lee and Allen, 2010). Zhang et al. cut off the anchor chain connecting to the drilling platform to dynamically simulate the structural behavior of an anchor chain (Zhang et al., 2007). The cut-off model ensures the static similarity and avoids unrealistically small scaled-down experiment. Ren et al. conducted the SCR’s VIV experiment with a complex geometry in ocean basin (Ren et al., 2020). Although these experiments reveal important features for the vibrations of risers induced by environmental loading, the scale effect could deteriorate the results when they are used to reveal the behavior of the full-scale riser.
In order to unveil the scale effect in the scaled-down experiments of riser vibrations, efforts have been continuously made. For instance, Li (2013) and Zhou and Huang (2013) used the commercial numerical tools of SHEAR7 and ANSYS-CFX to simulate the VIV of a riser at the full-scale and of its geometrically scaled-down models. Bearman et al. (2001) and Ren et al. (2011), in addition, designed a series of scaled-down experiments following the Froude similarity theory and fluid-structure interaction theory to investigate the VIV of risers. Lee and Allen (2010) conducted two flexible risers’ VIV tests mainly to investigate the effects of the top tension and structural stiffness on response. The previous studies disclosed the importance of the Reynolds number similarity and structural property similarity in designing the scaled-down experiment for the VIV of risers. In fact, it is found that the similarity of fluid-structure interaction parameters, such as the mass ratio, plays a crucial role in designing riser vibraation experiments within a certain range of Reynolds numbers.
Although a number of studies have already been devoted to reveal the scale effect for the VIV of risers, it is rarely investigated for wave-induced vibrations with neither numerical simulations nor laboratory experiments. The conclusions drawn from the VIV’s experiments, on the other hand, are not applicable for the wave-induced vibration since
1) The Froude number similarity, which is verified not that important in the VIV of risers, could play a significant role in the wave-induced vibrations;
2) The common fluid-structure interaction parameters, such as mass ratio, may be not as influential in the wave-induced vibration as in the VIV;
3) The viscosity of the fluid, which is the key in determining the amplitudes and frequencies of VIV could be ignored in the wave kinematics, and hence in wave-induced vibrations.
Consequently, the structural design of the riser preventing the wave-induced vibrations is not as thorough as the designs concerning the VIV.
In the literature effect from wave is often treated as a static force calculated by Morison’s equation or other wave theory. While wave-induced vibrations are mostly coupled with water flow. To the authors’ best knowledge there is no separate analysis of the dynamic effect of waves on risers, and the scale effects.herein is still an open topic and should be systematically investigated. It is postulated that the structural parameters, together with the wave kinematics, are important in determining the wave-induced vibrations of a riser, and hence should be paid attention to when designing the scale-down experiments. In detail, the present study preliminarily investigates the scale effect of the riser vibrates under excitation of waves using the carefully designed wave-basin tests on the riser models with different geometric scales. After introduction, section 2 presents the design of the scaled riser models under investigation, the description of the wave test basin and facilities, experimental set up and the method of data analysis. Experimental results are discussed in section 3. Conclusions are drawn in section 4.
2 Experimental setup and procedure
A truncated model of a riser, at three different geometric scales, is placed in the wave-basin and its vibrations under the excitation of waves with different kinematics are measured. From the measurements of riser model vibrations, the scale effect of the wave-induced vibration is investigated, which focused on the influences of wave kinematics and structural properties of the riser model. This sections briefly reviews the similarity theories in describing the wave-induced vibration and articulates the set-ups and procedures to conduct the wave-basin tests for riser models at different geometric scales.
2.1 Similarity theory
Since the cost associate with an experiment of risers at the full-scale is unacceptably high, the academic investigations focusing on the dynamic features of wave-induced riser vibrations mainly relies on the scaled-down experiments. Given that the scaled-down experiments are commonly used to reveal dynamic behavior of complex systems, similarity theories have been developed for the design of them. Ideally, both the dynamic characteristics at the fluid side and the structure side should be similar for the prototype and the model. The perfectly scaled-down experiment, however, does not exist due to the absence of proper materials at both the fluid and structure sides. Consequently, the dominate dynamic features in the full-scale system should be identified, and corresponding similarity theory is developed for the design of the scaled-down experiments.
In the scaled-down experiment for the offshore structures, the Reynolds and Froude Number similarity theories are usually employed. It is widely acknowledged that Reynolds similarity is highly difficult to satisfy in the experiment. In the field of ocean engineering, the Froude similarity is most widely followed through adjust the geometry of the model and the velocity of the flow. When the wave dynamics is of concern, the Keulegan-Carpenter (KC) number similarity is also important as it reveals the periodic nature of the wave excitation. Froude similarity is applied in the current work. Table 1 provides the conversion of physical quantities between model and prototype. The ratio of seawater to freshwater density is γ (γ = 1.025).
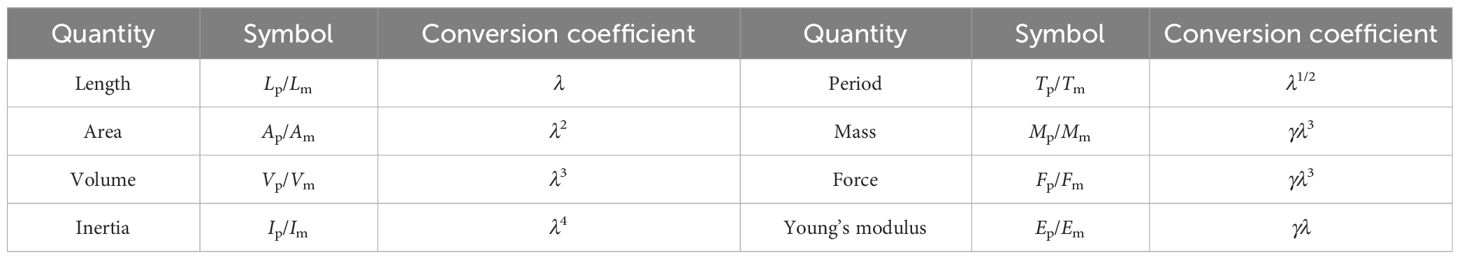
Table 1 Scaling criterion of physical quantities between model and prototype.
With regards to the wave-induced vibration of risers, it is expected that both the parameters in association with the KC number similarity and the fluid-structure interaction should play a role. In detail, it is postulated that the periodic nature of the wave excitation and the natural frequencies of the riser are both important in determining the dynamic responses of the riser under waves. In addition to the frequencies, the magnitudes of hydrodynamic forces and the structural properties of the riser together determine the amplitude of the vibration. Since there is no commonly acknowledged similarity theory to guide this kind of experiments, it is beneficial to reveal the relative importance of parameters for wave kinematics and structural properties, which could lead to discoveries of novel dimensionless number describing the dynamic responses of risers under the wave excitation.
2.2 Riser model
In order to investigate the scale effect for the riser vibrating under waves, a series of wave-basin tests were conducted and reported in the present study. In fact, riser models at different geometric scales were tested, which reveals the connections of frequencies and amplitudes of riser vibrations with wave kinematics and its structural properties. As revealed by Lee and Allen (2010), the axial and lateral stiffness, in the combination with the top tension, determines the dynamic features of the riser vibration under periodic excitation. So it is reasonable to ignore the axial stiffness of the riser as it seldom influences the structural responses of a riser in the range of wave elevations. Consequently, the top tension and the bending stiffness are focused in the design of the riser model in the present study.
The riser model employed is scaled down from a real riser used by China National Offshore Oil Corporation (CNOOC) in a project installed in the South China Sea. The major structural parameters of the riser at the full-scale is summarized in Table 2. Considering the restrictions of the wave-basin dimensions, the geometric scales for the design of the riser model are specified as 1:9, 1:12 and 1:15.
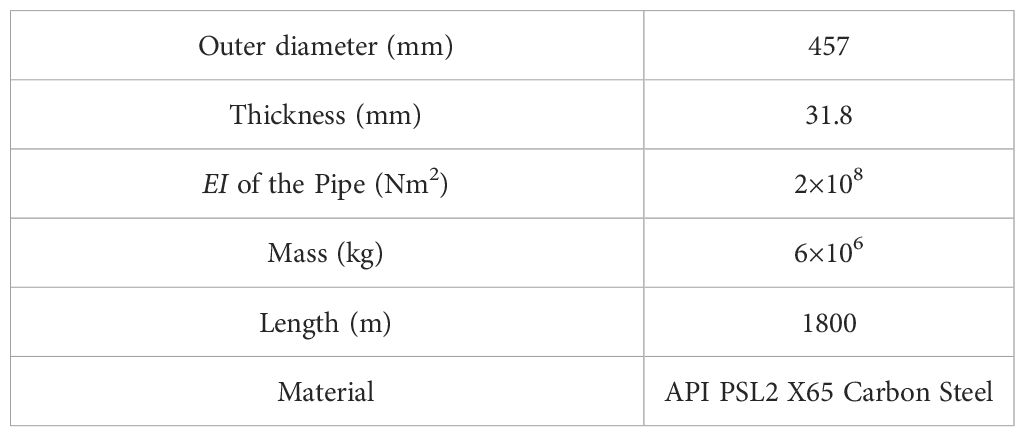
Table 2 Geometric and structural characteristics of the CNOOC riser at the full-scale.
It is apparent that the geometrically perfect scaled-down of the real riser would lead to an unrealistic model with extremely thin ring as the cross-section. In fact, the riser model corresponding to the scale of 1:9 shows a thickness of 3.5 mm. Consequently, a novel approach to manufacture the riser model is suggested in the present study. Because the geometric and structural similarity are most important in the manufacturing process, it is designed that the outer diameter and the bending stiffness are preferentially scaled-down. This is achieved by the combination of round steel and polyvinyl chloride (PVC) pipes. In order to eliminate the additional stiffness brought about by the PVC tubes, they are disconnected along the whole length.
In fact, the scaled-down model is manufactured as follows. a) the fully-threaded steel rod with desired diameters is selected and truncated to be the core of the riser model, and to present the desired bending stiffness; b) PVC tube segments, with the outer diameters determined from the geometric scale, are manufactured; 3) the PVC tube segments placed onto the lateral supports of the core steel rod are assembled along the core steel rod using water-proof glue; d) the assembled PVC tube is sealed at both ends to have a water-tight riser model. Figure 1 shows the components, i.e., the steel core rod and the outer PVC tube segments, used to manufacture the riser model at different geometric scales.
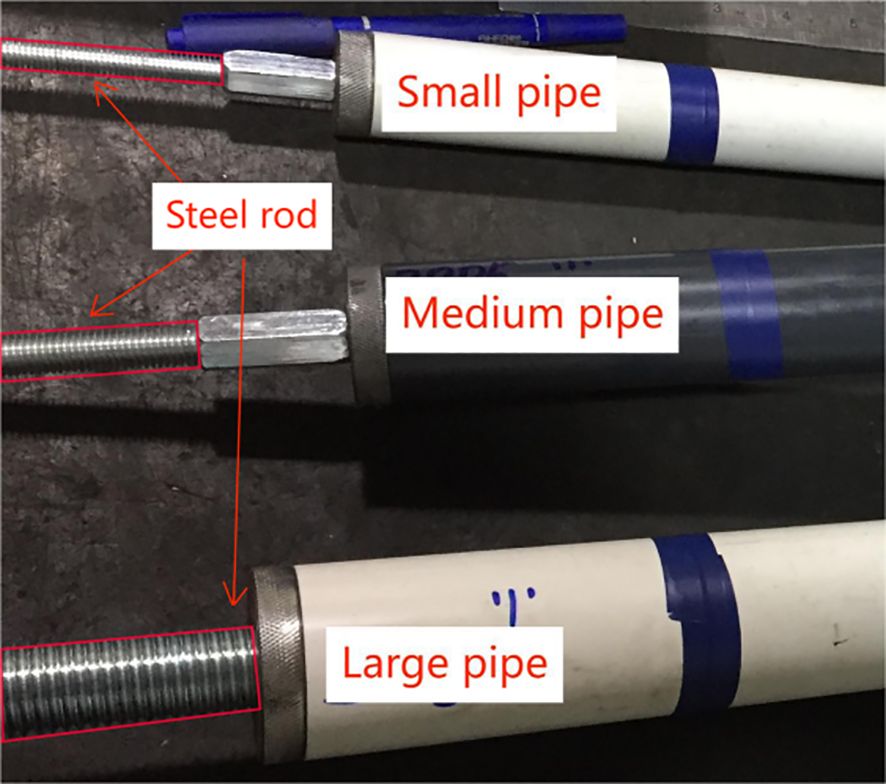
Figure 1 Comparison of riser models at different geometric scales.
To obtain the desired bending stiffness, the deflection of the assembled riser model is accurately measured in the mechanic laboratory using a three-point bending machine to apply the load. Supplementary Figure 1 shows the sketch for the bending test and the photo showing the site.
In addition to the bending stiffness, the top tension also influences the dynamic behavior of the riser. In fact, it is suggested that the dimensionless parameter of TL2/EI determines the behavior of the riser, in which T is the initial tension, L is the length of the riser and EI, in general, shows the bending stiffness. While TL2 larger than EI indicates string-like behavior of the riser, TL2/EI<1 implies that it is a beam-like structure. Consequently, three different slotted weights—47, 95, and 143 kg—are connected to the riser model at the geometric scale of 1:9 to evaluate the influence of top tension on wave-induced vibrations. Given the riser models are at three different geometric scales and three slotted weights are connected to the riser model at the scale of 1:9, six different riser models are under investigation. Table 3 summarizes the structural properties of them. For the sake of brevity, these models at the scales of 1:15, 1:12 and 1:9 are labeled as Small, Medium and Large model respectively. The value of slotted weights is appended to those label for further clarification.
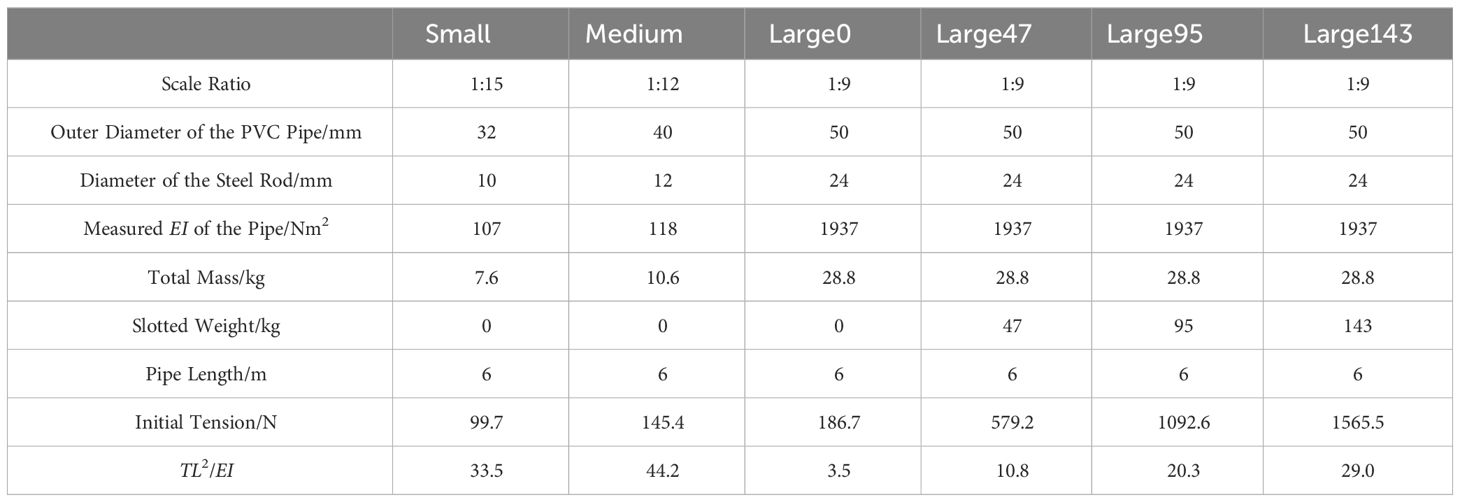
Table 3 Key parameters of the scaled riser model.
2.3 Experiment facilities
The riser models at different geometric scales are tested in the wave basin in the Shenzhen International Graduated School, Tsinghua University. In fact, the vibrations of the riser models under the regular waves with different kinematic characteristics were employed in the present study to investigate the wave-induced vibration.
In fact, the wave basin is 25m long, 8m wide and filled with water up to 5m shown in Supplementary Figure 2. In other words, the water depth of it is 5m. It is equipped with a flap wave maker and a wind tunnel at one end. While the regular waves are generated by the wave maker, the wind tunnel is turned off in the present experiment to eliminate the influence of winds on the vibration of riser models. The riser model is installed at the bottom of the trailer and placed in the middle of the basin. Given the diameters of the riser models and the location of their installation, the wall proximity effect are negligible. The maximum wave height generated in the basin is 0.75m. However, the wave heights are in the range of 0.1m~0.5m in the present study to avoid the stability issue for higher wave heights. Opposite to the wave maker, there is a absorbing beach at the end of the basin.
The trailer is controlled to positioned at the horizontal center of the basin and is fixed at the predefined location throughout the experiment, which provides a fixed boundary condition for the model. At the top end of the model, a force sensor is attached to measure the top tension during the experiment. At the lower end, a specifically designed frame is used to host the slotted weights. It is noted that the frame only restricts the horizontal movement of the slotted wight. The layout of the riser model is shown in Figure 2. Supplementary Figure 3 shows the apparatus connected to both ends of the riser model.
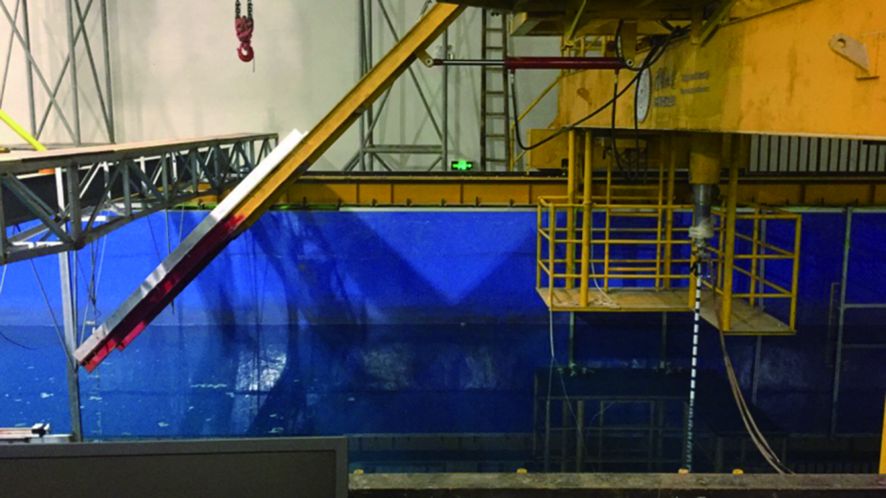
Figure 2 Layout of the riser model in the wave basin.
In order to measure the dynamic responses of the riser model under waves, a series of strain gauges are attached along its axial direction. Since the dynamic responses near the free surface is of concern, the strain gauges are placed denser close to the free surface. More specifically, there are 6 gauges along the axis of the riser model, and their locations are shown in Figure 3. It is noted that the gauges are placed in pair to measure the strains for both the upstream and downstream directions. While the gauge P1 is located above the free surface, P2-P6 gauges are underwater. In fact, the gauge P1 is installed 0.75m beneath the top of the riser model, and is 0.35m above the still water. The signals of the gauges are sent to the central computer via the M3841 collection system as shown in Supplementary Figure 4. In addition, a series of wave elevation sensors are installed before the riser model to verify the wave load conditions. The specifications of the measuring equipment are summarized in Supplementary Table 1.

Figure 3 Schematic diagram of strain gauge arrangement (unit: mm).
2.4 Experimental produces and wave load cases
During the wave-basin test, the riser could be regarded as a cantilever beam. In fact, it is essentially a truncated model, in which the influence of remaining riser occupying the water down to the seabed is ignored. At first, it is practically impossible to model the entire riser system as the riser in the real project is around 1800 meters long. Secondly, the wave-induced vibration is understandably only observed near the free surface. Therefore, a truncated model is fabricated in the present study. And the remaining part of the riser in fact provides the restriction for the motion of the truncated model. Considering the extensive length of the it, it is reasonable to assume it hardly restricts the dynamic responses of the model under the waves. Therefore, the model is regarded as a cantilever beam, and the restriction of the remaining riser part is simply ignored.
The general procedures to conduct the wave basin experiments are as follows: a) the core rod is manufactured according to the desired geometric scale and the strain gauges are attached to the rod at the prescribed locations; b) The core rod is connected to the outer PVC tube segments to prepare the riser model at different geometric scales; c) A three-dimensional force sensor is installed at the end of the trailer, and the interface is designed to connect with the riser model at its top end; d) The riser model, together with the desired slotted weight, is hoisted and installed onto the trailer (Figure 4); Meanwhile, the base frame is placed to the bottom of the wave basin; The riser model is then carefully moved by the trailer to the predefined position with the slotted weight perfectly hosted by the base frame; e) The wires connecting the strain gauges and the force sensor are sealed inside the outer PVC tube segments and dredged out to collect the signals to the central computer; f) The wave maker is activated to generate the regular waves and the measurements of the strains and top tensions are accumulated.
Figure 4 Hoisting of the riser model.
With regards to the kinematics of waves, the heights and periods of regular waves were varied to provide different load cases. In fact, different wave kinematics are adopted for riser at different geometric scales. For the Small riser model, the wave height ranges from 0.1m to 0.4m and the wave periods ranges from 0.7s to 2.0s. For the Medium riser model, the wave height varies in the range of 0.12m-0.45m, and the wave period varies in the range of 0.79s to 2.07s. The wave heights and periods both increase in the test corresponding to the Large riser model to ranges of 0.15m-0.56m and 0.84s-2.24s. The details of the load cases employed are illustrated in the Table 4; Supplementary Tables 2, 3. All the waves are seen as deep-water waves. During the test, the wave parameters are controlled by the wave-making system.
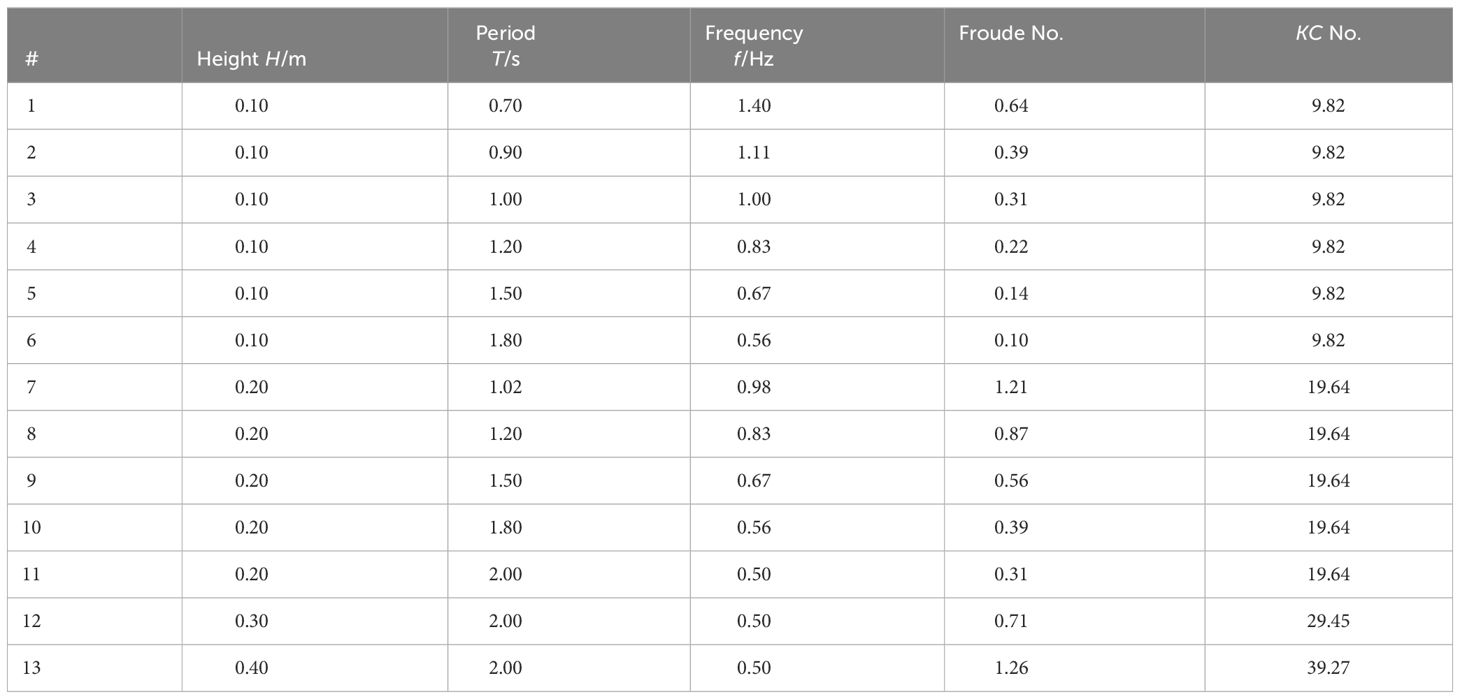
Table 4 Regular wave height and period for Small pipe model test.
2.5 Data analysis
Strains of the riser model are the main measurement accumulated in the wave-basin test. Given the strains at various positions along the riser model are measured, the dynamic displacements are discerned via modal analysis. In addition, it is well known, from the VIV experiments, that the dynamic responses of a riser may couple with the tension to present a complex fluid-structure interaction phenomenon, in which the simple modal analysis linking the strains and dynamic displacements of a riser is no longer applicable. Consequently, the strain gauges are arranged symmetrically about the axis of the riser in the wave-incident direction to evaluate the influence of vibrations on the tension, and in turn on the strains of a riser.
2.5.1 Strain acquisition
Since it is reported, in the literature concerning the VIV, that the vibration could induce periodic variations in tension, which ultimately influences the dynamic responses of the riser, the strains measured symmetrically about the neutral axis in the wave-basin are employed to eliminate the influence of tensions. In detail, the strains measured across the neutral axis of the riser show the variation of the neutral position of the riser model, which indirectly reveals the deformation characteristics of the riser.
Figure 5 shows a segment of strain time history measured at the position of P5 under the load case of #13 corresponding to the Large143 model. It is observed from the figure that the two strain time serials are equal in value and opposite in the sign, and the averages of the strains in the opposite directions is acceptably close to zero. Such an feature implies that the riser model under investigation in the wave-basin test is in the pure bending state, in which the shear does not play a dominate role. In other words, the strain measurements corresponding to the upstream face of the riser in the wave-incident direction contain all the information required to estimate the dynamic displacements, and therefore only those measured at the upstream face are used for subsequent processing and discussion.
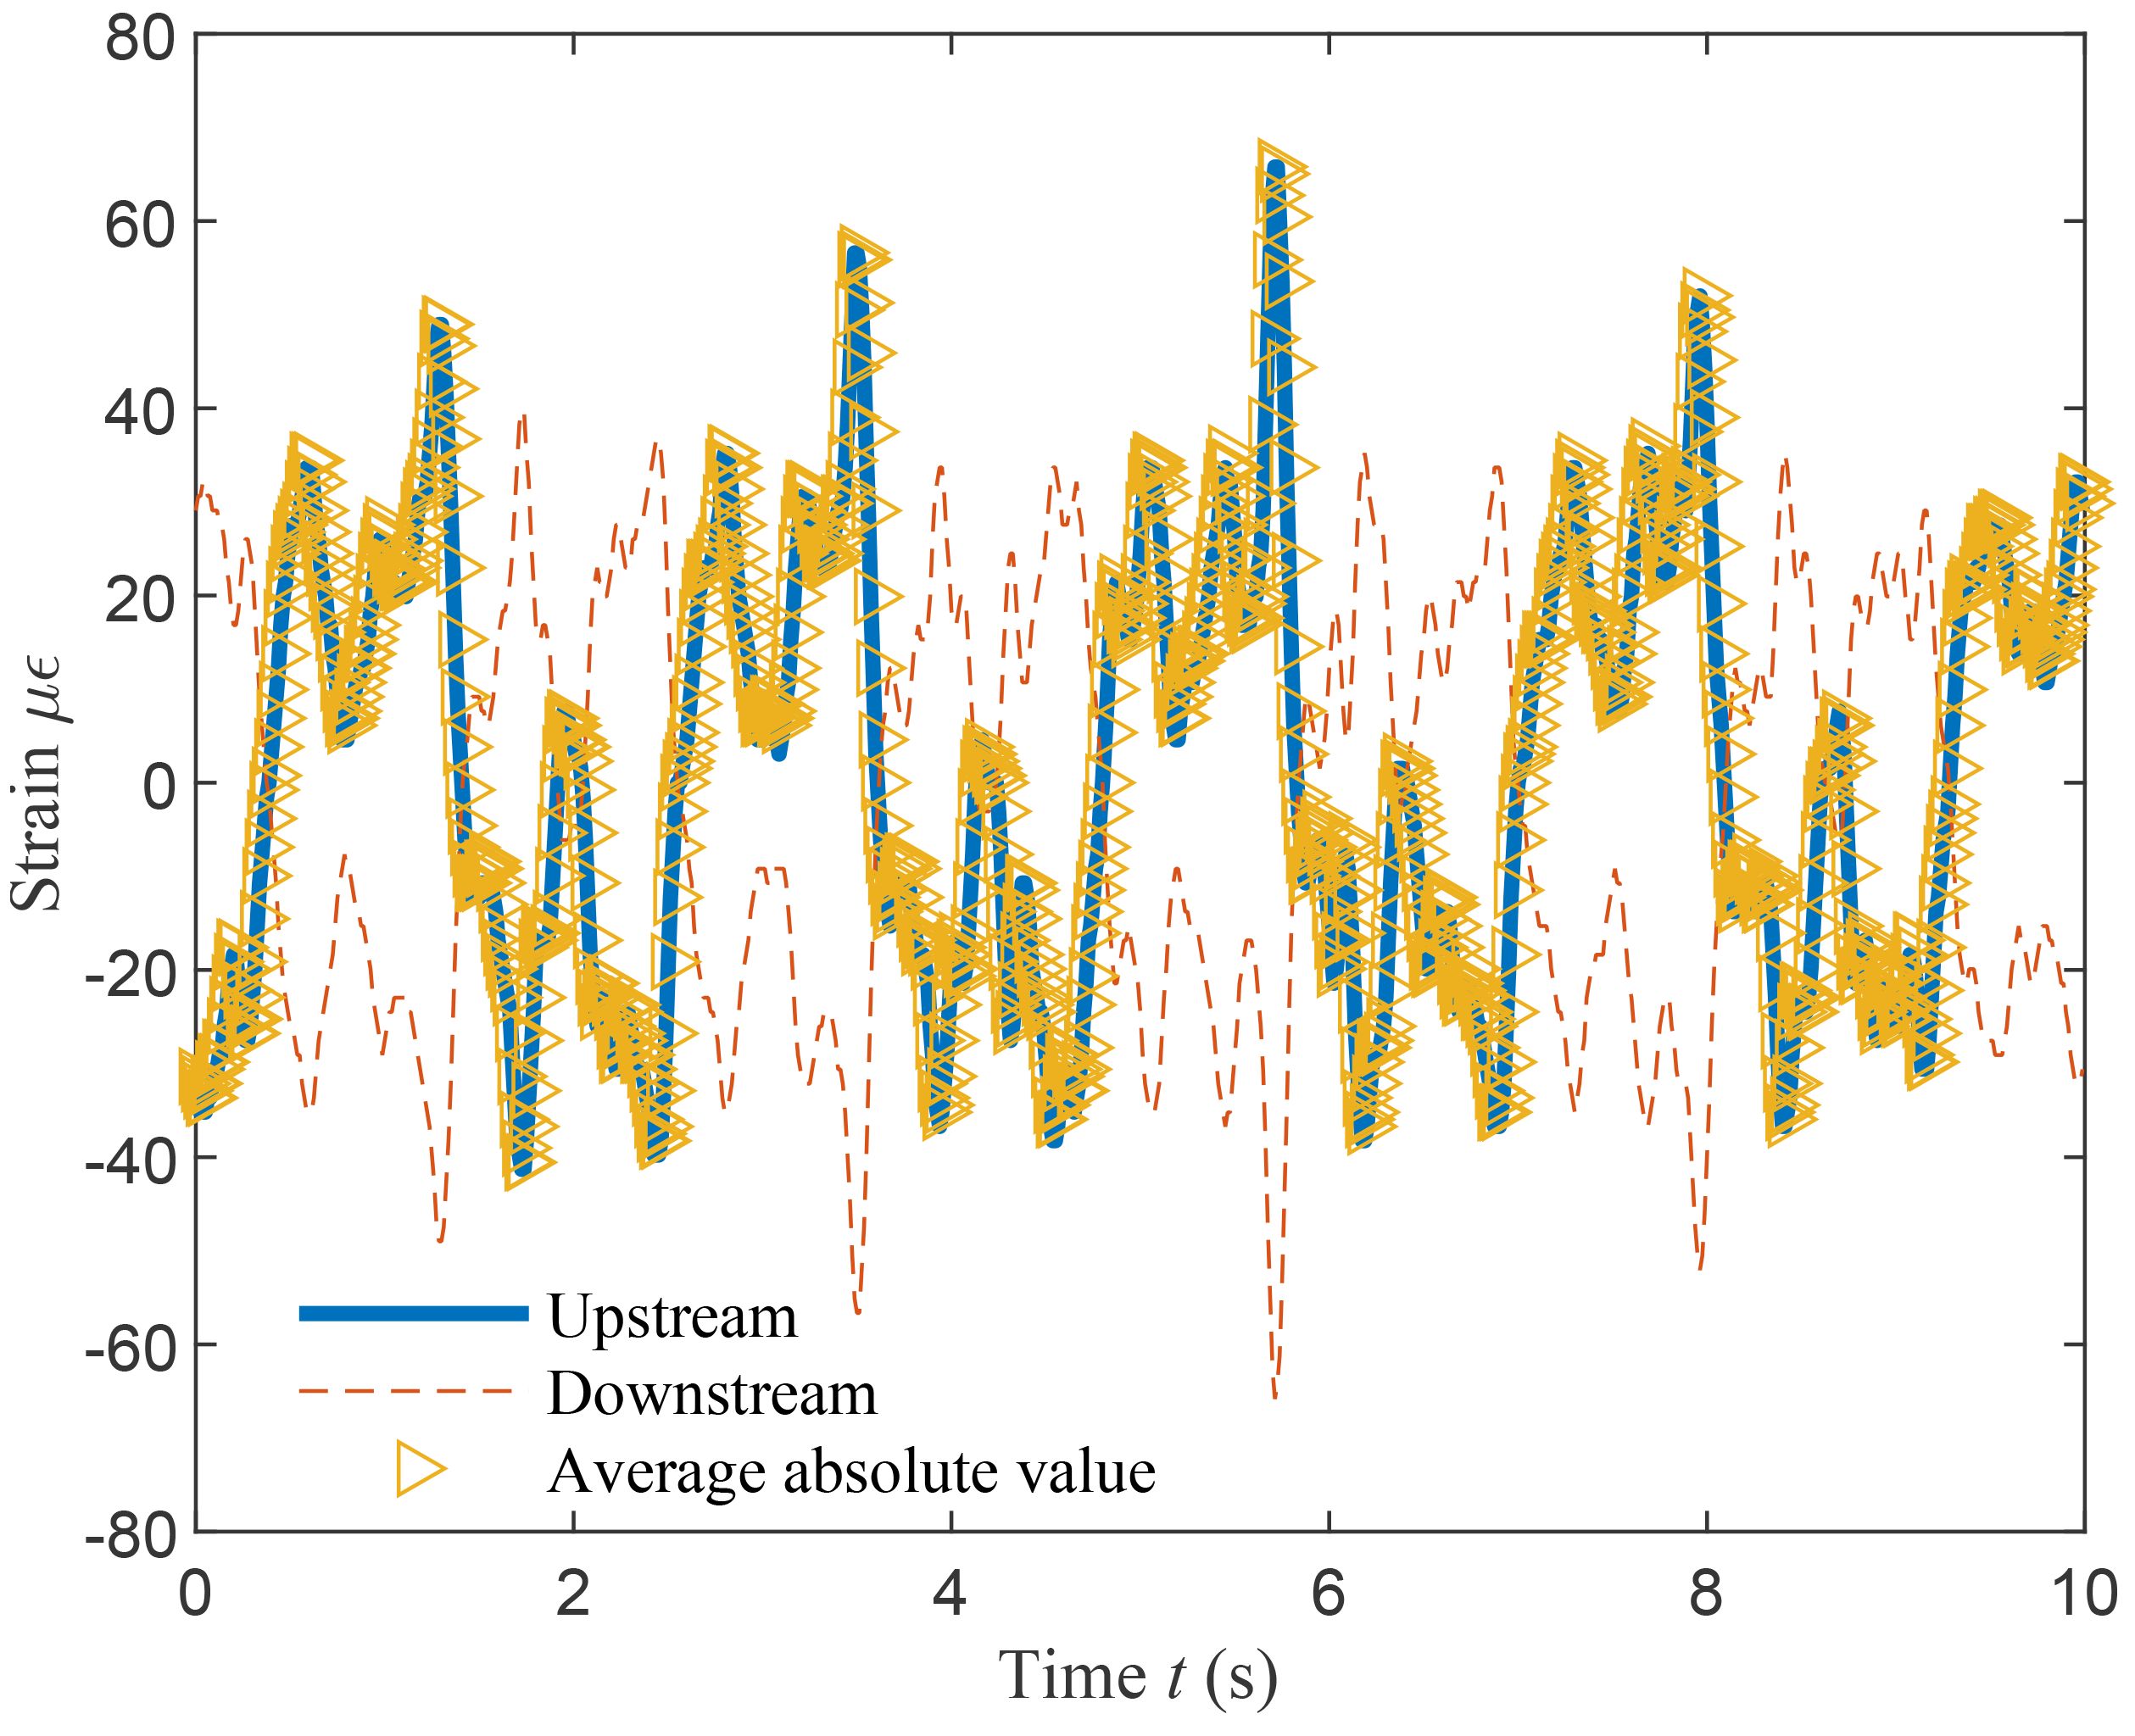
Figure 5 Strain time history for Large143 pipe under condition #13.
2.5.2 Modal analysis
The strains measured at the upstream face are used to infer the vibration response of the riser via modal analysis (Equations 1–6) as demonstrated by Gao et al. (2015). In detail, it is assumed that there are n-th modes participating in the dynamic response of the riser, and the displacement at a given location along the riser axis is obtained through a linear superposition of the participated modes. In other words, the displacement along the axis of a riser model is expressed as:
where x(z,t) is the displacement of a riser in the wave-incident direction;z shows the vertical coordinates of the location; t is the time; φi is the shape of i-th mode participating in vibration; n is the highest mode order considered in the modal analysis; hi is the i-th mode contributing coefficient, i.e., the contribution of the i-th mode to the total displacement response of the system. The relationship between the displacement and curvature κ(z, t) shows:
From the structural dynamics of a cantilever beam, its mode shapes are,
where A1 and ai are undetermined constants. Then the curvature corresponding to the selected mode shape is given by
According to classic structural dynamics (Liu et al., 2005), the first four solutions of aL are 1.875, 4.964, 7.855 and 10.996, respectively.
Considering the relationship between curvature and strain ϵ:
where R is the diameter of steel rod, it is derived that
in which is the i-th mode contribution coefficient to the total strain. The relationship between displacement and strain can then be obtained combing the relationships shown in Equations (7):
With the help of the measurements of strains taken, the contribution coefficients of the modes participated in the dynamic responses of the riser model are determined, which in turn leads to the estimates of the displacements given the known mode shape. Figure 6A shows the time history of the contribution coefficients of the first four modes corresponding to the riser model at the geometric scale of 1:15 under the load case of #1. The coefficients are around -6×10⁻⁶ ~ 1×10⁻⁵、-8×10⁻⁶ ~ 7×10⁻⁶ 、-9×10⁻⁷ ~ 1×10⁻⁶and -9×10⁻⁷ ~ 7×10⁻⁷, respectively. Therefore, the first two order modes are considered dominant the vibration of the riser model. The sum of the energies corresponding to the first three modes reaches 95% (Figure 6B). Consequently, it is sufficient to estimate the vibration of the riser model considering the first three participating modes.
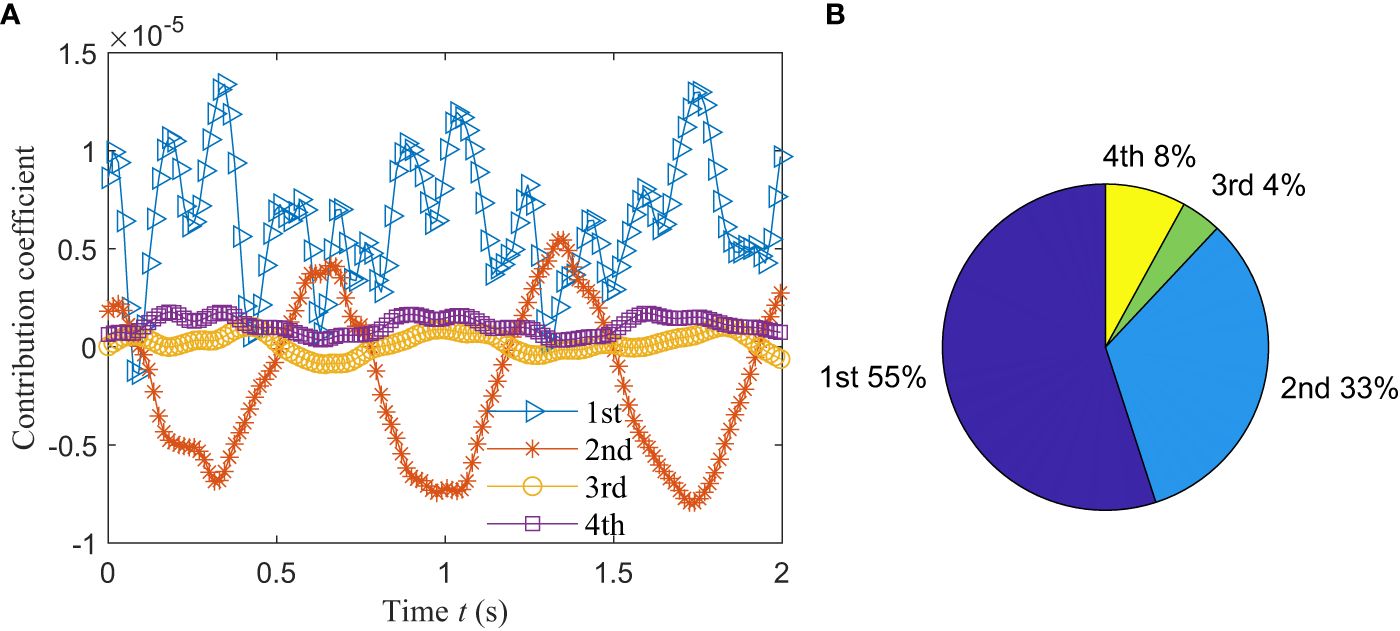
Figure 6 Contribution coefficients of the first four modes: (A) Temporal variation; (B) Percentages.
3 Results and discussions
Including the riser models at different geometric scales and slotted weights applied at the end, there are 6 different models tested in the wave basin. For each of them, 13 different load cases are applied, which is named as #1 through #13. Using the measurements of strains, the dynamic responses, mainly the vibration frequency and amplitudes, are analyzed to reveal the scale effect of risers vibrated in waves.
3.1 Spectrum of the displacement
With the help of the measurements of strains at different location along the riser model, the time histories of displacements at corresponding locations are obtained, which are used to show the spectral characteristics of the vibrations through Fourier transformations.
Figure 7 depicts the vibration spectra at different sampling points for the Large0 model under the load condition of #12 (see Supplementary Table 3). It is revealed from the figure that the vibration of the riser model is fairly periodic with a dominant frequency equaling to the frequency of the wave excitation. In some cases, the secondary vibration frequency, which is twice as the wave excitation frequency, cannot be ignored.
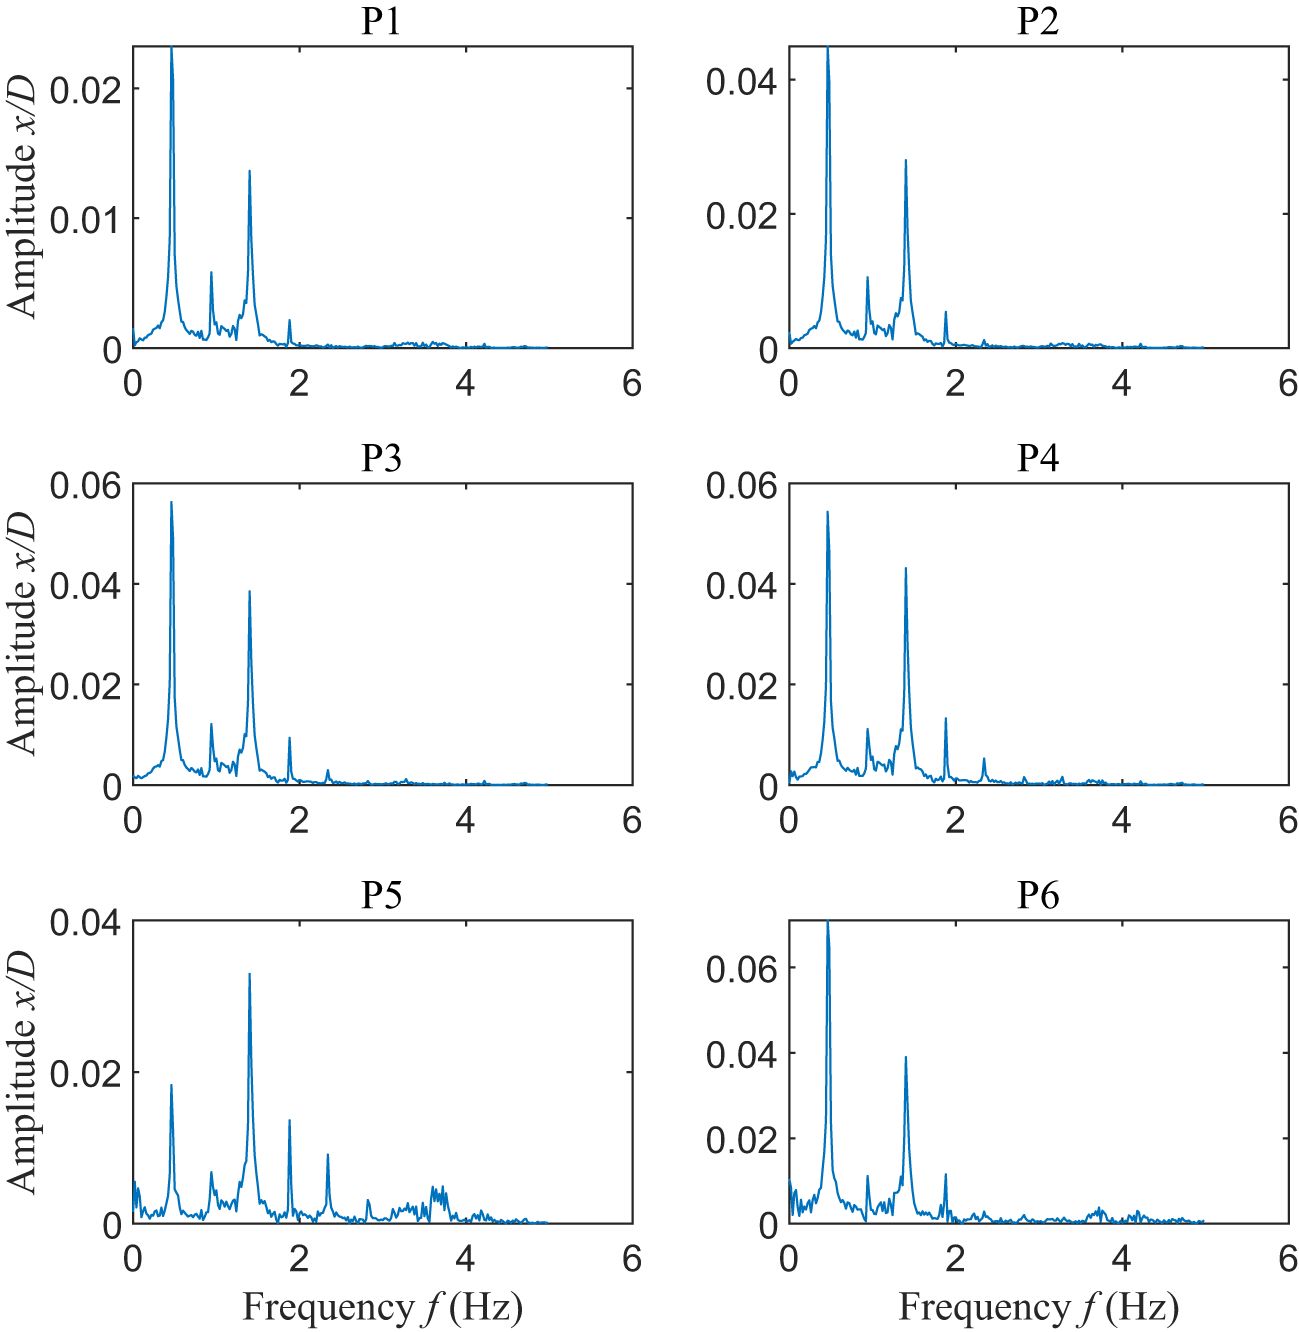
Figure 7 Spectrum for Large0 pipe (Fr=0.70, KC=25.13).
In addition to the spectral characteristics, the time histories of the displacements also leads to the estimates of the vibration amplitudes. Figure 8 shows the root-mean square of displacements normalized by the diameter of the riser models under the excitation of the load case of #1. It is noted that the first point showing a vertical coordinate of 0.35m is above the still water surface, and the other five points are well below the water surface even in the wave condition. As expected, Figure 8 shows that the vibration amplitude for all the riser model under investigation increases downwards. Such a finding substantiates that the experiment configuration discloses the dynamic responses of a cantilever beam under the excitation of waves.
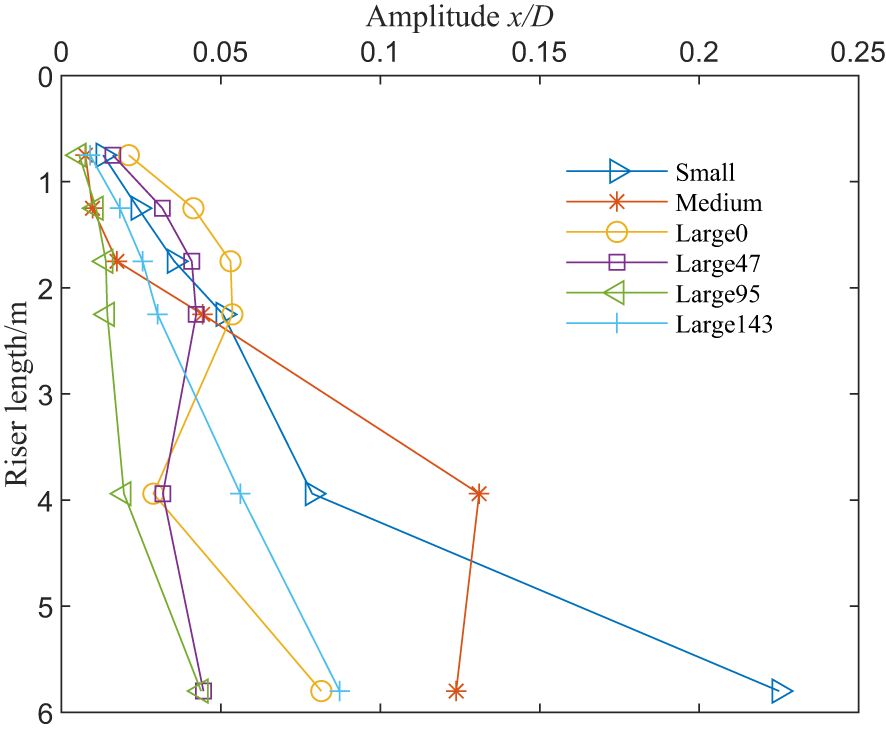
Figure 8 Amplitude along with the risers.
3.2 Vibration amplitude along the riser model
According to the structural dynamic theory concerning the cantilever beam, it is postulated that the vibration amplitudes of the riser model is related to the distance from the fixed end of the riser model in a nearly cubic fashion. In fact, when the excitation of waves is modeled as external loads mainly applied within a narrow band near the water surface, the deformation of the riser model can be satisfactorily described as a cubic function of the distance from the fixed end. Figure 9 shows the variation of the vibration amplitude of the Small model with the distance from the fixed end under the load cases of #3 and #12. The cubic functions calculated by fitting the measured vibration amplitudes are also included here. It is noted that the vibration amplitude is defined as the standard deviations of the time series of displacements obtained from the wave basin test.
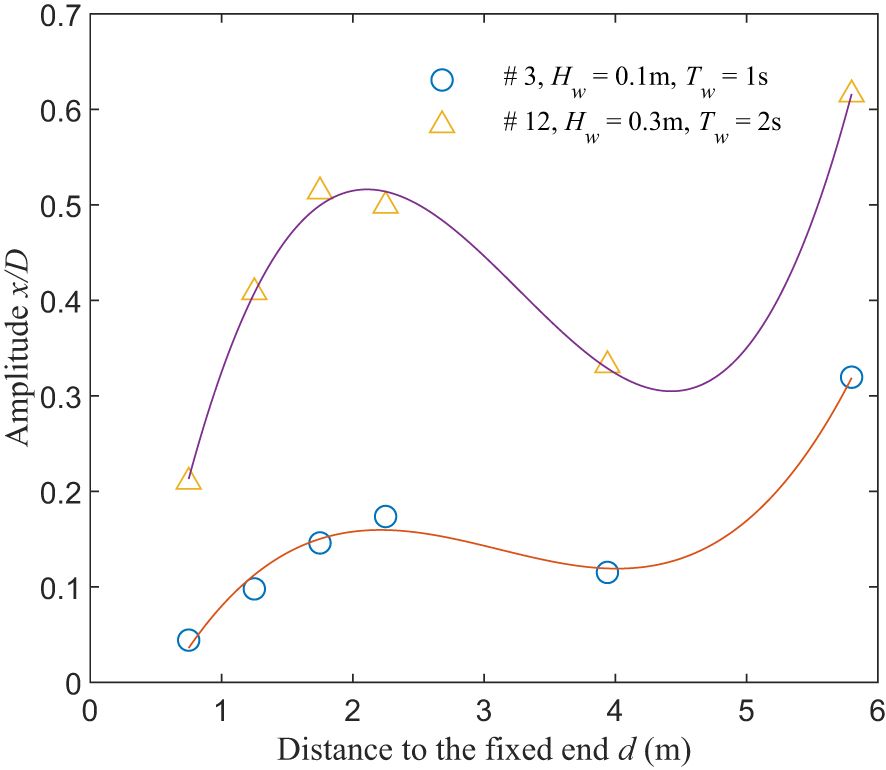
Figure 9 Amplitude with the distance to the fixed end.
The agreement shown in Figure 9 between the vibration amplitudes and the fitted cubic function indicates that amplitudes of wave-induced vibration beneath the water surface can be satisfactorily estimated via the wave-induced vibrations observed near the water surface. The coefficients of the fitting function differ due to their wave height and period. As the wave height period increases, the corresponding absolute value of the coefficient also increases.
3.3 Vibration amplitude with scale ratio
In the present study, both geometry similarity of the pipe and wave load similarity are considered following the Froude criterion. Froude number for each wave load case (#1 ~ #11) corresponding to different pipes is approximately equal. Figure 10 compares the nondimensional amplitude for these eleven load cases with different scale ratios. Theoretically each curve with the same Froude number should be a horizontal line. It is shown that dimensionless amplitude decreases with scale ratio almost linearly for case #1, #2, #4 and #7; while for the other group the curve shows a hill shape. Apparently, the straight lines occur when the wave height and period are both small in these cases nonlinearities are not that intense. Vibrations are influenced mainly by the magnitude of the wave forces. Also, it should be mentioned that the bending stiffness can not be exactly scaled down. In fact, it is smaller than its theoretical value, which makes the vibration frequency near the natural frequency for Medium model causing a larger amplitude, i.e. the hill-like curves. In the later case, the nonlinearity increases with the wave hydrodynamics and the structural characteristics start to play the dominant roles. Therefore, these results indicate a greater impact of structural properties of the riser than fluid characteristics given nonlinear enhancement of waves.
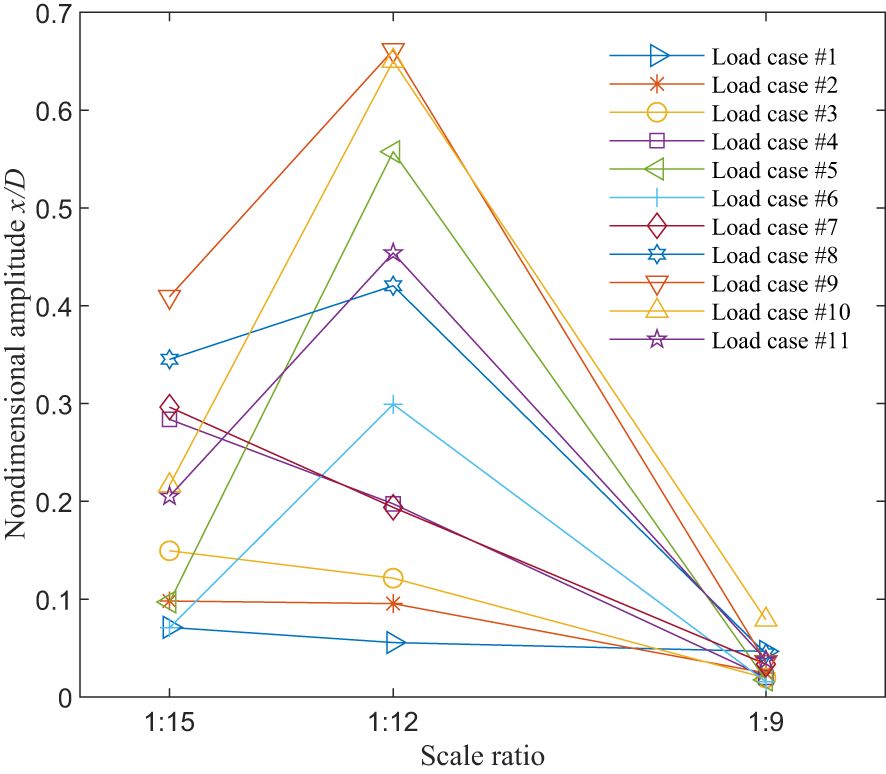
Figure 10 Vibration amplitude x/D with different scale ratios.
3.4 Influence of wave periods
As in the VIVs, it is concerned that the resonance occurred in the wave-induced vibration could bring significant damages to the riser. Therefore, it is interesting to reveal the connections between the amplitudes and the wave periods. Figure 11 shows the variation of the wave-induced vibration amplitudes with the wave period for the riser models without slotted weights, i.e. the Small, Medium and Large0 models. Since it is shown that the vibration amplitudes of the entire riser model can be well represented by the those near the water surface, these amplitudes shown here all corresponds to the sampling point of P2. It is noted that the load cases are in association with different wave heights. While the wave heights in the load cases of #1~6 are 0.1m, the wave heights in the load cases of #7~11 are 0.2m.
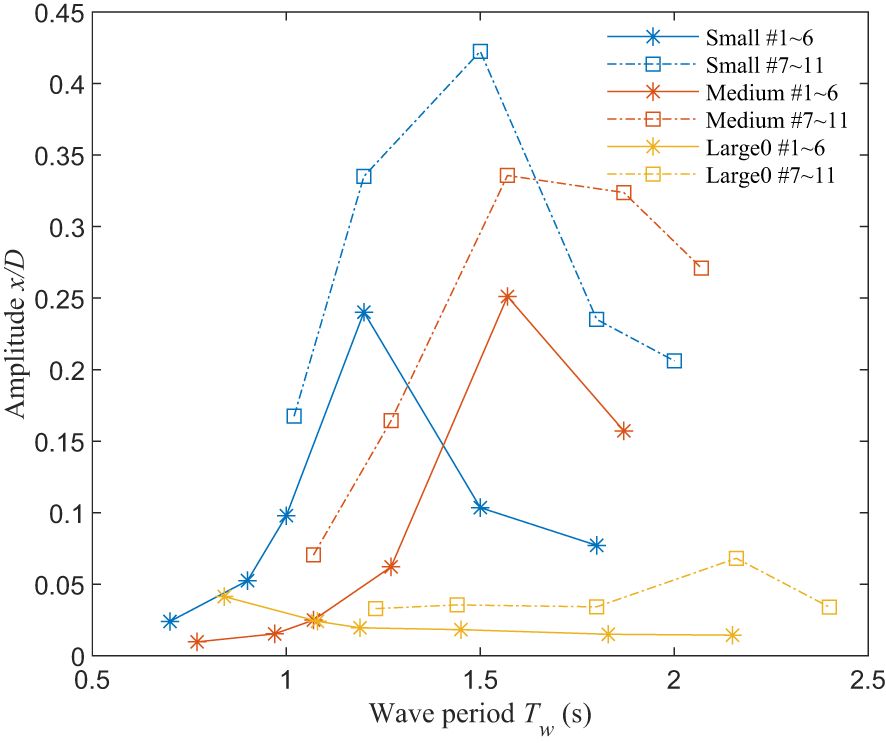
Figure 11 Variation of amplitude with wave period for different pipes: # 1~6, Hw = 0.1m; # 7~11, Hw = 0.2m.
It is shown from the figure that vibration amplitudes first increase with the wave periods and then decreases with a peak appeared in the middle. The only exception is found for the Large model in the load case with the wave height of 0.1m, and can be explained as the wave excitation is not strong enough to induce the resonance. Other curves shown in Figure 11, on the other hand, contain a resonance peak illustrate the importance of wave periods in describing the wave-induced vibration. To be more specific, the natural frequencies of different riser models are calculated and compared to the wave periods corresponding to the resonance peaks. In detail, the natural frequencies of the riser model are estimated (Equation 8) according to Lee and Allen (2010) as
,
where n is the selected mode number, and are the nth natural frequency or period of the riser model, m and are the mass and the length of the riser model; shows the bending stiffness and is the initial tension. Table 5 compares the periods corresponding to the resonance peak shown in Figure 11 with the natural frequencies of the corresponding riser model. For the Small model, the resonance peaks are observed at Tw = 1.2s (Hw = 0.1m) and 1.5s (Hw = 0.2m), which is near the second natural period of this pipe (Tn = 1.1s). For the Large0 model, the frequencies corresponding to the resonance peaks are 0.84s (Hw = 0.1m) and 2.16s (Hw = 0.2m), which agrees with the corresponding first and second order natural frequencies.
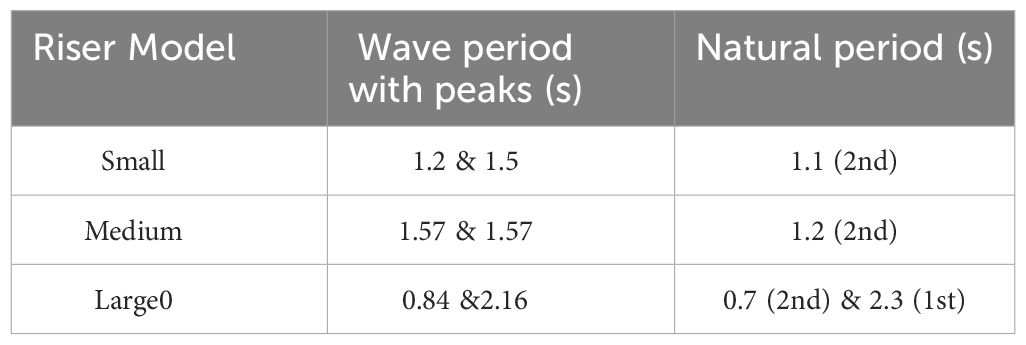
Table 5 Wave periods with peaks and natural periods of different model.
3.5 Influence of the top tension
As revealed in Figure 11 and Table 5, the resonance occurs when the periods of the wave excitation are close to the natural periods of the riser model. Since the natural frequency is related to not only the bending stiffness, but also the tension when the riser behaves as a string, it is reasonable to suggest that the wave-induced vibrations is influenced by the top tensions applied to the model.
Figure 12 depicts the time history of the fluctuating tension, strain and non-dimensional vibration displacement and their corresponding spectrum for Small pipe at Load case #1. The second column in the figure is the initial part of the first column to present a close look on the vibration curves. It’s shown that top tension, strain and displacement are nearly in phase and there is no hysteresis among them. In addition, the dominant frequency corresponding to tensions, strains and vibrations are the same (~1.4 Hz) in this specific case. Such simultaneous measurements of top tension and vibration under the excitation of waves indicate that waves cause the variation in the tension with no lag comparing to the dynamic vibration of the riser model.
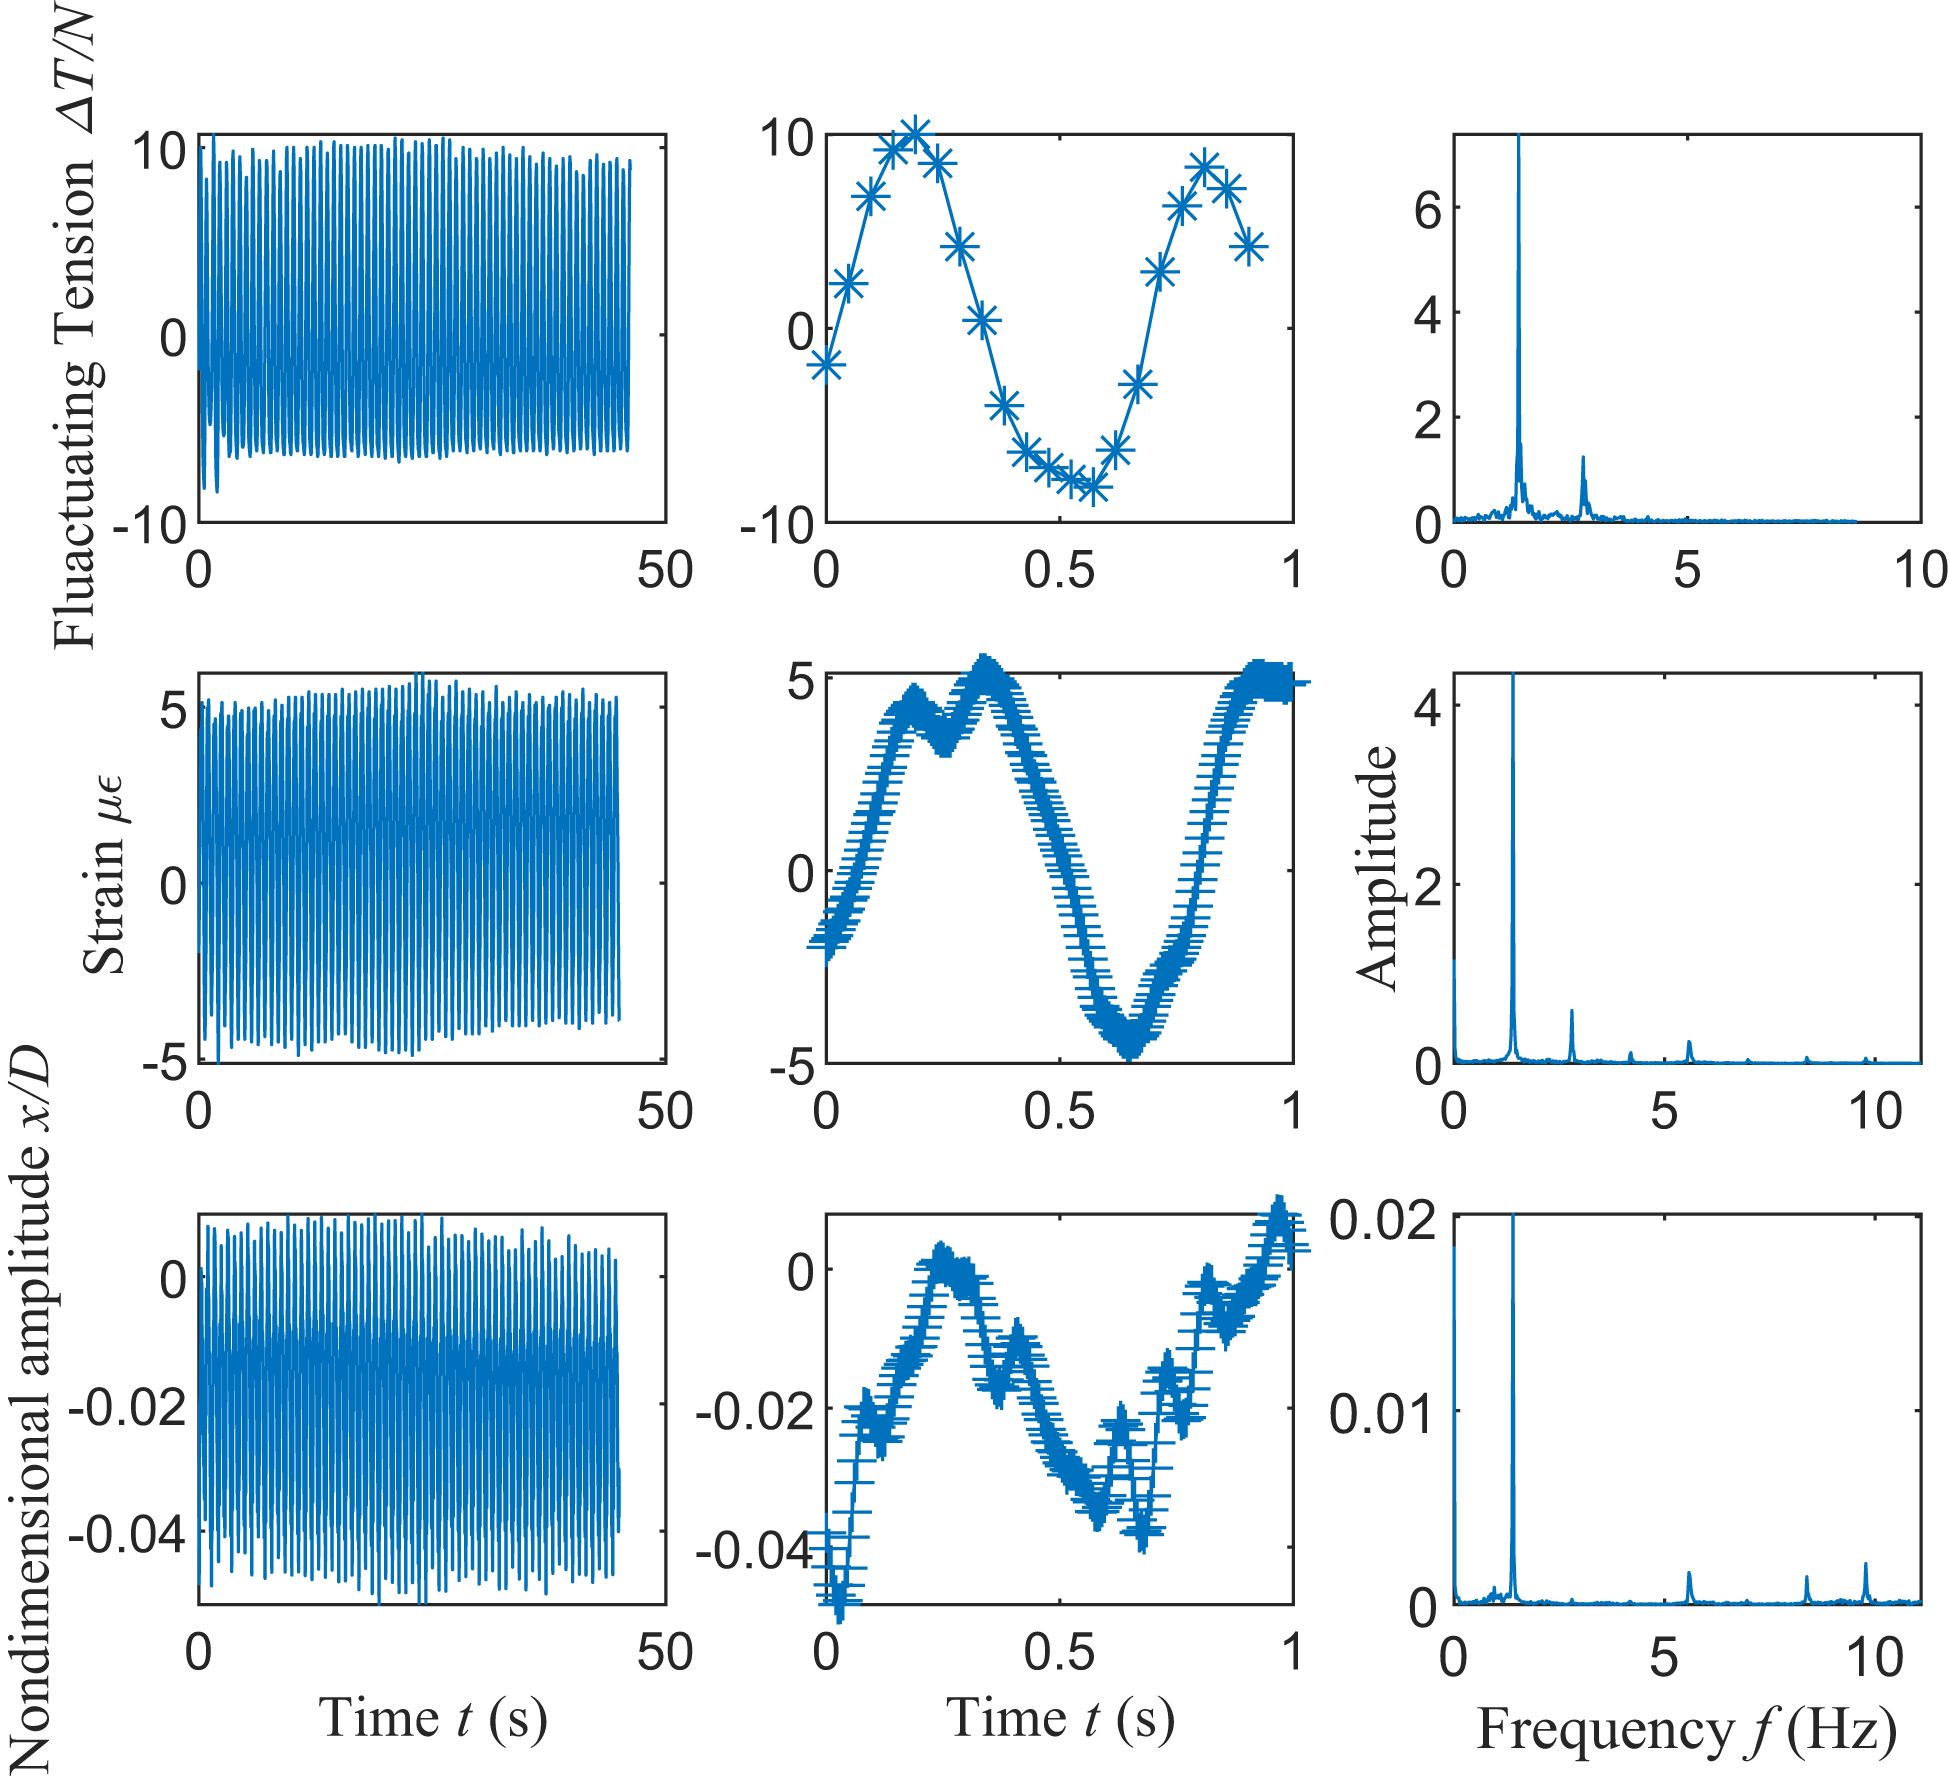
Figure 12 Time history and spectrum of fluctuating tension, strain and dimensionless displacement (Small pipe, Load case #1).
Figure 13 shows the variation of the amplitude with the initial tension at sampling point P2 corresponding to the models with different slotted weights, i.e., the Large0 model to Large143 model. Six curves correspond to the first six wave load cases (see Table 4; Supplementary Tables 2, 3). It is observed from the figure that the amplitudes of wave-induced vibration decrease with the top tension monotonically with a rebound at Load case #1, #2 and #4. It maybe because the second order natural period of the Large143 model is close to these wave periods.
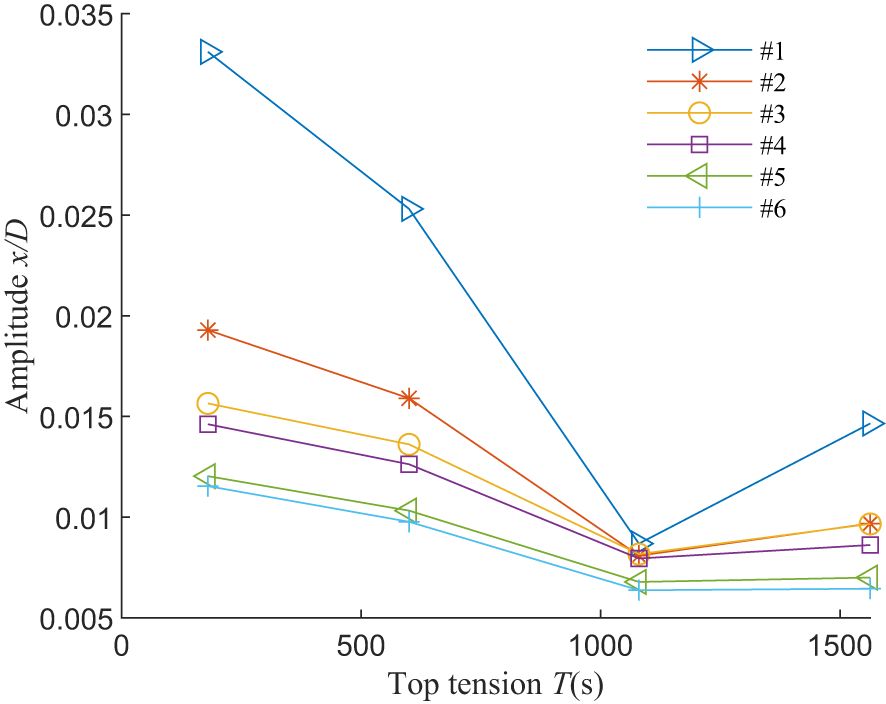
Figure 13 Variation of amplitude with the initial top tension.
3.6 Influence of the KCd·TL2/EI on amplitude
From the investigation on the amplitudes of vibrations under the influences of the distance from the fixed end, the wave period and the initial tensions applied to the riser model, it is suggested that the estimate of the vibration amplitude should take into consideration wave periods and structural properties of the riser model. In addition, it is common knowledge that the wave-induced vibration amplitude is in connection with the wave height, i.e., the strength of external loading, and the bending stiffness of the riser model. Consequently, it is attempted, based on the measurements of the wave-basin experiment, to suggest a dimensionless parameter to estimate the vibration amplitude of risers.
In fluid dynamics, the number is an important dimensionless parameter () that characterizes the periodic wave forces acing on offshore platforms. By definition, the KC number quantifies the relative importance of resistance over inertial forces on blunt bodies in oscillating flows. The present study revised the number to indicate the general strength of the wave loads in a distance of from the fixed end of the riser model. In other words, the present study suggests that the distance from the fixed end ( ) replaces the characteristic length of the bluff body ( ) to deliver a number.
In structural dynamics, is widely used to measure the relative importance of two different mechanism contributed to the total structural stiffness of a riser (Ren et al., 2020). In detail, shows the stiffness resulted from the string-like behaviour, and gives the stiffness of beam-like behaviour. Such a dimensionless parameter is hence borrowed in the present study to show the overall stiffness and to imply the natural frequencies of the riser.
Combing the revised number and the dimensionless parameter of , the present study suggests a new dimensionless number (π1 = KCd·TL2/EI), which comprehensively takes the wave and structure into account, to estimate the amplitude of wave-induced vibrations. Figure 14 shows the amplitude normalized by the cubic of the distance x at sampling points P1 to P6 as a function of for six models. It is concluded that the normalized amplitude collapse into a single curve described by a function of π1. The amplitudes at the sample point P1 agree with the global trend but their magnitude are one order larger than the value at P2 to P6. There are two ways this could be interpreted. The first one is this P1 is above the water surface which leads to different loading and vibration. The other one is near the fixed end where the boundary condition has primary effect. So the conclusion here predicting wave-induced vibrations is not applicable to the sampling point which is above the water surface or near the boundary (x/L< 0.2). That is the limitation of the proposed dimensionless parameter. While it is suitable to describe the wave-induced vibration for those underwater and away from the boundary (x/L > 0.2).
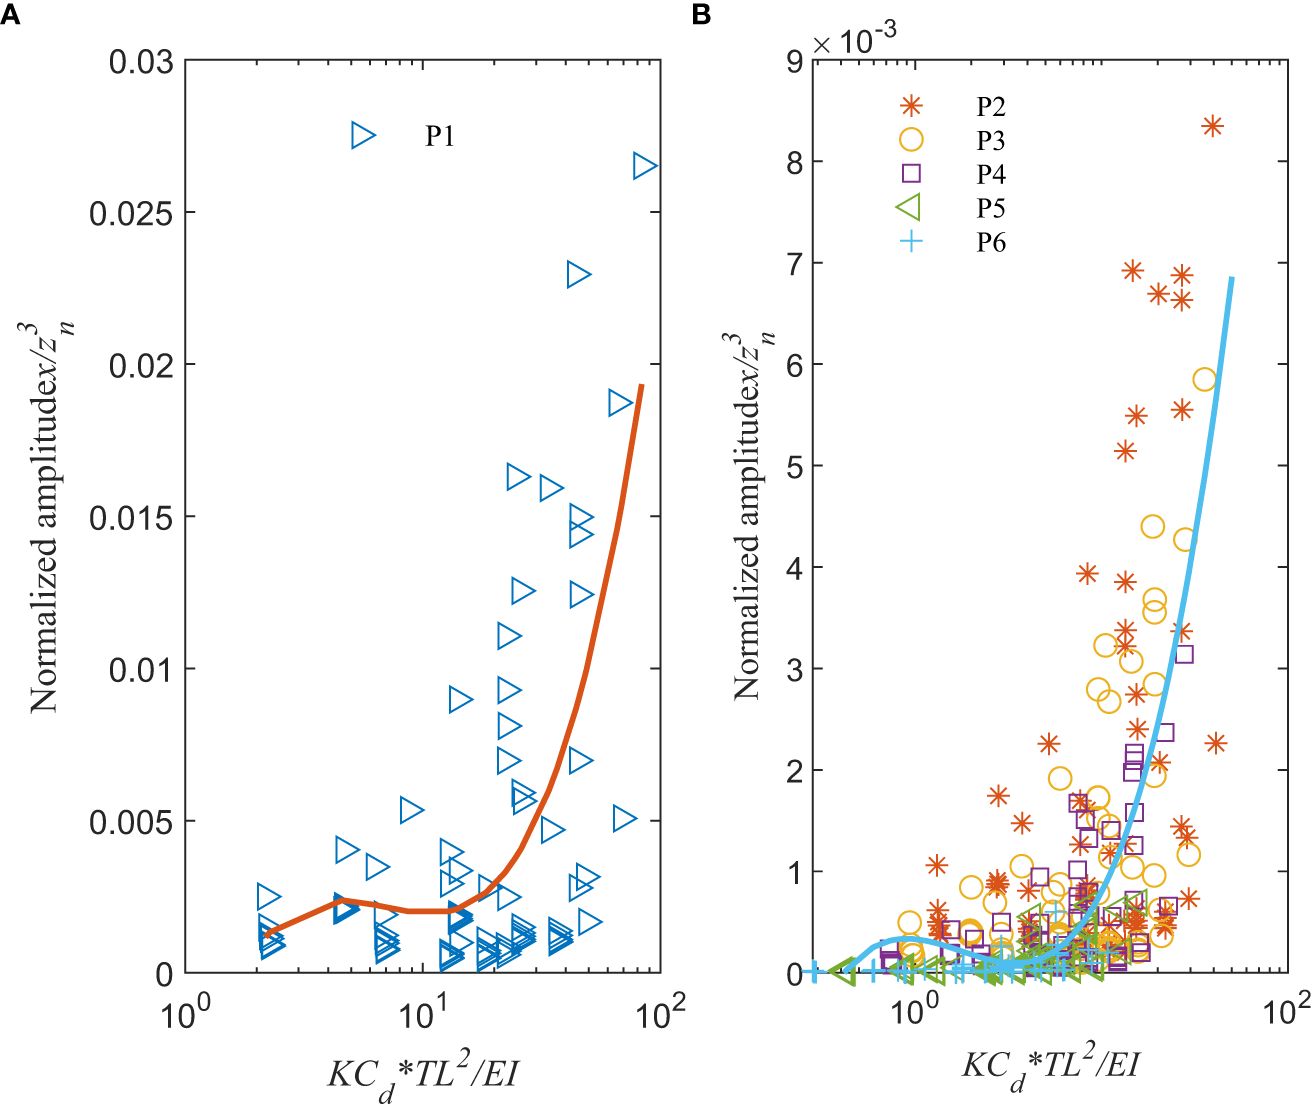
Figure 14 Variation of normalized amplitude with KCd*TL2/EI for six pipes: (A) P1; (B) P2~P6.
It is discerned from the figure that the normalized vibration amplitudes monotonically increase with the dimensionless parameter of . In fact, it is found that the normalized amplitude marginally increases when is below 10, and the increase is significantly expanded when . From such an observation, it is suggested that further studies can be conducted separately for the wave-induced vibration of risers corresponding to the regime of and .
3.7 Dominant vibration frequency
Figure 15 shows the dominant vibration frequency reduced by wave incidence frequency between different sampling points of each pipe. It’s obvious from the figure that the dominant frequency of the vibration agrees, in most cases, the wave incident frequency. In certain cases, the dominant frequency of vibration is 2, 3, 5, or 6 times the wave frequency. In Figure 15C, the dominant frequency of Large0 pipe under conditions # 4 and # 8 ~ #9 is twice the wave frequency; while it is threefold under conditions # 10~# 13 and fivefold (0.51Hz vs 2.49Hz) under conditions # 13 for the Small pipe. It should be noted that different sampling points have different frequency component at the same load case. P5 and P6 usually have higher dominant frequency and more spectral components. The generation of the multi-frequency is related to the higher-order components generated by waves passing through a cylinder. The displacement at the lower end of the pipe to be delayed compared to the displacement at the upper end. The lower end of the riser has not yet returned to its equilibrium position Thus, the displacement at the lower end is excited by the superposition of multiple waves.
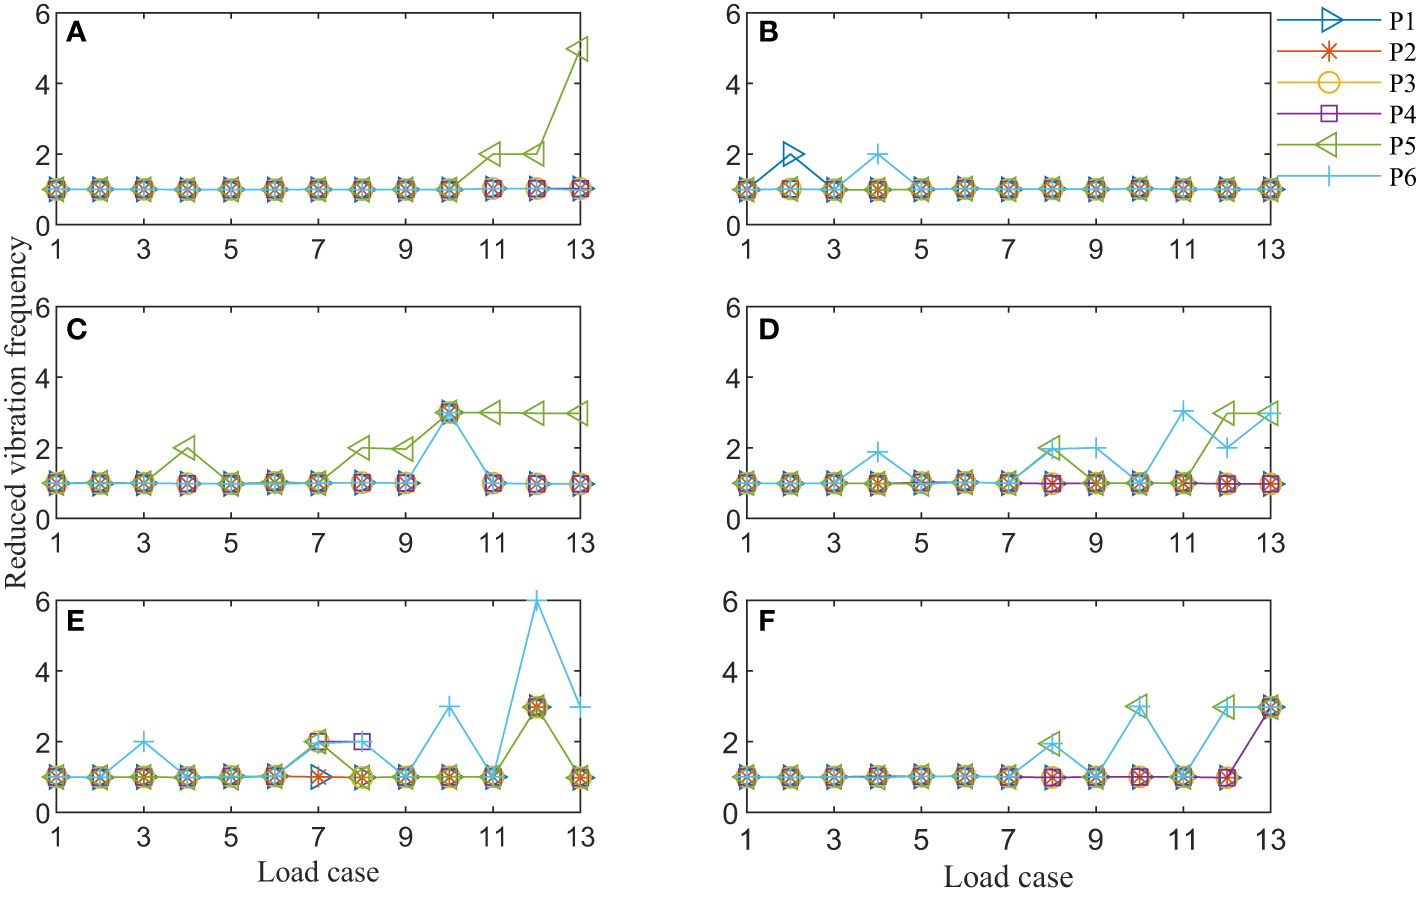
Figure 15 Dominant frequency at different sampling points normalized by wave frequency: (A) Small; (B) Medium; (C) Large0; (D) Large47; (E) Large95; (F) Large143.
4 Conclusion
Multiple scaled riser model tests under regular waves were conducted in a wave basin to study the scale effect of riser in waves. Considering that the hydrodynamic geometries and the structural stiffness are the most influential factors in determining the dynamic responses of a riser under the excitation of waves, the present study offers a novel design of the scaled-down model of risers combing the disconnected PVC tubes with steel core rod.
Using the novel riser models, a series of wave-basin tests were carried out with different wave kinematics and riser models at different geometric scales. The results show that the vibration amplitude of the riser model is a cubic function with the distance x from the fixed end. When the wave height is constant, the amplitude of wave-induced vibrations varies with the wave period showing a resonance peak around the pipe’s natural period. Based on the measurement concerning the wave-induced vibrations along the riser model, a dimensionless number π1 = KCd·TL2/EI is introduced where L is the pipe length, EI is the bending stiffness, T is the top tension and the characteristic length in the KC number is taken as the distance x. The normalized amplitude of the wave-induced vibration is found increase with this parameter. While the increase of normalized vibration amplitude is only marginal when , it significantly expanded when .
Data availability statement
The original contributions presented in the study are included in the article/Supplementary Material. Further inquiries can be directed to the corresponding author.
Author contributions
YF: Conceptualization, Data curation, Formal analysis, Investigation, Methodology, Resources, Software, Validation, Visualization, Writing – original draft, Writing – review & editing. SL: Conceptualization, Funding acquisition, Investigation, Methodology, Project administration, Supervision, Visualization, Writing – review & editing. DC: Conceptualization, Funding acquisition, Project administration, Supervision, Writing – review & editing.
Funding
The author(s) declare financial support was received for the research, authorship, and/or publication of this article. The work described in this article was supported by the grants from Guangdong Basic and Applied Basic Research Foundation (Project No. 2022B1515130006). The authors acknowledge the support from the Tsinghua Shenzhen International Graduate School - Shenzhen Pengrui Young Faculty Program of Shenzhen Pengrui Foundation. The numerical computations reported in the manuscript were partially performed at the Hefei Advanced Computing Center.
Acknowledgments
We would like to thank the reviewers of this manuscript for their helpful and insightful comments.
Conflict of interest
The authors declare that the research was conducted in the absence of any commercial or financial relationships that could be construed as a potential conflict of interest.
Publisher’s note
All claims expressed in this article are solely those of the authors and do not necessarily represent those of their affiliated organizations, or those of the publisher, the editors and the reviewers. Any product that may be evaluated in this article, or claim that may be made by its manufacturer, is not guaranteed or endorsed by the publisher.
Supplementary material
The Supplementary Material for this article can be found online at: https://www.frontiersin.org/articles/10.3389/fmars.2024.1372676/full#supplementary-material
References
Bearman P., Johanning L., Owen J. (2001). Large scale laboratory experiments on vortex-induced vibration, 20th International Conference on Offshore Mechanics and Arctic Engineering (Rio de Janeiro, Brazil: ASME).
Chang Y., Wu X., Chen G., Ye J., Chen B., Xu L., et al. (2018). "Comprehensive risk assessment of deepwater drilling riser using fuzzy Petri net model," Transactions of The Institution of Chemical Engineers. Process Saf. Environ. Protection Part B 117, 483. doi: 10.1016/j.psep.2018.05.021
Gao D., Deng Z., Yang W., Chen W. (2021). Review of the excitation mechanism and aerodynamic flow control of vortex-induced vibration of the main girder for long-span bridges: A vortex-dynamics approach. J. Fluids Structures 105. doi: 10.1016/j.jfluidstructs.2021.103348
Gao Y., Fu S., Cao J., Chen Y. (2015). “Experimental study on response performance of VIV of a flexible riser with helical strakes,” in Chinese Ocean Engineering Society, vol. 29, 673.
Huang W. P., Wu X. M., Liu J., Bai X. L. (2022). Dynamics of Deepwater Riser: Theory and Method (Shanghai, China: Shanghai Jiao Tong University Press). doi: 10.1007/978-981-16-2888-7
Jauvtis N., Williamson C. H. K. (2004). The effect of two degrees of freedom on vortex-induced vibration at low mass and damping. J. Fluid Mechanics 509, 23. doi: 10.1017/S0022112004008778
Joseph R. S., Wang J., Ong M. C., Jakobsen J. B. (2017). Vortex-induced vibration (VIV) effects of a drilling riser due to vessel motion. IOP Conf. Series: Materials Sci. Eng. 276. doi: 10.1088/1757-899x/276/1/012013
Lee L., Allen D. (2010). Vibration frequency and lock-in bandwidth of tensioned, flexible cylinders experiencing vortex shedding. J. Fluids Structures 26, 602. doi: 10.1016/j.jfluidstructs.2010.02.002
Li M. (2013). An investigation of scale effects in the vortex-induced vibration model test of of risers (Shanghai, China: Shanghai Jiao Tong University).
Liang T., Xu Y., Fu S., Ren H., Zhang M., Song B. (2023). Wave-induced fatigue and VIV-induced fatigue of a free-hanging riser. J. Vibration Shock 42, 313. doi: 10.13465/j.cnki.jvs.2023.18.035
Luo W. (2022). Research on Fatigue Characteristics of Subsea Wellhead Connector Considering the Action of Riser Wave-Induced (Beijing, China: China University of Petroleum).
Manning M. (2016). Offshore oil production in deepwater and ultra-deepwater is increasing (Washington, DC: U.S. Energy Information Administration).
Ren T., Fu S., Li R., Yang J. (2011). Full scale riser Vortex-Induced-Vibration response prediction based on model test. J. Ship Mechanics 15, 364.
Ren T., Xu Y.-w., Wang J., Ren H.-j., Zhang M.-m., Fu S.-x., et al. (2020). An experiment study of vortex induced vibration of a steel catenary riser under steady current. J. Hydrodynamics 32, 834. doi: 10.1007/s42241-020-0067-4
Zhang C., Kang Z., Stoesser T., Xie Z., Massie L. (2020). Experimental investigation on the VIV of a slender body under the combination of uniform flow and top-end surge. Ocean Eng. 216, 108094. doi: 10.1016/j.oceaneng.2020.108094
Zhang W., Yang J., Hu Z., Xiao L. (2007). The experimental and numerical analysis for a deep-water semi-submersible platform. J. Shanghai Jiao Tong Univ. 41, 1429.
Keywords: gravity wave, scale effect, wave-induced vibration, similarity theory, fluid-structure interaction
Citation: Feng Y, Li S and Chen D (2024) Tensioned flexible riser vibrations under wave excitation, an investigation on the scale effect. Front. Mar. Sci. 11:1372676. doi: 10.3389/fmars.2024.1372676
Received: 18 January 2024; Accepted: 20 March 2024;
Published: 09 April 2024.
Edited by:
Zhenkui Wang, Zhejiang University, ChinaReviewed by:
Xipeng Wang, Hangzhou City University, ChinaYang Qu, Beijing University of Technology, China
Copyright © 2024 Feng, Li and Chen. This is an open-access article distributed under the terms of the Creative Commons Attribution License (CC BY). The use, distribution or reproduction in other forums is permitted, provided the original author(s) and the copyright owner(s) are credited and that the original publication in this journal is cited, in accordance with accepted academic practice. No use, distribution or reproduction is permitted which does not comply with these terms.
*Correspondence: Sunwei Li, li.sunwei@sz.tsinghua.edu.cn