A multidisciplinary approach to describe population structure of Solea solea in the Mediterranean Sea
 Rachele Corti1*†
  Elisabetta Piazza1†
  Enrico Nicola Armelloni2,3
  Alice Ferrari1
  Audrey J. Geffen4
  Gregory E. Maes5 Francesco Masnadi2,3
  Castrense Savojardo6
  Giuseppe Scarcella3
  Marco Stagioni7
  Fausto Tinti1 Alex Zemella1
  Alessia Cariani1*
- 1Department of Biological, Geological and Environmental Sciences (BiGeA), University of Bologna, Ravenna, Italy
- 2Department of Biological, Geological and Environmental Sciences (BiGeA), University of Bologna, Bologna, Italy
- 3National Research Council, Institute for Biological Resources and Marine Biotechnology (CNR-IRBIM), Ancona, Italy
- 4Department of Biological Sciences, University of Bergen, Bergen, Norway
- 5Laboratory of Biodiversity and Evolutionary Genomics, University of Leuven, Leuven, Belgium
- 6Department of Pharmacy and Biotechnology, University of Bologna, Bologna, Italy
- 7Marine Biology and Fisheries Lab - Department of Biological, Geological and Environmental Sciences (BiGeA), University of Bologna, Fano, Italy
Investigating marine species population structure in a multidisciplinary framework can reveal signatures of potential local adaptation and the consequences for management and conservation. In this study we delineate the population structure of common sole (Solea solea) in the Mediterranean Sea using genomic and otolith data, based on single nucleotide polymorphism (SNPs) markers, otolith shape and otolith trace element composition data. We correlated SNPs with environmental and spatial variables to evaluate the impact of the selected features on the actual population structure. Specifically, we used a seascape genetics approach with redundancy (RDA) and genetic-environmental association (GEA) analysis to identify loci potentially involved in local adaptation. Finally, putative functional annotation was investigated to detect genes associated with the detected patterns of neutral and adaptive genetic variation. Results from both genetic and otolith data suggested significant divergence among putative populations of common sole, confirming a clear separation between the Western and Eastern Mediterranean Sea, as well as a distinct genetic cluster corresponding to the Adriatic Sea. Evidence of fine-scale population structure in the Western Mediterranean Sea was observed at outlier loci level and further differentiation in the Adriatic. Longitude and salinity variation accounted for most of the wide and fine spatial structure. The GEA detected significant associated outlier loci potentially involved in local adaptation processes under highly structured differentiation. In the RDA both spatial distribution and environmental features could partially explain the genetic structure. Our study not only indicates that separation among Mediterranean sole population is led primarily by neutral processes because of low connectivity due to spatial segregation and limited dispersal, but it also suggests the presence of local adaptation. These results should be taken into account to support and optimize the assessment of stock units, including a review and possible redefinition of fishery management units.
1 Introduction
The marine realm is often characterized by high dispersal of most species, regarded as the major force maintaining connections between populations (Hauser and Carvalho, 2008). Research efforts have been made to challenge the concept of homogeneous marine populations and to identify population structure in marine fish (Reiss et al., 2009). Marine fish population structure can be defined along a continuum ranging from panmictic (e.g., Japanese Spanish mackerel Scomberomorus niphonius (Kitada et al., 2017), and Australian yellowfin bream Acanthopagrus australis (Roberts and Ayre, 2010)) to distinct populations (Haddock Melanogrammus aeglefinus (Berg et al., 2021)). In many cases, genetic studies reveal complex spatial patterns and define fine-scale population structure e.g., European hake Merluccius merluccius (Milano et al., 2014; Westgaard et al., 2017) and horse mackerel Trachurus trachurus (Abaunza et al., 2008; Healey et al., 2020). Complex sets of biophysical processes, along with environmental features, are the main factors in connectivity, but their roles are not fully understood. Such processes influence population differentiation (Cowen and Sponaugle, 2009), at the same time as interaction among connectivity, population size, and environmental conditions. In some cases, fishing pressure acts as a selective force in local adaptation, which maintains or modifies population structure (Hauser and Carvalho, 2008).
Most of fishery resources in the Mediterranean Sea are over-fished and have been exploited at biologically unsustainable levels (FAO, 2020c). Management regulations based on a proper understanding of stockdynamics could help to improve the situation in some areas. Commonly, commercial marine species population status is assessed based on single species and individual stock unit assumptions (Begg et al., 1999; FAO, 1999). Stock units in the Mediterranean Sea are generally enclosed within the Geographical Sub-Areas (GSAs), which are statistical units established by the General Fisheries Commission for the Mediterranean (GFCM) of the Food and Agriculture Organization of the United Nations (FAO) according to geopolitical features and management needs. Improvements in data availability and stock identification methods have revealed incongruities between the spatial structure of biological populations and currently defined stock units (Kerr et al., 2017; Spedicato et al., 2022). This spatial mismatch between biological populations and management units can violate stock assessment model assumptions, which require data representative of the entire population. Therefore, defining the fine-scale population structure of commercially exploited marine species can contribute to the development of sustainable management, affecting both the conservation of resources and the subsistence of fisheries communities (Cope and Punt, 2009; Kerr et al., 2017). Assessing and understanding the genetic population structure of commercially exploited marine fish could provide empirical solutions and provide evidence on the population boundaries, and their reconciliation with the stock units based on GSAs (Quintela et al., 2020). Improved and biologically informed fishery management units are likely to enable more robust stock assessments and enhance effective management and conservation actions (Paris et al., 2018), providing a reliable basis for understanding population dynamics (Casey et al., 2016).
Management goals for fisheries and for the marine environment are not always consistent with biological processes (Reiss et al., 2009), and the requirements of regulatory frameworks rely on information beyond genetic population structure. Patterns of connectivity, migration, and historical distributions may confound a purely genetic map. The addition of biological markers that have a geographic basis, such as parasites, stable isotopes, otolith trace elements, body or otolith morphology are all useful in documenting geospatial and temporal movements of fish. In addition, tagging and biomarkers can often indicate fine-scale sub-population structure that is not apparent in genetic data (Reiss et al., 2009). A combined approach of genetic and geographic markers is a powerful approach to resolve population structure and relevant spatial distribution patterns (Higgins et al., 2010).
Advanced methods for delineating stocks and assessing population connectivity in marine species include molecular techniques, enabled by the high throughput potential of Next Generation Sequencing (NGS) technologies (Ovenden et al., 2015). Genomic tools can substantially increase the resolution for defining management units and help to overcome existing limitations on the use of genetic information in fisheries management schemes (Waples et al., 2008; Bernatchez et al., 2017). By changing the way in which sequence data are produced, NGS enabled the transition from population genetics to population genomics research in marine fishes (Willette et al., 2014), offering new possibilities for management of marine resources (Hemmer-Hansen et al., 2014; Valenzuela-Quiñonez, 2016). For instance, the application of Single Nucleotide Polymorphism (SNP) markers revealed a strong differentiation among geographical samples in the European hake (Merluccius merluccius) and the further detection of a fine-scale genetic population structure in the Mediterranean Sea (Milano et al., 2014). For both European anchovy (Engraulis encrasicolus) (Catanese et al., 2016) and Atlantic mackerel (Scomber scombrus L.) (Rodríguez-Ezpeleta et al., 2016) the complex structure revealed by SNPs suggests that management as independent units would be more a successful strategy. The advances in genomic tools have also enabled the investigation of the influence of environmental factors on genetic variation (Liggins et al., 2019). Over the past few years, seascape genomics studies have explored both adaptive and neutral genetic patterns in marine species, making use of spatial and oceanographic information (Benestan et al., 2016; Segovia et al., 2020). This approach has become increasingly important in detecting patterns of local adaptation in marine fish populations by assessing functional variation of loci associated with environmental features (Liggins et al., 2019). Several studies have successfully applied seascape approaches in marine fish populations, including several focused on the Mediterranean Sea (Milano et al., 2014; Maroso et al., 2021; Spedicato et al., 2022; Antoniou et al., 2023; Benestan et al., 2023).
Among stock identification methods, markers based on the chemical composition and shape (morphometrics) of otoliths have been successfully used to unravel stock identification and fish movements (Campana and Thorrold, 2001; Higgins et al., 2010; Geffen et al., 2016). Recent studies support the efficiency of otolith shape analysis for studying fish population structure (e.g., European sardine Sardina pilchardus (Jemaa et al., 2015), European anchovy Engraulis encrasicolus (Bacha et al., 2014), blue jack mackerel, Trachurus picturatus (Moreira et al., 2019) and European hake Merluccius merluccius (Morales-Nin et al., 2022). The power of a multidisciplinary approach which combines several data sources and methods to achieve stock delineation has often been demonstrated (Higgins et al., 2010; Pita et al., 2016; Spedicato et al., 2022). The integration of outcomes from different methods provides more robust stock discrimination (Welch et al., 2015; Hussy et al., 2016; Izzo et al., 2017; Paris et al., 2018), confirming the value of a multidisciplinary framework in defining spatial structures of marine species (Cadrin et al., 2014; Cadrin, 2020). By assessing multiple data types, such as genomic and otolith data, a multidisciplinary approach can integrate information on different temporal scales (evolutionary and ecological) to accurately detect the spatial structure of marine populations (Abaunza et al., 2008; Welch et al., 2015; Tanner et al., 2016). This feature is extremely useful to reconcile the temporal disparity between microevolutionary processes, which occur at generational timescales, and ecological-demographic connectivity processes, which become apparent at shorter timescales (Hawkins et al., 2016).
The present study focuses on common sole (Solea solea; Linnaeus, 1758) in the Mediterranean Sea, a demersal species of high commercial interest targeted by large scale (bottom trawlers) and small-scale (mainly gill nets) fisheries (FAO, 2020b). Common sole habitat spreads over the continental shelf of the entire Mediterranean Sea, especially in areas characterized by sandy and muddy bottoms in the Mediterranean Sea and north-eastern Atlantic (Quéro et al., 1986). Sole feed primarily during night period, remaining buried in the seabed during the day. Juveniles preferentially feed on small polychaetes, amphipods, and bivalves, while adult large on bigger polychaetes and holothurians (Beyst et al., 1999; Grati et al., 2013). Given its ecological niche, the common sole is unevenly distributed in the Mediterranean Sea, with more than half of the overall fishery production attributable to Adriatic Sea catches (52%), followed by contributions to the harvest from the Aegean Sea (14%) and the Levantine Sea (11.5%), according to FAO production data 2007-2017 (FAO, 2020a), aggregated by FAO Major Fishing Areas. All other areas account for less than 10% of the Mediterranean harvest of common sole. Historically, heavy fishing pressure has been reduced since the 2010’s, aimed at more sustainable management. These management plans may benefit from updated and fine-scale data on population structure and geospatial patterns. The Mediterranean populations of common sole do exhibit some discernible genetic structure, described as a west-to-east genetic differentiation pattern (Kotoulas et al., 1995; Guarnieo et al., 2002; Rolland et al., 2007). The Adriatic Sea population is also genetically differentiated from the rest of the Mediterranean (Guarnieo et al., 2002; Garoia et al., 2007). Morphology and trace element composition of otoliths have been used to study common sole population structure both in the North-Western Mediterranean Sea and the Atlantic (Mérigot et al., 2007; Cuveliers et al., 2010; Morat et al., 2014, 2013), in the latter area often in combination with genetic markers (Cuveliers et al., 2010; Delerue-Ricard et al., 2019). Several factors could lead to selection processes in Mediterranean populations of common sole which displays ontogenic migrations throughout its life cycle. Local selection pressure is likely the result of abiotic factors such as water temperature, ocean currents and river inflow, and the resulting physical gradients in, temperature and salinity (Fonds, 1979) which, affect the early life history stages (Vaz et al., 2019). Biotic factors such as fish density and the availability of prey are also likely factors for local selection, through their influence on recruitment to adult habitats (Grati et al., 2013).
This study assesses the population structure of common sole in the Mediterranean Sea through the simultaneous use of different markers to gain a better understanding of the differentiation patterns, and ultimately to fill the knowledge gaps on the species stock structure. The analyses aim at delineating the population units from an integrated perspective, by investigating simultaneously individual genomic profile, otolith shape and trace element composition. We also applied a seascape genomics approach to assess the capacity of spatial distribution and environmental drivers to define neutral and adaptive genetic structure in common sole. Finally, we associated each marker to the predicted functional annotation of the genomic region, and we performed a gene enrichment analysis to identify genes potentially involved in processes of local adaptation leading to fine scale differences within the study area.
2 Methods
2.1 Molecular and otolith data
Samples and data analyzed in this study originated from previous efforts carried out in the framework of the EU (European Union) FishPopTrace Project (Martinsohn et al., 2009). Population samples were collected over the period from 1999 to 2009 from 13 geographical sites in the Mediterranean Sea (Figure 1 and Table 1) as detailed in Nielsen et al. (2012). Genotype data at 426 SNP markers were obtained with the GoldenGate ™ (Illumina) high-throughput genotyping assay as described in Helyar et al. (2012) and Milano et al. (2011) and in the Supplementary Materials 1.1.1. Different filtering criteria were applied to the Mediterranean samples, given their lower call rate compared to the Atlantic samples (Diopere et al., 2018). Individuals and loci with more than 20% and 10% of missing data, respectively, were removed from the dataset. Monomorphic markers in the Mediterranean dataset were also discarded prior to the analysis. Details of the evaluation of missing data and filtering procedure are presented in the Supplementary Materials 1.1.2. The final Mediterranean dataset contained 352 individual genotypes at 380 SNPs.
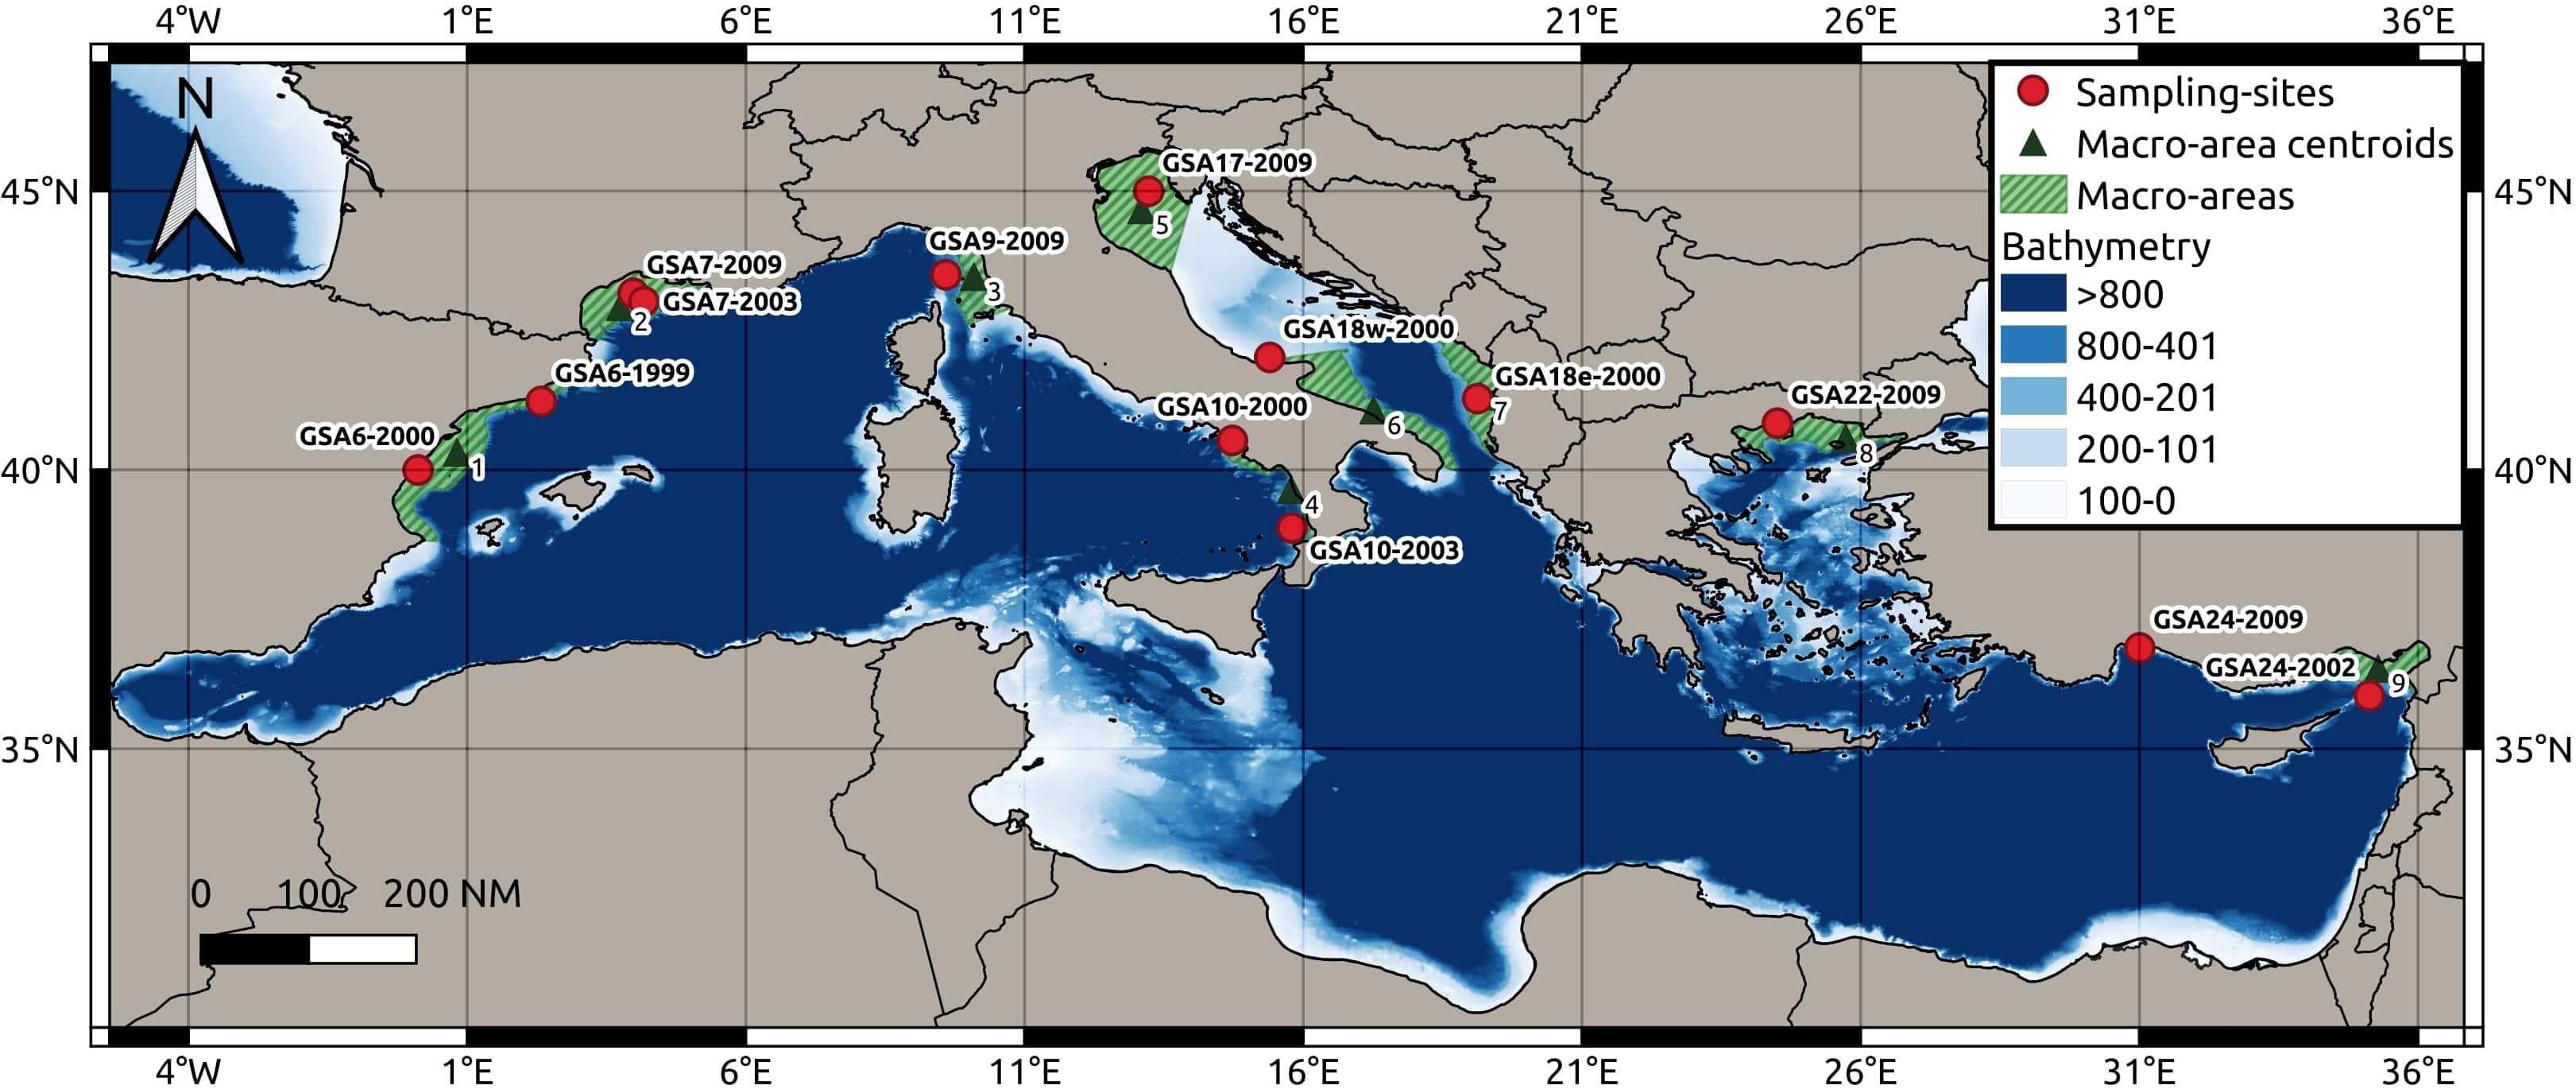
Figure 1 Map showing the 13 sampling sites located in the Mediterranean Sea, centroids of nine macro-areas and bathymetry.
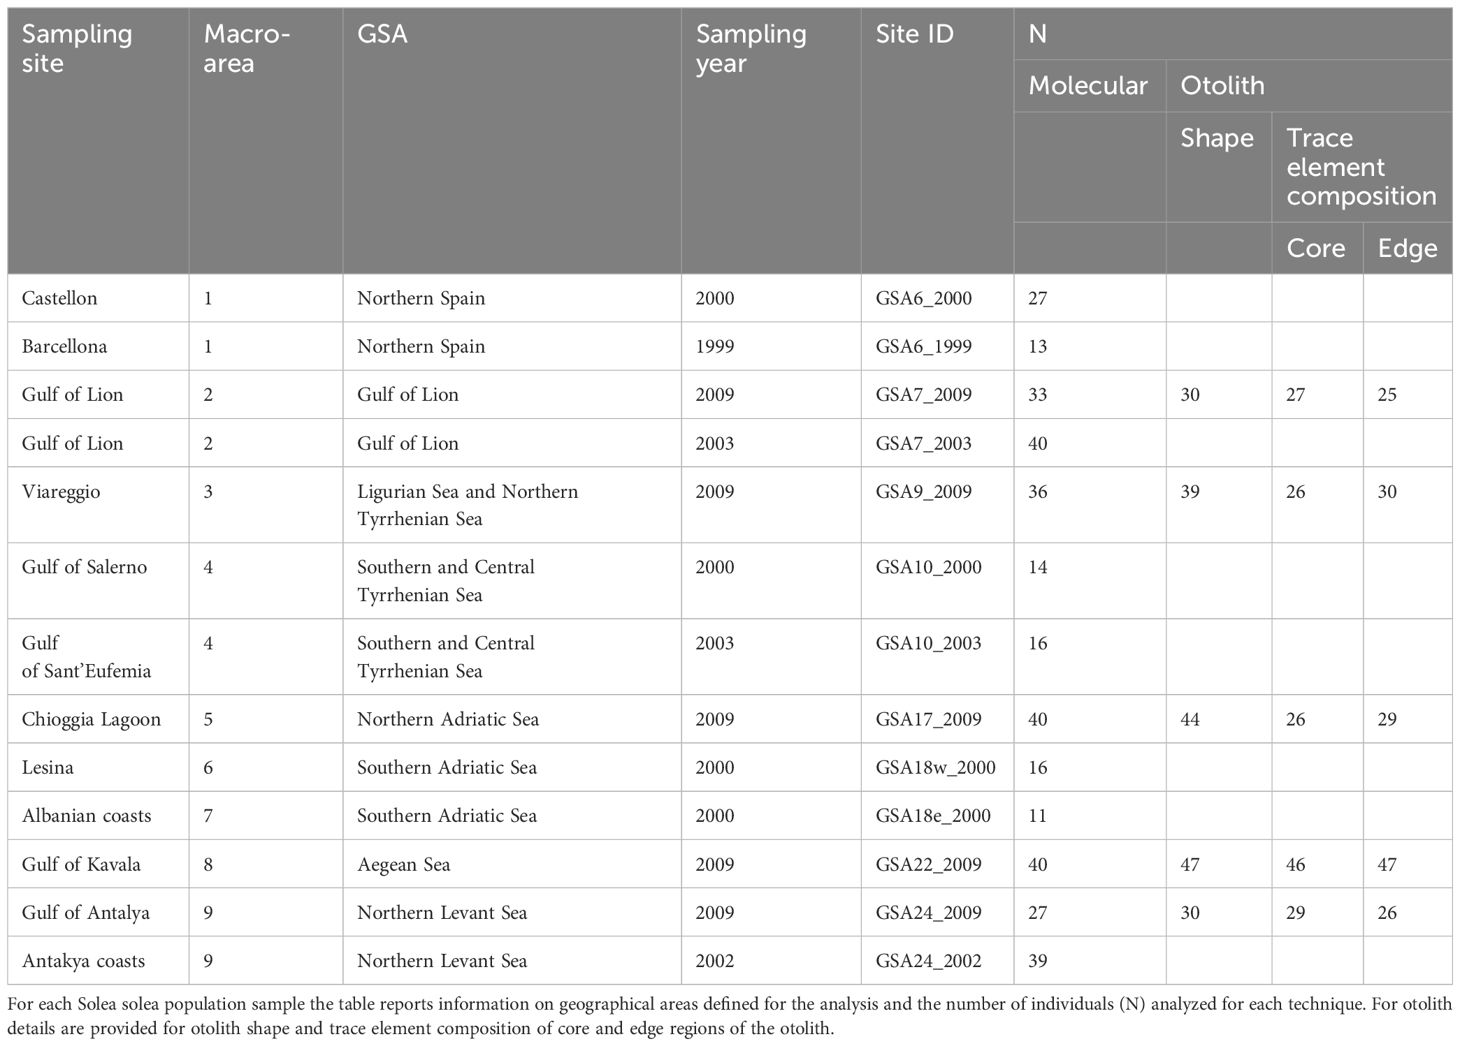
Table 1 Summary information of Mediterranean sampling site locations.
Otolith data were also obtained for population samples from five geographical locations, maximizing the geographical coverage over the Mediterranean Sea (Figure 1 and Table 1), full details of otolith processing and analysis are described in the Supplementary Materials 1.2. In these five sites, the same individuals were processed for both molecular and otolith data. Based on geographical position of the 13 sampling sites, we identified nine centroid locations corresponding to a coastal slice defined as the portion of each GSA delimited by the continental shelf boundaries within the depth of 200 meters (m) (Figure 1). The sampling sites were associated to the nearest centroids for the seascape analyses. We used the geographical coordinates (latitude and longitude) of the centroid for all analyses (Figure 1). R version 3.6.3 was used for all analyses performed within the R environment in this study (R Core Team, 2022).
2.2 Genetic analysis
To assess genetic variation between samples, observed (Ho) and expected (He) heterozygosity, polymorphic rate, and FIS estimate (Weir and Cockerham, 1984) were calculated using Genepop v.4.7.5 R packages (Rousset, 2008), respectively (Supplementary Materials 1.1.3). Global and by locus Hardy-Weinberg (HW) tests were performed using R version of Genepop v.4.7.5 (Supplementary Materials 1.1.3). We estimated global and pairwise values of FST index (Weir and Cockerham, 1984) and relative significance through 10,000 permutations to assess genetic differentiation among populations using strataG R package (Archer et al., 2017) (Supplementary Materials 1.1.4). We then created a heatmap based on FST pairwise comparison to inspect population structure. A Discriminant Analysis of Principal Components (DAPC) was performed with adegenet R package (Jombart, 2008) to identify the individual-based population structure using both the complete and Mediterranean datasets. We ran the method both including as input the optimal number of clusters determined based on the Bayesian Information Criterion (BIC), as well as providing the sampling sites as prior. To describe the genetic structure, the first option allowed us to identify the optimal number of clusters, while the second one is used to assess the quality of the discrimination (Supplementary Materials 1.1.5). Outlier loci were identified using four independent methods: (1) Fast Principal Component Analysis based on the pcadapt R package (Luu et al., 2017), (2) Fst-heterozygosity distribution analysis using the fsthet R package (Flanagan and Jones, 2017), (3) Bayesian analysis using Bayescan version 2.1 (Foll and Gaggiotti, 2008), and (4) the coalescent approach (FDIST) implemented in Arlequin v.3.5.2.2 (Excoffier and Lischer, 2010). Throughout, SNPs with minor allele frequency (MAF) lower than 0.05 were removed from the data set before applying the methods (Bekkevold et al., 2020), FDR was set at 5% and 95% CI was utilized to identify loci with fsthet R package (Flanagan and Jones, 2017). The method implemented in pcadapt R package allows the identification of genetic markers potentially involved in biological adaptation considering their relationship with the population structure, a detailed description of the method is included in Supplementary Materials 1.1.6. We used the FDR correction method transforming the p-values into q-values and we choose α = 0.1 as the threshold for the selection of outlier SNPs (Benjamini and Hochberg, 1995). We used fsthet R package (Flanagan and Jones, 2017) to identify loci with extreme FST values relative to their heterozygosity Ht. Smoothed quantiles from empirical FST-Ht distribution were calculated. Loci lying outside of the quantiles for the 95% confidence level were regarded as outliers. Bayescan relies on differences in allele frequencies between subpopulations to identify candidate loci under selection. Subpopulation specific FST coefficients are divided into two components by logistic regression. The population-specific component β is shared by all loci, and the locus-specific component α is shared by all populations. Specifically, positive values of alpha indicate diversifying selection whereas negative values suggest balancing/purifying selection. For each locus, a posterior probability is computed (Supplementary Materials 1.1.6) and SNPs with prior odds (PO) greater than a threshold are considered outliers. We set prior odds (PO) to 10 since the data set comprised less than 1,000 SNPs and we set the FDR to 5%. We applied FDIST approach implemented in Arlequin v.3.5.2.2 (Excoffier and Lischer, 2010) which uses simulations under an infinite island-model to generate the distribution of FST as a function of heterozygosity. SNPs found in the tails of the distribution are then identified as outliers. P-values were corrected through FDR approach (Benjamini and Hochberg, 1995), and SNPs with an associated p-value lower than 0.05 were considered as putative outliers. We then evaluated the overlap in loci using Venn diagram by visualizing SNPs in common to each method to create datasets of neutral and outlier SNPs that could suggest different patterns of genetic divergence. To create the outlier dataset, we considered the sum of all loci identified as outliers by each method, while the remaining markers constituted the neutral dataset. Genetic differentiation and multivariate analysis (PCA, DAPC) were repeated using the two resulting datasets to compare potential alternative patterns of divergence. To further investigate population structure, we ran STRUCTURE v.2.3.4 (Pritchard et al., 2000) using the datasets of neutral and outlier SNPs as separate inputs (Supplementary Materials 1.1.7).
2.3 Otolith analysis
The variation in both otolith shape and trace element composition was investigated. Otolith contours were extracted from images and Fourier coefficients were calculated using Momocs R package (Bonhomme et al., 2014). The detailed procedures may be found in Supplementary Materials 1.2. We calculated five shape indices: circularity, roundness, ellipticity, form factor and rectangularity (Tuset et al., 2003). In addition, the otolith shape was described through elliptic Fourier descriptors. We identified outliers with Interquartile Range (IQR) method to remove them before statistical analysis. Shape indices were tested for normality and homogeneity of residuals using Shapiro-Wilk Normality test and Levene’s test, respectively. Only normally distributed shape indices were retained for further analysis. To avoid redundancy of the data, Pearson correlations (Mérigot et al., 2007) were calculated using rcorr function in Hmisc R package (Harrell, 2019). We investigated whether the relationship between shape indices and total fish length differed significantly between sampling sites with analysis of covariance (ANCOVA) (Longmore et al., 2010; Keating et al., 2014; Rashidabadi et al., 2020) using the lm R function. If a significant interaction between sampling sites and fish where Y is the shape index, b is the common within group slope of the shape-size relationship and L is the measurement of total fish length (mm) (Keating et al., 2014). We used as slope the coefficient b resulting from the linear regression between total fish length and shape index. ANCOVA analysis was repeated to check that any co-variations were effectively treated (p > 0.01). We then performed a PERMANOVA analysis to uncover differences between geographical samples using adonis function in vegan R package (Oksanen et al., 2022). For the analysis, we computed a dissimilarity matrix using vegdist function with Mahalanobis method (Rashidabadi et al., 2020) and 1,000 permutations. The homogeneity of group dispersion was investigated with betadisper function. Then, we applied pairwise.adonis function in pairwiseAdonis R package to identify significantly different pairs of geographical sites, applying the Benjamini-Hochberg correction for multiple testing.
The first 40 elliptical Fourier harmonics were obtained from each otolith. Each harmonic n is described by 4 coefficients an, bn, cn and dn, a total of 160 elliptical Fourier descriptors (EFDs) were available. We calculated the Fourier power (FP) for each otolith utilizing the calibrate_harmonicpower_efourier to estimate the number of harmonics required for the elliptical Fourier descriptors analysis. Using the efourier function, we computed EFDs, and we obtained a collection of coordinates (Coe object). Through a PERMANOVA analysis on the EFDs, we assessed differences between geographical sites using adonis function in vegan R package (Oksanen et al., 2022). For PERMANOVA analysis we followed the same procedure applied to the shape indices. Canonical analysis of principal coordinates (CAP) was performed on both types of morphometric data to visualize the spatial differences in classification accuracy obtained by leave-one-out cross-validation. We used CAPdiscrim function in BiodiversityR R package to perform the analysis based on Euclidean distances. To determinate the number of PCoA axes (m) to retain in the analysis we follow the general procedure used by Kindt and Kindt (2015). The argument m was set from 1 to 100 in the CAP analysis to explore the difference in the proportion of correct assignment of individuals to groups. Thus, we selected the m with the highest percentage, and we used it for the CAP analysis. After the PCoA, we checked for the percentage of total variance in the dissimilarity explained by the m PCoA axes. We checked that the axes chosen did not exceed 100% of the variance. Furthermore, the SIs and the EFDs were combined to evaluate their discriminatory power. We performed canonical analysis of principal coordinates (CAP) following the same procedure described above.
Trace elements composition data were obtained from core region and edge of sole otoliths using laser ablation inductively coupled mass spectrometry (LA-ICPMS) (Chang et al., 2012; Morales-Nin et al., 2014). After assessment of missing values, we replaced concentration of elements for which more than 25% of values were below the LOD with respective LOD value (Mercier et al., 2011). The final data set for both edge and core comprised 23 Na, 24Mg, 63Cu, 64Zn, 85Rb, 88Sr, 138Ba, 208Pb. Trace element concentrations were log-transformed for further analysis. The same statistical analysis was performed for both core and edge elemental data. Before data analysis, we checked for normality and homogeneity of the residuals with Shapiro-Wilk Normality test (Shapiro and Wilk, 1965) and Levene’s test (Levene, 1960), respectively. The effect of otolith weight on each element was investigated by performing a non-parametric analysis of covariance (ANCOVA) (Moreira et al., 2018; Ferreira et al., 2019). To investigate any effect of otolith weight on trace element concentrations, we calculated Spearman correlations for each element (Geffen et al., 2003; Longmore et al., 2010), using the rcorr function in the Hmisc R package (Harrell, 2019). We performed a non-parametric Kruskal-Wallis statistics to investigate differences in elemental concentrations between geographical sites. We inspected pairwise comparisons between sites for each element through Dunn’s test using dunn.test function with Bonferroni correction for multiple testing. A Discriminant Analysis of Principal Components (DAPC) was performed with adegenet R package (Jombart, 2008) to predict the sampling area membership of each individual using the multivariate element composition assessing the quality of discrimination. As the optimal number of clusters identified using k-means algorithm did not provide evidence of correspondence with individual groups, we used the sampling sites as a prior. We performed a DAPC, following the procedure described in the Supplementary Materials 1.1.5, on a combined dataset created merging genetic and otolith data when available for the same individual, resulting in 82 individuals. This combined dataset was employed to predict the sampling area membership of each individual. We ran two versions of the method, first including as input the optimal number of clusters determined based on the Bayesian Information Criterion (BIC), followed by providing the sampling sites as prior for clusters.
2.4 Environmental analysis
2.4.1 Genetic-environmental association analysis
The spatial structure between geographical sites was represented with distance-based Moran’s eigenvector map (dbMEMs) variables obtained through a distance matrix. To determine the dbMEMs, we first calculated the spatial distance matrix from geographical coordinates (longitude and latitude of centroids) containing the distances between the locations using the gcd.hf function. Then, the distance-based Moran Eigenvector’s Maps (dbMEMs) were computed using the pcnm function in vegan R package (Supplementary Materials 1.3) (Oksanen et al., 2022). In this way, we were able to use spatial variables (dbMEMs) as independent vectors, representing the spatial structure associated with the neighborhood network across different scales, as explanatory variables in the following analysis (Borcard and Legendre, 2002). Environmental variables were downloaded from E.U. Copernicus Marine Service Information according to their availability over the analysis period from 2000 to 2010 (CMEMS, http://marine.copernicus.eu/) (Simoncelli et al., 2019; Teruzzi et al., 2019) and from WorldClim 2.1 (Fick and Hijmans, 2017). From the available products, we selected 17 environmental variables, as reported in Supplementary Materials 1.3, based on their influence on spatial distribution of common sole and their variation between sampling locations (Diopere et al., 2018; Do Prado et al., 2018). To detect multicollinearity, we applied the function vifcor in usdm R package (Naimi et al., 2014; Naimi, 2017) by which highly correlated variables with correlation values (th) greater than 0.65 and with Variance Inflation Factor (VIF) values greater than 2 were excluded (Johnston et al., 2018). In our seascape genomic analysis we considered as environmental factors the resulting set of four variables: the mean meridional component of the currents (northward) (curM, m/s) using the weighted average value in the water column (Wclm) (curM_Wclm_mean), the range of potential temperature (temp, °C) at the bottom (temp_bottom_range), the mean salinity (sal, psu) at the bottom (sal_bottom_mean) and the mean CO2 (ocean pCO2 expresses as carbon dioxide partial pressure) (pco, Pa) (pco_Wclm_mean).
2.4.2 GEA methods
Three different genetic–environment association (GEA) methods (Bayenv2, LFMM and Samβada) were applied to identify loci potentially involved in local adaptation. First, we used Bayenv2, a Bayesian method that identified the SNPs revealing a significant correlation, expressed by a Bayes factor (BF), between their allele frequencies and at least one of the environmental variables. Starting from neutral SNP loci, the method estimates a covariance matrix. The covariance in allele frequencies is used as null model to test the presence of correlation between SNPs and each environmental variable (Coop et al., 2010; Günther and Coop, 2013). Then, we used the cov2cor function to convert that matrix into a correlation matrix and we checked its correlation with the pairwise FST matrix. SNPs with a BF greater than 10 according to Jeffrey’s criterion (Jeffreys, 1961: Kass and Raftery, 1995) can be considered potentially under local adaptation due to a specific environmental factor. Secondly, we used a latent factor mixed model (LFMM) that identifies associations among environmental variables and genotypes, while considering the influence of latent factors such as, in our case, the neutral structure of common sole population as produced by DAPC analysis (K=3) (Frichot et al., 2013; Caye et al., 2019). The correlation between the genotype matrix and the environmental variables is found using hierarchical Bayesian mixed linear models. This method was implemented in the LEA R package (Frichot and François, 2015). We assessed the significance with a p-value of 0.05 after applying the adjustment method FDR. Then, we used Samβada, to detect associations between the genetic data and environmental variables using univariate models that analyze each locus independently. This software uses individual geographical coordinates as a link between environmental and genomics information (Stucki et al., 2017; Duruz et al., 2019). We used the system function of Samβada software available at http://lasig.epfl.ch/sambada to run Samβada from within the R environment. The program returns log-likelihood ratio and Wald test that after Bonferroni correction can be used to assess the significance of correlations between genetics and the environmental variables (α = 0.05).
The dataset of SNPs that resulted as the best candidate loci for local adaptation was determined by retaining those SNPs that were associated with at least one of the environmental variables in at least one of the methods (Bayenv2, LFMM and Samβada). We then conducted a spatial principal components analysis (sPCA), a multivariate method implemented by the function spca of the adegenet R package (Jombart, 2008, 2017), on the resulting set of markers as input data to investigate and identify spatial genetics structure to evaluate clines due to geographic variation. The analysis helped to discriminate whether the genetic variation related to candidate SNP loci due to the association with the environmental variables was more relevant than expected considering only the spatial distribution (Benestan et al., 2016; Segovia et al., 2020). To incorporate the spatial information, we transformed latitude and longitude of centroids into Cartesian coordinates (xy) (Stanley et al., 2018) using the custom R function coord_cartesian found in https://github.com/rystanley/CartDist/blob/master/CartDistFunction.R (Stanley and Jeffery, 2017). The function computes the least-coast distances between each sampling site to account for land barriers. The resulting distance matrix was used to re-project the coordinates into two-dimensional Cartesian space using a non-metric multidimensional scaling (Jeffery et al., 2017; Stanley et al., 2018). We applied the function jitter to spread the xy coordinates in 1 km to obtain different coordinates for each individual and ran the analysis with the Delaunay triangulation as connection network among geographical sites (Jombart et al., 2008; Lehnert et al., 2019). We ran both the global and local test with 9,999 permutations (Jombart, 2017; Lehnert et al., 2019). The linear regressions of the locality scores extracted from the sPCA on each environmental and spatial variable were ran with the purpose of determining which variables significantly explained the genetic variation in the candidate SNPs. Lastly, we computed the R 2adj value to assess the proportion of variance explained.
2.4.3 Redundancy analysis
The effect of spatial distribution and/or environmental factors on both neutral and outlier genetic structure at nine macro-areas was evaluated using a redundancy analysis (RDA), a constrained ordination method used in multivariate analysis (Legendre and Legendre, 2012). We first performed two distinct RDAs using both neutral and outlier SNP datasets as response variable and we combined the spatial factors (dbMEMs) and the environmental factors as explanatory variables. Then, we performed a partial RDA both on neutral and outlier datasets to assess only the influence of environmental factors excluding the effect of the spatial factors on genetic differentiation and vice versa. We created according to the geographical sites a western dataset including individuals of GSA6_1999, GSA6_2000, GSA7_2009, GSA7_2003, GSA9_2009, GSA10_2000 and GSA10_2003 and an eastern dataset including individuals of GSA17_2009, GSA18w_2000, GSA18e_2000, GSA22_2009, GSA24_2009 and GSA24_2002.An RDA on both western and eastern Mediterranean geographical samples was applied, analyzing for both the dataset of 380 SNPs loci. Furthermore, we performed an RDA on the otolith dataset using both otolith shape and elemental composition as response variables and the combined spatial and environmental factors as explained before.
All RDAs were performed using rda function in vegan R package (Oksanen et al., 2022). Following Selmoni et al. (2020) we extracted the first principal component that reaches the 80% of cumulative variance to use them as response variables to compute RDA. The principal components were produced performing a PCA on the standardized matrix using the prcomp function, after transforming the matrix of allele frequencies with the Hellinger approach using the decostand function. We applied the ANOVA and marginal ANOVAs with 1,000 permutations to assess the significance of the global model and of each variable. The adjusted coefficient of determination (R 2adj) was calculated using the RSquareAdj function in vegan R package (Oksanen et al., 2022) to determine the variation explained by the model. Then, we applied the ordistep function with 1,000 permutations to perform both forward and backward selection of explanatory variables that best explained the variability of the response variable (optimal model). As previously explained, we evaluated the significance of the model and each variable.
2.4.4 Gene ontology
Assemblies of representative reference transcriptome were annotated and information available for each transcript of Solea solea was downloaded from SoleaDB database (Benzekri et al., 2014) by using EnTAP (Eukaryotic Non-Model Transcriptome Annotation Pipeline) (Hart et al., 2020) in runP mode employing three different databases. Then, a similarity search and best hit selection was performed using DIAMOND (Buchfink et al., 2015). Sequences were mapped against NCBI non redundant protein, Swiss-Prot and TrEMBL databases with expected E-value set at a maximum of 0.000001 and a minimum coverage set at 70%, followed by Gene Ontology (GO) term assignment with eggNOG mapper and InterProScan (Zdobnov and Apweiler, 2001). The flanking regions (120bp) of the 380 SNPs were BLASTed against the Solea solea assembly found in SoleaDB (Benzekri et al., 2014). We conducted a selection of results of the annotation based on the matches between reference transcript and the corresponding flanking regions containing the SNPs. At this stage we integrated the results of the representative transcript of Solea solea with the unigene ones. For the initial dataset of 380 SNP loci, we kept only sequences with the highest score and the lowest E-value. The same procedure was applied using the Solea senegalensis assembly from SoleaDB database (Benzekri et al., 2014) to integrate missing results. After the reconstruction of GO term graph obtained by retrieving and merging in single sub-graph all the paths from each term to the respective ontology root (Ashburner et al., 2000), we performed a gene enrichment analysis to understand the over representation of GO terms categories in two subsets: SNP loci associated to potential local adaptation (43 loci) and SNP loci associated with environmental variables (148 loci) compared to the complete dataset of 380 markers. The enrichment analysis based on GO terms was performed with a Fisher’s exact test. For the Fisher test, we computed a contingency table for each GO term, counting the number of genes in the SNP loci considered associated or not with the GO term, and the number of genes in the whole dataset associated or not to the GO term to understand the over representation of GO terms categories in the two subsets. The results were expressed by the odds ratio (OR), defined as the ratio of the proportion of a GO term associated with SNP in the subset to the proportion of this GO term outside this set. The larger the odds ratio, the higher the relative abundance of this GO term compared with the entire data set. GO terms for each subset with OR > 2 and α = 0.05 were identified as enriched in the three distinct categories.
3 Results
3.1 Genetic analysis
A decrease in the polymorphic rate of the population samples was found along the west-to-east geographical axis, ranging from 98.68% to 72.11%. Consistently, there was a significant decrease in average observed (Ho) and expected (He) heterozygosity, while no significant differences were found between Ho and He (α = 0.05). After FDR correction only a few SNPs per population sample were found significantly out of HW equilibrium. At the population samples level, no significant deviation from the HW equilibrium was found. Accordingly, the estimates of FIS were low and consistent with levels of heterozygosity (Table 2).
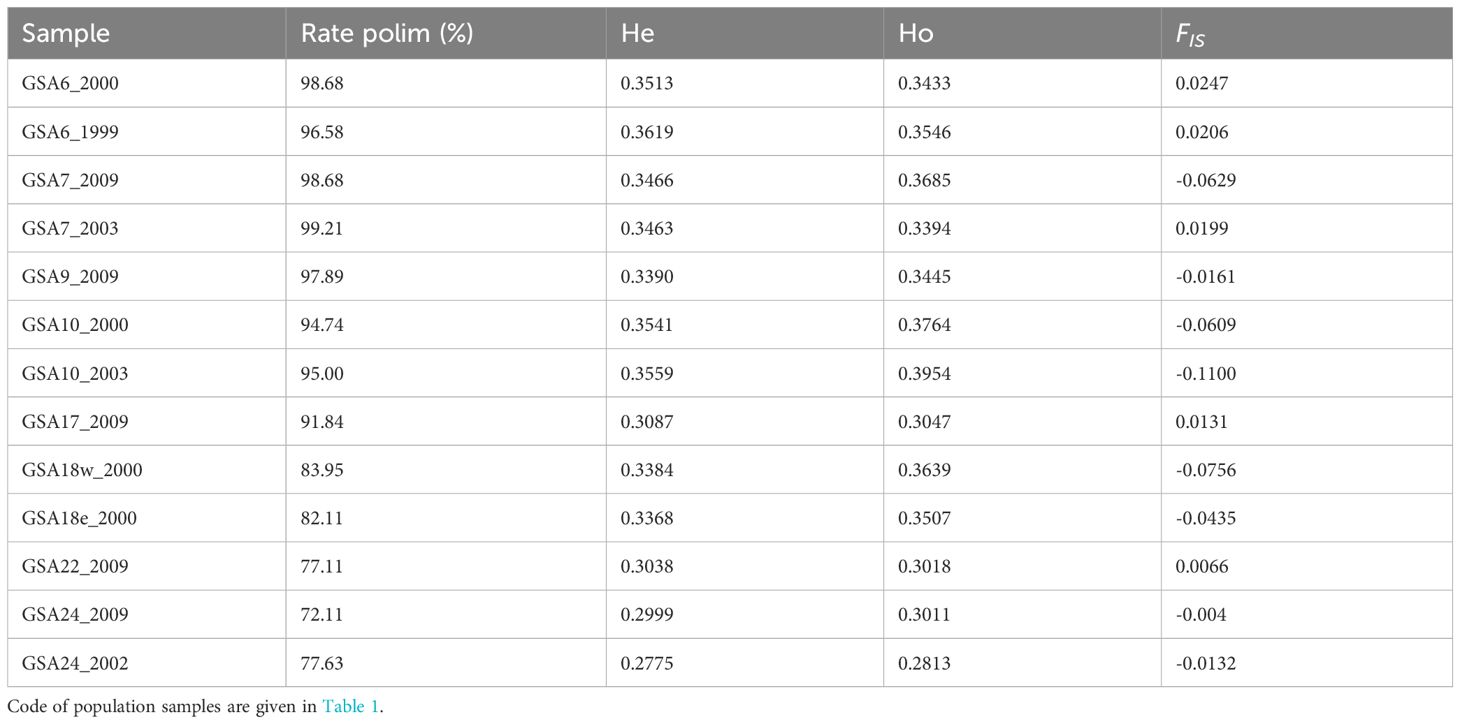
Table 2 Genetic diversity statistics for each population samples of the Mediterranean Solea solea including percentage of polymorphic SNPs rate (Rate polim), mean observed (Ho) and expected (He) heterozygosity, and FIS estimation.
Pairwise FST values ranged from -0.003 to 0.172, with an overall significant FST of 0.069 (p = 0.001). After Benjamini–Yekutieli correction, all pairwise FST remained significant (α = 0.05) except for the comparisons involving samples from GSA6, GSA7, GSA10, GSA17 and GSA18 (Supplementary Figure 1.1). A heatmap of pairwise FST pointed to three main areas with significant levels (α = 0.05) of genetic divergence corresponding to the Western Mediterranean, Adriatic Sea, and Levantine Sea (Figure 2).
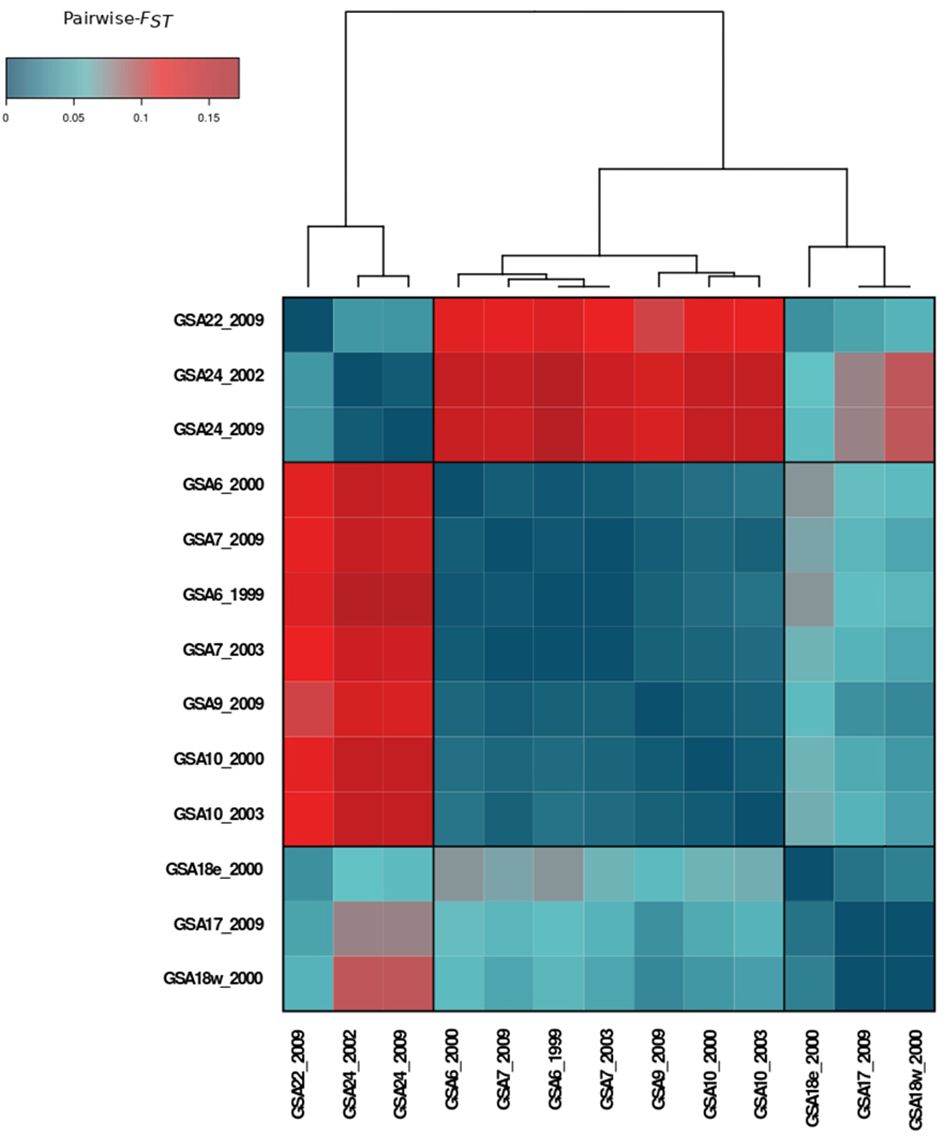
Figure 2 Heatmap of pairwise-FST values among population samples of Solea solea in the Mediterranean Sea computed on 380 SNP loci.
The clustering pattern of population samples resulting from DAPC analysis was concordant with the structure suggested by the genetic pairwise FST. Based on k-means algorithm and the lowest BIC score (Supplementary Figure 1.2A), three clusters were identified as corresponding to three main areas: Western Mediterranean, Adriatic Sea, and Eastern Mediterranean (Figure 3). Western and eastern samples were separated along the first linear discriminant (LD1) axis. Along the second discriminant (LD2) axis a separation between samples from the Aegean and Levantine areas is shown when using prior information about the sampling sites. Moreover, the GSA18e_2000 sample separated from the rest of Adriatic samples and resulted in an intermediate position between samples from other Adriatic sites and Eastern Mediterranean area. In the DAPC analysis performed with prior knowledge of subgroups we retained 125 PCs and five discriminant functions. The proportion of conserved variance for the first two discriminant functions of whole dataset was 83.52% and the proportion of overall correct assignment was 84.38% (Figure 3A). Samples GSA10_2000, GSA10_2003, GSA18w_2000, GSA18e_2000 and GSA22_2009 showed a higher correct assignment rate with respect to the other population samples (Supplementary Figure 1.3A).
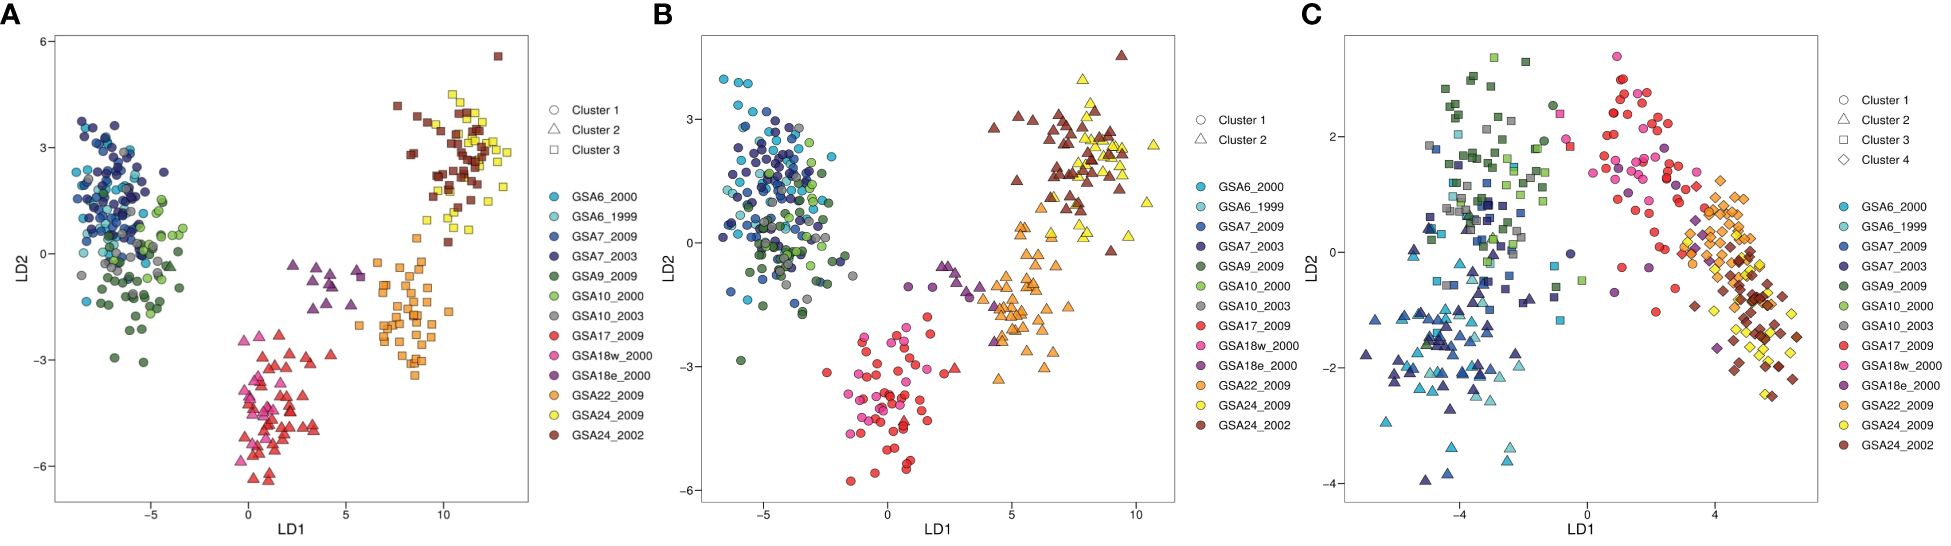
Figure 3 Discriminant Analysis of Principal Components (DAPC) plots of the 13 population samples of Solea solea for whole (A, 380 SNP loci), neutral (B, 337 SNP loci) and outlier (C, 43 SNP loci) dataset. Geographical population samples are color coded according to sampling site, with Site ID reported as in Table 1. The subdivision of individuals according to identified clusters is shown by different geometric shapes.
Methods for outlier detection identified different numbers of SNPs as outliers. The number of SNPs identified by pcadpat (eight SNPs) was not sufficient to reveal the population structure, thus its results were removed from further analysis. However, six of the eight loci resulting from pcadpat were also found by other methods and retained. As outlier, fsthet identified 17 loci, Bayescan identified 34 loci and Arlequin v.3.5.2.2 identified 20 loci (Supplementary Figure 1.4). The sum of markers identified by all methods resulted in an outlier dataset of 43 SNP loci. Accordingly, the neutral dataset included the 337 markers which were not detected as outlier by any of the methods (Supplementary Table 1.3, Supplementary Figure 3.4). DAPC analysis performed on the neutral dataset corroborated the result obtained with the whole SNPs dataset, indicating a broad structure characterized by a separation of samples along the longitudinal axes of the Mediterranean. Two clusters were identified by the k-means algorithm and the lowest BIC score (Supplementary Figure 1.2B). In the DAPC analysis performed with prior knowledge of subgroups we retained 100 PCs and three discriminant functions. The proportion of conserved variance for the first two discriminant functions of neutral dataset was 77.51% and the proportion of overall correct assignment was 59.70% (Figure 3B, Supplementary Figure 1.3B). DAPC analysis performed on the outlier dataset revealed higher levels of structure detecting potential distinct subgroups within Western Mediterranean area in respect to whole and neutral datasets. Along the second discriminant (LD2) axis, a deeper separation between samples from Tyrrhenian and western basin areas is shown. Four clusters were identified by the k-means algorithm and the lowest BIC score (Supplementary Figure 1.2C). In the DAPC analysis performed with prior knowledge of subgroups we retained 25 PCs and three discriminant functions. The proportion of conserved variance for the first two discriminant functions of outlier dataset was 87.37% and the proportion of overall correct assignment was 47.44% (Figure 3C, Supplementary Figure 1.3C). In addition, we obtained concordant results from STRUCTURE, provided in Supplementary Figure 1.5, 1.6, resulting barplots were highly consistent with the pattern revealed by DAPC analysis, supporting evidence of differentiation between GSA9 and GSA10 and other Western Mediterranean samples collected from the French and Spanish coasts (GSA6 and GSA7).
3.2 Otolith analysis
Eight individuals were detected as outlier data points and removed from the shape index dataset. Two of the five shape indices (circularity and form factor) were not normally distributed and removed from further analysis. Roundness, ellipticity and rectangularity were normally distributed (p < 0.01), thus retained for further analysis. Levene’s test for homogeneity of variance was significant (p < 2.2e-16}, α = 0.01). We found a significant negative correlation between roundness and ellipticity (r = − 0.802, p < 0.001), but none of the indices were correlated with more than one other index (p < 0.001). None of the shape indices was correlated with total length of fish, and only ellipticity showed a significant association (p = 0.008). The size effect on ellipticity was corrected by dividing values by the common ellipticity/fish length relationship since there was no significant interaction between total fish length and sampling sites (α = 0.01). Site was a significant explanatory variable at α = 0.01 (adonis test in the PERMANOVA analysis), with all pairwise site comparisons significantly different (p < 0.05), as reported in Supplementary Table 2.1, except for GSA9_2009-vs-GSA17_2009, GSA17_2009-vs-GSA22_2009 and GSA17_2009-vs-GSA24_2009. The result of dispersion test was not significant (p = 0.159, α = 0.01) validating the adonis test results. CAP analysis highlighted a separation of samples from the Gulf of Lion with 75% correct reclassification compared to lower values for the other locations (Figure 4A and Supplementary Table 2.2).
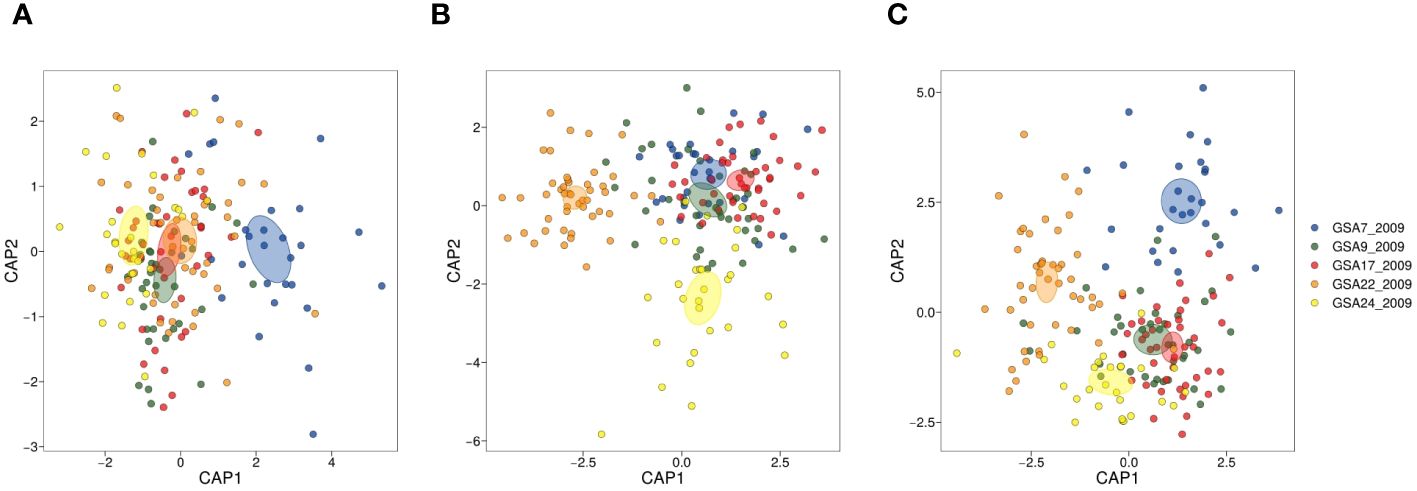
Figure 4 CAP (Canonical analysis of principal coordinates) plots for otolith shape indices (SIs) (A), elliptic Fourier descriptors (EFDs) (B), and integrated morphometric data (SIs and EFDs) (C) from five Mediterranean population samples of Solea solea (GSA7_2009, GSA_2009, GSA17_2009, GSA22_2009 and GSA24_2009).
The otolith shape contour was summarized by 13 harmonics (thus 52 coefficients) as they reached 99% of the cumulative Fourier power (Supplementary Figure 2.1). All pairwise comparisons among sampling sites resulted in significant differences in the PERMANOVA analysis (p < 0.05) (Supplementary Table 2.1). In contrast, the dispersion test resulted significant with a p-value of 0.001 (α = 0.01) making the adonis test results less reliable. The CAP on Fourier descriptors using 13 harmonics identified Aegean and Turkish samples as separate groups (Figure 4B). In both cases Aegean samples (95.74%) showed a higher reclassification success compared to Turkish samples (68.97%) (Supplementary Table 2.2). The CAP on integrated morphometric data identified the samples from the Aegean Sea and Gulf of Lion as separate groups (Figure 4C). Integrating the two data sets provided higher overall reclassification success, with the Aegean samples showing the highest value of correct reclassification (Supplementary Table 2.2).
From the analysis of elemental data, only Zn (p = 0.02) fulfilled the assumption of normality and homogeneity (p < 0.01) for both core and edge data. ANCOVA analysis suggested the influence of otolith weight only on elemental concentration of Rb for α = 0.01 for core data, while for edge data the influence of otolith weight on elemental concentrations of Ba, Rb and Mg was significant (α = 0.01). None of the elements at either otolith core or edge were correlated with otolith weight (α = 0.01), based on Spearman’s correlation. Significant differences (α = 0.05) in the elemental concentration were found between sites for all the elements of both core and edge data (Figure 5). The sampling sites were weakly identified by DAPC methods for core data, except for GSA22_2009, while the correct assignment of individual in sampling sites was higher for edge data (Supplementary Figure 2.2). The elements that most contributed to the discrimination of geographical sites were Cu for otolith edge data and Ba and Zn for otolith core data (Supplementary Figure 2.3).
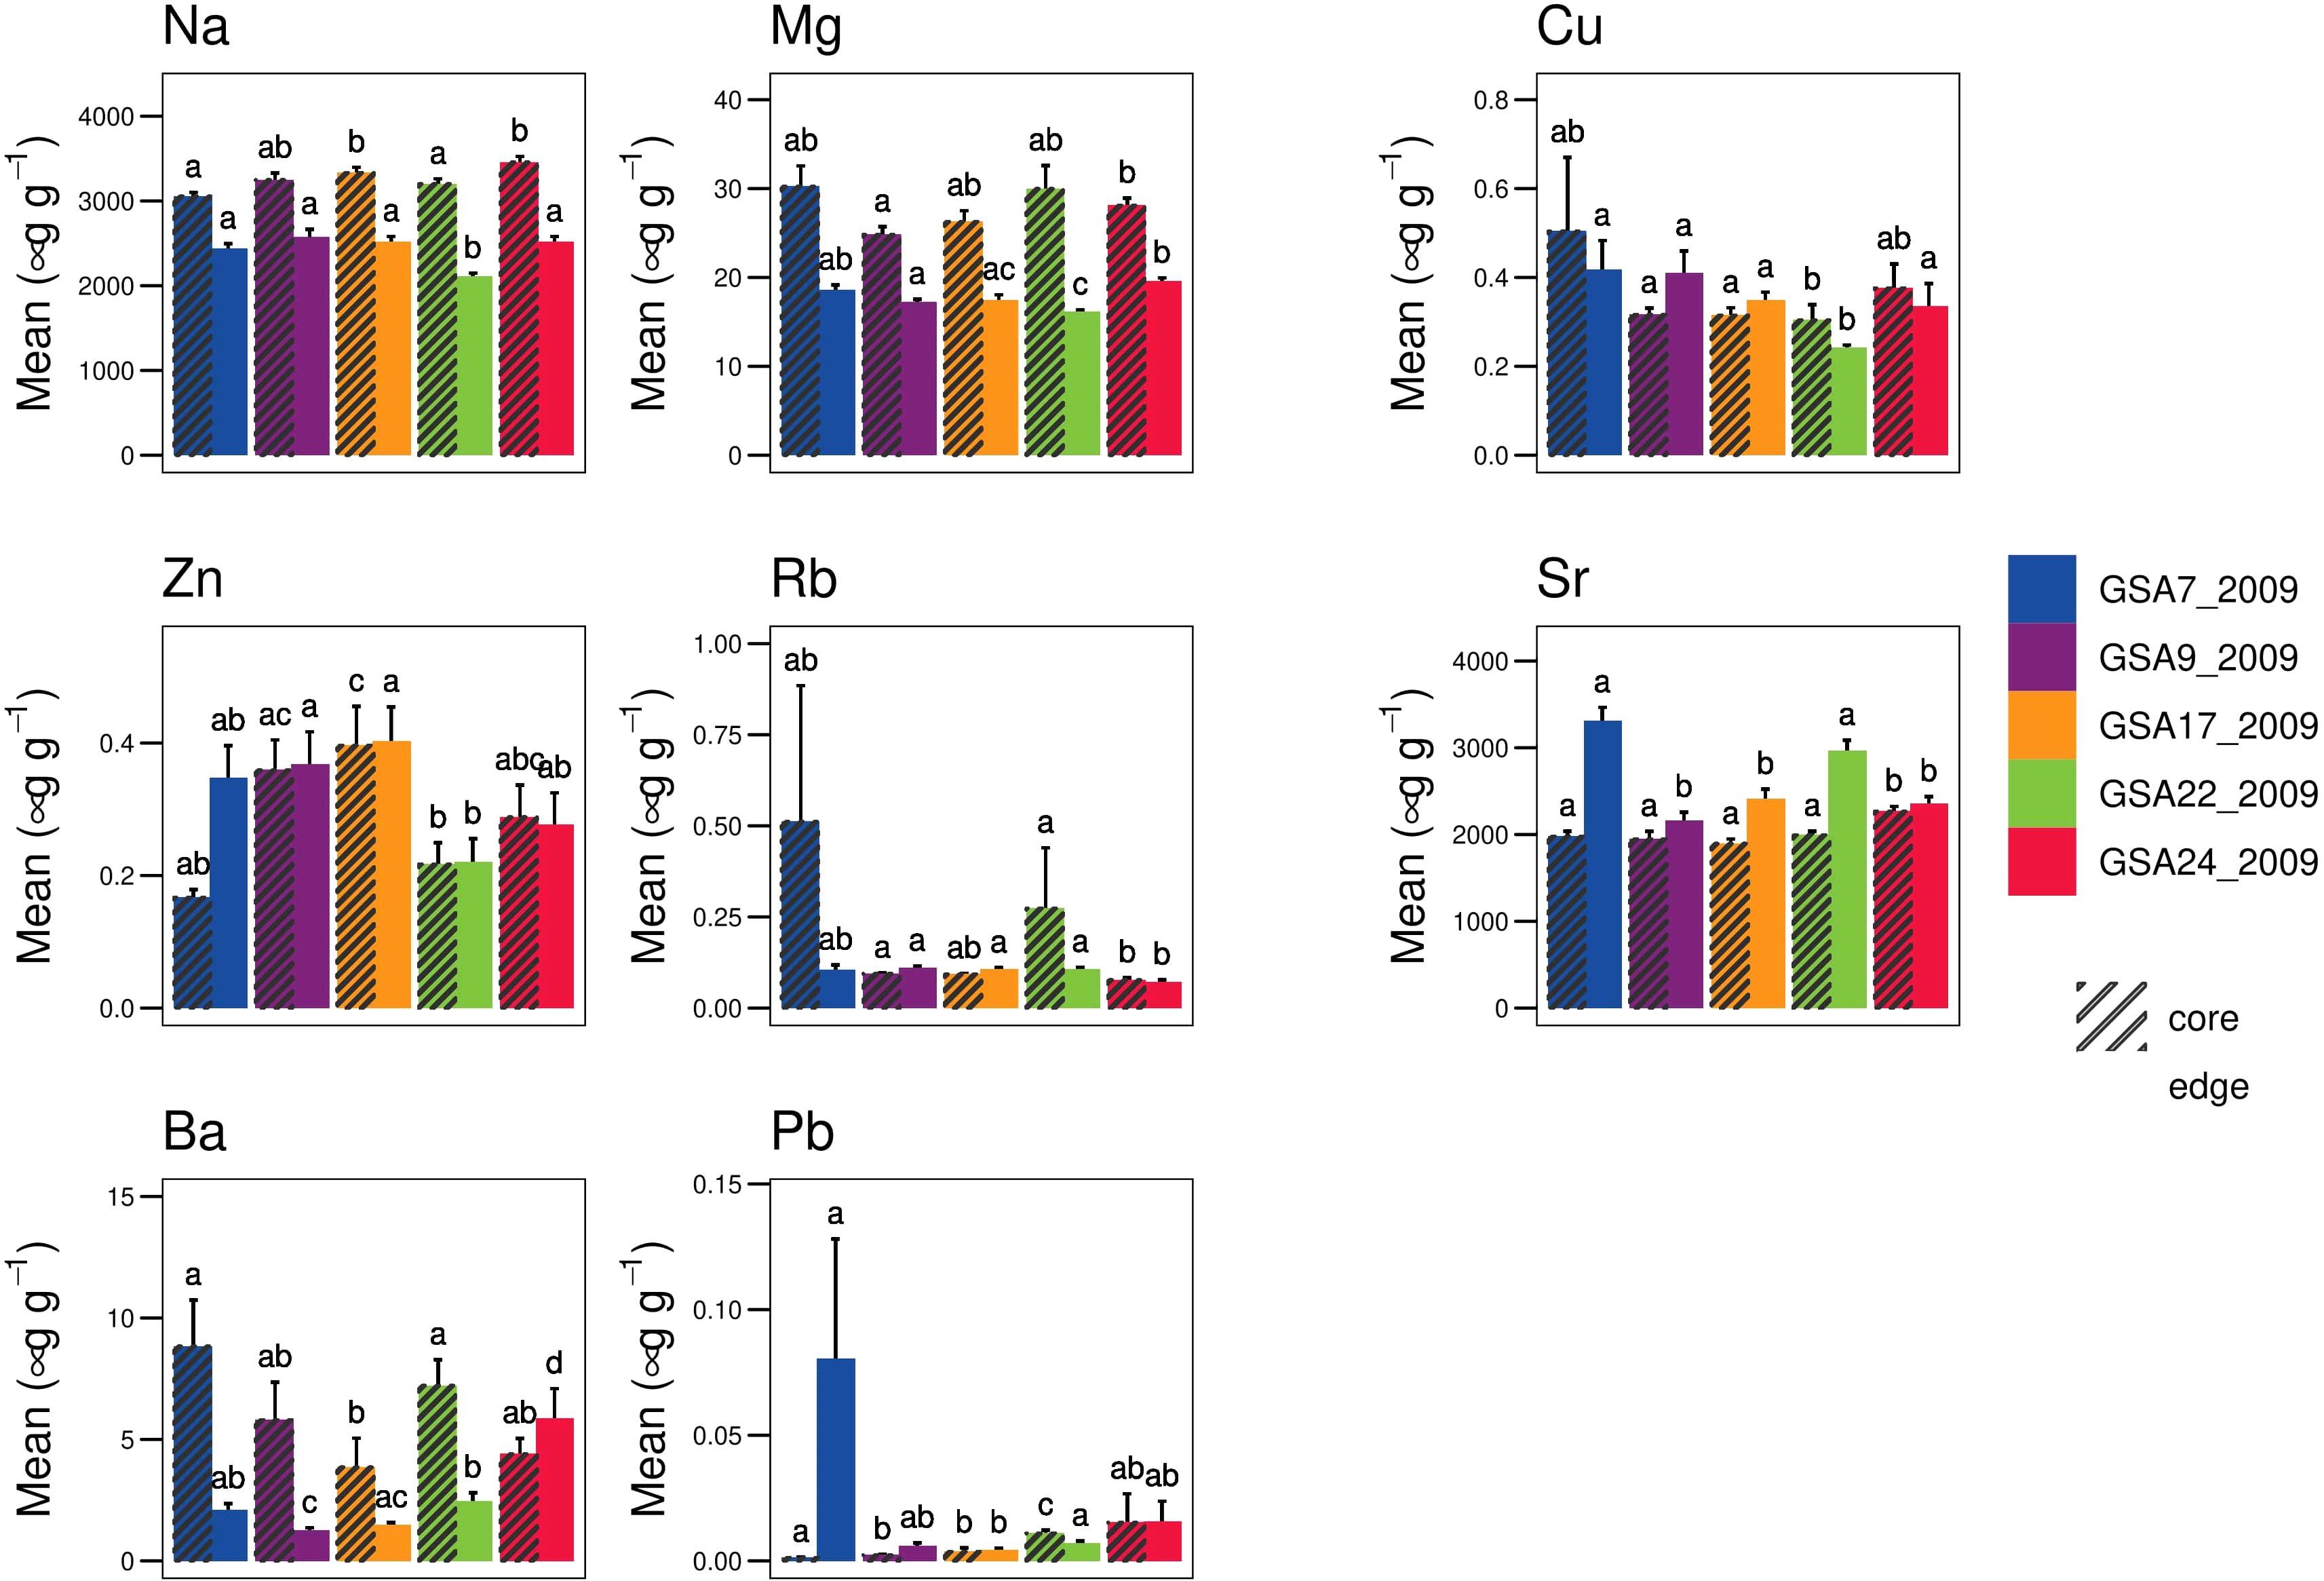
Figure 5 Mean ± SD elemental concentration of each element in otolith core and edge per sampling sites (GSA7_2009, GSA9_2009, GSA17_2009, GSA22_2009 and GSA24_2009). Significant differences among sampling sites obtained from Dunn’s test are shown in the plot using different letters. The bars with different lowercase letters corresponding to significant differences (α = 0.05) between sample sites.
DAPC analysis performed on the combined dataset confirmed the result obtained with the different dataset, indicating a broad structure characterized by a separation of samples along the longitudinal axes of the Mediterranean. Three clusters were identified by the k-means algorithm and the lowest BIC score (Supplementary Figure 2.4). In the DAPC analysis performed with prior knowledge of subgroups we retained 33 PCs and four discriminant functions. The proportion of conserved variance for the first two discriminant functions of combined dataset was 70.02% and the proportion of overall correct assignment was higher (91.77%) compared to the different dataset. Samples of combined dataset showed a higher correct assignment rate (Supplementary Figure 2.6) with respect to the other population samples considering only 380 SNPs (Supplementary Figure 1.5A). DAPC analysis performed on the combined dataset confirmed higher levels of structure detecting potential distinct subgroups within Western Mediterranean area with a separation of samples between GSA7_2009 and GSA9_2009. The analysis did not show a clear separation between samples from GSA22_2009 and GSA24_2009, probably due to the small number of individuals of GSA24_2009 for which we could retrieve both genetic and otolith data. However, the clustering obtained using this combined dataset groups several samples of Eastern Mediterranean origin with most of the Adriatic samples, as reflected by the third cluster displayed in Supplementary Figure 2.5, probably due to the unbalance number of individuals.
3.3 Genetic-environmental association analysis
We identified 13, 55 and 106 SNPs from Bayenv2, LFMM and Samβada respectively, which showed at least one significant association with an environmental variable. The intersection of the SNPs identified among the three GEA analysis (Bayenv2, LFMM and Samβada) resulted in six loci (Supplementary Figure 3.2, Supplementary Table 1.3), the intersection among outlier loci and GEA methods resulted in 22 loci (Supplementary Figure 3.4) and the union of all SNPs identified by GEA methods resulted in 148 SNPs (Supplementary Table 1.3, Supplementary Figure 3.4). The regression analysis of locality scores from the sPCA performed on the GEA union dataset of 148 SNPs returned only dbMEM1, dbMEM3 and dbMEM5 as significant spatial variables, while dbMEM2 and dbMEM4 were not (p > 0.05) (Table 3). All the environmental variables were significantly associated with the SNPs, sal_bottom_mean was the best predictor among environmental variables, followed by three weaker but still significant predictor variables (curM_Wclm_mean, temp_bottom_range and pco_Wclm_mean). Longitude was the best predictor of locality scores, followed by Latitude (Table 3).
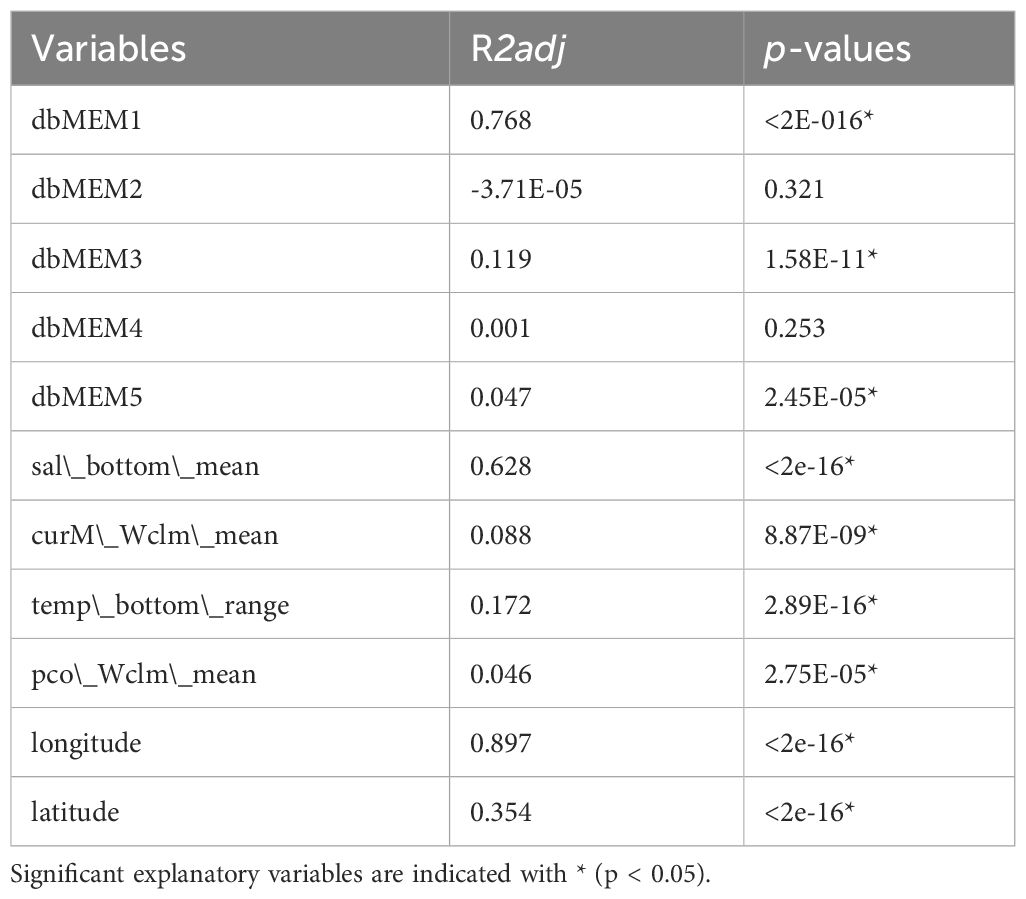
Table 3 Regression analysis of locality scores from the sPCA on the 148 SNPs detected by GEA methods across the Mediterranean population samples of Solea solea.
3.4 Redundancy analysis
The global RDA model performed on both outlier and neutral SNPs identified significant patterns of variation (p < 0.05). The percentage of genetic variation explained was 38.13% for the outlier dataset of loci and 9.97% for the neutral ones, with the first two axes accounting respectively for 35.61% and 7.82% of the explained variation. The forward and backward procedure using ordistep function selected different spatial variables for the two datasets of SNPs, but temp_bottom_range, sal_Wclm_mean and pco_Wclm_mean were identified for both RDA on neutral and outlier SNPs (Figure 6, Supplementary Table 3.1). From marginal ANOVAs, spatial and environmental variables selected were all significant predictors of neutral and outlier genetic variation (p < 0.05). The results of variation partitioning based on neutral SNPs indicated that spatial variables (1.9%) explained approximately the same individual fraction of variance as the environmental variables (1.5%). Shared variance (6.3%) resulted in the highest amount of explained variance (Supplementary Figure 3.5). In contrast, the spatial variables explained more of the individual fraction of variance in the outlier SNPs (7.0%), whereas environmental variables explained 5.5%. As for neutral SNPs, the highest amount of explained variance was represented by shared variance (25.6%) (Supplementary Figure 3.6). The global RDA model performed on both western and eastern Mediterranean dataset separately identified significant patterns of variation (p < 0.05). The percentage of genetic variation explained was 1.56% for the western cluster of loci and 9.14% for the eastern ones, with the first two axes accounting respectively for 1.19% and 7.93% of the explained variation. The forward and backward procedure using ordistep function selected different spatial variables for the two sub-basin datasets, with dbMEM1 and dbMEM2 associated to the western dataset, while dbMEM3 to the eastern one. Concerning environmental variables, sal_bottom_mean was identified as significant for RDA on the western SNPs cluster, while sal_Wclm_mean, curM_Wclm_mean and pco_Wclm_mean were identified for RDA on the eastern dataset (Supplementary Figure 3.9). From marginal ANOVAs, the spatial and environmental variables selected were all significant predictors of genetic variation for western and eastern clusters (p < 0.05).
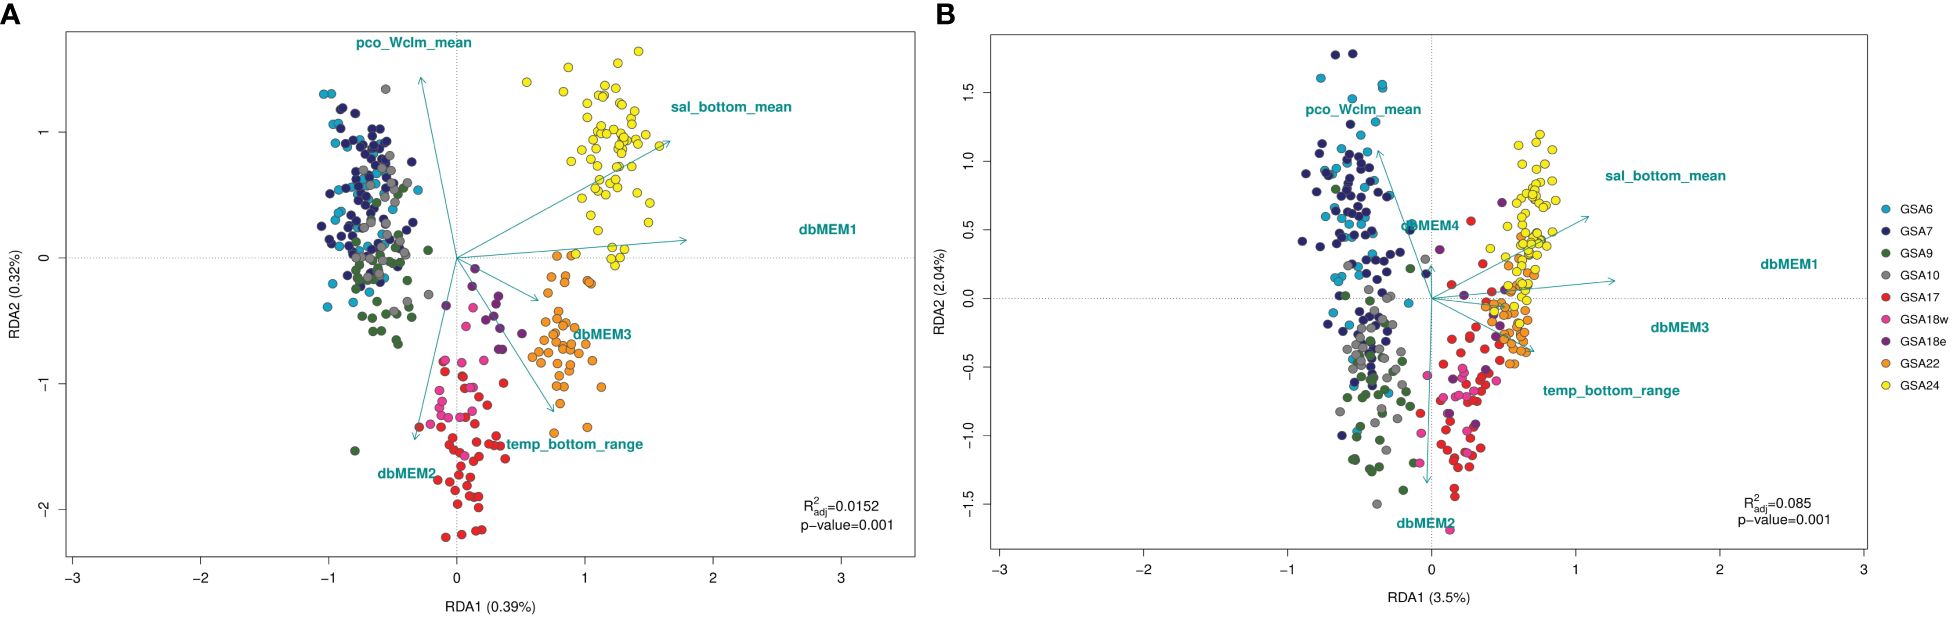
Figure 6 Redundancy analysis (RDA) performed on neutral (A) and outlier (B) SNPs datasets from population samples of Solea solea following the forward and backward selection of variables using ordistep function. Spatial (dbMEMs) and environmental variables found as significant predictors are shown with arrows.
The global RDA model performed on both otolith shape and elemental composition identified significant patterns of variation (p < 0.05). The percentage of variation explained was 19.66%, with the first axis accounting for all the explained variation. The forward and backward procedure using the ordistep function selected two significant spatial variables for the otolith datasets, and one significant environmental variable (sal_Wclm_mean). From marginal ANOVAs, spatial and environmental variables selected were all significant predictors of otolith variation (p < 0.05).
3.5 Gene ontology
Based on the outcomes of transcript annotation and BLAST search, association with known genes was retrieved for 360 out of 380 loci. In details, 36 out of 43 outlier loci and 132 out of 148 loci associated with environmental variables were related to functional annotation. A total of 20 annotated markers were in common between the two datasets. Enrichment analysis revealed that the vast majority of significant results was due to GO terms connected to the outlier dataset, while only a negligible number of significantly enriched terms was ascribed to the environmental dataset. GO terms were significantly over-represented in all three aspects of gene ontology (Supplementary Figure 4.1, 4.2 and 4.3). Enrichment analysis highlighted 93 biological processes, and the top three predominantly enriched GO terms were regulation of nucleobase-containing compound metabolic process, cell migration involved in gastrulation and embryo development. For the 19 molecular functions, the top three predominantly enriched GO terms were nucleic acid binding, RNA and DNA binding. Finally, 12 enriched GO terms were found for the cellular components. When retrieving SNPs associated to the enriched GO terms, a total of 22 loci were associated with GO terms significantly over-represented and belong to 20 successfully annotated genes (listed in Supplementary Table 4.1).
4 Discussion
4.1 Evidence for significant population structure
We used a large, wide-range dataset to examine the population structure of common sole in the Mediterranean Sea. We used different tracers to provide complementary information and identified factors contributing to genetic differentiation. Our results confirm that a multidisciplinary approach provides the opportunity to reveal fine population structure that is often missed with single markers. Molecular approaches were used to identify structure at the microevolutionary time scale, while otolith shape and elemental composition analyses for a subset of sampling sites described the structure at a life span scale (Tanner et al., 2016). The current work confirmed the presence of a high level of differentiation in common sole populations across the Mediterranean area. Understanding these patterns of population structure may contribute to marine fisheries conservation by identifying overlap or misalignment of current management units with biological population units (Kerr et al., 2017).
We acknowledge that the temporal and spatial scales of our sampling design could be a limitation for the identification of proper stock units for management purposes. However, common sole is a long living species (13+ years as from Carbonara et al., 2023), but reaches reproductive maturity relatively early. In fact, according to Scarcella et al., 2014, individuals start to mature after the second year of life, implying that only a few generations overlapped under the sampling scheme adopted by the present work. We observed a deep differentiation pattern between Mediterranean samples that was confirmed through the application and the agreement of different analysis methods. We found a strong signal of a well-defined spatial structure inside the Mediterranean basin, detected at a fine spatial scale for the first time. Genetic analysis revealed substantial differences and clustered Northern Mediterranean population samples of Solea solea into three main groups occupying three main areas (Western Mediterranean, Adriatic, Eastern Mediterranean), with higher levels of heterogeneity in the west compared to the east. We are aware that our study relied only on samples from the European areas, that are not fully representative of the species’ distribution in the Basin. In fact, Solea solea is the only Solea species widely distributed in the whole Mediterranean Sea, while the other two congeneric species currently occurring in the Basin have a different distribution following a longitudinal gradient, with S. senegalensis inhabiting the western Mediterranean Sea and S. aegyptiaca dwelling in the eastern Mediterranean Sea, even if the latter could be present in a wider area (Ofelio et al., 2020). The presence of three different Solea species in the Mediterranean Sea has been investigated, revealing evidence of hybridization among S. senegalensis and S. aegyptiaca (Souissi et al., 2017, 2018), but not with S. solea. In contrast, the latter share conserved external morphology with S. aegyptiaca, being currently considered as cryptic species, but reproductively independent (Sabatini et al., 2018). To overcome the limitations of our study and fully resolve the genetic structuring of the species, the collection of samples from geographical sites in the southern part of the Basin (i.e., the African coast and Sicily channel) would be beneficial to enhance the usefulness of the findings and the power to discriminate substructure at a finer geographical scale within the three main areas, even if sampling could be hampered by the aforementioned pitfall in species discrimination. In fact, attempts to collect S. solea specimens were carried out along the coast of Egypt, but only S. aegyptiaca could be retrieved, preventing further efforts at the time of the sampling campaign. A further differentiation pattern within the Adriatic Sea was confirmed, with Northern Adriatic and South-Western Adriatic population samples (GSA17_2009 and GSA18w_2000) separated from South-Eastern Adriatic population samples (GSA18e_2000). This pattern has already been suggested in previous studies based only on mitochondrial markers (Guarnieo et al., 2002; Sabatini et al., 2018). However, stock assessment has historically been carried out using only the GSA17 (Northern Adriatic Sea) as the management unit since the landings of common sole in the western part of the GSA18 are negligible (Sabatini et al., 2018). From the analysis on genetic diversity, common sole samples from the Eastern Mediterranean showed the lowest values of observed heterozygosity compared to those from other locations. A decreasing polymorphic rate could be indicative of demographic processes as bottleneck events, potentially linked to high mortality, although the causes have yet to be determined (Pinsky and Palumbi, 2014). As suggested with other species such as European hake (Merluccius merluccius) (Morales-Nin et al., 2014), the genetic differences observed between population samples of Solea solea into the three main areas in the Mediterranean basin are probably led by neutral drift. Limited connectivity across the Mediterranean is likely to be due to surface water-masses circulation with several cyclonic gyres as well as to biogeographic barriers (El-Geziry and Bryden, 2010). The life history traits of common sole also contribute to limiting its dispersal. Sole larvae start metamorphosis around 30 days after hatching and benthic settlement is completed within 2 months from hatching (Horwood, 1993). During the pelagic larval stage, larvae can travel considerable distances (Lacroix et al., 2013) but the retention in proximity of suitable nursery habitat, such as estuaries and lagoons (Primo et al., 2013; Morat et al., 2014), is a crucial factor for survival. Sole larvae have some ability for active swimming and use tidal transport to follow freshwater plumes from coastal rivers to reach their coastal nursery grounds (Lagardere et al., 1999). The connectivity pattern of sole is likely influenced by the coastline configuration and the availability of suitable environment (Tanner et al., 2017). For instance, the Strait of Sicily has been considered a geographical boundary separating the Eastern and Western Mediterranean at phylogenetic and population levels (Patarnello et al., 2007). In addition, the present-day genetic and demographic features of Mediterranean common sole could be also the signature of past processes of isolation into Pleistocene glacial refugia. These likely occurred in the Mediterranean linked to cycles of glacial and interglacial periods, with remarkable climatic fluctuations and severe sea-level changes (Sarnthein et al., 2003) that affected the life history of several marine species. Ecological niche models based on palaeoclimate reconstructions of sea surface temperature and bathymetry applied to zooarchaeological finds dating to the Last Glacial Maximum (ca.21ka ago) show strong evidence of important fish invasion and displacement through the Straits of Gibraltar in glacial periods - where they were exploited by Palaeolithic human populations around the western Mediterranean Sea - challenging an existing paradigm of marine glacial refugia (Kettle et al., 2011). The pattern of population structure was confirmed by all the genomic data analysis methods. DAPC analysis confirmed the separation of western from eastern population samples and, in the eastern population samples a separation from Aegean and Levantine areas. Furthermore, the complete overlap in the results of the temporal replicates available for almost all GSAs reinforces our findings. The use of different population differentiation methods helps to address both demographic and adaptive processes, indicated by variation at the neutral and outlier SNP loci, respectively. The presence of three main clusters was in fact revealed by using a complete genetic dataset as well as a selected dataset of only neutral markers. Genetic differentiation at a finer spatial scale was highlighted by the analysis conducted on a separate dataset of outlier SNPs. Consistency between neutral and outlier SNP loci signal was well supported, but the outlier SNP loci had greater resolution and revealed more fine scale segregation patterns compared to neutral markers. Outlier loci were able to distinguish the Tyrrhenian Sea population samples (GSA9 and 10) from the other Western Mediterranean samples. The subtle genetic clustering in the Tyrrhenian area may suggest that local selection could play a detectable role in shaping the genetic structure of common sole, since the analysis was based on outlier markers, putatively under selection. Diopere et al. (2018) used the same panel of genomic markers to study common sole populations in the North-Eastern Atlantic and obtained comparable results, indicating that the genetic structure of common sole might be shaped by a combination of neutral and adaptive processes. It appears that neutral genetic structure is due to dispersal limitation of this species throughout its distribution, while adaptive processes such as environmental and ecological features might play as key factors in local adaptation. In any case, we have demonstrated that outlier detection can reveal fine-scale population structure in areas in which connectivity and gene flow are limited as in our study. Notably, when applied in Atlantic area where gene flow due to geographical boundaries leads to stronger connectivity links, the same panel of loci supports the evidence for local adaptation (Diopere et al., 2018). Sixteen markers were identified as outliers in common in both Atlantic and Mediterranean studies, providing further insights of their involvement in adaptive processes (Diopere et al. (2018); Supplementary Table 3.1).
4.2 Environmental effects on genetic variation
Another goal of the study was to investigate the influence of environmental variables on the population structure within a seascape analysis framework. Studies have shown that the use of constrained ordination methods such as RDA are effective tools in detecting the genetic basis of local adaptation (Forester et al., 2018). Seascape analysis on both neutral and outlier SNPs datasets identified clusters confirming the distinction between common sole population samples from the Western and Eastern Mediterranean areas, with the longitude as the best predictor. Furthermore, RDA models performed considering western and eastern Mediterranean dataset separately, confirmed the pattern of variation selecting as significant predictors both spatial and environmental variables. However, a larger proportion of the genetic variation was explained by clusters in the outlier loci dataset, confirming the higher power of resolution of outlier markers than neutral ones. In this respect, RDA models, which included spatial distribution and environmental factors, explained 38.13% of the outlier genetic structure while only 9.97% of the neutral one. Most of the variation remains unexplained in RDA models probably because it can be explained by additional factors. In fact, neutral genetic variation could be due to random processes such as genetic drift or mutation, but also other factors can contribute to demographic isolation (Gagnaire et al., 2015).
The analysis of environmental data and their association with genetic variation suggested that the population structure of Mediterranean common sole is likely to be partially due to environmental factors such as temperature or salinity and to spatial distribution. Salinity and temperature are factors shaping the survival and reproduction of common sole. Salinity is a key parameter for early stages which aggregates in estuarine areas and is a proxy for river input, which amount, and timing can have an influence on juvenile growth and survival driving therefore recruitment strength (Salen-Picard et al., 2002). Temperature is known for influencing the spawning seasonality (Lacroix et al., 2013). Studies shows that reproductive biology can differ within the basin, with a smaller length at first maturity observed in the eastern Mediterranean (19.6 cm; El-Aiatt et al., 2019) compared to the Adriatic Sea (25.9 cm; Carbonara et al., 2023). Suitable habitat for common sole is fragmented in the Mediterranean Sea and likely displays a longitudinal gradient in temperature and salinity conditions, with the eastern basin saltier and warmer. Statistical analysis suggests that the environmental variables indeed exhibit a spatial structure. Consequently, when arguing that spatial and environmental factors might significantly impact genetic structure, it is not possible to exclude that link between genetic differentiation and temperature or salinity is confounded with a broad geographical pattern. Especially for the outlier dataset, the spatial variables explained 7% of variance meaning that spatial structure related to other environmental, geomorphological, anthropic or connectivity features may act in shaping genetic differentiation among population samples at multiple scales. Among the anthropic pressures that were not accounted within this study, fishing exploitation may eventually play a role in shaping the observed variation. The common sole is a target species for commercial fisheries only in a few of the study areas (mainly the northern-central Adriatic Sea) and therefore the fishing pressure acting on the different sub-population identified is likely to be heterogeneous and spatially structured. High quality fishery-dependent data regarding catches and spatial distribution of trawlers are now common (e.g. DCF for catches, Global Fishing Watch for effort), but this was not the case during the time-period covered by our samples. Information for the beginning of 2000’s is eventually scarce and not coherent across the study area, therefore we decided to not include fishery data in the drivers to avoid biased sources. Our results show a combination of spatial and environmental influence on genetic structure, consistent with the life-cycle traits of this demersal flatfish. Environmental variables also explained 5.5% of the variance in the outlier dataset that was not explained by any spatial structure, even though there are significant salinity and temperature gradients across the Mediterranean Sea (Skliris, 2014; Spedicato et al., 2022). In fact, RDA models performed on otolith dataset underlined salinity as a significant predictor of the variation encountered between the populations of Solea solea in the Mediterranean Sea. Particularly, several outlier SNPs were also associated with environmental variables in the GEA analysis, suggesting the potential involvement of these loci in local adaptation.
4.3 Concordance between otolith and genetic variation
Shape analysis of the otolith outlines showed statistically significant differences among the five population samples, hence otolith shape analysis is confirmed a valuable discriminating method in marine fishes. The analysis performed on shape indices showed significantly different dimensions for GSA7_2009 compared to the other samples, with a higher correct assignment to the original locations. This separation could suggest low levels of variability within samples from Gulf of Lion (GSA7_2009) and higher differentiation between GSA7_2009 samples and samples from the other locations. Individual variability might reduce the power of the classification method and may reflect local environmental conditions (Morales-Nin et al., 2022), although this is likely to vary between species. Even with correction for fish length effects, some otolith dimensions vary with age and growth conditions especially where there is a curvature in the otolith growth axis. This may contribute to variability within areas (Burke et al., 2008), but is not likely to be a major factor in the otolith shape in common sole. The elliptical Fourier descriptors (EFDs) were more successful than the shape indices in discriminating among individuals from different Mediterranean sampling locations. The results obtained from analysis of EFDs clearly separated Eastern Mediterranean population samples from the other sampling locations with a high percentage of accurate assignment to their original locations. Finally, overall reclassification success was higher when morphometric data were integrated, meaning that the combination of shape indices and EFDs improved the power of discrimination between different groups.
Although at a lower resolution because of the reduced sampling extent compared to genetic data, integrated morphometric data were effective in confirming significant divergence between Western and Eastern Mediterranean population samples separated from the rest of the common sole population samples, a pattern already suggested from genetics analysis. Furthermore, the analysis performed combining the genetic and the otolith dataset confirmed the agreement between the results of the two methods and underlined how the potential power of resolution could be increased by the combination of different data sources. Many factors can influence the trace element concentrations in otoliths, including environmental factors such as temperature, salinity and chemical composition of water masses, fish physiology and ontogenetic change in habitat occupation (Chang and Geffen, 2013; Hüssy et al., 2021). In relation to the otolith trace element composition, the correct population assignments depend on the otolith material deposited in a localized geographical area. The otolith core forms during embryo development and represents the early life history stage, including the spawning area, the pelagic or dispersal phase and possibly movement to nursery areas. The otolith edge represents the most recent resident area of that individual. In our case the discrimination methods detected stronger signals in the core trace element data, with population samples from the Aegean (GSA22_2009) more clearly differentiated. Whether this is limited by the number of samples in each population, or a reflection of the chemistry of the water masses, is difficult to say (Vasconcelos et al., 2007). In fact, there is an improvement in the discrimination power of core data compared to edge data, but not with perfect correspondence because of fish movement after their early life stages. Multiple factors might be limiting the power of discrimination methods, such as the small number of elements used in the analysis, low residence time in the location due to habitat shift in such a complex life cycle as the one of common sole. The core and edge mean concentrations measured in the single-element analysis (Figure 5) were in line with the values assessed by other studies (Cuveliers et al., 2010; Chang and Geffen, 2013). The presence of barium (Ba) as one of the microelements that most contributes to the discrimination between groups in the core data is consistent with the fact that Ba is known as a proxy of coastal or freshwater influence occurring in nursery area (Supplementary Figure 2.3) (Morat et al., 2014), as well as areas of high primary productivity (Chang and Geffen, 2013). Among other elements, copper (Cu), zinc (Zn) and lead (Pb) seem to be the trace elements that most contribute to the discrimination between groups both in core and edge data (Supplementary Figure 2.3). This is consistent with the higher concentrations detected in fish from GSA7 and GSA17 which receive high levels of river input from industrial areas in the south of France and industry and agricultural areas in the northern Adriatic (Valbonesi et al., 2003; Zorita et al., 2008). Although coastal and shelf waters in many areas are naturally enriched with heavy metals, high concentrations of Cu, Zn and Pb can also indicate industrial, urban, or agricultural pollution detectable in otolith trace elements (Papadopoulou et al., 1978; Geffen et al., 2003; Chang and Geffen, 2013; Constenla et al., 2021). As reported in Constenla et al. (2021), common sole could be used also as a sentinel species for industrial pollution in coastal waters. The strontium (Sr) concentration in otoliths is sensitive to both salinity and water mass composition. This may explain why GSA22_2009 was so clearly differentiated from the other sampling sites based on the otolith core data. The salinity regime of the Eastern Mediterranean basin is substantially higher compared to the other parts of the Mediterranean (Supplementary Figure 3.1) (Gačić et al., 2011). Moreover, this pattern is confirmed by RDA analysis in which, among environmental variables, salinity significantly contributed to the genetic differentiation of Eastern Mediterranean common sole population samples, although at a lower degree with respect to spatial variables. Also, among SNPs loci associated with environmental factors, salinity emerged as the best predictor among environmental variables with respect to the regression analysis on the loading score in sPCA analysis.
4.4 Looking for candidate adaptive genes
To validate putative SNPs under selection, research studies aim to link outlier markers to functional genes that can be involved in adaptive processes, by associating the function of known genes near to the identified locus to the variation of key environmental parameters. Several studies have successfully identified as outlier SNPs and SNPs associated with environmental variables found in genes involved in adaptation processes, using various methods of genome scan analysis (Benestan et al., 2016; S. Bernatchez et al., 2019; Selmoni et al., 2020). Different methods to detect outlier markers and loci associated to environmental factors, such as outlier detection methods and genetic-environment association (GEA), could be combined to obtain more information and enhance the possibility to identify loci potentially under selection (de Villemereuil et al., 2014; Rellstab et al., 2015). The use of additional information such as environmental variables improves the power of GEA analysis in identifying loci, compared to outlier detection analysis, and reveals signals of selection. As suggested by Forester et al. (2018), the overlapping approach which combines results from different methods can be effective in detecting adaptation while maintaining a low false-positive rate. As a result, both lists of putative loci under selection (43 SNPs) and/or influenced by environmental factors (148 SNPs) were used to perform Gene Ontology (GO) enrichment analysis. Our aim in performing the GO enrichment tests was to preliminarily explore whether the functions of known genes were under or over-represented in sets of genes associated with environmental variables or outlier SNPs. Most of the loci highlighted in the enrichment analysis, which are mainly the loci also included in the environmental dataset, were associated with different gene product functions and all of them were significantly over-represented in several aspects of gene ontology. However, the successfully annotated genes connected with these loci in most cases did not directly correspond to gene expression regulation processes generally connected with our environmental variables. Nevertheless, these loci could have an impact on overall gene expression because they relate to genes involved in RNA and DNA binding, molecular interaction, and metabolic processes, among others. The exception were a few genes that are involved in muscle contraction and encoded proteins that support mitochondrial metabolic demand that were expressed in response to high pCO2 (Cline et al., 2020). Outlier SNPs 1023 and 464 that are located into these annotated genes are associated with pCO2 environmental variables (pco_Wclm_mean) in at least one GEA method and they are also included in the loci that most contribute to the pattern identified by sPCA. Overall, based on our results, further work including more complete genomic information is necessary to expose the influence of environmental features on the microevolutionary process shaping the population structure of this species, with special emphasis on the assessment of putative functional local adaptation processes, which, ultimately, could lead to differences in life history traits.
4.5 Conclusion and future impacts
This study has produced a major advance in the knowledge-based management of common sole in the Mediterranean Sea, defining and assessing the population structure of this relevant demersal resource with multidisciplinary analyses. In our study, the identified west-to-east differentiation pattern observed is fully coherent with the population structure described by Rolland et al. (2007). Using whole and neutral datasets, we identified three areas (Western Mediterranean, Adriatic, Eastern Mediterranean) that largely approximate to the FAO division of the Mediterranean Sea in the Major Fishing Areas (MFAs) 37.1, 37.2 and 37.3. In addition, the outlier dataset revealed a more subtle division within the western area (37.1). A large portion of MFA 37.2 is the Ionian Sea (including the coast of Libya), and our sampling did not cover the whole Mediterranean area. Even if more samples from the Southern and insular Mediterranean Sea are needed to achieve a complete pattern of common sole population units in the Basin, our findings could provide a new perspective for management decisions by reiterating the existence of a mismatch between management and biological units. In the case of the southern Adriatic Sea, the south-east population may be closer to the Ionian samples than to the main Adriatic Basin. The genetic spatial configuration does not match the statistical unit boundaries, which aggregates the shores of the southern Adriatic and divides the western coast. Following a multidisciplinary approach, we also tried to elucidate the selection forces that influence the observed pattern of population structure. The identified genetic clusters agreed with the subdivision in MFA areas, with population samples reassigned with high success rate by DAPC analysis on genomics data as well as CAP analysis on otolith data. Moreover, the power of outlier loci in detecting finer population structure helps to reveal metapopulations, and it should be considered in the assessment and management of fisheries plans. Both genomics and otolith data provided adequate discrimination power to delineate population structure in the present study, but the temporal and spatial scales of our sampling design could be a limitation for the identification of proper stock units for management purposes. Nevertheless, no major external forcing modifications were expected to occur during the sampling period, considering that the reduction of fishery exploitation started after the conclusion of the sampling. The multidisciplinary approach in our work is in line with the GFCM 2030 Strategy to focus on subregional level processes (FAO, 2021). In addition, comparison with recent samples would allow an evaluation of the genetic diversity of the species following two decades of management measures that reduced the fishing pressure on this stock (FAO-GFCM, 2021). In conclusion, our multidisciplinary approach was reliable in revealing the population structure of common sole, and providing new insights into the importance of local adaptations that produce finer scale structure in this highly valuable marine resource. These findings represent an asset to implement an effective integrated approach combining comprehensive quantitative results to delineate better aligned stock management units for this species.
Data availability statement
All datasets and data analyses code related to this study can be found at GitHub repository https://github.com/elispiazza/solea-solea-pop.
Ethics statement
Ethical approval was not required for the study involving animals in accordance with the local legislation and institutional requirements because no direct research on vertebrate animals was carried out in this study. The results presented in this manuscript were obtained from extensive re-analysis on samples and data analyzed originated from previous efforts carried out in the framework of the FishPopTrace EU (European Union) Project.
Author contributions
RC: Conceptualization, Data curation, Formal analysis, Investigation, Methodology, Software, Visualization, Writing – original draft, Writing – review & editing. EP: Data curation, Formal analysis, Investigation, Methodology, Software, Visualization, Writing – original draft, Writing – review & editing. EA: Conceptualization, Data curation, Methodology, Writing – original draft, Writing – review & editing. AF: Writing – original draft, Writing – review & editing. AG: Conceptualization, Data curation, Validation, Writing – original draft, Writing – review & editing. GM: Writing – original draft, Writing – review & editing. FM: Conceptualization, Data curation, Methodology, Writing – original draft, Writing – review & editing. CS: Conceptualization, Data curation, Formal analysis, Methodology, Writing – original draft, Writing – review & editing. GS: Conceptualization, Methodology, Validation, Writing – original draft, Writing – review & editing. MS: Conceptualization, Data curation, Methodology, Validation, Writing – original draft, Writing – review & editing. FT: Writing – original draft, Writing – review & editing. AZ: Methodology, Software, Writing – original draft, Writing – review & editing, Conceptualization. AC: Conceptualization, Project administration, Resources, Supervision, Validation, Writing – original draft, Writing – review & editing.
Funding
The author(s) declare financial support was received for the research, authorship, and/or publication of this article. The data analyzed in this work were generated within the framework of FishPopTrace project funded from the European Community’s Seventh Framework Programme (FP7/2007-2013) under Grant Agreement No KBBE-212399. This research work was partially supported by institutional funding from University of Bologna assigned to FT and AC (RFO and Canziani grants). GM was supported by the governmental research grant FWO.
Acknowledgments
We acknowledge the whole FishPopTrace Consortium in which the raw data re-analyzed in this manuscript were generated (https://sustainable-fisheries.ec.europa.eu/fisheries-genetics/projects-fisheries-genetics/fishpoptrace/consortium_en).
Conflict of interest
The authors declare that the research was conducted in the absence of any commercial or financial relationships that could be construed as a potential conflict of interest.
Publisher’s note
All claims expressed in this article are solely those of the authors and do not necessarily represent those of their affiliated organizations, or those of the publisher, the editors and the reviewers. Any product that may be evaluated in this article, or claim that may be made by its manufacturer, is not guaranteed or endorsed by the publisher.
Supplementary material
The Supplementary Material for this article can be found online at: https://www.frontiersin.org/articles/10.3389/fmars.2024.1372743/full#supplementary-material
References
Abaunza P., Murta A., Campbell N., Cimmaruta R., Comesaña A., Dahle G., et al. (2008). Stock identity of horse mackerel (Trachurus trachurus) in the Northeast Atlantic and Mediterranean Sea: Integrating the results from different stock identification approaches. Fisheries Res. 89, 196–209. doi: 10.1016/j.fishres.2007.09.022
Antoniou A., Manousaki T., Ramírez F., Cariani A., Cannas R., Kasapidis P., et al. (2023). Sardines at a junction: Seascape genomics reveals ecological and oceanographic drivers of variation in the NW Mediterranean Sea. Mol. Ecol. 32, 1608–1628. doi: 10.1111/mec.16840
Archer F. I., Adams P. E., Schneiders B. B. (2017). stratag: An r package for manipulating, summarizing, and analysing population genetic data. Mol. Ecol. Resour. 17, 5–11. doi: 10.1111/1755-0998.12559
Ashburner M., Ball C. A., Blake J. A., Botstein D., Butler H., Cherry J. M., et al. (2000). Gene ontology: tool for the unification of biology. Nat. Genet. 25, 25–29. doi: 10.1038/75556
Bacha M., Jemaa S., Hamitouche A., Rabhi K., Amara R. (2014). Population structure of the European anchovy, Engraulis encrasicolus, in the SW Mediterranean Sea, and the Atlantic Ocean: evidence from otolith shape analysis. ICES J. Mar. Sci. 71, 2429–2435. doi: 10.1093/icesjms/fsu097
Begg G. A., Friedland K. D., Pearce J. B. (1999). Stock identification and its role in stock assessment and fisheries management: an overview. Fisheries Res. 43, 1–8. doi: 10.1016/S0165-7836(99)00062-4
Bekkevold D., Höjesjö J., Nielsen E. E., Aldvén D., Als T. D., Sodeland M., et al. (2020). Northern European Salmo trutta (L.) populations are genetically divergen across geographical regions and environmental gradients. Evolutionary Appl. 13, 400–416. doi: 10.1111/eva.12877
Benestan L., Loiseau N., Guérin P. E., Pérez-Ruzafa A., Forcada A., Arcas E., et al. (2023). Contrasting influence of seascape, space, and marine reserves on genomic variation in multiple species. Ecography 2023, e06127. doi: 10.1111/ecog.06127
Benestan L., Quinn B. K., Maaroufi H., Laporte M., Clark F. K., Greenwood S. J., et al. (2016). Seascape genomics provides evidence for thermal adaptation and current mediated population structure in American lobster (Homarus americanus). Mol. Ecol. 25, 5073–5092. doi: 10.1111/mec.13811
Benjamini Y., Hochberg Y. (1995). Controlling the false discovery rate: a practical and powerful approach to multiple testing. J. R. Stat. society: Ser. B (Methodological) 57, 289–300.
Benzekri H., Armesto P., Cousin X., Rovira M., Crespo D., Merlo M. A., et al. (2014). De novo assembly, characterization, and functional annotation of Senegalese sole (Solea Senegalensisand common sole (Solea solea) transcriptomes: integration in a database and design of a microarray. BMC Genomics 15, 1–18. doi: 10.1186/1471-2164-15-952
Berg P. R., Jorde P. E., Glover K. A., Dahle G., Taggart J. B., Korsbrekke K., et al. (2021). Genetic structuring in Atlantic haddock contrasts with current management regimes. ICES J. Mar. Sci. 78, 1–13. doi: 10.1093/icesjms/fsaa204
Bernatchez L., Wellenreuther M., Araneda C., Ashton D. T., Barth J. M., Beacham T. D., et al. (2017). Harnessing the power of genomics to secure the future of seafood. Trends Ecol. Evol. 32, 665–680. doi: 10.1016/j.tree.2017.06.010
Bernatchez S., Xuereb A., Laporte M., Benestan L., Steeves R., Laflamme M., et al. (2019). Seascape genomics of eastern oyster (Crassostrea virginica) along the Atlantic coast of Canada. Evolutionary Appl. 12, 587–609. doi: 10.1111/eva.12741
Beyst B., Cattrijsse A., Mees J. (1999). Feeding ecology of juvenile flatfishes of the surf zone of a sandy beach. J. Fish Biol. 55, 1171–1186. doi: 10.1111/j.1095-8649.1999.tb02068.x
Bonhomme V., Picq S., Claude J., Gaucherel C. (2014). Momocs: outline analysis using R. J. Stat. Software 56, 24. doi: 10.18637/jss.v056.i13
Borcard D., Legendre P. (2002). All-scale spatial analysis of ecological data by means of principal coordinates of neighbour matrices. Ecol. Model. 153, 51–68. doi: 10.1016/S0304-3800(01)00501-4
Buchfink B., Xie C., Huson D. H. (2015). Fast and sensitive protein alignment using DIAMOND. Nat. Methods 12, 59–60. doi: 10.1038/nmeth.3176
Burke N., Brophy D., King P. A. (2008). Otolith shape analysis: its application for discriminating between stocks of Irish Sea and Celtic Sea herring (Clupea harengus) in the Irish Sea. ICES J. Mar. Sci. 65, 1670–1675. doi: 10.1093/icesjms/fsn177
Cadrin S. X. (2020). Defining spatial structure for fishery stock assessment. Fisheries Res. 221, 105397. doi: 10.1016/j.fishres.2019.105397
Cadrin S. X., Karr L. A., Mariani S. (2014). Stock identification methods: an overview. In: Cadrin S. X., Kerr L. A., Mariani S. editor. Stock identification methods applications in fishery science. 2nd ed. San Diego, CA: Academic Press., p. 1–5.
Campana S. E., Thorrold S. R. (2001). Otoliths, increments, and elements: keys to a comprehensive understanding of fish populations? Can. J. Fisheries Aquat. Sci. 58, 30–38. doi: 10.1139/f00-177
Carbonara P., Masnadi F., Donato F., Sabatini L., Pellini G., Cardinale M., et al. (2023). Biphasic versus monophasic growth curve equation, an application to common sole (Solea solea, L.) in the northern and central Adriatic Sea. Fisheries Res. 263, 106694. doi: 10.1016/j.fishres.2023.106694
Casey J., Jardim E., Martinsohn J. T. (2016). The role of genetics in fisheries management under the EU common fisheries policy. J. fish Biol. 89, 2755–2767. doi: 10.1111/jfb.13151
Catanese G., Montes I., Iriondo M., Estonba A., Iudicone D., Procaccini G. (2016). High resolution SNPs selection in Engraulis encrasicolus through Taqman OpenArray. Fisheries Res. 177, 31–38. doi: 10.1016/j.fishres.2016.01.014
Caye K., Jumentier B., Lepeule J., François O. (2019). LFMM 2: Fast and accurate inference of gene-environment associations in genome-wide studies. Mol. Biol. Evol. 36, 852–860. doi: 10.1093/molbev/msz008
Chang M.-Y., Geffen A. J. (2013). Taxonomic and geographic influences on fish otolith microchemistry. Fish Fisheries 14, 458–492. doi: 10.1111/j.1467-2979.2012.00482.x
Chang M.-Y., Geffen A. J., Kosler J., Dundas S. H., Maes G. E. (2012). The effect of ablation pattern on LA-ICPMS analysis of otolith element composition in hake, Merluccius merluccius. Environ. Biol. fishes 95, 509–520. doi: 10.1007/s10641-012-0065-7
Cline A. J., Hamilton S. L., Logan C. A. (2020). Effects of multiple climate change stressors on gene expression in blue rockfish (Sebastes mystinus). Comp. Biochem. Physiol. Part A: Mol. Integr. Physiol. 239, 110580. doi: 10.1016/j.cbpa.2019.110580
Constenla M., Soler-Membrives A., Besada V., Carrassón M. (2021). Impact assessment of a large river on the sediments and fish from its continental shelf: using Solea solea as sentinel in the Ebro river mouth (NW Mediterranean, Spain). Environ. Sci. Pollut. Res. 29 (11), 15713–15728.
Coop G., Witonsky D., Di Rienzo A., Pritchard J. K. (2010). Using environmental correlations to identify loci underlying local adaptation. Genetics 185, 1411–1423. doi: 10.1534/genetics.110.114819
Cope J. M., Punt A. E. (2009). Drawing the lines: resolving fishery management units with simple fisheries data. Can. J. Fisheries Aquat. Sci. 66, 1256–1273. doi: 10.1139/F09-084
Cowen R. K., Sponaugle S. (2009). Larval dispersal and marine population connectivity. Annu. Rev. Mar. Sci. 1, 443–466. doi: 10.1146/annurev.marine.010908.163757
Cuveliers E., Geffen A., Guelinckx J., Raeymaekers J., Skadal J., Volckaert F., et al. (2010). Microchemical variation in juvenile Solea solea otoliths as a powerful tool for studying connectivity in the North Sea. Mar. Ecol. Prog. Ser. 401, 211–220. doi: 10.3354/meps08439
de Villemereuil P., Frichot É., Bazin É., François O., Gaggiotti O. E. (2014). Genome scan methods against more complex models: when and how much should we trust them? Mol. Ecol. 23, 2006–2019. doi: 10.1111/mec.12705
Delerue-Ricard S., Darnaude A. M., Raeymaekers J. A., Dundas S. H., Skadal J., Volckaert F. A., et al. (2019). Extensive larval dispersal and restricted movement of juveniles on the nursery grounds of sole in the Southern North Sea. J. Sea Res. 155, 101822. doi: 10.1016/j.seares.2019.101822
Diopere E., Vandamme S. G., Hablützel P. I., Cariani A., Van Houdt J., Rijnsdorp A., et al. (2018). Seascape genetics of a flatfish reveals local selection under high levels of gene flow. ICES J. Mar. Sci. 75, 675–689. doi: 10.1093/icesjms/fsx160
Do Prado F. D., Vera M., Hermida M., Bouza C., Pardo B. G., Vilas R., et al. (2018). Parallel evolution and adaptation to environmental factors in a marine flatfish: Implications for fisheries and aquaculture management of the turbot (Scophthalmus maximus). Evolutionary Appl. 11, 1322–1341. doi: 10.1111/eva.12628
Duruz S., Sevane N., Selmoni O., Vajana E., Leempoel K., Stucki S., et al. (2019). Rapid identification and interpretation of gene–environment associations using the new R.SamBada landscape genomics pipeline. Mol. Ecol. Resour. 19, 1355–1365. doi: 10.1111/1755-0998.13044
El-Aiatt A. A. O., Sh Shalloof K. A., M El-Far A. M. (2019). Reproductive biology of the common sole, solea solea in Southern East Mediterranean, Bardawil Lagoon, Egypt. Egyptian J. Aquat. Biol. Fisheries 23, 403–411. doi: 10.21608/ejabf.2019.29183
El-Geziry T., Bryden I. (2010). The circulation pattern in the Mediterranean Sea: issues for modeler consideration. J. Operational Oceanogr. 3, 39–46. doi: 10.1080/1755876X.2010.11020116
Excoffier L., Lischer H. E. (2010). Arlequin suite ver 3.5: a new series of programs to perform population genetics analyses under Linux and Windows. Mol. Ecol. Resour. 10, 564–567. doi: 10.1111/j.1755-0998.2010.02847.x
FAO (1999). Report of the first session of the Scientific Advisory Committee. FAO Fisheries Report No. 601 (Rome, Italy: FAO).
FAO (2020a). FAO Fisheries and Aquaculture Division - FishStatJ - Software for Fishery and Aquaculture Statistical Time Series (Rome: FAO Fisheries and Aquaculture Division). Available at: https://www.fao.org/fishery/statistics/software/fishstatj/en.
FAO (2020b). The state of mediterranean and black sea fisheries 2020 (Rome: General Fisheries Commission for the Mediterranean).
FAO (2020c). The state of world fisheries and aquaculture 2020. sustainability in action (Rome: FAO).
FAO (2021). GFCM 2030 Strategy for sustainable fisheries and aquaculture in the Mediterranean and the Black Sea (Rome: General Fisheries Commission for the Mediterranean). doi: 10.4060/cb7562en
FAO-GFCM. (2021). Report of the Working Group on Stock Assessment of Demersal Species (WGSAD)– Benchmark session for the assessment of common sole in GSA 17 (Scientific Advisory Committee on Fisheries (SAC), Online via Microsoft Teams: General Fisheries Commission for the Mediterranean), 12–16.
Ferreira I., Santos D., Moreira C., Feijó D., Rocha A., Correia A. T. (2019). Population structure of Chelidonichthys lucerna in Portugal mainland using otolith shape and elemental signatures. Mar. Biol. Res. 15, 500–512. doi: 10.1080/17451000.2019.1673897
Fick S. E., Hijmans R. J. (2017). WorldClim 2: new 1-km spatial resolution climate surfaces for global land areas. Int. J. climatol. 37, 4302–4315. doi: 10.1002/joc.5086
Flanagan S. P., Jones A. G. (2017). Constraints on the FST–heterozygosity outlier approach. J. Heredity 108, 561–573. doi: 10.1093/jhered/esx048
Foll M., Gaggiotti O. (2008). A genome-scan method to identify selected loci appropriate for both dominant and codominant markers: a Bayesian perspective. Genetics 180, 977–993. doi: 10.1534/genetics.108.092221
Fonds M. (1979). Laboratory observations on the influence of temperature and salinity on development of the eggs and growth of the larvae of Solea solea (Pisces). Mar. Ecol. Prog. Ser. 1, 91–99. doi: 10.3354/meps001091
Forester B. R., Lasky J. R., Wagner H. H., Urban D. L. (2018). Comparing methods for detecting multilocus adaptation with multivariate genotype–environment associations. Mol. Ecol. 27, 2215–2233. doi: 10.1111/mec.14584
Frichot E., François O. (2015). LEA: An R package for landscape and ecological association studies. Methods Ecol. Evol. 6, 925–929. doi: 10.1111/2041-210X.12382
Frichot E., Schoville S. D., Bouchard G., François O. (2013). Testing for associations between loci and environmental gradients using latent factor mixed models. Mol. Biol. Evol. 30, 1687–1699. doi: 10.1093/molbev/mst063
Gačić M., Civitarese G., Eusebi Borzelli G. L., Kovačević V., Poulain P. M., Theocharis A., et al. (2011). On the relationship between the decadal oscillations of the northern Ionian Sea and the salinity distributions in the eastern Mediterranean. J Geophys Res. 116, C12002. doi: 10.1029/2011JC007280
Gagnaire P.-A., Broquet T., Aurelle D., Viard F., Souissi A., Bonhomme F., et al. (2015). Using neutral, selected, and hitchhiker loci to assess connectivity of marine populations in the genomic era. Evolutionary Appl. 8, 769–786. doi: 10.1111/eva.12288
Garoia F., Guarniero I., Grifoni D., Marzola S., Tinti F. (2007). Comparative analysis of AFLPs and SSRs efficiency in resolving population genetic structure of Mediterranean Solea vulgaris. Mol. Ecol. 16, 1377–1387. doi: 10.1111/j.1365-294X.2007.03247.x
Geffen A. J., Jarvis K., Thorpe J. P., Leah R. T., Nash. R. D. M. (2003). Trace element concentrations in the otoliths of plaice Pleuronectes platessa and whiting Merlangius merlangus in the eastern Irish Sea. J. Sea Res. 50, 245–254. doi: 10.1016/j.seares.2003.06.001
Geffen A. J., Morales-Nin B., Gillanders B. M. (2016). Fish otoliths as indicators in ecosystem-based management: results of the 5th International Otolith Symposium (IOS2014). Mar. Freshw. Res. 67, i–iv. doi: 10.1071/MFv67n7_ED
Grati F., Scarcella G., Polidori P., Domenichetti F., Bolognini L., Gramolini R., et al. (2013). Multi-annual investigation of the spatial distributions of juvenile and adult sole (Solea solea L.) in the Adriatic Sea (northern Mediterranean). J. Sea Res. 84, 122–132. doi: 10.1016/j.seares.2013.05.001
Guarnieo I., Franzellitti S., Ungaro N., Tommasini S., Piccinetti C., Tinti F. (2002). Control region haplotype variation in the central Mediterranean common sole indicates geographical isolation and population structuring in Italian stocks. J. Fish Biol. 60, 1459–1474. doi: 10.1111/j.1095-8649.2002.tb02440.x
Günther T., Coop G. (2013). Robust identification of local adaptation from allele frequencies. Genetics 195, 205–220. doi: 10.1534/genetics.113.152462
Harrell F. E. J. (2019). ‘Hmisc’. Available at: https://hbiostat.org/r/hmisc/.
Hart A. J., Ginzburg S., Xu M., Fisher C. R., Rahmatpour N., Mitton J. B., et al. (2020). EnTAP: Bringing faster and smarter functional annotation to non-model eukaryotic transcriptomes. Mol. Ecol. Resour. 20, 591–604. doi: 10.1111/1755-0998.13106
Hauser L., Carvalho G. R. (2008). Paradigm shifts in marine fisheries genetics: ugly hypotheses slain by beautiful facts. Fish Fisheries 9, 333–362. doi: 10.1111/j.1467-2979.2008.00299.x
Hawkins S., Bohn K., Sims D., Ribeiro P., Faria J., Presa P., et al. (2016). Fisheries stocks from an ecological perspective: Disentangling ecological connectivity from genetic interchange. Fisheries Res. 179, 333–341. doi: 10.1016/j.fishres.2016.01.015
Healey A. J., Farthing M. W., Nunoo F. K., Potts W. M., Sauer W. H., Skujina I., et al. (2020). Genetic analysis provides insights into species distribution and population structure in East Atlantic horse mackerel (Trachurus trachurus and T. capensis). J. fish Biol. 96, 795–805. doi: 10.1111/jfb.14276
Helyar S. J., Limborg M. T., Bekkevold D., Babbucci M., van Houdt J., Maes G. E., et al. (2012). SNP discovery using next generation transcriptomic sequencing in Atlantic herring (Clupea harengus). PloS One 7, 1–11. doi: 10.1371/journal.pone.0042089
Hemmer-Hansen J., Therkildsen N. O., Pujolar J. M. (2014). Population genomics of marine fishes: next-generation prospects and challenges. Biol. Bull. 227, 117–132. doi: 10.1086/BBLv227n2p117
Higgins R. M., Danilowicz B. S., Balbuena J. A., Daníelsdóttir A. K., Geffen A. J., Meijer W. G., et al. (2010). Multi-disciplinary fingerprints reveal the harvest location of cod Gadus morhua in the northeast Atlantic. Mar. Ecol. Prog. Ser. 404, 197–206. doi: 10.3354/meps08492
Horwood J. W. (1993). The Bristol Channel sole [Solea solea (L.)]: a fisheries case study. Adv. Mar. Biol. 29, 215–367. doi: 10.1016/S0065-2881(08)60132-7
Hüssy K., Limburg K. E., de Pontual H., Thomas O. R. B., Cook P. K., Heimbrand Y., et al. (2021). Trace element patterns in otoliths: the role of biomineralization. Rev. Fisheries Sci. Aquaculture 29, 445–477. doi: 10.1080/23308249.2020.1760204
Hussy K., Mosegaard H., Albertsen C. M., Nielsen E. E., Hemmer-Hansen J., Eero M. (2016). Evaluation of otolith shape as a tool for stock discrimination in marine fishes using Baltic Sea cod as a case study. Fisheries Res. 174, 210–218. doi: 10.1016/j.fishres.2015.10.010
Izzo C., Ward T. M., Ivey A. R., Suthers I. M., Stewart J., Sexton S. C., et al. (2017). Integrated approach to determining stock structure: implications for fisheries management of sardine, Sardinops sagax, in Australian waters. Rev. fish Biol. fisheries 27, 267–284. doi: 10.1007/s11160-017-9468-z
Jeffery N. W., Stanley R. R., Wringe B. F., Guijarro-Sabaniel J., Bourret V., Bernatchez L., et al. (2017). Range-wide parallel climate-associated genomic clines in Atlantic salmon. R. Soc. Open Sci. 4, 171394. doi: 10.1098/rsos.171394
Jemaa S., Bacha M., Khalaf G., Dessailly D., Rabhi K., Amara R. (2015). What can otolith shape analysis tell us about population structure of the European sardine, Sardina pilchardus, from Atlantic and Mediterranean waters? J. Sea Res. 96, 11–17. doi: 10.1016/j.seares.2014.11.002
Johnston R., Jones K., Manley D. (2018). Confounding and collinearity in regression analysis: a cautionary tale and an alternative procedure, illustrated by studies of British voting behaviour. Qual. quantity 52, 1957–1976. doi: 10.1007/s11135-017-0584-6
Jombart T. (2008). adegenet: a R package for the multivariate analysis of genetic markers. Bioinformatics 24, 1403–1405. doi: 10.1093/bioinformatics/btn129
Jombart T. (2017). A tutorial for the spatial Analysis of Principal Components (sPCA) using adegenet 2.1.0 (London, UK: Imperial College London). Available at: https://github.com/thibautjombart/adegenet/blob/master/tutorials/tutorial-spca.pdf.
Jombart T., Devillard S., Dufour A.-B., Pontier D. (2008). Revealing cryptic spatial patterns in genetic variability by a new multivariate method. Heredity 101, 92–103. doi: 10.1038/hdy.2008.34
Kass R. E., Raftery A. E. (1995). Bayes factors. J. Am. Stat. Assoc. 90, 773–795. doi: 10.1080/01621459.1995.10476572
Keating J. P., Brophy D., Officer R. A., Mullins E. (2014). Otolith shape analysis of blue whiting suggests a complex stock structure at their spawning grounds in the Northeast Atlantic. Fisheries Res. 157, 1–6. doi: 10.1016/j.fishres.2014.03.009
Kerr L. A., Hintzen N. T., Cadrin S. X., Clausen L. W., Dickey-Collas M., Goethel D. R., et al. (2017). Lessons learned from practical approaches to reconcile mismatches between biological population structure and stock units of marine fish. ICES J. Mar. Sci. 74, 1708–1722. doi: 10.1093/icesjms/fsw188
Kettle A. J., Morales-Muñiz A., Roselló-Izquierdo E., Heinrich D., Vøllestad L. A. (2011). Refugia of marine fish in the northeast Atlantic during the last glacial maximum: concordant assessment from archaeozoology and palaeotemperature reconstructions. Clim. Past 7, 181–201. doi: 10.5194/cp-7-181-2011
Kindt R., Kindt M. (2015). ‘BiodiversityR’: package for community ecology and suitability analysis (CRAN). Available at: cran.r-project.org/web/packages/BiodiversityR/index.html.
Kitada S., Nakajima K., Hamasaki K. (2017). Population panmixia and demographic expansion of a highly piscivorous marine fish Scomberomorus niphonius. J. fish Biol. 91, 1435–1448. doi: 10.1111/jfb.13466
Kotoulas G., Bonhomme F., Borsa P. (1995). Genetic structure of the common sole Solea vulgaris at different geographic scales. Mar. Biol. 122, 361–375. doi: 10.1007/BF00350869
Lacroix G., Maes G. E., Bolle L. J., Volckaert F. A. (2013). Modelling dispersal dynamics of the early life stages of a marine flatfish (Solea solea L.). J. Sea Res. 84, 13–25. doi: 10.1016/j.seares.2012.07.010
Lagardere F., Amara R., Joassard L. (1999). Vertical distribution and feeding activity of metamorphosing sole, Solea solea, before immigration to the Bay of Vilaine nursery (northern Bay of Biscay, France). Environ. Biol. Fishes 56, 213–228. doi: 10.1023/A:1007581818941
Lehnert S. J., DiBacco C., Van Wyngaarden M., Jeffery N. W., Lowen J. B., Sylvester E. V., et al. (2019). Fine-scale temperature associated genetic structure between inshore and offshore populations of sea scallop (Placopecten magellanicus). Heredity 122, 69–80. doi: 10.1038/s41437-018-0087-9
Levene H. (1960). Contributions to probability and statistics: Essays in honour of Harold Hotelling. Eds. Olkin I., Ghurie S. G., Hoeffding W., Madow W. G., Mann H. B. (Stanford, California: Stanford University Press).
Liggins L., Treml E. A., Riginos C. (2019). “Seascape genomics: contextualizing adaptive and neutral genomic variation in the ocean environment,” in Population genomics: Marine organisms (Cham, Switzerland: Springer), 171–218.
Longmore C., Fogarty K., Neat F., Brophy D., Trueman C., Milton A., et al. (2010). A comparison of otolith microchemistry and otolith shape analysis for the study of spatial variation in a deep-sea teleost, Coryphaenoides rupestris. Environ. Biol. fishes 89, 591–605. doi: 10.1007/s10641-010-9674-1
Luu K., Bazin E., Blum M. G. (2017). pcadapt: an R package to perform genome scans for selection based on principal component analysis. Mol. Ecol. Resour. 17, 67–77. doi: 10.1111/1755-0998.12592
Maroso F., Gkagkavouzis K., De Innocentiis S., Hillen J., do Prado F., Karaiskou N., et al. (2021). Genome-wide analysis clarifies the population genetic structure of wild gilthead sea bream (Sparus aurata). PloS One 16, e0236230. doi: 10.1371/journal.pone.0236230
Martinsohn J. T., Ogden R., FishPopTrace Consortium (2009). FishPopTrace—Developing SNP-based population genetic assignment methods to investigate illegal fishing. Forensic Sci. International: Genet. Supplement Ser. 2, 294–296. doi: 10.1016/j.fsigss.2009.08.108
Mercier L., Darnaude A. M., Bruguier O., Vasconcelos R. P., Cabral H. N., Costa M. J., et al. (2011). Selecting statistical models and variable combinations for optimal classification using otolith microchemistry. Ecol. Appl. 21, 1352–1364. doi: 10.1890/09-1887.1
Mérigot B., Letourneur Y., Lecomte-Finiger R. (2007). Characterization of local populations of the common sole Solea solea (Pisces, Soleidae) in the NW Mediterranean through otolith morphometrics and shape analysis. Mar. Biol. 151, 997–1008. doi: 10.1007/s00227-006-0549-0
Milano I., Babbucci M., Cariani A., Atanassova M., Bekkevold D., Carvalho G. R., et al. (2014). Outlier SNP markers reveal fine-scale genetic structuring across European hake populations (Merluccius merluccius). Mol. Ecol. 23, 118–135. doi: 10.1111/mec.12568
Milano I., Babbucci M., Panitz F., Ogden R., Nielsen R. O., Taylor M. I., et al. (2011). Novel tools for conservation genomics: comparing two high-throughput approaches for SNP discovery in the transcriptome of the European hake. PloS One 6, e28008. doi: 10.1371/journal.pone.0028008
Morales-Nin B., Pérez-Mayol S., MacKenzie K., Catalan I. A., Palmer M., Kersaudy T., et al. (2022). European hake (Merluccius merluccius) stock structure in the Mediterranean as assessed by otolith shape and microchemistry. Fisheries Res. 254, 106419. doi: 10.1016/j.fishres.2022.106419
Morales-Nin B., Pérez-Mayol S., Palmer M., Geffen A. J. (2014). Coping with connectivity between populations of Merluccius merluccius: An elusive topic. J. Mar. Syst. 138, 211–219. doi: 10.1016/j.jmarsys.2014.04.009
Morat F., Blamart D., Candaudap F., Letourneur Y. (2013). Differences in elemental chemistry and c-o stable isotope composition between left and right otoliths of a flatfish, the common sole Solea solea. Vie Milieu 63, 169–179.
Morat F., Letourneur Y., Dierking J., Pécheyran C., Bareille G., Blamart D., et al. (2014). The great melting pot. Common sole population connectivity assessed by otolith and water fingerprints. PloS One 9, e86585. doi: 10.1371/journal.pone.0086585
Moreira C., Froufe E., Sial A., Caeiro A., Vaz-Pires P., Correia A. (2018). Population structure of the blue jack mackerel (Trachurus picturatus) in the NE Atlantic inferred from otolith microchemistry. Fisheries Res. 197, 113–122. doi: 10.1016/j.fishres.2017.08.012
Moreira C., Froufe E., Vaz-Pires P., Correia A. (2019). Otolith shape analysis as a tool to infer the population structure of the blue jack mackerel, Trachurus picturatus, in the NE Atlantic. Fisheries Res. 209, 40–48. doi: 10.1016/j.fishres.2018.09.010
Naimi B. (2017). usdm: uncertainty analysis for species distribution models (R package version 1), 1–18. Available at: https://cran.rproject.org/web/packages/usdm/usdm.pdf.
Naimi B., Hamm N. A., Groen T. A., Skidmore A. K., Toxopeus A. G. (2014). Where is positional uncertainty a problem for species distribution modelling? Ecography 37, 191–203. doi: 10.1111/j.1600-0587.2013.00205.x
Nielsen E. E., Cariani A., Mac Aoidh E., Maes G. E., Milano I., Ogden R., et al. (2012). Gene-associated markers provide tools for tackling illegal fishing and false eco-certification. Nat. Commun. 3, 1–7. doi: 10.1038/ncomms1845
Ofelio C., Guarniero I., Cariani A., Viroli C., Bonaldo A., Gatta P. P., et al. (2020). Monitoring of common sole Solea solea (L) captive broodstock from Northern Adriatic Sea over consecutive spawning seasons. Aquaculture Rep. 18, 100495. doi: 10.1016/j.aqrep.2020.100495
Oksanen J., Simpson G. L., Blanchet F. G., Kindt R., Legendre P., Minchin P. R., et al. (2022). vegan: Community Ecology Package (R package version 2), 6–5. Available at: https://github.com/vegandevs/vegan.
Ovenden J. R., Berry O., Welch D. J., Buckworth R. C., Dichmont C. M. (2015). Ocean’s eleven: a critical evaluation of the role of population, evolutionary and molecular genetics in the management of wild fisheries. Fish Fisheries 16, 125–159. doi: 10.1111/faf.12052
Papadopoulou C., Kanias G. D., Kassimati E. M. (1978). Zinc content in otoliths of mackerel from the Aegean. Mar. pollut. Bull. 9, 106–108. doi: 10.1016/0025-326X(78)90482-4
Paris J. R., Sherman K. D., Bell E., Boulenger C., Delord C., El-Mahdi M., et al. (2018). Understanding and managing fish populations: keeping the toolbox fit for purpose. J. Fish Biol. 92, 727–751. doi: 10.1111/jfb.13549
Patarnello T., Volckaert F. A., Castilho R. (2007). Pillars of Hercules: is the Atlantic–Mediterranean transition a phylogeographical break? Mol. Ecol. 16, 4426–4444. doi: 10.1111/j.1365-294X.2007.03477.x
Pinsky M. L., Palumbi S. R. (2014). Meta-analysis reveals lower genetic diversity in overfished populations. Mol. Ecol. 23, 29–39. doi: 10.1111/mec.12509
Pita A., Casey J., Hawkins S. J., Villarreal M. R., Gutiérrez M.-J., Cabral H., et al. (2016). Conceptual and practical advances in fish stock delineation. Fisheries Res. 173, 185–193. doi: 10.1016/j.fishres.2015.10.029
Primo A. L., Azeiteiro U. M., Marques S. C., Martinho F., Baptista J., Pardal M. A. (2013). Colonization and nursery habitat use patterns of larval and juvenile flatfish species in a small temperate estuary. J. Sea Res. 76, 126–134. doi: 10.1016/j.seares.2012.08.002
Pritchard J. K., Stephens M., Rosenberg N. A., Donnelly P. (2000). Association mapping in structured populations. Am. J. Hum. Genet. 67, 170–181. doi: 10.1086/302959
Quéro J.-C., Desoutter M., Lagardère F. (1986). “Soleidae,” in Fishes of the North-eastern Atlantic and the Mediterranean, vol. 3 . Eds. Whitehead P. J. P., Bauchot M.-L., Hureau J.-C., Nielsen J., Tortonese E. (UNESCO, Paris), 1308–1324.
Quintela M., Kvamme C., Bekkevold D., Nash R. D., Jansson E., Sørvik A. G., et al. (2020). Genetic analysis redraws the management boundaries for the European sprat. Evolutionary Appl. 13, 1906–1922. doi: 10.1111/eva.12942
Rashidabadi F., Abdoli A., Tajbakhsh F., Nejat F., Avigliano E. (2020). Unravelling the stock structure of the Persian brown trout by otolith and scale shape. J. Fish Biol. 96, 307–315. doi: 10.1111/jfb.14170
R Core Team (2022). R: a language and environment for statistical computing. (Vienna, Austria: R Foundation for Statistical Computing). Available at: https://www.r-project.org/.
Reiss H., Hoarau G., Dickey-Collas M., Wolff W. J. (2009). Genetic population structure of marine fish: mismatch between biological and fisheries management units. Fish Fisheries 10, 361–395. doi: 10.1111/j.1467-2979.2008.00324.x
Rellstab C., Gugerli F., Eckert A. J., Hancock A. M., Holderegger R. (2015). A practical guide to environmental association analysis in landscape genomics. Mol. Ecol. 24, 4348–4370. doi: 10.1111/mec.13322
Roberts D. G., Ayre D. J. (2010). Panmictic population structure in the migratory marine sparid Acanthopagrus australis despite its close association with estuaries. Mar. Ecol. Prog. Ser. 412, 223–230. doi: 10.3354/meps08676
Rodríguez-Ezpeleta N., Bradbury I. R., Mendibil I., Álvarez P., Cotano U., Irigoien X. (2016). Population structure of Atlantic mackerel inferred from RAD-seq-derived SNP markers: Effects of sequence clustering parameters and hierarchical SNP selection. Mol. Ecol. Resour. 16, 991–1001. doi: 10.1111/1755-0998.12518
Rolland J., Bonhomme F., Lagardère F., Hassan M., Guinand B. (2007). Population structure of the common sole (Solea solea) in the Northeastern Atlantic and the Mediterranean Sea: revisiting the divide with EPIC markers. Mar. Biol. 151, 327–341. doi: 10.1007/s00227-006-0484-0
Rousset F. (2008). genepop’007: a complete re-implementation of the genepop software for Windows and Linux. Mol. Ecol. Resour. 8, 103–106. doi: 10.1111/j.1471-8286.2007.01931.x
Sabatini L., Bullo M., Cariani A., Celić I., Ferrari A., Guarniero I., et al. (2018). Good practices for common sole assessment in the Adriatic Sea: Genetic and morphological differentiation of Solea solea Linnaeus 1758) from m S aEgyptiaca stock identification. J. Sea Res. 137, 57–64. doi: 10.1016/j.seares.2018.04.004
Salen-Picard C., Darnaude A. M., Arlhac D., Harmelin-Vivien M. L. (2002). Fluctuations of macrobenthic populations: a link between climate-driven river run-off and sole fishery yields in the Gulf of Lions. Oecologia 133, 380–388. doi: 10.1007/s00442-002-1032-3
Sarnthein M., Gersonde R., Niebler S., Pflaumann U., Spielhagen R., Thiede J., et al. (2003). Overview of glacial Atlantic Ocean mapping (GLAMAP 2000). Paleo-oceanography 18, 1030. doi: 10.1029/2002PA000769
Scarcella G., Grati F., Raicevich S., Russo T., Gramolini R., Scott R. D., et al. (2014). Common sole in the northern and central Adriatic Sea: spatial management scenarios to rebuild the stock. J. Sea Res. 89, 12–22. doi: 10.1016/j.seares.2014.02.002
Segovia N. I., González-Wevar C. A., Haye P. A. (2020). Signatures of local adaptation in the spatial genetic structure of the ascidian Pyura Chilensis along the southeast Pacific coast. Sci. Rep. 10, 1–14. doi: 10.1038/s41598-020-70798-1
Selmoni O., Lecellier G., Vigliola L., Berteaux-Lecellier V., Joost S. (2020). Coral cover surveys corroborate predictions on reef adaptive potential to thermal stress. Sci. Rep. 10, 1–13. doi: 10.1038/s41598-020-76604-2
Shapiro S. S., Wilk M. B. (1965). An analysis of variance test for normality (complete samples). Biometrika 52, 591–611. doi: 10.1093/biomet/52.3-4.591
Simoncelli S., Fratianni C., Pinardi N., Grandi A., Drudi M., Oddo P., et al. (2019). Mediterranean Sea physical reanalysis (cmems med-physics) (Copernicus Monitoring Environment Marine Service (CMEMS). doi: 10.25423/MEDSEA_REANALYSIS_PHYS_006_004
Skliris N. (2014). “Past, present, and future patterns of the thermohaline circulation and characteristic water masses of the Mediterranean Sea,” in The mediterranean sea (Dordrecht Heidelberg New York London: Springer), 29–48. doi: 10.1007/978-94-007-6704-1
Souissi A., Bonhomme F., ManChado M., Bahri-Sfar L., Gagnaire P. A. (2018). Genomic and geographic footprints of differential introgression between two divergent fish species (Solea spp.). Heredity 121, 579–593. doi: 10.1038/s41437-018-0079-9
Souissi A., Gagnaire P. A., Bonhomme F., Bahri-Sfar L. (2017). Introgressive hybridization and morphological transgression in the contact zone between two Mediterranean Solea species. Ecol. Evol. 7, 1394–1402. doi: 10.1002/ece3.2533
Spedicato M. T., Cannas R., Mahe K., Morales B., Tsigenopoulos C., Zane L., et al. (2022). Study on advancing fisheries assessment and management advice in the Mediterranean by aligning biological and management units of priority species MED_UNITs – Final report, European Commission, European Climate, Infrastructure and Environment Executive Agency, Publications Office of the European Union. doi: 10.2926/909535
Stanley R. R. E., DiBacco C., Lowen B., Beiko R. G., Jeffery N. W., Van Wyngaarden M., et al. (2018). A climate-associated multispecies cryptic cline in the northwest Atlantic. Sci. Adv. 4, eaaq0929. doi: 10.1126/sciadv.aaq0929
Stanley R. R. E., Jeffery N. W. (2017). CartDist: Re-projection tool for complex marine systems. doi: 10.5281/zenodo.802875
Stucki S., Orozco-terWengel P., Forester B. R., Duruz S., Colli L., Masembe C., et al. (2017). High performance computation of landscape genomic models including local indicators of spatial association. Mol. Ecol. Resour. 17, 1072–1089. doi: 10.1111/1755-0998.12629
Tanner S. E., Reis-Santos P., Cabral H. N. (2016). Otolith chemistry in stock delineation: a brief overview, current challenges, and future prospects. Fisheries Res. 173, 206–213. doi: 10.1016/j.fishres.2015.07.019
Tanner S. E., Teles-MaChado A., Martinho F., Peliz Á., Cabral H. N. (2017). Modelling larval dispersal dynamics of common sole (Solea solea) along the western Iberian coast. Prog. oceanogr. 156, 78–90. doi: 10.1016/j.pocean.2017.06.005
Teruzzi A., Bolzon G., Cossarini G., Lazzari P., Salon S., Crise A., et al. (2019). Mediterranean Sea biogeochemical reanalysis (CMEMS MED-biogeochemistry) [data set] (Copernicus Monitoring Environment Marine Service (CMEMS). doi: 10.25423/MEDSEA_REANALYSIS_BIO_006_008
Tuset V., Lozano I., González J., Pertusa J., García-Díaz M. (2003). Shape indices to identify regional differences in otolith morphology of comber, Serranus cabrilla (L. 1758). J. Appl. Ichthyol. 19, 88–93. doi: 10.1046/j.1439-0426.2003.00344.x
Valbonesi P., Sartor G., Fabbri E. (2003). Characterization of cholinesterase activity in three bivalves inhabiting the North Adriatic Sea and their possible use as sentinel organisms for biosurveillance programmes. Sci. Total Environ. 312, 79–88. doi: 10.1016/S0048-9697(03)00227-4
Valenzuela-Quiñonez F. (2016). How fisheries management can benefit from genomics? Briefings Funct. Genomics 15, 352–357. doi: 10.1093/bfgp/elw006
Vasconcelos R. P., Reis-Santos P., Tanner S., Fonseca V., Latkoczy C., Günther D., et al. (2007). Discriminating estuarine nurseries for five fish species through otolith elemental fingerprints. Mar. Ecol. Prog. Ser. 350, 117–126. doi: 10.3354/meps07109
Vaz A. C., Scarcella G., Pardal M. A., Martinho F. (2019). Water temperature gradients drive early life-history patterns of the common sole (Solea solea L.) in the Northeast Atlantic and Mediterranean. Aquat. Ecol. 53, 281–294. doi: 10.1007/s10452-019-09688-2
Waples R. S., Punt A. E., Cope J. M. (2008). Integrating genetic data into management of marine resources: how can we do it better? Fish Fisheries 9, 423–449. doi: 10.1111/j.1467-2979.2008.00303.x
Weir B. S., Cockerham C. C. (1984). Estimating F-statistics for the analysis of population structure. Evolution 38, 1358–1370. doi: 10.2307/2408641
Welch D. J., Newman S. J., Buckworth R. C., Ovenden J. R., Broderick D., Lester R. J., et al. (2015). Integrating different approaches in the definition of biological stocks: A northern Australian multi-jurisdictional fisheries example using grey mackerel, Scomberomorus semifasciatus. Mar. Policy 55, 73–80. doi: 10.1016/j.marpol.2015.01.010
Westgaard J.-I., Staby A., Aanestad Godiksen J., Geffen A. J., Svensson A., Charrier G., et al. (2017). Large and fine scale population structure in European hake (Merluccius merluccius) in the Northeast Atlantic. ICES J. Mar. Sci. 74, 1300–1310. doi: 10.1093/icesjms/fsw249
Willette D., Allendorf F., Barber P., Barshis D., Carpenter K., Crandall E. D., et al. (2014). So, you want to use next-generation sequencing in marine systems? Insight from the Pan-Pacific Advanced Studies Institute. Bull. Mar. Sci. 90, 79–122. doi: 10.5343/bms.2013.1008
Zdobnov E. M., Apweiler R. (2001). InterProScan–an integration platform for the signature-recognition methods in InterPro. Bioinformatics 17, 847–848. doi: 10.1093/bioinformatics/17.9.847
Keywords: population structure, SNPs, otolith, common sole (Solea solea), genetic environmental associations, redundancy analysis
Citation: Corti R, Piazza E, Armelloni EN, Ferrari A, Geffen AJ, Maes GE, Masnadi F, Savojardo C, Scarcella G, Stagioni M, Tinti F, Zemella A and Cariani A (2024) A multidisciplinary approach to describe population structure of Solea solea in the Mediterranean Sea. Front. Mar. Sci. 11:1372743. doi: 10.3389/fmars.2024.1372743
Received: 18 January 2024; Accepted: 15 April 2024;
Published: 01 May 2024.
Edited by:
Branko Dragičević, Institute of Oceanography and Fisheries (IZOR), CroatiaReviewed by:
Mbaye Tine, Gaston Berger University, SenegalTanja Segvic-Bubic, Institute of Oceanography and Fisheries (IZOR), Croatia
Copyright © 2024 Corti, Piazza, Armelloni, Ferrari, Geffen, Maes, Masnadi, Savojardo, Scarcella, Stagioni, Tinti, Zemella and Cariani. This is an open-access article distributed under the terms of the Creative Commons Attribution License (CC BY). The use, distribution or reproduction in other forums is permitted, provided the original author(s) and the copyright owner(s) are credited and that the original publication in this journal is cited, in accordance with accepted academic practice. No use, distribution or reproduction is permitted which does not comply with these terms.
*Correspondence: Alessia Cariani, alessia.cariani@unibo.it; Rachele Corti, rachele.corti19@gmail.com
†These authors have contributed equally to this work and share first authorship