Drone-based monitoring of intertidal blue mussel beds in the Wadden Sea – comparison of a threshold and two machine learning approaches
 Marc Schnurawa
 Jasmin S. Mueller
 Hanna Schade
 - BioConsult SH GmbH & Co. KG, Husum, Germany
In the Wadden Sea, intertidal mussel beds of the blue mussel (Mytilus edulis) and the Pacific oyster (Magallana gigas) form distinct epibenthic communities and local hotspots of high biomass and biodiversity. To detect and evaluate natural and anthropogenic processes, a ground-based monitoring program started over 25 years ago in the German Wadden Sea. In this study, we describe the potential of drones and machine learning approaches for a remote sensing-based integration into an existing monitoring program of intertidal mussel beds. A fixed wing drone was used to cover an area of up to 39ha in a single flight, with an overall time saving potential of 50%. Applying machine learning approaches, a detailed extraction of the intertidal blue mussel bed coverage with an overall accuracy (OA) up to 95.6% was reached, applying a Support Vector Machine (SVM). The application of a multispectral sensor improved the classification performance. Compared to ground-based monitoring, the drone-based method provided significantly more information on the area extension, coverage, and associated algae of the mussel beds. The results show that drones can provide a non-invasive way to survey large and difficult to access areas providing detailed maps of mussel beds and their internal structures.
1 Introduction
Worldwide, marine coastal habitats are of outstanding ecological importance as they harbor the majority of the marine organisms, provide food resources for humans, and protect the coastline from wave actions (Murfitt et al., 2017; Lau et al., 2019). In the North-East Atlantic Ocean, the Wadden Sea forms a worldwide unique habitat providing ecological important functions (Reise et al., 2010). The Wadden Sea is the largest coherent intertidal mud flat area in the world, reaching over three countries, the Netherlands, Germany, and Denmark (Kabat et al., 2012), and is declared as a UNESCO World Heritage Site.
In the Wadden Sea, mussel beds form complex biogenic hard structures in the otherwise soft-bottom intertidal area. Although they only cover a few percent (up to 6%) of the tidal basins, they contribute significantly to the total benthic biomass (Folmer et al., 2014, 2017). Blue mussels (Mytilus edulis) and Pacific oysters (Magallana gigas) form large epibenthic mussel beds and reefs in the tidal flats, having a high ecological importance and presenting local marine biodiversity hotspots (Gutiérrez et al., 2003; Buschbaum et al., 2009; van der Zee et al., 2012). These mussels, for example, can serve as feeding ground for birds (Waser et al., 2016; Herbert et al., 2018), provide home for many sessile and mobile benthic organisms (Albrecht, 1998), and support primary production in tidal flats (Engel et al., 2017).
Coastal ecosystems, as intertidal mussel beds, are usually highly dynamic as being exposed to natural pressures such as storms and ice winter (Büttger et al., 2011), as well as human-made pressures as fisheries and pollution (Herlyn and Millat, 2000; Sampaio et al., 2022). Coastal areas are further affected by climate change due to, for example, increasing natural forces, sea level rise, and increasing water temperatures which also facilitate the spread of alien species (Murfitt et al., 2017; Büttger et al., 2022).
Therefore, monitoring programs are important to detect and evaluate the status of the ecosystem and its possible changes due to natural and anthropogenic impacts (Allan et al., 2006; Long, 2011). In the northern German Wadden Sea, a ground-based monitoring program started in 1998 mapping the extension, coverage, and biomass of mussel beds as well as the composition of associated benthic organisms, including alien species. This monitoring is part of the Trilateral Monitoring and Assessment Program (TMAP, https://qsr.waddensea-worldheritage.org/reports/subtidal-habitats). The monitoring is based on ground-sampling of mussel beds as well as the analysis of aerial imagery. However, due to the extension of the mussel bed area of about 4.700 km2 it is not possible to visit all sites in one year (Wolff et al., 2010). Aerial imagery from planes or even satellites (Büttger et al., 2014; Mücher et al., 2019) provide useful additional data, but mussel beds are often hard to detect on dark mudflats so that the accuracy of aerial imagery may be low without ground-truthing.
In the last decade, the development of new sensors and analytical methods in the field of remote sensing, lead to complement or replace traditional ground-based monitoring. Surveys with drones (unmanned aerial vehicle, UAV) address a large range of interests in the marine research. For example, threatened animals can easier be detected in a large area (Landeo-Yauri et al., 2020; Barreto et al., 2021), and it can also be used for the detection of harmful algal bloom outbreaks (Wu et al., 2019), or the investigation of marine vertebrate behavior (Raoult et al., 2018; Schofield et al., 2019; Oleksyn et al., 2021), for pollution monitoring (Gonçalves et al., 2022; Wolf et al., 2023), and to assess the distribution of marine habitats. Drones could further be used as early detection of sharks in nearshore areas (Butcher et al., 2019).
Studies focusing on drone-based methods in ecological monitoring are lacking for the Wadden Sea, and just few applications do exist for such areas. For example, drone-based surveys do exist to this date for breeding birds in the marshlands and dunes, for monitoring of plant species distribution of saltmarsh areas, and for mapping of seagrass (Corregidor-Castro et al., 2021; Oldeland et al., 2021; Svane et al., 2022; Ventura et al., 2023). Furthermore, some studies focused on remote sensing monitoring based on satellite data to study, for example, long-term water quality (Arabi et al., 2020), macrostructures, and intertidal habitats like seagrass meadows and mussel beds (Müller et al., 2016; Adolph et al., 2018; Kohlus et al., 2020). However, satellite data provide a more overall picture at coarse resolution (> 30 cm) but can cover a large area. Drones offer the possibility of obtaining imagery at much higher resolution as compared to aerial or satellite data, though at the costs of smaller area coverage. Drones thus offer the option to look much more into the structure of marine habitats (Hoffmann et al., 2023) and may allow data acquisition which is not possible with the other remote sensing methods.
In this study, we applied drone-based surveys at two intertidal blue mussel (Mytilus edulis) beds in the Wadden Sea National Park of Schleswig-Holstein to monitor the total area and the coverage of mussels. The same mussel beds are also monitored by traditional ground-based monitoring enabling us to compare both methods. Moreover, different image analysis techniques were investigated to find appropriate approaches for drone-based surveys in this area. This study aims to evaluate to what extent drone-based monitoring could support or replace traditional ground-based monitoring on intertidal mussel beds and elaborate possible limitations. Furthermore, this study gives recommendations for further improvement of remote sensing techniques as a non-invasive method for ecological monitoring in intertidal areas in the future.
2 Materials and methods
2.1 Study area
Two intertidal blue mussel beds were investigated on the tidal flats of the Hever tidal basin (abbreviated as HE), located in the North Frisian Wadden Sea of the southeastern North Sea (German Bight). These two mussel beds were called HE07 and HE11. The intertidal mussel beds are located south of Nordstrand, approx. 0.8 km (HE11) and 1.7 km (HE07) from the shoreline (Figure 1).
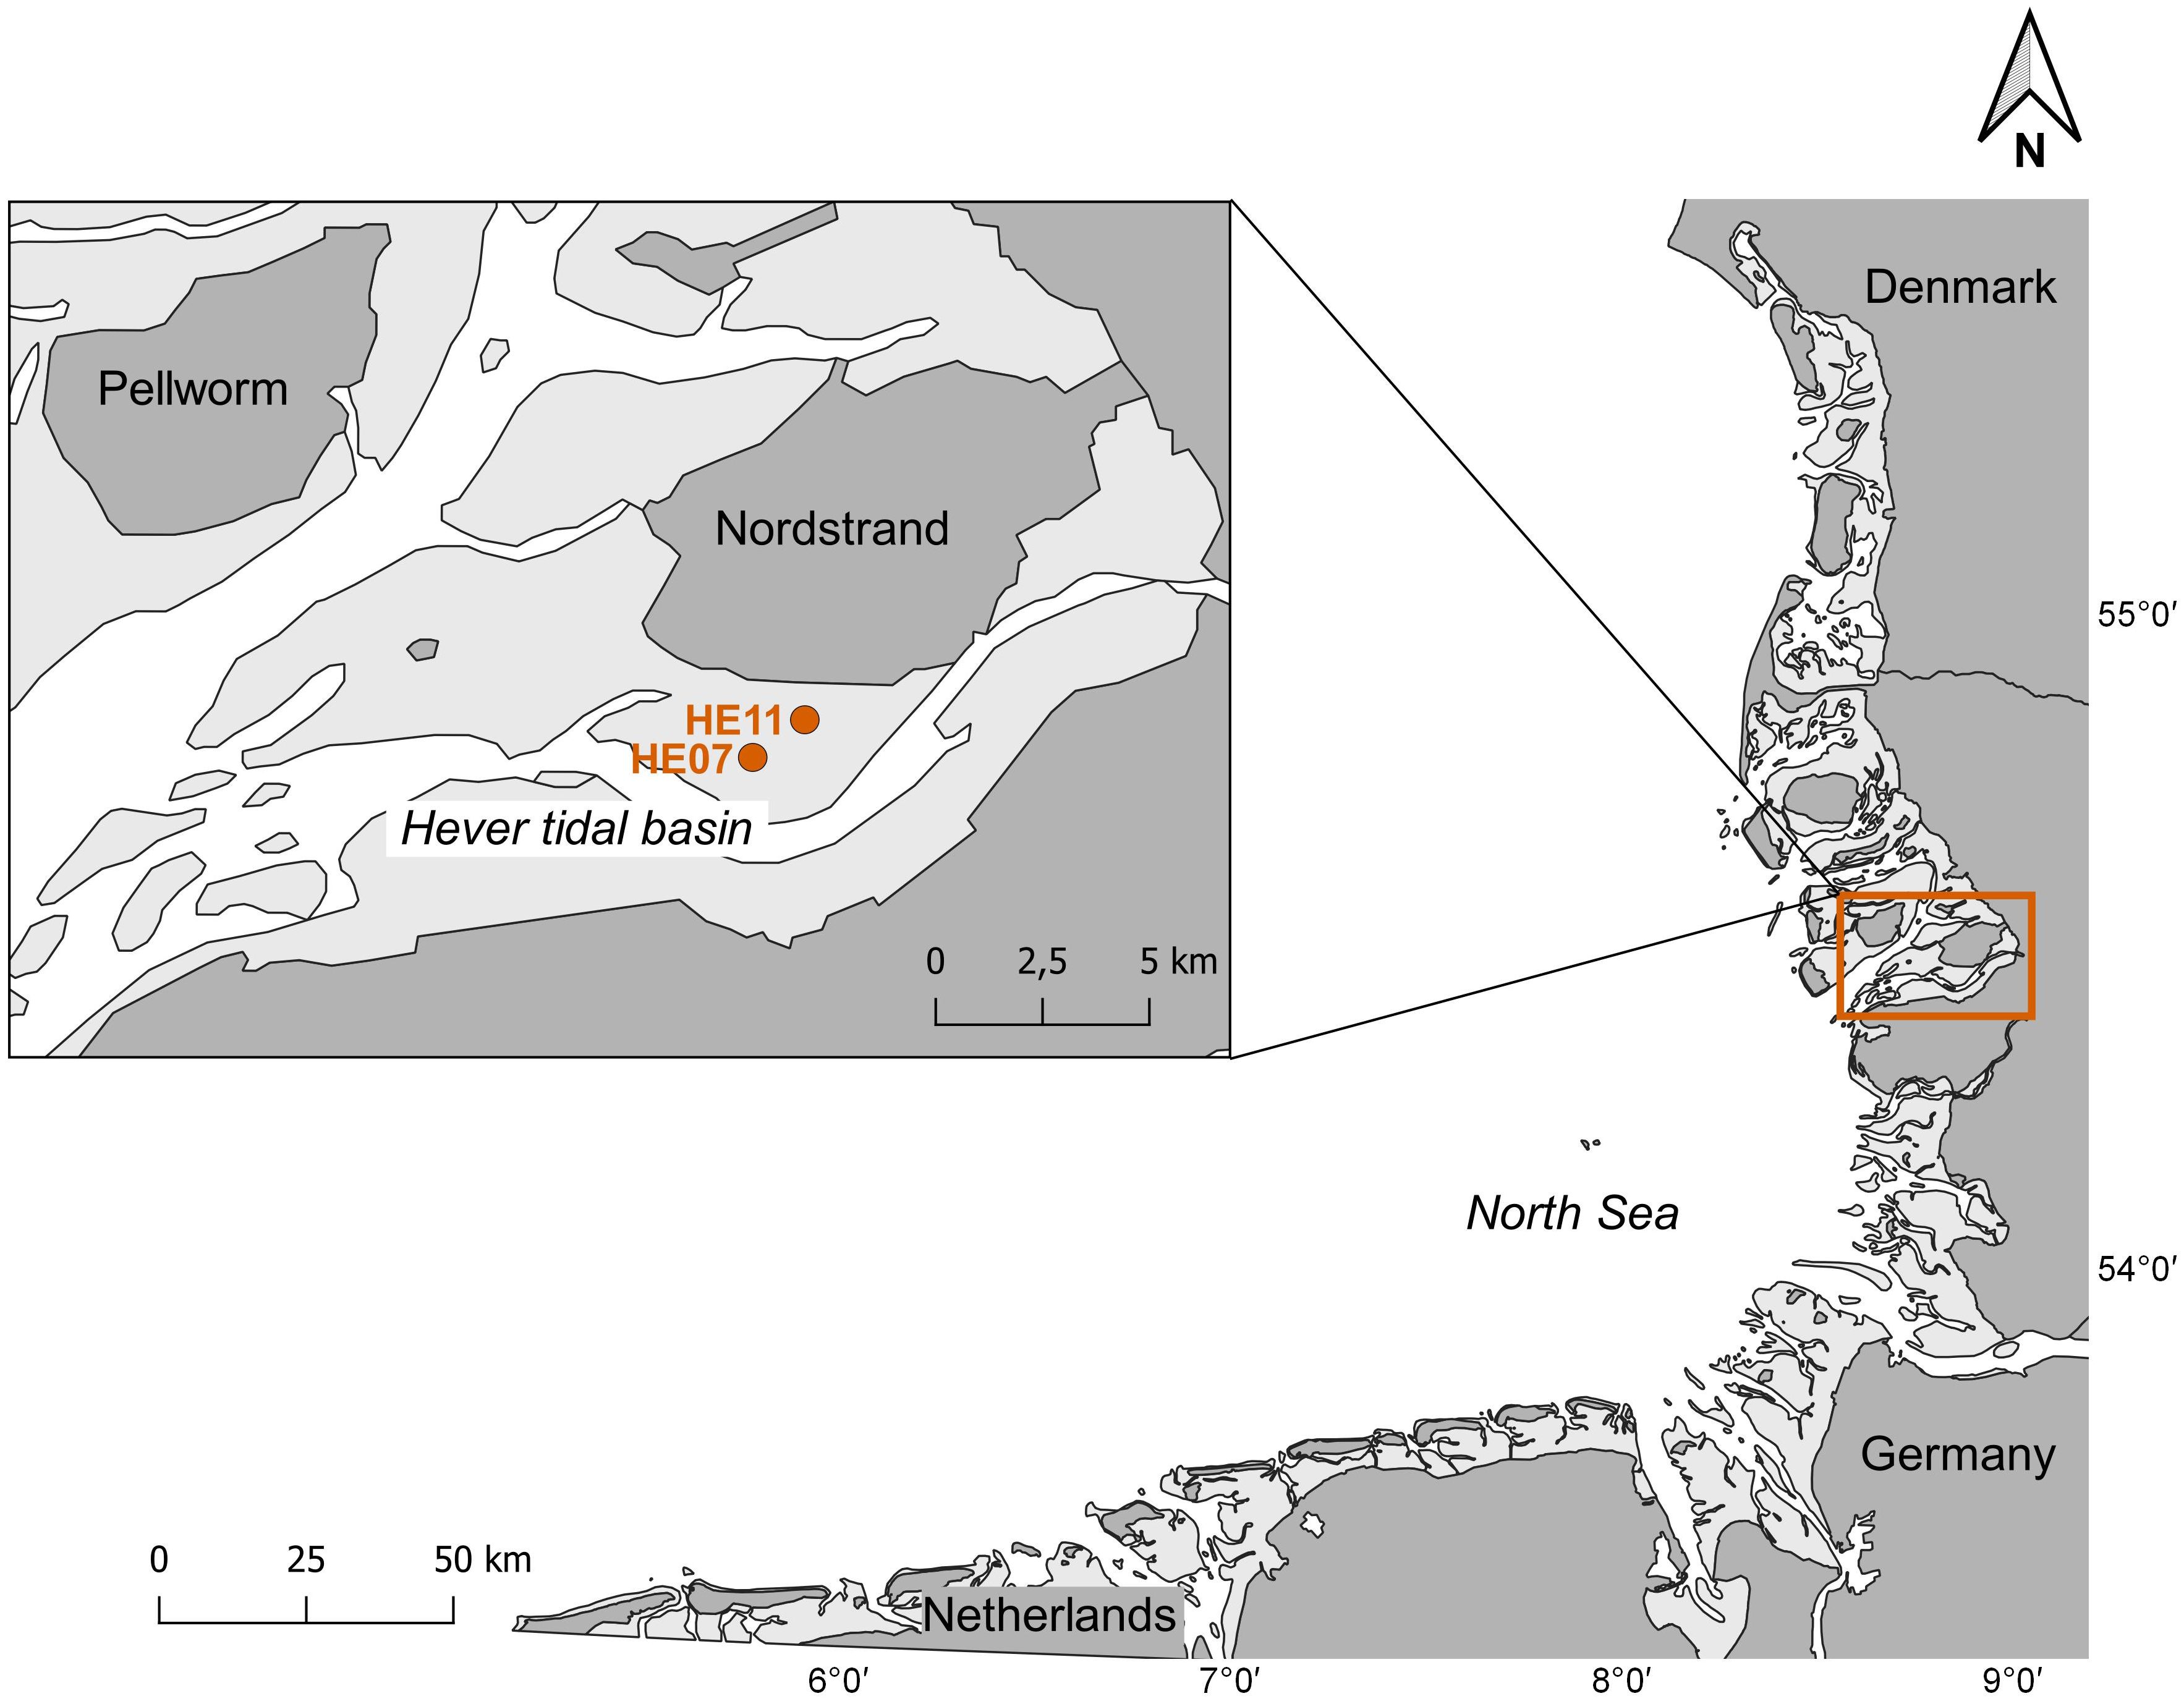
Figure 1 Map of the intertidal blue mussel bed locations HE07 and HE11. The locations of the two mussel beds are indicated as red dots. The trilateral Wadden Sea area is represented with landmasses and islands (dark grey), tidal flats (light grey), and water bodies (white). The map was created with QGIS (version 3.16.6).
The area around the two investigated mussel beds is mainly characterized by sandy soft-bottom, muddy zones, and tidal tideways. The mussel beds are exposed to semi-diurnal tides and fall dry during low tide.
2.2 Ground-based monitoring
The ground-based monitoring for this study was conducted within the long-term monitoring program on mussels in the Wadden Sea National Park of Schleswig-Holstein which covers a greater area. This study covers data from the Hever tidal basin, which were collected in July 2019 (HE11) and July 2020 (HE07).
2.2.1 Total mussel bed area
To determine the total area of the two mussel beds through the ground-based survey, each mussel bed was surrounded by foot in the tidal flats and the position coordinates were thereby determined every 10 seconds with the help of a global positioning system (GPS) device. Based on the position coordinates, polygons were generated in QGIS (v 3.16.6), and the total area was calculated using these polygons.
2.2.2 Mussel bed coverage
The percentage coverage of the mussel beds was determined using the so-called “boot method” (Walker and Nicholson, 1986; Nehls et al., 2009). Thereby, the mussel bed will be crossed in linear transects and zigzags within the previous delineated outer line. While walking along the transect, the steps on mussels and the steps on bare sediment will be counted. At least 1000 steps should be done in this process. The ratio of the number of steps on mussels to the total number of steps gives the percentage coverage of mussels. Coverage of shell detritus, macrophytes, and water was estimated by visual observations during the ground-based monitoring and documented in field protocols.
2.3 Drone-based monitoring
Flights were conducted in August 2020 (HE07) and September 2020 (HE11) by using a WingtraOne drone. WingtraOne is a fixed wing drone with “vertical take-off and landing” (VTOL) functionality. VTOL facilitates the application in difficult terrain like the Wadden Sea, where the landing area can be limited or dangerous for the sensors. The flight routes of the drone surveys were planned and programmed within WingtraPilot allowing an autonomic flight under the control of the pilot. For each mussel bed, two flights were done perpendicular to each other so that an overlap of 80% was achieved. For these two flights, the Sony QX1 20 mm RGB camera with a ground sampling distance (GSD) of 1.4 cm/pixel was used. A third flight was done for each mussel bed with the MicaSense Altum multispectral camera including six sensors and with a ground sampling distance of 3.8 cm/pixel. All flights were performed in a height of 68 and 80 m for the RGB camera and the multispectral camera, respectively, and lasted 20 to 45 minutes each. All flights were performed ± 1.5h before and after low tide.
Pictures were georeferenced with an accuracy of 2-3 cm, done by an integrated post-processed kinematic module (PPK) and a Stonex S900T GNSS receiver. The pictures were merged into large-scale georeferenced aerial pictures with the software Pix4D mapper. The evaluation of the aerial pictures was done with QGIS and R Statistical Software version 3.6.3 (R Core Team, 2020) using RStudio (version 1.2.5033). Within RStudio the packages random Forest version 4.6.14 (Liaw and Wiener, 2002) and e1071 version 1.7.3 (Meyer et al., 2019) were used for training and applying the machine learning approaches Random Forest (RF) and Support Vector Machine (SVM) and the package ggplot2 version 3.3.2 (Wickham, 2016) was used for visualization.
The complete workflow of drone-based monitoring is summarized in Figure 2.
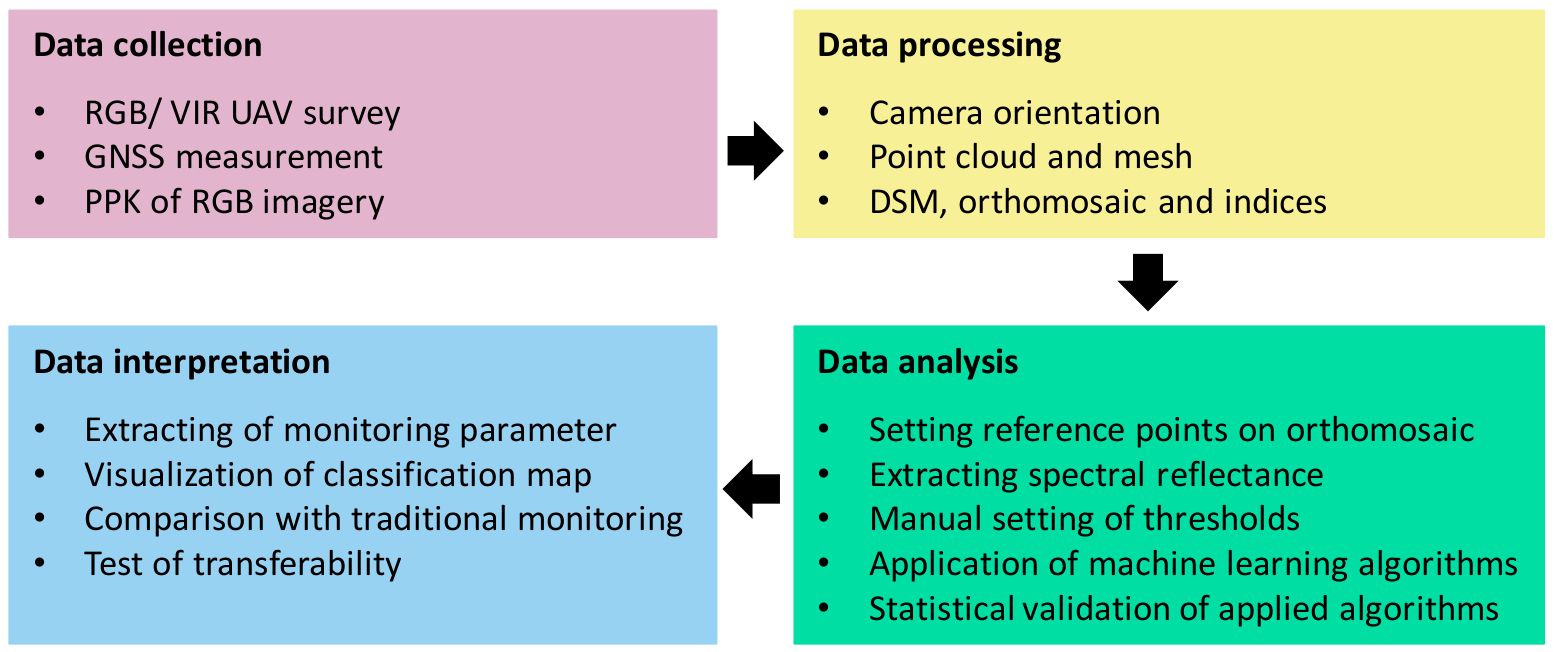
Figure 2 Overview of the process workflow of drone-based blue mussel bed monitoring. The figure shows the workflow from data collection to data interpretation.
2.3.1 Total mussel bed area
The total area of the mussel beds was visually delimited within QGIS by marking the outer boundary of the mussel bed. The very high resolution of the drone imagery (GSD: 1.4 cm and 3.8 cm) enabled a visual identification of mussels and therefore the determination of the boundaries. The resulting polygons were used to calculate the total area.
2.3.2 Mussel bed coverage
The coverage of the mussel bed was investigated by applying a simple threshold method and two machine learning approaches using the multispectral imagery. For the threshold method, a combination of the Green Normalized Difference Vegetation Index (GNDVI) (Table 1) and the green band of the multispectral camera were used with threshold values of 0.2125 and 0.0825 for HE07 and 0.2125 and 0.035 for HE11. The threshold values were empirically chosen based on the reflection distribution of reference values (Figure 3).

Table 1 Description of the selected Vegetation indices that were included as description features in SVM and RF.
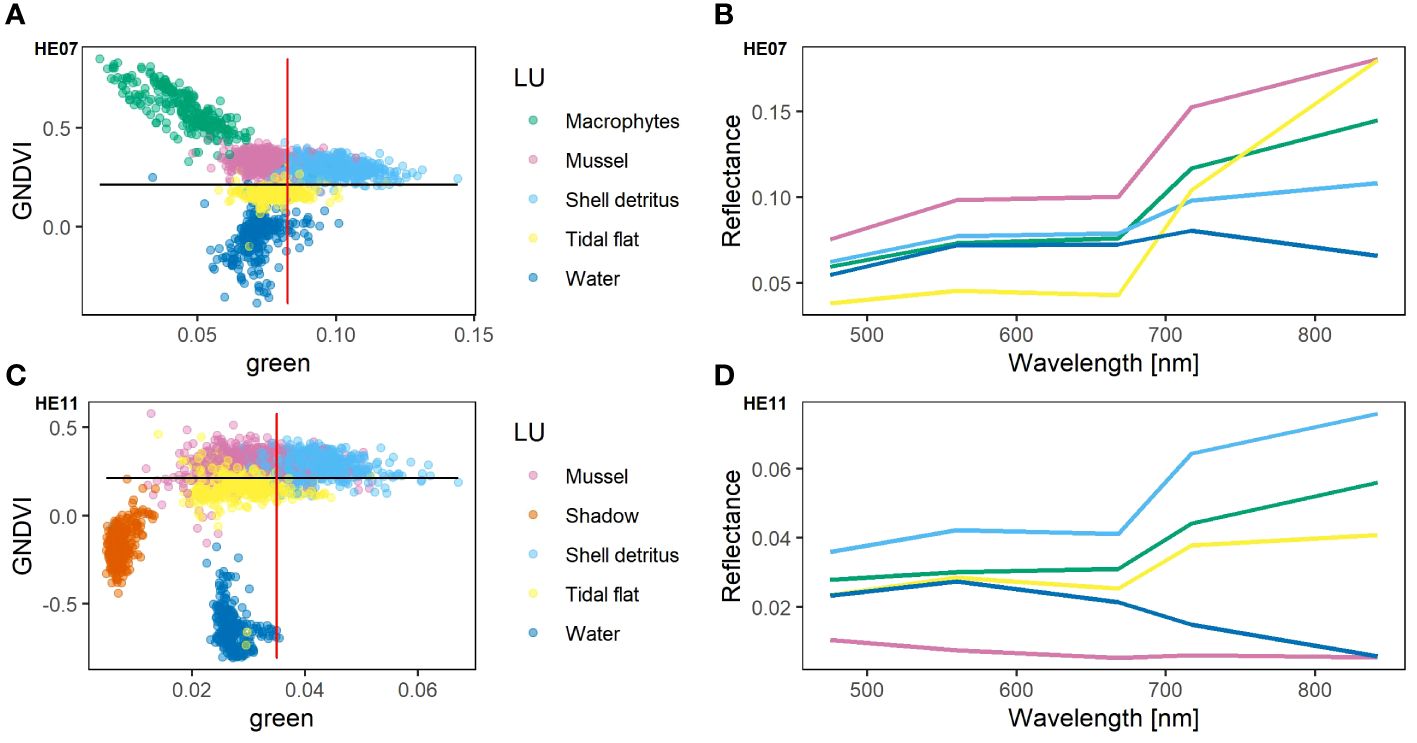
Figure 3 Spectral signal of the reference data set of HE07 and HE11. (A, C): Spectral signal of the reference for GNDVI and the green band. The red and black lines mark the chosen threshold values (HE07: GNDVI 0.2125, green 0.0825, HE11: GNDVI 0.2125, green 0.035). (B, D) Average reflectance of the occurring landcover classes for HE07 and HE11. (A–D) is from upper left to down right.
The machine learning approaches applied were Random Forest (RF) and Support Vector Machine (SVM).
RF is a non-parametric machine learning classifier which combines independent decision trees into an ensemble learning algorithm (Breiman, 2001). The assumption is that independent trees generate individual errors that are not generated by the majority of other trees. The combination of independent classifiers also reduces the variance and bias of the algorithm (Breiman, 2001; Waske and Braun, 2009). All decision trees emerged from a learning process. The starting point of the RF are reference points, which were randomly separated into two datasets for training and for validating the algorithm.
SVM is a classifier that uses reference data to create a decision surface, separating the input data into user-defined classes (Waske and Benediktsson, 2007). If the chosen classes are not linearly separable, SVM can transform them into a high-dimensional space using kernel methods. A commonly used kernel function is the radial basis function (Waske and Benediktsson, 2007) which was applied in this study. To train and validate the SVM, reference points were used, which were randomly separated into a training and a validation dataset.
Both, RF and SVM were applied for a pixel-based (pixel size 3.8 cm x 3.8 cm) classification of the drone footage. The spectral bands of the MicaSense Altum sensor as well as five selected vegetation indices were used as input features. The applied vegetation indices are: Normalized Difference Vegetation Index (NDVI), Blue NDVI (BNDVI), Green NDVI (GNDVI), Normalized Difference Red Edge (NDRE) and redEdge NDVI (Rendvi2) (Table 1). To have a first indication whether the occurring land cover classes can be distinguished by their spectral characteristics, the spectral signal of the reference points were extracted and displayed in Figure 3. The average reflectance of the occurring land cover classes shows differences in its intensity and shape which indicates that a discrimination of the classes is possible.
To train and validate the RF and the SVM, a total of 4,100 reference points, 3,050 for training and 1,050 for validation, of the six occurring land cover classes (macrophytes, mussel (referring to blue mussels), shadow, shell detritus, tidal flat and water) were manually set using the RGB orthomosaics within QGIS. The classes water, macrophytes, and shadow were easier to differentiate to the rest of the classes, and therefore less reference points were set (Table 2). Furthermore, the class macrophytes were only included in HE07 as the reference points of the class were limited at HE11. The class shadow was only used for HE11 due to different acquisition times between both study areas, and negligible shadow areas at HE07.
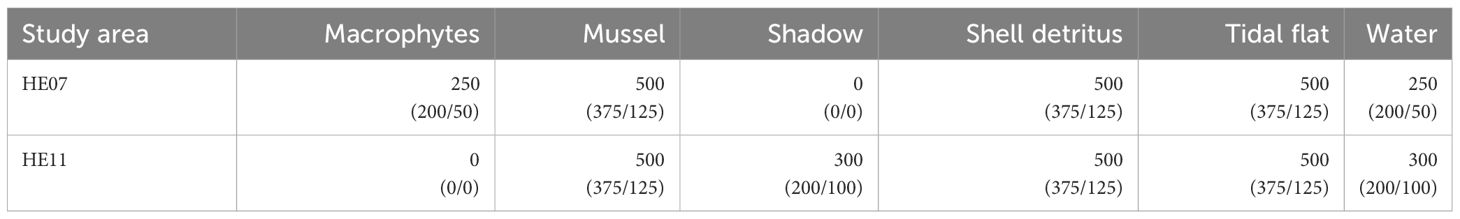
Table 2 Number of reference points of the occurring land cover classes for the two study areas HE07 and HE11. In parenthesis (training data/validation data).
The validation of the classification results of all three methods was obtained using a confusion matrix. The confusion matrix gives conclusions about the overall accuracy (OA), the user’s accuracy (UA) and the producer’s accuracy (PA) and allows an estimation of the area coverage of the single classes. The number of correctly classified validation points divided by the total number of validation data gives the OA. The UA is computed dividing the number of correctly classified validation data to the total amount of validation data assigned to a particular class. The PA reflects the number of validation data of a certain class correctly assigned to the corresponding class (Strahler et al., 2006).
To determine the degree of coverage, first the number of pixels per class was multiplied by the area per pixel within QGIS. This area can then be corrected using a probability-confusion matrix, which indicates the probability that a pixel classified as belonging to a particular class really belongs to that class. By assuming a standard error, error intervals were calculated. For this purpose, the 95% confidence interval was used in this study to calculate the corrected area as follows: , with the corrected area A and the standard error (std) (Olofsson et al., 2014). As an additional validation parameter, the F-score was calculated in this study. The F-score gives a measure of the overall quality combining UA and PA as following (Zheng et al., 2021):
3 Results
3.1 Ground-based monitoring
The size of the total mussel bed area accessed from the ground-based monitoring of HE07 in 2020 was 4.34 ha, and of HE11 in 2019 11.19 ha. The mussel bed coverage determined by the “boot method” was 22.8% for HE07 and 20.8% for HE11.
3.2 Drone-based monitoring
3.2.1 Total mussel bed area
Within the drone surveys, the size of the total mussel bed area was retrieved by manually setting boundaries within QGIS using the RGB orthomosaics. A total area of 4.83 ha for HE07 and 11.60 ha for HE11 was calculated.
3.2.2 Comparison of threshold and machine learning approaches
The results of the GNDVI-green threshold method, Random Forest, and Support Vector Machine were compared in means of their respective OA, UA, PA, and F-score (Table 3). Therefore, one third of the reference data was used for validation. The resulting OA varied from the lowest percentage of 81.6% for GNDVI-green to the highest percentage of 95.6% for SVM. For both study areas, the highest OA was reached applying SVM with 95.6% for HE07 and 93.5% for HE11. The lowest OA was reached applying the threshold method with 92.6% for HE07 and 81.6% for HE11.
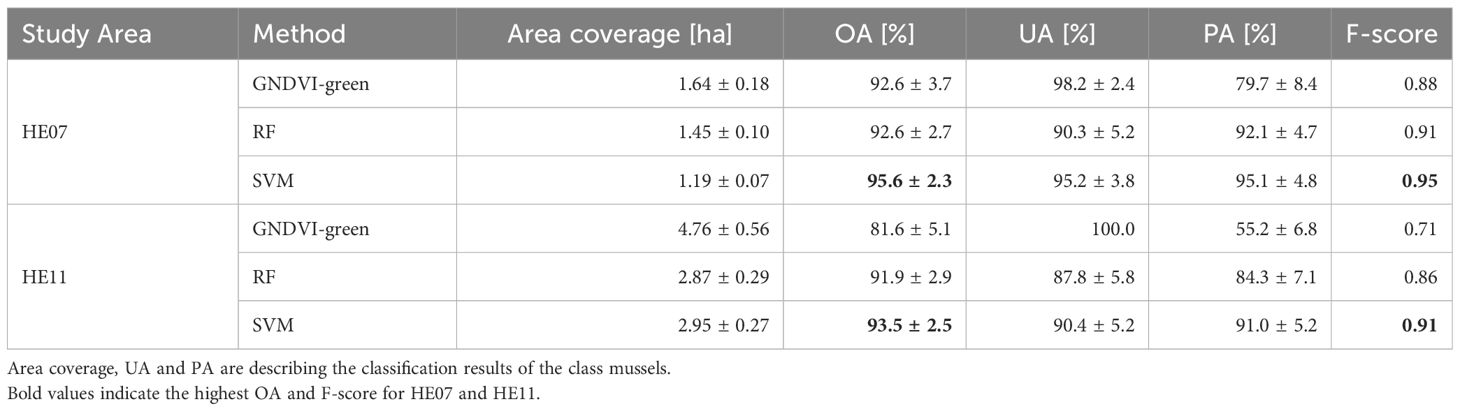
Table 3 Overview of the classification results for HE07 and HE11 for the area within the boundaries set on the drone footage.
The UA was highest for the GNDVI-green threshold method with 98.2% for HE07 and 100% for HE11 (Table 3), showing a low number of False Positives (wrongly as mussel assigned objects), but with a corresponding PA of 79.7% for HE07 and 55.2% for HE11, which indicates a high number of False Negatives (mussels that were not assigned as such). The highest PA values were reached applying SVM with 95.1% for HE07 and 91.0% for HE11.Taking a possible interrelation between UA and PA into account, the F-score of the different methods was compared as it combines UA and PA. The highest F-score at both study areas was reached applying SVM with values of 0.95 for HE07 and 0.91 for HE11 (Table 3).
Comparing the results of both study areas (HE07 and HE11), the classification accuracy of the respective methods was higher for HE07 compared to those at HE11 (Table 3). The biggest difference could be observed for the threshold method with a difference of 11% in OA, 0.17 in the F-score and 24% in PA, comparing both study areas. Whereas the UA stays constant, the drop the percentage in PA from HE07 to HE11 indicates an underestimation of the actual mussel area in the classification map of HE11. For the calculation of the final area coverage as given in Table 3, the area of the classified pixel was corrected by a probability-confusion matrix taking UA and PA into account. For HE11 the intended correction led to an overestimation (more than 30% compared to the area retrieved by RF and SVM) of the area coverage of mussels retrieved by the GNDVI-green threshold method.
Beside the statistical comparison, a visual inspection of the classification results was performed. In Figure 4 a subset of the classification area of HE07 is shown. Whereas the threshold method only differentiated between mussel and non-mussel area (Figure 4B), RF (Figure 4C) and SVM (Figure 4D) produced a classification map of five classes. The classification maps show that the mussel area was reproduced by all methods, confirming good statistical results. Anyhow, on this scale small differences between the methods can be observed. Therefore, in Figure 5 the same subset of HE07 is shown, comparing only pixel that were classified as mussels with either RF or SVM or with both.
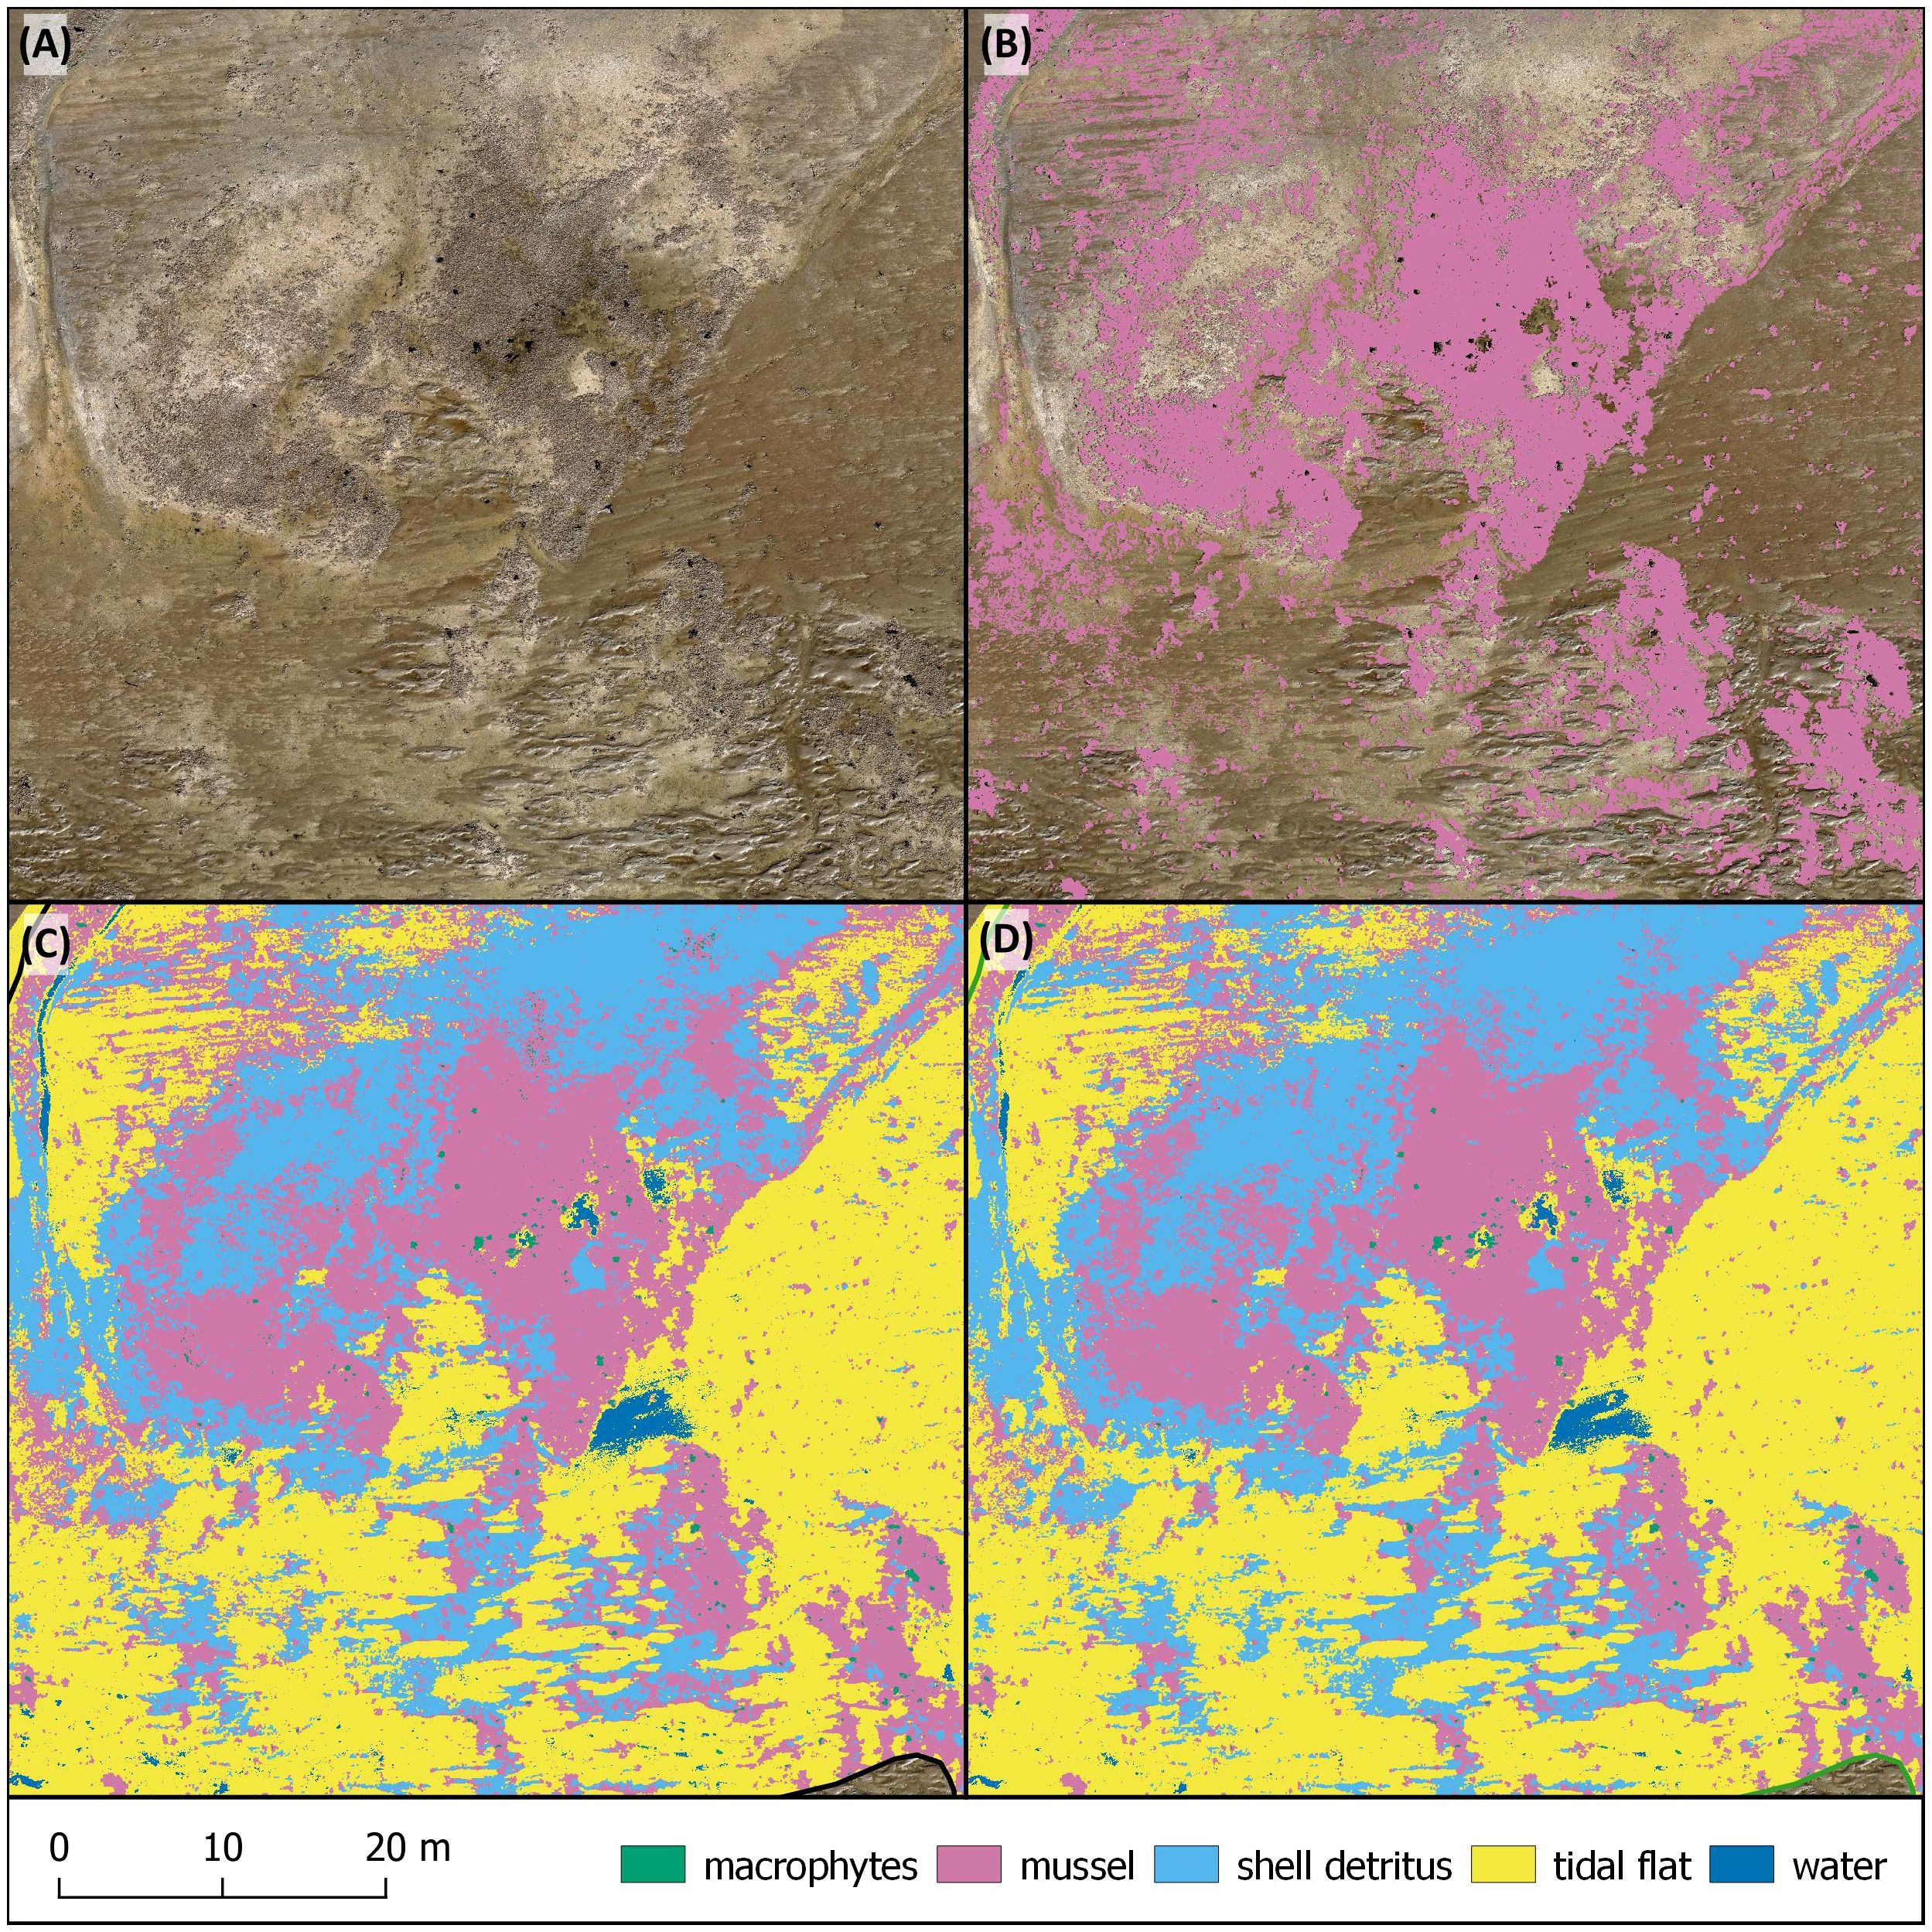
Figure 4 Classification map of a subset of HE07. (A) RGB imagery of the area. (B) Classification map using GNDVI-green threshold (C) Classification map using Random Forest (D) Classification map using Support Vector Machine. (A–D) is from upper left to down right.
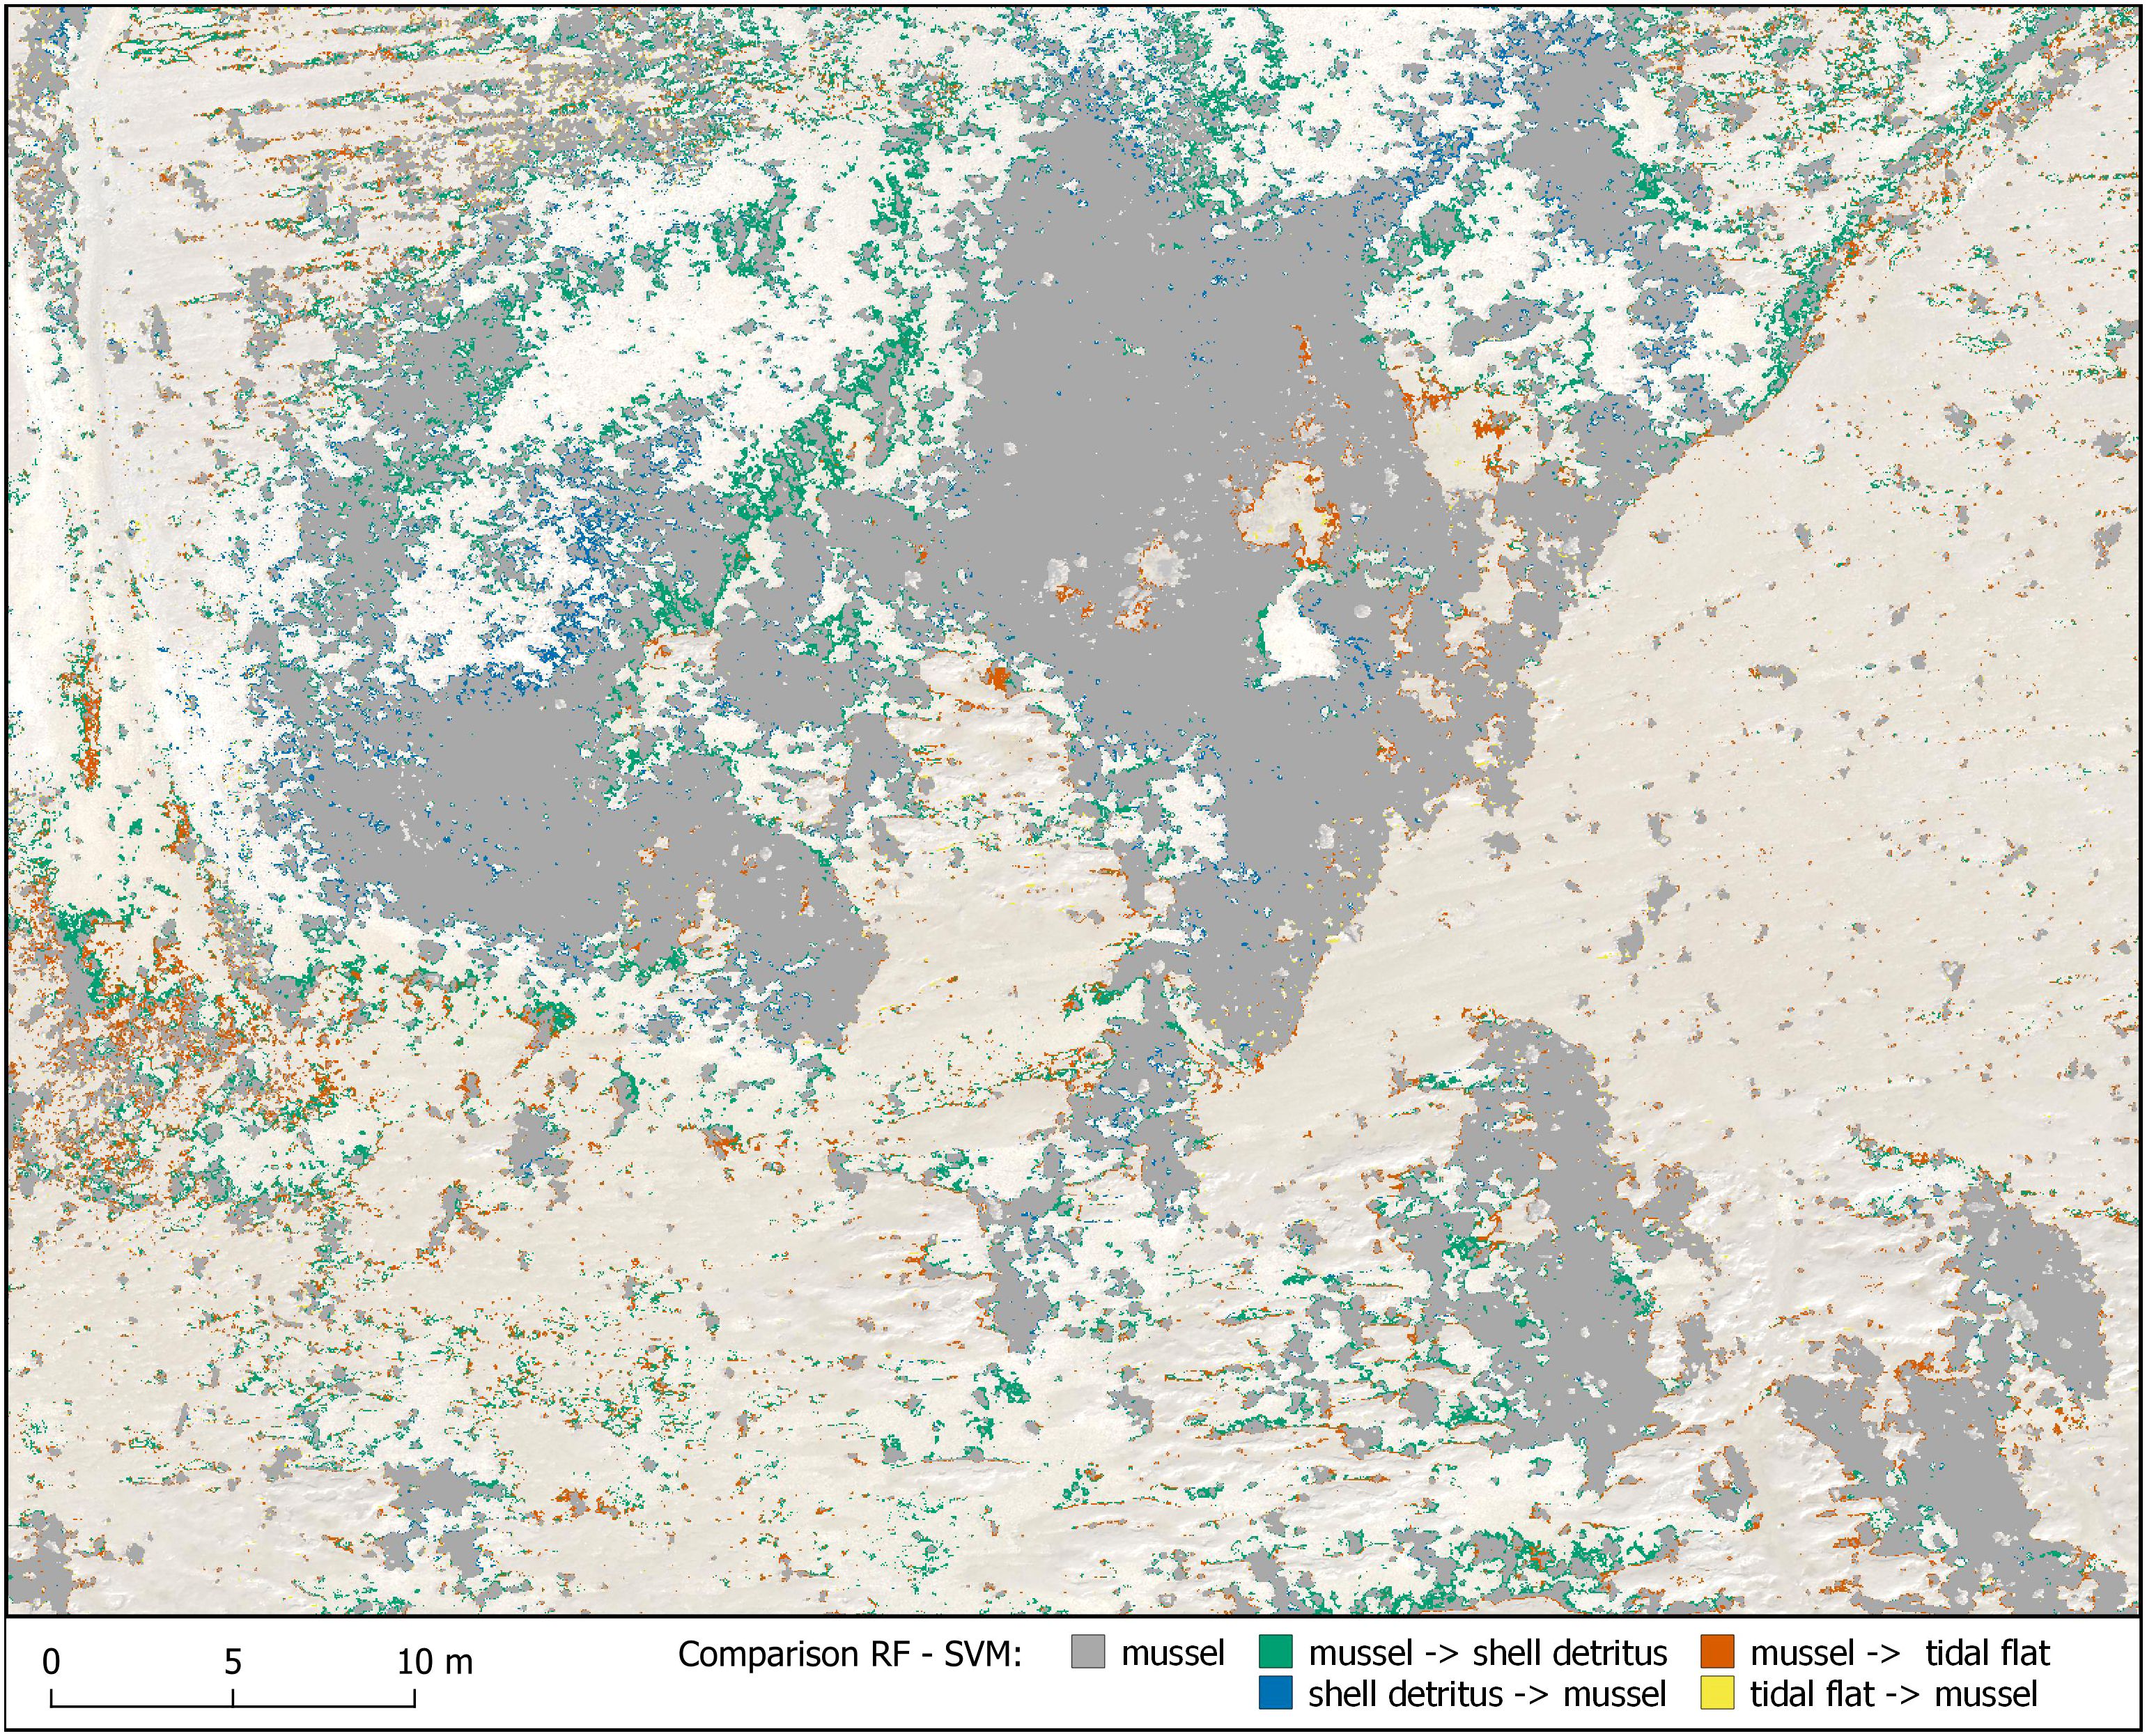
Figure 5 Comparison of pixel classified as mussels by Random Forest (RF) and Support Vector Machine (SVM). In green and orange, pixel are displayed that were classified as mussels with RF and as shell detritus or tidal flat with SVM. In blue and yellow pixel are shown that were classified as shell detritus or tidal flat with RF and as mussels with SVM. In grey pixel are shown that were classified as mussel with both approaches.
Five resulting scenarios are shown in Figure 5:
(1) Pixel classified as mussels with both approaches
(2) Pixel classified as mussel with RF and as shell detritus with SVM
(3) Pixel classified as mussel with SVM and as shell detritus with RF
(4) Pixel classified as mussel with RF and as tidal flat with SVM
(5) Pixel classified as mussel with SVM and as tidal flat with RF
The comparison map shows that the main mussel patches were identified by both methods (Figure 5). Some differences between both approaches can be observed on the edges of the mussel area. RF classified more pixel as mussel than SVM.
3.2.3 Mussel bed coverage
The mussel bed coverage within the drone-based boundaries extracted by the threshold method, RF, and SVM varies between 1.19 ha and 1.64 ha for HE07 and between 2.87 ha and 4.76 ha for HE11 (Table 4). The highest area coverage was observed using the GNDVI-green threshold and the lowest by applying SVM for HE07 and RF for HE11. For HE07, the area coverage calculated by the three methods varies between all three methods (Table 4). For HE11, the results of RF and SVM only differs around 0.7%, but the statistical results indicate a overestimation of the mussel bed coverage calculated by the threshold method (threshold: 42.6 ± 5.1 against RF: 25.7 ± 2.5/SVM: 26.4 ± 2.0).
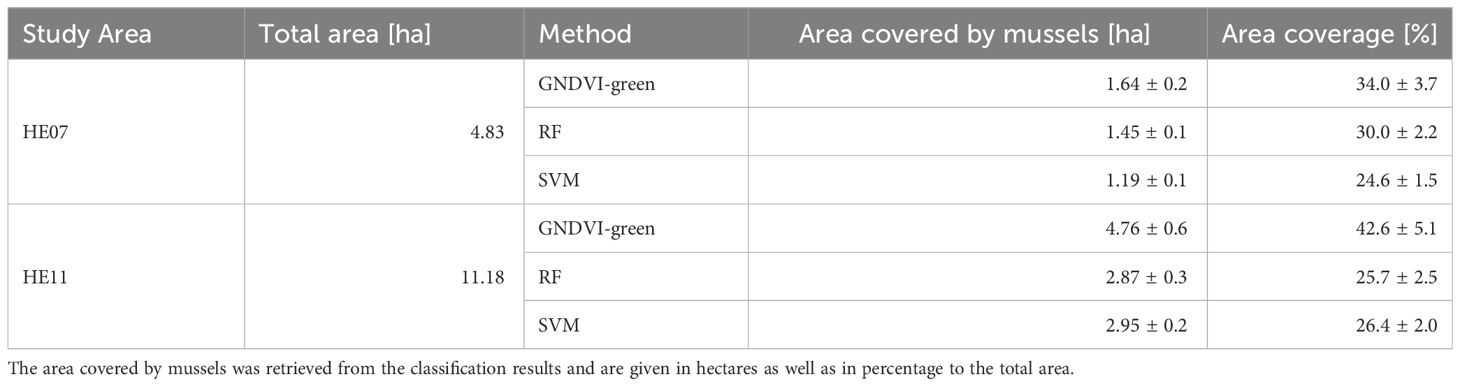
Table 4 Mussel bed coverage of HE07 and HE11, calculated by using the boundaries which were set on the RGB drone imagery.
Beside the mussel bed coverage, RF and SVM also allowed an extraction of the area coverage of the other occurring land cover classes (Table 5). The classes mussel, shell detritus, and tidal flat combine a coverage of more than 95% of both study areas, with tidal flat being the most prominent class. The class shell detritus which was difficult to discriminate from the mussel bed area represented between 19.4% for HE11 and 25.3% for HE07.
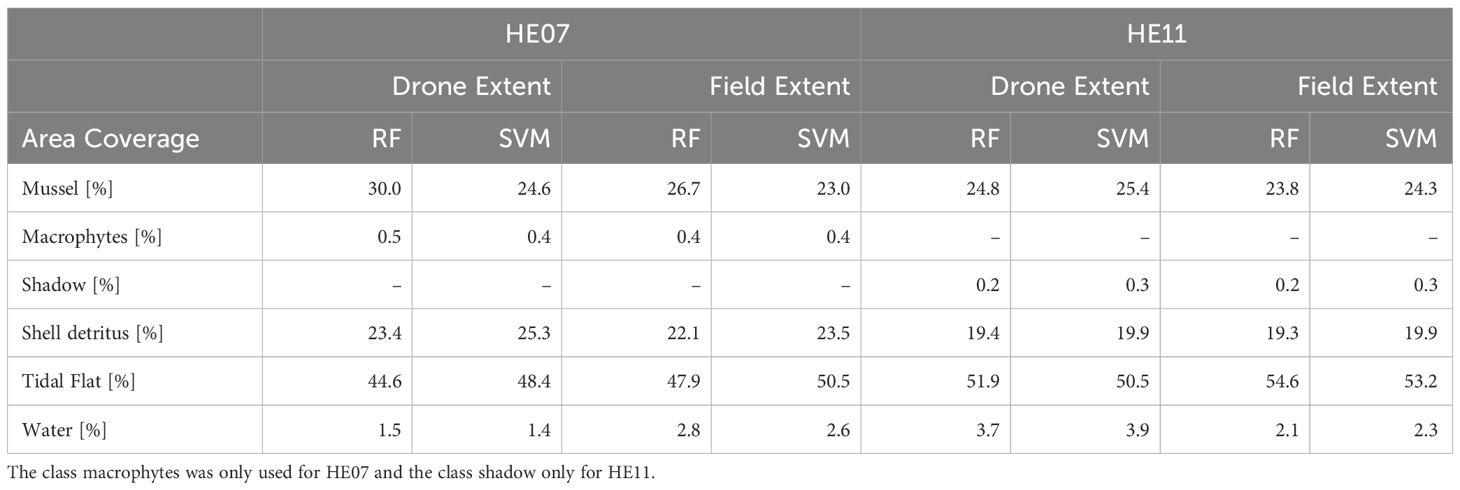
Table 5 Area coverage for the occurring land cover classes retrieved by the classification results of RF and SVM, for both the ground-based boundaries (field extent) and the drone-based boundaries (drone extent).
3.3 Drone-based vs. ground-based monitoring
3.3.1 Total mussel bed area
The mussel bed area retrieved by the ground-based monitoring and the area retrieved by the drone footage, show a difference of area size of 11.2% for HE07 and 3.5% for HE11 (Table 6).
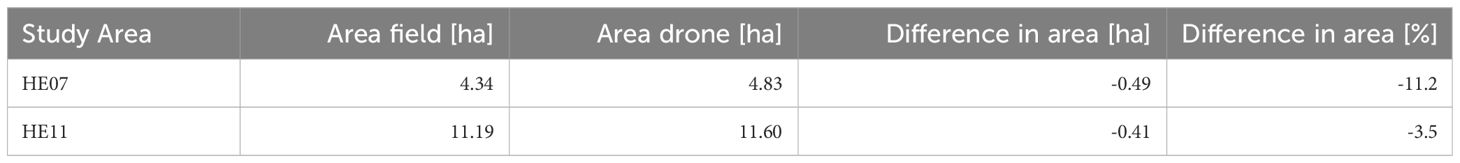
Table 6 Comparison of the total mussel bed area retrieved by in-field measurement and by interpretation of the drone footage.
The boundaries in the western part of HE07 differ only slightly, comparing the total mussel bed area investigated by foot and by drone (Figure 6). At the central part of the mussel bed, the drone-based method excluded large areas of tidal flat (Figure 6B) which were included with the ground-based method (Figure 6A). The eastern part of the mussel bed differs with an increase in mussel bed area retrieved by the drone imagery compared to the ground-based boundaries. For both study areas, the total mussel bed area retrieved by the drone imagery was larger compared to the ground-based application (Table 6).
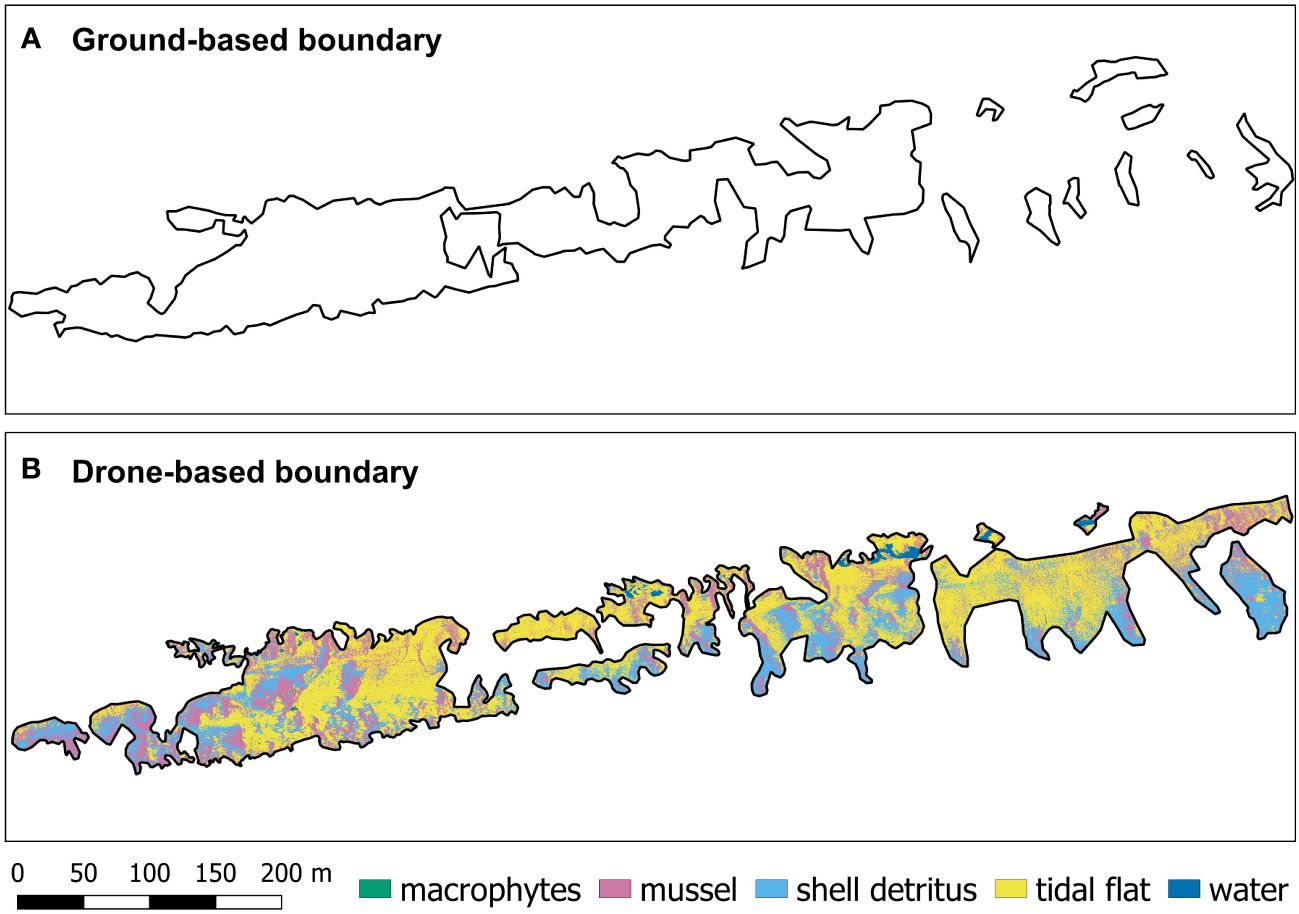
Figure 6 Comparison of the boundaries of the total mussel bed area of HE07 from ground-based and drone-based monitoring. Shown are (A) the mussel bed boundaries from the ground-based monitoring and (B) the boundaries from the drone-based monitoring including the SVM classification results.
3.3.2 Mussel bed coverage
The mussel bed coverage determined during the ground-based monitoring was 22.8% for HE07 and 20.8% for HE11 (Table 7). For the drone imagery only RF and SVM were used for a comparison as the threshold method showed an overestimation of the mussel bed coverage. Using the same area boundaries, the mussel bed coverage retrieved from the drone imagery varied between 23.0% and 26.7% for HE07 and 23.8% and 24.3% for HE11, depending on the applied classification method (Table 7). Using the boundaries set on the drone footage, the mussel bed coverage increases for both study areas with a mussel bed coverage of 24.6% and 30.0% for HE07 and 24.8% and 25.4%, for HE11.
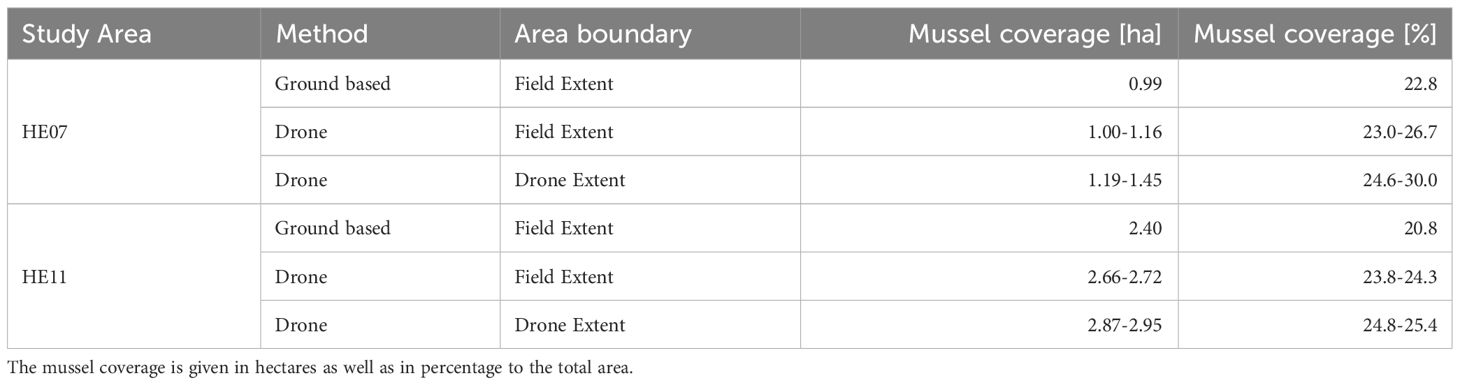
Table 7 Total area of mussel beds retrieved from the ground-based monitoring and from the results of the machine learning approaches RF and SVM.
3.3.3 Time-efficiency
Besides to the monitoring performance, also the time-efficiency of each method was evaluated. The ground-based monitoring in the Wadden Sea takes on average 270 minutes for one mussel bed, excluding travel. Most time is needed for the fieldwork (Table 8). The drone-based monitoring requires on average 180 minutes for a standardized monitoring of one mussel bed, excluding travel and battery charging. Here, most time is required for the post-processing. The fieldwork time refers to a single flight of the MicaSense Altum applied on a WingtraOne drone. The RGB surveys applied in this study are not required in future applications as the GSD of MicaSense Altum is sufficient to extract the total mussel bed area as well as for setting reference points for training and validation.
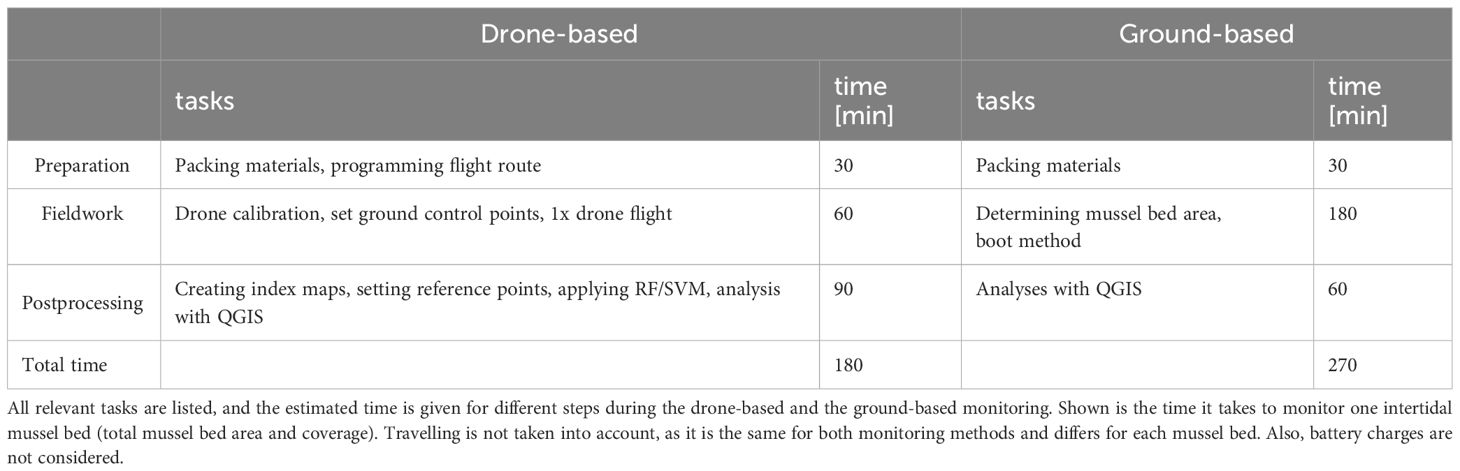
Table 8 Time schedule of an integrated drone-based and the ground-based monitoring.
4 Discussion
The results of the drone-based monitoring show that aerial surveys provide a new and non-invasive method for mapping the area and coverage of mussel beds and can be used as an additional tool of the traditional ground-based mussel monitoring, especially in locations of the tidal flats that are difficult to access or muddy. As even small aggregations of mussels can be detected automatically on high-resolution drone imagery, drone-based surveys provide much more detailed maps of mussel bed boundaries and internal structure compared to the ground-based surveys, as not all parts of the mussel bed can always be reached in the field through time limitations, not passable tideways, or muddy areas.
Beside the mussel bed area, the drone imagery provides a detailed insight into the internal structure of the mussel beds which can be compared by GIS-analyses from year to year, while the ground-based monitoring only allows to analyze changes of total area and mean coverage. The drone method is likely more precise than the current approach. Whereas the “boot method” takes only a sample of the survey area to estimate the coverage, the drone-based method can detect spatial variations within the mussel bed giving a more detailed picture. This can lead to an over- and/or underestimation of single parts of the mussel bed area, especially in the inner parts (Figure 6).
Using the ground-based boundaries of the mussel bed, a difference of mussel coverage of 0.2% - 3.9% for HE07 and 3.0% - 3.5% for HE11 was observed, depending on the applied classifier. Using the drone-based boundaries the difference in coverage between the two monitoring methods gets even higher, with 1.8% - 7.2% for HE07 and 4% - 4.6% for HE11. The results show that the drone-based boundaries give a more exact description of the actual total mussel bed area, as the relative coverage is increasing with a parallel increase in area. Due to temporal differences between the ground-based and the drone-based monitoring, natural variances in size and coverage might occur. Following Nehls et al. (2009), especially scattered mussel patches are the dynamic component of an intertidal mussel bed and most of them disappear within one or two years. Larger fields of a mussel bed are more stable against small natural dynamics or disturbances due to their biogenic structure. However, greater disturbances caused by e.g. ice winter, storms or anthropogenic interventions can restructure or even destroy larger mussel fields in a short period of time (Nehls and Thiel, 1993; Nehls, 2001; Büttger et al., 2011; Mainwaring et al., 2014; Sampaio et al., 2022). In our case, the fact that scattered mussel patches could disappear within one year may have an impact on our results of the mussel bed coverage. We assume that the temporal difference between the conducted monitoring affect our results only little, as there are no known greater disturbances that could significantly alter the extent of the mussel beds during this time. Nevertheless, we recommend that future studies should include simultaneous ground-based and drone monitoring to eliminate differences in mussel bed coverage due to natural dynamics.
It needs to be noted that small aggregations of mussels can be classified and mapped on the drone imagery. In contrast, during ground-based monitoring only larger aggregation with a coverage >5% are classified as mussel bed and everything else is not taken into account or just classified as scattered mussels (Nehls et al., 2009; van der Meer et al., 2019). For ground-based monitoring it is not possible to map areas of scattered mussels as no boundaries are visible and the coverage cannot be estimated. However, as scattered clumps of mussels cover extensive areas of the tidal flats of the Wadden Sea, especially after storms dispersed denser mussel beds, a significant part of the mussel stock is not included in in the monitoring. Drone surveys may include such areas and lead to a better description of mussel bed dynamics and stock assessment.
Comparing the different classifier, the OA, UA, and PA (up to 95%) give a proof of concept of the application of machine learning algorithms (RF, SVM) for the classification of mussel beds and therefore the extraction of mussel bed coverage. SVM is slightly overperforming RF and can be recommended for further applications. The GNDVI-green threshold method gives a first indication of the mussel coverage but needs an adjustment for each study area. Whereas the OA for HE07 was comparable to RF, the PA of mussels was much lower, indicating an underestimation of the mussel coverage in the classification maps. Furthermore, by using machine learning approaches, not only calculations of the mussel bed coverage are possible, but statements can also be made about the coverage of other classes like shell detritus, macrophytes, water, and tidal flat. The ground-based monitoring allows us just to give estimations of those classes.
In previous studies intertidal structures were monitored applying manual (Konar and Iken, 2018; Windle et al., 2019) and (semi-) automatic (Murfitt et al., 2017; Gomes et al., 2018; Tait et al., 2019, 2021) analysis of drone imagery. Most studies applied RGB cameras (Murfitt et al., 2017; Gomes et al., 2018; Konar and Iken, 2018; Windle et al., 2019), but also multispectral sensors were used (Tait et al., 2019, 2021). The drone platforms were mostly multicopter, except for Windle et al. (2019) who compared the application of multicopter and fixed-wing drones. Multicopter are more flexible in GSD, flight altitude and flight speed and are therefore often preferred for experimental purposes.
For large-scale applications, fixed-wing drones are advantageous as they are more time- and cost-effective and allow a large area coverage (Windle et al., 2019). The coarser GSD compared to a lower flying multicopter must always be evaluated regarding the performance of the particular analysis. For the extraction of mussel coverage, the relative coarse GSD (3.8 cm) applied in this study was sufficient.
The application of a multispectral sensor instead of a RGB camera allowed for a pixel-based classification with classification accuracies of up to 95% OA, PA, and UA. Furthermore, multispectral imagery can approach illumination differences between different acquisition times by applying a calibration before and after each survey to calculate reflectance values (Tait et al., 2019). As the data acquisition of intertidal mussel beds in the Wadden Sea is only possible during low tide, changing light conditions between different acquisition dates and the occurrence of shadow areas cannot be prevented (Gomes et al., 2018). Applying RGB imagery for (semi-) automatic classification is therefore challenging, as reference data can vary significantly. In contrast, multispectral imagery permits a transferability of reference data of different study areas and acquisition dates.
Gomes et al. (2018) measured density, size, and reproductive output of the mussel Mytilus galloprovincialis by drone surveys at 30 m altitude (GSD of 0.8 cm) covering an average area of 1.52 ha. Applying a (semi-) automatic classification with a Maximum Likelihood Classifier (MLC) an OA of 86.5% could be reached. The area coverage in our study are 16 ha (HE07) and 40 ha (HE11) which was possible due to a survey altitude of 80 m. The corresponding GSD of the multispectral sensor was 3.8 cm and therefore about 5-times coarser compared to the GSD used in Gomes et al. (2018). Anyhow, the classification OA reached in our study (up to 95.6%) was around 10% higher. Those differences must be considered with caution as a direct comparison of classification accuracy between both studies is difficult because of the different land cover classes and site-specific parameters. The difference of almost 10% in OA might partly be the result of the different sensors and the applied classification approaches. Future studies should test the use of multispectral imagery in rocky areas. To do this, new reference data will need to be collected to investigate the spectral discrimination of the present rocks from the other land cover classes. If a spectral discrimination is possible, the machine learning approaches need to be re-trained including rocks as an additional class. Compared to the RGB images used by Gomes et al. (2018), the additional spectral bands in the redEdge and NIR are expected to improve the classification results.
The additional spectral bands in the redEdge and NIR of the multispectral sensor give further spectral information for differentiating the different land cover classes (Tait et al., 2019, 2021). The performance of the single classifiers (MLC vs. SVM and RF) should be compared with the same dataset but might have influenced the classification results as well.
This is the first study that compares an alternative or supporting drone-based method in monitoring intertidal structures of the Wadden Sea in comparison with the established ground-based monitoring. Our results show that, depending on mussel bed size and accessibility, drone-based surveys are a good alternative to ground-based surveys and improve the accuracy of the results regarding total area and percentage coverage estimates.
Further studies are recommended to optimize the method and to create models for autonomous analysis to develop a cost- and time-effective monitoring method. Besides, the methodology should also be tested for the detection of oyster beds and for the differentiation between oysters, mussels, shell detritus, and associated algae to enable a comprehensive survey of mussel beds in the Wadden Sea. A first successful application of oyster reef classification using RGB drone imagery was performed by Hoffmann et al. (2023), confirming the potential of a drone-based comprehensive monitoring of intertidal mussel beds (including blue mussels and Pacific oysters).
In addition to recording the coverage and extent, drone imagery provides a variety of spatial parameters that should be investigated more closely in the future. This additional information compared to the traditional method can be used to gain further insight into the spatial dynamics of mussel beds, such as the influence of edges and the elevation of the mussel bed on the coverage. Moreover, spatio-temporal changes within single beds and reefs can be analyzed and visualized to better understand the changes and dynamics (e.g. recolonization after storm events) and to derive possible protection measures.
In future, object-based classification approaches should be tested to potentially further increase the classification accuracy of RF and SVM. Also, the transferability of the method should be further evaluated. The similar classification accuracies on both study sites give a first indication on a possible transferability of the (semi-) automatic classification of mussel beds. However, also the transferability of the reference data should be tested. In this study only reference data of the same mussel bed was used for its training and validation. For an integration in existing monitoring programs, a reference database is required. Therefore, the spectral transition between mussels and shell detritus, the effect of water coverage on the spectral signal over the mussel bed areas, and the impact of macrophytes covering mussels should be further investigated. To ensure that the drone-based method is non-invasive, the effect of the drone on birds should also be further evaluated. This was not possible during this study as no birds were present at the monitoring sites during drone-based monitoring and therefore no effect could be described.
5 Conclusion
This study presents a proof of concept for a time-efficient method of blue mussel bed monitoring in the Wadden Sea by the integration of remote sensing techniques and machine learning approaches. The drone-sensor configuration of a fixed-wing drone with a multispectral sensor seems to be the ideal tool for an integration into a regular monitoring of blue mussel bed areas. It offers a non-invasive method, where large areas can be monitored in a short time, even covering areas that are difficult to access. The multispectral imagery enables a (semi-) automatic classification of large areas for a time-efficient analysis. Whereas the boundaries of the mussel bed areas were still set manually, the mussel bed coverage could be extracted applying machine learning approaches. For both study areas the best classification results were achieved applying SVM. Whereas RF and SVM performed well on both study sites, giving a first indication of the robustness of these methods, the results of the GNDVI-green threshold method varied by over 10% between the study areas.
In future research, the robustness of the method must be further tested with the goal of creating a reference database, which can be used for the classification of blue mussel beds in the Wadden Sea. Therefore, one key is the acquisition of ground-based reference data to better understand small scale spatial and spectral patterns. Furthermore, the application of object-based classification approaches should be tested regarding its effect on the classification accuracy.
Data availability statement
The raw data supporting the conclusions of this article will be made available by the authors, without undue reservation.
Ethics statement
The manuscript presents research on animals that do not require ethical approval for their study.
Author contributions
MS: Writing – review & editing, Writing – original draft, Visualization, Validation, Supervision, Software, Resources, Project administration, Methodology, Investigation, Formal analysis, Data curation, Conceptualization. JM: Writing – review & editing, Writing – original draft, Visualization, Validation, Supervision, Software, Resources, Project administration, Methodology, Investigation, Formal analysis, Data curation, Conceptualization. HS: Writing – review & editing, Methodology, Investigation, Conceptualization. GN: Funding acquisition, Writing – review & editing, Supervision.
Funding
The author(s) declare financial support was received for the research, authorship, and/or publication of this article. The ground-based monitoring was carried out on behalf of the Schleswig-Holstein Agency for Coastal Defense, National Park, and Marine Conservation (LKN.SH). For the drone-based surveys and the comparison of both methods we have not received any specific grant from funding agencies in the public, commercial, or not-for-profit sectors.
Acknowledgments
We sincerely thank the Schleswig-Holstein Agency for Coastal Defense, National Park, and Marine Conservation (LKN.SH), especially Britta Diederichs, for the permission to conduct drone-based surveys in the Schleswig-Holstein Wadden Sea National Park. Thanks to the volunteers for their assistance during the drone-based fieldwork.
Conflict of interest
Authors MS, JM, HS, and GN were employed by the company BioConsult SH GmbH & Co. KG.
Publisher’s note
All claims expressed in this article are solely those of the authors and do not necessarily represent those of their affiliated organizations, or those of the publisher, the editors and the reviewers. Any product that may be evaluated in this article, or claim that may be made by its manufacturer, is not guaranteed or endorsed by the publisher.
References
Adolph W., Farke H., Lehner S., Ehlers M. (2018). Remote sensing intertidal flats with TerraSAR-X. A SAR perspective of the structural elements of a tidal basin for monitoring the Wadden Sea. Remote Sens. 10. doi: 10.3390/rs10071085
Albrecht A. S. (1998). Soft bottom versus hard rock: Community ecology of macroalgae on intertidal mussel beds in the Wadden Sea. J. Exp. Mar. Bio. Ecol. 229, 85–109. doi: 10.1016/S0022-0981(98)00044-6
Allan I. J., Vrana B., Greenwood R., Mills G. A., Knutsson J., Holmberg A., et al. (2006). Strategic monitoring for the european water framework directive. TrAC - Trends Anal. Chem. 25, 704–715. doi: 10.1016/j.trac.2006.05.009
Arabi B., Salama M. S., Pitarch J., Verhoef W. (2020). Integration of in-situ and multi-sensor satellite observations for long-term water quality monitoring in coastal areas. Remote Sens. Environ. 239, 111632. doi: 10.1016/j.rse.2020.111632
Barreto J., Cajaíba L., Teixeira J. B., Nascimento L., Giacomo A., Barcelos N., et al. (2021). Drone-monitoring: Improving the detectability of threatened marine megafauna. Drones 5, 1–14. doi: 10.3390/drones5010014
Buschbaum C., Dittmann S., Hong J. S., Hwang I. S., Strasser M., Thiel M., et al. (2009). Mytilid mussels: Global habitat engineers in coastal sediments. Helgol. Mar. Res. 63, 47–58. doi: 10.1007/s10152-008-0139-2
Butcher P. A., Piddocke T. P., Colefax A. P., Hoade B., Peddemors V. M., Borg L., et al. (2019). Beach safety: Can drones provide a platform for sighting sharks? Wildl. Res. 46, 701–712. doi: 10.1071/WR18119
Büttger H., Christoph S., Buschbaum C., Gittenberger A., Jensen K., Kabuta S., et al. (2022). “Alien species,” in Wadden Sea Quality Status Report. Ed. Kloepper S., et al (Common Wadden Sea Secretariat, Wilhelmshaven, Germany). Available at: https://qsr.waddensea-worldheritage.org/reports/tourism#subsection_1.
Büttger H., Nehls G., Stoddard P. (2014). The history of intertidal blue mussel beds in the North Frisian Wadden Sea in the 20th century: Can we define reference conditions for conservation targets by analysing aerial photographs? J. Sea Res. 87, 91–102. doi: 10.1016/j.seares.2013.12.001
Büttger H., Nehls G., Witte S. (2011). High mortality of Pacific oysters in a cold winter in the North-Frisian Wadden Sea. Helgol. Mar. Res. 65, 525–532. doi: 10.1007/s10152-011-0272-1
Corregidor-Castro A., Holm T. E., Bregnballe T. (2021). Counting breeding gulls with unmanned aerial vehicles: Camera quality and flying height affects precision of a semi-automatic counting method. Ornis Fenn. 98, 33–45. doi: 10.51812/of.133979
Engel F. G., Alegria J., Andriana R., Donadi S., Gusmao J. B., van Leeuwe M. A., et al. (2017). Mussel beds are biological power stations on intertidal flats. Estuar. Coast. Shelf Sci. 191, 21–27. doi: 10.1016/j.ecss.2017.04.003
Folmer E., Büttger H., Herlyn M., Markert A., Millat G., Troost K., et al. (2017). “Beds of blue mussels and Pacific oysters,” in Wadden Sea Quality Status Report. Ed. Kloepper S., et al (Common Wadden Sea Secretariat, Wilhelmshaven, Germany). Available at: https://qsr.waddensea-worldheritage.org/reports/beds-blue-mussels-and-pacific-oysters.
Folmer E. O., Drent J., Troost K., Büttger H., Dankers N., Jansen J., et al. (2014). Large-scale spatial dynamics of intertidal mussel (Mytilus edulis L.) bed coverage in the german and dutch wadden sea. Ecosystems 17, 550–566. doi: 10.1007/s10021-013-9742-4
Gomes I., Peteiro L., Bueno-Pardo J., Albuquerque R., Pérez-Jorge S., Oliveira E. R., et al. (2018). What’s a picture really worth? On the use of drone aerial imagery to estimate intertidal rocky shore mussel demographic parameters. Estuar. Coast. Shelf Sci. 213, 185–198. doi: 10.1016/j.ecss.2018.08.020
Gonçalves G., Andriolo U., Gonçalves L. M. S., Sobral P., Bessa F. (2022). Beach litter survey by drones: Mini-review and discussion of a potential standardization. Environ. pollut. 315, 120370. doi: 10.1016/j.envpol.2022.120370
Gutiérrez J. L., Jones C. G., Strayer D. L., Iribarne O. O. (2003). Mollusks as ecosystem engineers: The role of shell production in aquatic habitats. Oikos 101, 79–90. doi: 10.1034/j.1600-0706.2003.12322.x
Herbert R. J. H., Davies C. J., Bowgen K. M., Hatton J., Stillman R. A. (2018). The importance of nonnative Pacific oyster reefs as supplementary feeding areas for coastal birds on estuary mudflats. Aquat. Conserv. Mar. Freshw. Ecosyst. 28, 1294–1307. doi: 10.1002/aqc.2938
Herlyn M., Millat G. (2000). Decline of the intertidal blue mussel (Mytilus edulis) stock at the coast of Lower Saxony (Wadden Sea) and influence of mussel fishery on the development of young mussel beds. Hydrobiologia 426, 203–210. doi: 10.1023/A:1003922629403
Hoffmann T. K., Pfennings K., Hitzegrad J., Brohmann L., Welzel M., Paul M., et al. (2023). Low-cost UAV monitoring: insights into seasonal volumetric changes of an oyster reef in the German Wadden Sea. Front. Mar. Sci. 10. doi: 10.3389/fmars.2023.1245926
Kabat P., Bazelmans J., van Dijk J., Herman P. M. J., van Oijen T., Pejrup M., et al. (2012). The Wadden Sea Region: Towards a science for sustainable development. Ocean Coast. Manage. 68, 4–17. doi: 10.1016/j.ocecoaman.2012.05.022
Kohlus J., Stelzer K., Müller G., Smollich S. (2020). Mapping seagrass (Zostera) by remote sensing in the Schleswig-Holstein Wadden Sea. Estuar. Coast. Shelf Sci. 238. doi: 10.1016/j.ecss.2020.106699
Konar B., Iken K. (2018). The use of unmanned aerial vehicle imagery in intertidal monitoring. Deep. Res. Part II Top. Stud. Oceanogr. 147, 79–86. doi: 10.1016/j.dsr2.2017.04.010
Landeo-Yauri S. S., Ramos E. A., Castelblanco-Martínez D. N., Niño-Torres C. A., Searle L. (2020). Using small drones to photo-identify Antillean manatees: A novel method for monitoring an endangered marine mammal in the Caribbean Sea. Endanger. Species Res. 41, 79–90. doi: 10.3354/esr01007
Lau J. D., Hicks C. C., Gurney G. G., Cinner J. E. (2019). What matters to whom and why? Understanding the importance of coastal ecosystem services in developing coastal communities. Ecosyst. Serv. 35, 219–230. doi: 10.1016/j.ecoser.2018.12.012
Long R. (2011). The Marine Strategy Framework Directive: A new European approach to the regulation of the marine environment, marine natural resources and marine ecological services. J. Energy Nat. Resour. Law 29, 1–44. doi: 10.1080/02646811.2011.11435256
Mainwaring K., Tillin H., Tyler-Walters H. (2014) Assessing the sensitivity of blue mussels (Mytilus edulis) to pressures associated with human activities.
Meyer D., Dimitriadou E., Hornik K., Weingessel A., Leisch F. (2019) Misc Functions of the Department of Statistics, Probability Theory Group (Formerly: E1071). R package version 1.7-3. Available online at: https://cran.r-project.org/package=e1071.
Mücher S., Troost K., van de Ende D., Kramer H. (2019). Possibilities of high-resolution optical satellite imagery to detect intertidal mussel and oyster beds. (IJmuiden: Centre for Fisheries Research (CVO)). doi: 10.18174/531048
Müller G., Stelzer K., Smollich S., Gade M., Adolph W., Melchionna S., et al. (2016). Remotely sensing the German Wadden Sea—a new approach to address national and international environmental legislation. Environ. Monit. Assess. 188, 1–17. doi: 10.1007/s10661-016-5591-x
Murfitt S. L., Allan B. M., Bellgrove A., Rattray A., Young M. A., Ierodiaconou D. (2017). Applications of unmanned aerial vehicles in intertidal reef monitoring. Sci. Rep. 7, 1–11. doi: 10.1038/s41598-017-10818-9
Nehls G. (2001). “Anatol holte Muscheln – Einfluss eines Orkans auf Muschelbänke im Nationalpark Schleswig-Holsteinisches Wattenmeer,” in Landesamt für den Nationalpark Schleswig-Holsteinisches Wattenmeer (Hrsg.): Wattenmeermonitoring 2000 (Tönning, Germany: Schriftenreihe des Nationalparks).
Nehls G., Thiel M. (1993). Large-scale distribution patterns of the mussel Mytilus edulis in the Wadden Sea of Schleswig-Holstein: Do storms structure the ecosystem? Netherlands J. Sea Res. 31, 181–187. doi: 10.1016/0077-7579(93)90008-G
Nehls G., Witte S., Buttger H., Dankers N., Jansen J., Millat G., et al. (2009). “Beds of blue mussels and Pacific oysters. Quality Status Report 2009,” in Thematic Report No.11 (Wilhelmshaven, Germany: Common Wadden Sea Secretariat (CWSS), Trilateral Monitoring and Assessment Group (TMAG)).
Oldeland J., Revermann R., Luther-Mosebach J., Buttschardt T., Lehmann J. R. K. (2021). New tools for old problems — comparing drone- and field-based assessments of a problematic plant species. Environ. Monit. Assess. 193, 90. doi: 10.1007/s10661-021-08852-2
Oleksyn S., Tosetto L., Raoult V., Joyce K. E., Williamson J. E. (2021). Going batty: The challenges and opportunities of using drones to monitor the behaviour and habitat use of rays. Drones 5, 1–15. doi: 10.3390/drones5010012
Olofsson P., Foody G. M., Herold M., Stehman S. V., Woodcock C. E., Wulder M. A. (2014). Good practices for estimating area and assessing accuracy of land change. Remote Sens. Environ. 148, 42–57. doi: 10.1016/j.rse.2014.02.015
Raoult V., Tosetto L., Williamson J. E. (2018). Drone-based high-resolution tracking of aquatic vertebrates. Drones 2, 1–14. doi: 10.3390/drones2040037
R Core Team (2020). R: A language and environment for statistical computing. (Vienna, Austria: R Foundation for Statistical Computing).
Reise K., Baptist M., Burbridge P., Dankers N., Fischer L., Flemming B., et al. (2010). The wadden sea - A universally outstanding tidal wetland: the wadden sea quality status report synthesis report 2010. Wadden Sea Ecosyst. 29, 7–24.
Sampaio L., Moreira J., Rubal M., Guerrero-Meseguer L., Veiga P. (2022). A review of coastal anthropogenic impacts on mytilid mussel beds: effects on mussels and their associated assemblages. Diversity 14, 409. doi: 10.3390/d14050409
Schofield G., Esteban N., Katselidis K. A., Hays G. C. (2019). Drones for research on sea turtles and other marine vertebrates – A review. Biol. Conserv. 238, 108214. doi: 10.1016/j.biocon.2019.108214
Strahler A. H., Boschetti L., Foody G. M., Friedl M. A., Hansen M. C., Herold M., et al. (2006). Global Land Cover Validation: Recommendations for Evaluation and Accuracy Assessment of Global Land Cover Maps (Luxemburg: Office for Official Publications of the European Communities), 1–60.
Svane N., Lange T., Egemose S., Dalby O., Thomasberger A., Flindt M. R. (2022). Unoccupied aerial vehicle-assisted monitoring of benthic vegetation in the coastal zone enhances the quality of ecological data. Prog. Phys. Geogr. 46, 232–249. doi: 10.1177/03091333211052005
Tait L., Bind J., Charan-Dixon H., Hawes I., Pirker J., Schiel D. (2019). Unmanned aerial vehicles (UAVs) for monitoring macroalgal biodiversity: Comparison of RGB and multispectral imaging sensors for biodiversity assessments. Remote Sens. 11, 2332. doi: 10.3390/rs11192332
Tait L. W., Orchard S., Schiel D. R. (2021). Missing the forest and the trees: Utility, limits and caveats for drone imaging of coastal marine ecosystems. Remote Sens. 13, 1–15. doi: 10.3390/rs13163136
van der Meer J., Dankers N., Ens B. J., van Stralen M., Troost K., Waser A. M. (2019). The birth, growth and death of intertidal soft-sediment bivalve beds: no need for large-scale restoration programs in the dutch wadden sea. Ecosystems 22, 1024–1034. doi: 10.1007/s10021-018-0320-7
van der Zee E. M., van der Heide T., Donadi S., Eklöf J. S., Eriksson B. K., Olff H., et al. (2012). Spatially extended habitat modification by intertidal reef-building bivalves has implications for consumer-resource interactions. Ecosystems 15, 664–673. doi: 10.1007/s10021-012-9538-y
Ventura D., Grosso L., Pensa D., Casoli E., Mancini G., Valente T., et al. (2023). Coastal benthic habitat mapping and monitoring by integrating aerial and water surface low-cost drones. Front. Mar. Sci. 9. doi: 10.3389/fmars.2022.1096594
Walker P., Nicholson M. D. (1986). The precision of estimates of mussel biomass by zig-zag survey. ICES C. 1986/K6.
Waser A. M., Deuzeman S., Kangeri A. K., van Winden E., Postma J., de Boer P., et al. (2016). Impact on bird fauna of a non-native oyster expanding into blue mussel beds in the Dutch Wadden Sea. Biol. Conserv. 202, 39–49. doi: 10.1016/j.biocon.2016.08.007
Waske B., Benediktsson J. A. (2007). Fusion of support vector machines for classification of multisensor data. IEEE Trans. Geosci. Remote Sens. 45, 3858–3866. doi: 10.1109/TGRS.2007.898446
Waske B., Braun M. (2009). Classifier ensembles for land cover mapping using multitemporal SAR imagery. ISPRS J. Photogramm. Remote Sens. 64, 450–457. doi: 10.1016/j.isprsjprs.2009.01.003
Wickham H. (2016). ggplot2: elegant graphics for Data Analysis (New York: Springer-Verlag). doi: 10.1007/978-0-387-98141-3
Windle A. E., Poulin S. K., Johnston D. W., Ridge J. T. (2019). Rapid and accurate monitoring of intertidal Oyster Reef Habitat using unoccupied aircraft systems and structure from motion. Remote Sens. 11, 2394. doi: 10.3390/rs11202394
Wolf M., Atmojo D. W., Tholen C., Zielinski O. (2023). Improved deep learning based litter detection in aquatic environments in Indonesia using drones. Ocean. 2023 - Limerick, 1–7. doi: 10.1109/OCEANSLimerick52467.2023.10244712
Wolff W. J., Bakker J. P., Laursen K., Reise K. (2010). The Wadden Sea Quality Status Report-Synthesis Report 2010 (Wilhelmshaven, Germany: Common Wadden Sea Secretariat (CWSS)). Available at: http://epic.awi.de/23745/1/Wol2010h.pdf.
Wu D., Li R., Zhang F., Liu J. (2019). A review on drone-based harmful algae blooms monitoring. Environ. Monit. Assess. 191, 1–11. doi: 10.1007/s10661-019-7365-8
Keywords: blue mussel (Mytilus edulis), remote sensing, unmanned aerial vehicles (UAV), coastal monitoring, support vector machine, machine learning, Wadden Sea
Citation: Schnurawa M, Mueller JS, Schade H and Nehls G (2024) Drone-based monitoring of intertidal blue mussel beds in the Wadden Sea – comparison of a threshold and two machine learning approaches. Front. Mar. Sci. 11:1381036. doi: 10.3389/fmars.2024.1381036
Received: 06 February 2024; Accepted: 16 April 2024;
Published: 30 April 2024.
Edited by:
Oliver Zielinski, Leibniz Institute for Baltic Sea Research (LG), GermanyReviewed by:
Tom William Bell, Woods Hole Oceanographic Institution, United StatesMargarita Fernández Tejedor, Institute of Agrifood Research and Technology (IRTA), Spain
Copyright © 2024 Schnurawa, Mueller, Schade and Nehls. This is an open-access article distributed under the terms of the Creative Commons Attribution License (CC BY). The use, distribution or reproduction in other forums is permitted, provided the original author(s) and the copyright owner(s) are credited and that the original publication in this journal is cited, in accordance with accepted academic practice. No use, distribution or reproduction is permitted which does not comply with these terms.
*Correspondence: Marc Schnurawa, m.schnurawa@bioconsult-sh.de
†These authors have contributed equally to this work and share first authorship