Deciphering decadal observation of Fukushima-derived radiocesium in the most polluted port near the Fukushima Daiichi Nuclear Power Plant: from seawater to marine fish
 Wuhui Lin
 Yibang Zhang
 Jinqiu Du3
  Jiliang Xuan
- 1Polar and Marine Research Institute, College of Harbour and Coastal Engineering, Jimei University, Xiamen, China
- 2State Key Laboratory of Satellite Ocean Environment Dynamics, Second Institute of Oceanography, Ministry of Natural Resources (MNR), Hangzhou, China
- 3National Marine Environmental Monitoring Center, Dalian, China
- 4National Institute for Radiological Protection, Chinese Center for Disease Control and Prevention, Beijing, China
The biological concentration effect of radionuclides in marine fish has exacerbated public anxiety about seafood security in the context of Fukushima nuclear-contaminated water discharged into the ocean. However, the most polluted port near the Fukushima Daiichi Nuclear Power Plant (FDNPP) has seldom been investigated, especially for radioactivity in marine fish. In this study, decadal observations of radiocesium in marine fish and seawater from the most polluted port were simultaneously established after the Fukushima Nuclear Accident. We found a generally decreasing trend of historical 137Cs activity in seawater, with seasonal variations modulated by precipitation. Seasonal variations were elucidated with finer detail and divided into exponential decline in the dry season and steady variation in the wet season. A novel method was proposed to estimate the continuing source term of 137Cs derived from the FDNPP, which was 3.9 PBq in 2011 and 19.3 TBq between 2012 and 2022 on the basis of historical 137Cs. The biological concentration effect of marine fish is quantitatively emphasized according to the higher ratio of over-standards for radiocesium in marine fish relative to that in seawater. Long-term observation and analysis of radiocesium in marine fish and seawater from the most polluted port would provide insights into the scientific evaluation of the effectiveness of the decommissioning of the FDNPP in the past and share lessons on the fate of Fukushima-derived radionuclides in the future.
1 Introduction
Large amounts of artificial radionuclides have been released into the atmosphere (e.g., ~160 PBq of 131I, 15 PBq of 137Cs, and 14,000 PBq of 133Xe) and the marine environment (e.g., 11 PBq of 131I and 4 PBq of 137Cs) since the Fukushima Nuclear Accident (FNA) on 11 March 2011 (Lin et al., 2016; Povinec et al., 2021). It has been estimated that 74% of Fukushima-derived artificial radionuclides released into the atmosphere were deposited in the North Pacific Ocean (Povinec et al., 2021), probably contributing to the FNA being the most serious nuclear accident that directly pollutes the marine environment with radioactive material (Lin et al., 2016). Artificial radionuclides are continuously discharged from the most polluted port (Figure 1) near the Fukushima Daiichi Nuclear Power Plant (FDNPP) (Machida et al., 2023). Subsequently, Fukushima-derived radionuclides have been widely elevated from the coastal sea to the open ocean (Povinec et al., 2021).
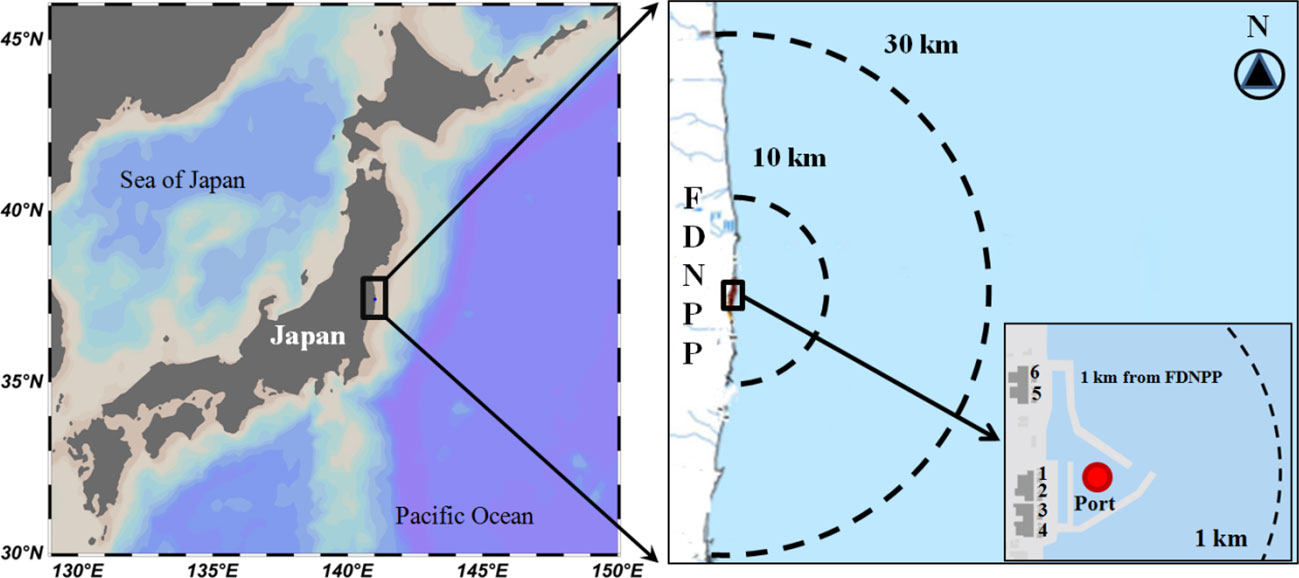
Figure 1 Map of the most polluted port near the FDNPP.
The most polluted port near the FDNPP serves as windows to reflect the progress and effectiveness of decommissioning of the FDNPP, which is inaccessible to the public and to many other counties around the world. Recently, extremely high 134 + 137Cs activity of 1.8×10⁴ Bq/kg in marine fish from the most polluted port was reported to be 180 times higher than the Japanese regulatory limit (100 Bq/kg-wet) on 18 May 2023 (Tokyo-Electric-Power-Company, 2023a). Despite the continuous discharge of artificial radionuclides and frequent reports of abnormally high levels of radiocesium in marine fish, the most polluted port with the highest radioactivity near the FDNPP has seldom been investigated (Kanda, 2013; Machida et al., 2020, 2023), especially with regard to radioactivity in marine fish.
The biological concentration effect of radionuclides in marine fish has exacerbated public anxiety in the context of nuclear-contaminated water with 64 radionuclides discharged into the ocean (Buesseler, 2020; Lin et al., 2021; Liu et al., 2022). In this study, we primarily focus on the long-term observation of radiocesium in marine fish because seafood consumption is the dominant pathway of ionizing radiation to humans and is a primary concern of the public and countries around the Pacific Ocean after the FNA. Additionally, historical levels of radiocesium in seawater are simultaneously discussed to reveal its effect on marine fish. We also attempted to determine the mechanisms of seasonal fluctuation of 137Cs in seawater in order to identify potential leak events, estimate the continuing source terms of 137Cs discharged from the port, and verify the effectiveness of multiple countermeasures in the most polluted port near the FDNPP.
2 Materials and methods
2.1 134Cs and 137Cs in seawater from the port
The most polluted port (Figure 1) near the FDNPP is inaccessible to the public and many other countries around the world. The availability and transparency of historical radioactivity in the most polluted port near the FDNPP played a key role in verifying the progress after the decommissioning of the FDNPP. We downloaded 1,196 daily reports of radiocesium in seawater provided by the Tokyo Electric Power Company (TEPCO) from 2 April 2011 to 30 June 2014 and 114 monthly reports of radiocesium in seawater released by the Ministry of Economy, Trade and Industry (METI) from July 2013 to April 2023 (Tokyo-Electric-Power-Company, 2011; Ministry-of-Economy-Trade-and-Industry, 2023b, 2018). The TEPCO’s daily reports from 2 April 2011 to 30 June 2014 included 3–14 monitoring stations in the port, while the METI’s monthly reports from July 2013 to April 2023 encompassed 9–14 monitoring stations in the port. In order to conservatively evaluate the radioactive level in seawater from the port, we chose and compiled the highest values of 134Cs and 137Cs activities among 3–14 stations in the port from the above-mentioned daily/monthly reports. If the data in the daily/monthly reports were lower than the minimum detection activity (MDA), the MDA was utilized for discussion. The highest value of 134Cs and 137Cs activity in a typical report is selected and shown in Figure 2.

Figure 2 The red ellipse indicates the highest value of 134Cs (MDA, 370 Bq/m3) and 137Cs (3,000 Bq/m3) activities in seawater from the port in April 2023 (Ministry-of-Economy-Trade-and-Industry, 2023a).
2.2 134Cs and 137Cs in marine fish from the port
Radiocesium levels in marine fish were compiled from 130 monthly reports provided by TEPCO from December 2012 to May 2023 (Tokyo-Electric-Power-Company, 2018, 2023b). There were seven fishing areas in the port (Figure 3) (Tokyo-Electric-Power-Company, 2013). The typical species of marine fish from the port included Conger myriaster, Hexagrammos otakii, Microstomus achne, Paralichthys olivaceus, Pleuronectes yokohama, and Sebastes cheni (Tokyo Electric Power Company, 2023b). Detailed information on the size, diet, and habitat of marine fish was not provided in the monthly reports, probably because of the large number of fish and the temporal variations of fish species in the port. We conservatively selected and compiled the highest value of 134Cs and 137Cs activities in the muscle of marine fish caught from seven fishing areas in the port to conservatively evaluate the radiological impact. The value of MDA was utilized in the condition of the activity of radiocesium below the MDA. Only the maximum activity in marine fish was selected in order to discuss the relationship between radiocesium in seawater and marine fish; it was consistent with the highest value in seawater.
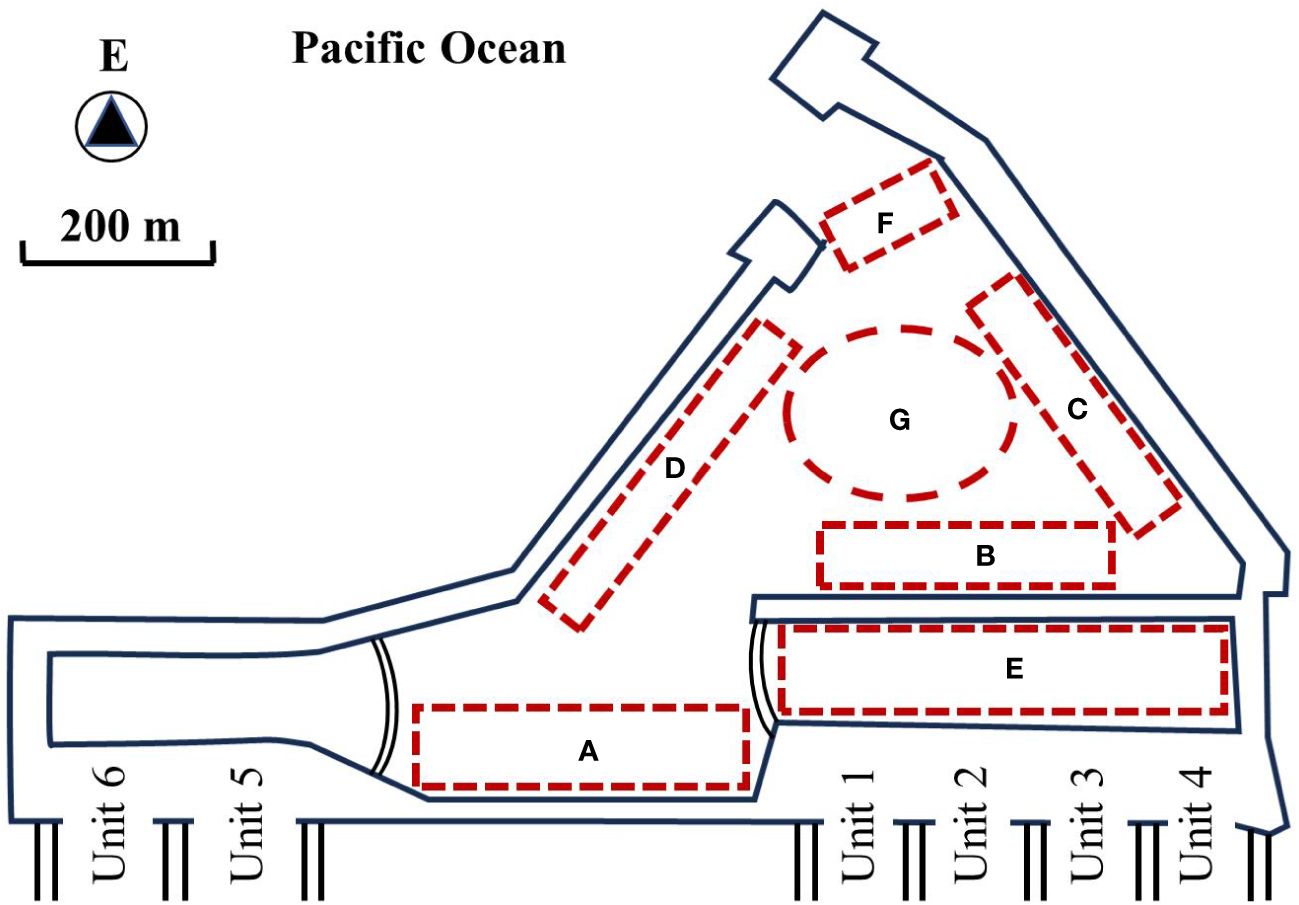
Figure 3 Fishing areas from “A” to “G” in the port.
2.3 Data on precipitation in Fukushima Prefecture
In order to investigate the mechanism of seasonal variation of 137Cs in the port, we downloaded 145 monthly precipitation reports in Naniue and Tomioka near the FDNPP released by the Japan Meteorological Agency (JMA) from May 2011 to May 2023 (Japan-Meteorological-Agency, 2023). We calculated and compiled the mean value of monthly precipitation in Naniue and Tomioka because the FDNPP is located between them (Figure 4). The average monthly precipitation (119.8 mm) from May 2011 to May 2023 was calculated to define the wet season and the dry season in Fukushima Prefecture.

Figure 4 Map of Naniue and Tomioka. The star in the red rectangle represents the location of the FDNPP (Japan-Meteorological-Agency, 2023).
3 Results and discussion
3.1 Historical observation of 137Cs activity in seawater from the port
Historical 137Cs activity in seawater (Figure 5) from the most polluted port was systematically compiled from April 2011 to April 2023 based on 1,310 documents that were officially released by TEPCO and METI. Although the historical 137Cs activity in seawater generally decreased due to the continuing decommissioning work at the FDNPP, the most recent monthly 137Cs activity in seawater (3×10³ Bq/m3 in April 2023) was still over 1,000 times higher than the background value (1–2 Bq/m3) of 137Cs before the FNA (Povinec et al., 2021). In this study, the historical 137Cs activity in seawater was divided into three periods: April 2011 to June 2011 (purple area in region I), July 2011 to January 2016 (brown area in region II), and February 2016 to April 2023 (green area in region III).
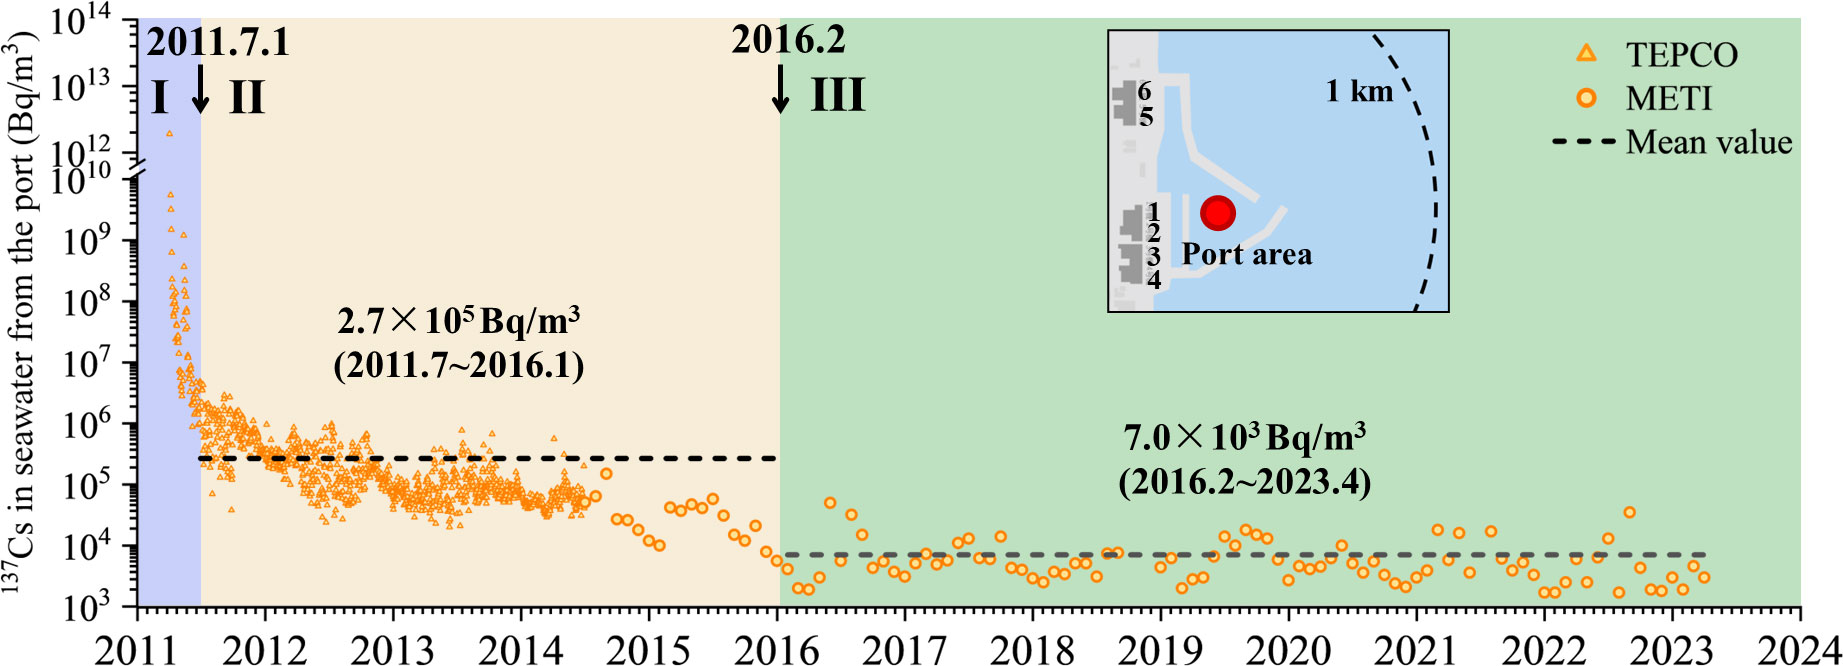
Figure 5 Historical 137Cs activity in seawater from the most polluted port near the FDNPP from April 2011 to April 2023.
Region I from April 2011 to June 2011 was recognized as the initial stage of FNA and was characterized by the direct discharge of contaminated water into the coastal sea. Two peaks of 137Cs—1.9×10¹² Bq/m3 on 2 April 2021 and 1.2×10⁹ Bq/m3 on 12 May 2021—were clearly recorded, corresponding to two leak events officially confirmed by TEPCO in 1–6 April and 10–11 May (Kanda, 2013). A sudden decline in 137Cs activity was subsequently observed after TEPCO’s operation to stop the leak in front of Unit 2 on 4 April 2016 (Kanda, 2013). The most significant phenomenon in region I was the appearance of an extremely high 137Cs value, followed by a rapid exponential decline.
“Region II from July 2011 to January 2016 was defined because of the completed construction of the seaside impermeable walls in February 2016 after carefully comparing the progress after the decommissioning in the monthly reports from METI in January and February 2016. The 137Cs activity gradually decreased in region II due to the continuing decommissioning work, such as the relocation of the drainage channels from June 2014 to April 2015, the seabed covering of the port in April 2015, the removal of highly contaminated retained water in December 2015, the filling of tunnels and towers in December 2015, and the completed construction of seaside impermeable walls in February 2016 (Machida et al., 2020, 2023). Seasonal fluctuation of 137Cs activity was also observed, in addition to a decreasing trend at a slower rate in region II relative to a rapidly decreasing rate in region I. It was obvious that the average 137Cs activity (7.0×10³ Bq/m3) in region III from February 2016 to April 2023 was approximately 40 times lower than that (2.7×10⁵Bq/m3) in region II after the completed construction of seaside impermeable walls. However, a seasonal variation of 137Cs without a significant decreasing trend is shown in region III.
3.2 Estimation of continuing source terms of 137Cs based on the wet–dry season model
Although the key feature of the seasonal variation of 137Cs has been observed after the initial stage of FNA, the factors influencing the seasonal variation of 137Cs have not been discussed in detail (Machida et al., 2020). To determine the seasonal variations of 137Cs activity in seawater from July 2011 to April 2023 in detail, 137Cs activity and monthly precipitation were simultaneously displayed to reveal the contrasting patterns of the exponential decrease of 137Cs in the dry season (light blue in Figure 6) and the steady variation of 137Cs in the wet season (yellow in Figure 6).
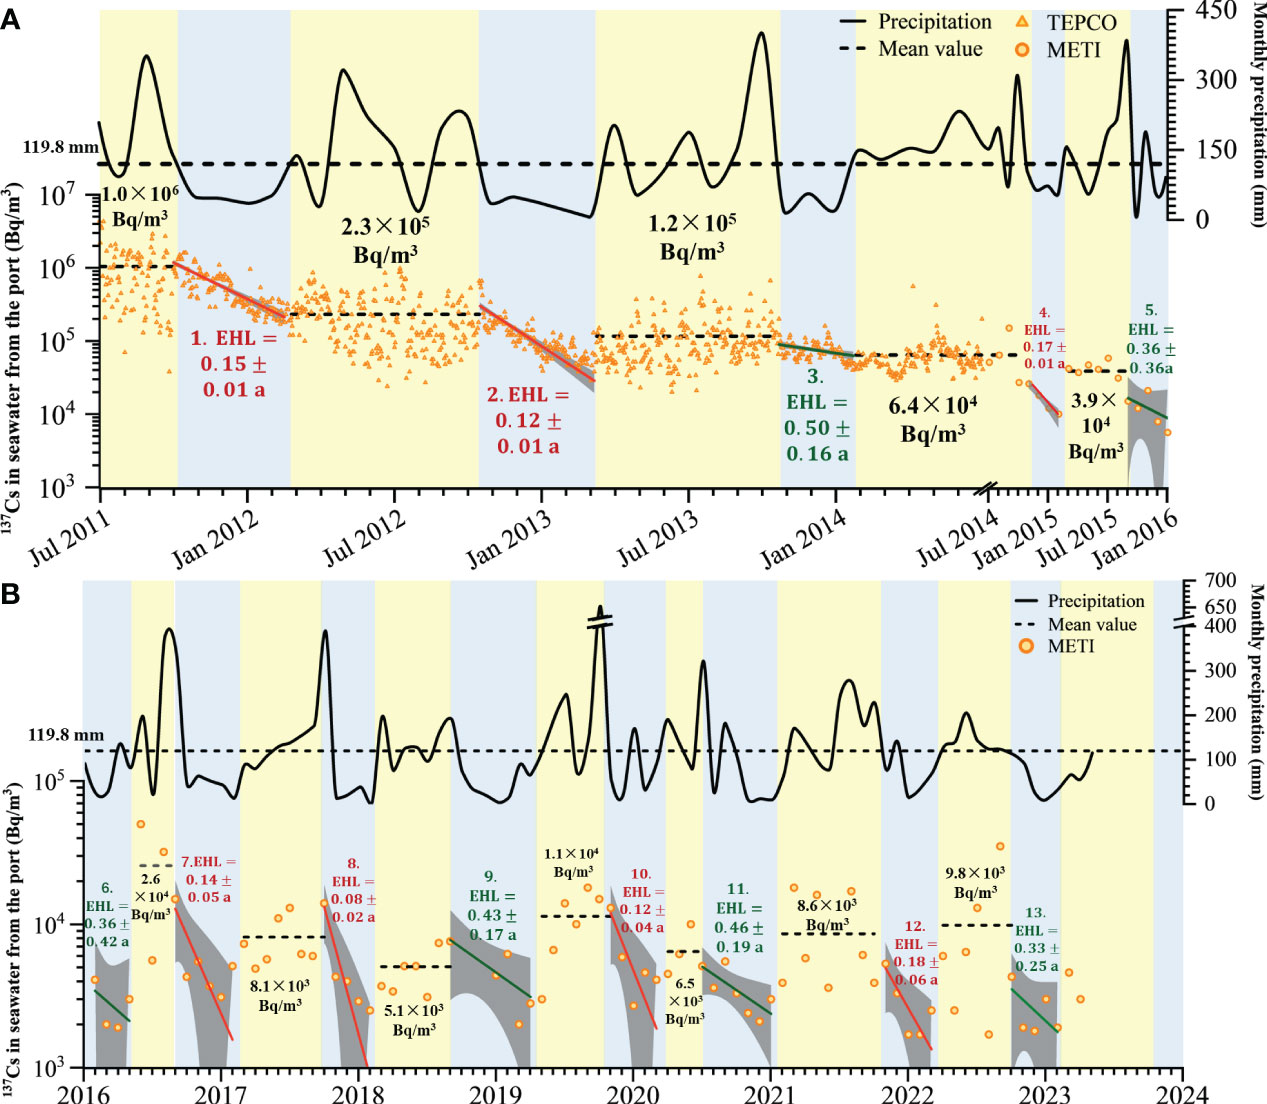
Figure 6 Seasonal variations of 137Cs in seawater from the port and monthly precipitation in Fukushima Prefecture from July 2011 to January 2016 (A) and February 2016 to April 2023 (B). The average monthly precipitation is presented with a dotted line to distinguish the wet season (yellow) from the dry season (light blue). Effective half-lives (EHLs) and average 137Cs activity are quantitatively displayed for the dry season and wet season, respectively.
It was reasonable to expect the exponential decline in 137Cs activity from the port, analogous to previous studies on the exponential decrease of 137Cs activity in river water, seawater, sediment, and marine biotas because of the decommissioning work and stabilization at the FDNPP (Povinec et al., 2021). The exponential decline in 137Cs activity in the dry season is well-fitted and quantitatively depicted with effective half-lives (EHLs) in different time intervals in Figure 6 and Table 1. Two groups of EHLs have been quantified: 0.14 ± 0.03 a (seven time intervals fitted with red lines) and 0.41 ± 0.26 a (six time intervals fitted with green lines). The EHLs of 137Cs in region II and region III were much longer than those in region I (1.58 d) at the initial stage of the FNA (Kanda, 2013), implying multiple continuing source terms of 137Cs to lengthen EHLs and slow down the decreasing trend in the port after the initial stage of the FNA. The apparent decreasing rate (k2) in the dry season is calculated in Table 1. Combined with the exchange rate (k1 = 0.44 d−1) and seawater volume (2.78×10⁵ m3) in the port from Kanda (2013), the source terms of 137Cs in the dry season could be quantified according to Equations 3, 4.
where A137Cs refers to the 137Cs activity in seawater. V and Sdry are the mean volume of seawater and the source terms of 137Cs in the port during the dry season, respectively. k1 and k2 are the exchange rate of the port with outer seawater and the apparent decreasing rate of 137Cs in the port, respectively (see values in Table 1).
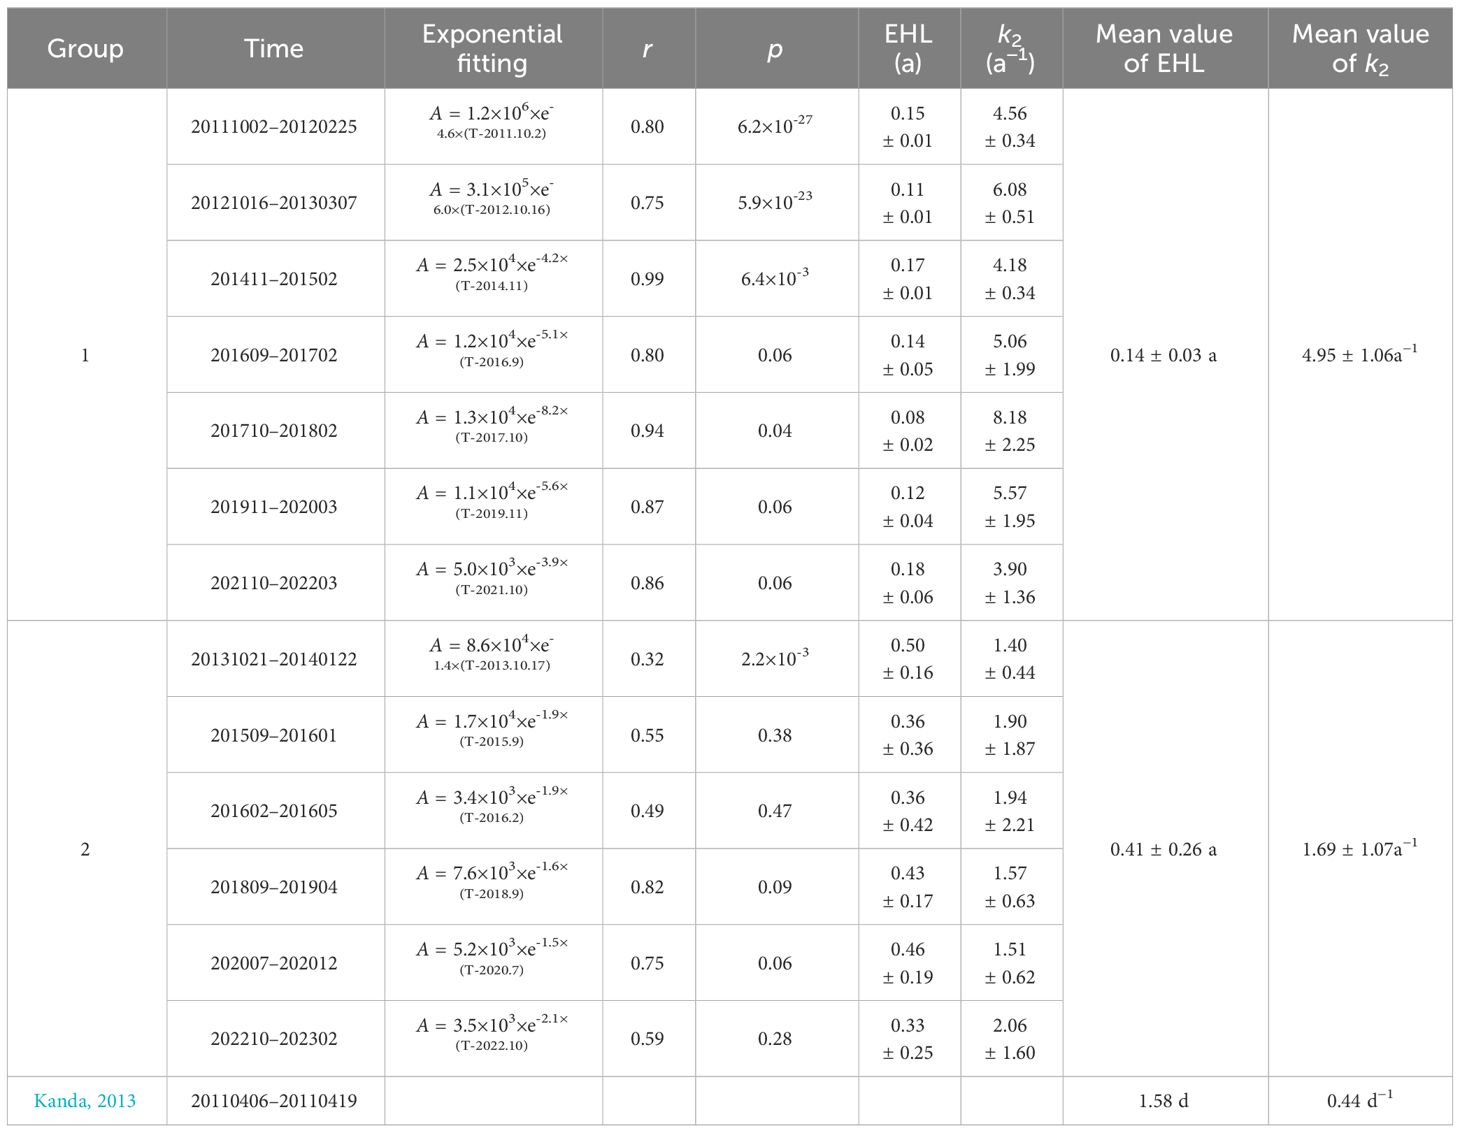
Table 1 Exponential fitting, EHLs, and apparent decreasing rate (k2) of time intervals in dry seasons.
By contrast, the steady variation of 137Cs without the decreasing trend in the wet season is illustrated in Figure 6. We found that the average 137Cs activities in wet seasons from July 2011 to January 2016 also gradually decreased from 1.0×10⁶ Bq/m3 to 3.9×10⁴ Bq/m3 in Figure 6A. The average 137Cs activities in wet seasons from February 2016 to April 2023 varied from 5.1×10³ Bq/m3 to 2.6×10⁴ Bq/m3 without a decreasing trend in Figure 6B. Previous studies have pointed out that the 137Cs activity in the river and coastal sea has been significantly elevated during the flood season, especially with the additional influences of typhoons and storms (Tanaka et al., 2022; Uchiyama et al., 2022). The positive relationship between 137Cs activity and monthly precipitation (r = 0.44, p< 0.0001) from February 2016 to April 2023 is also shown in Figure 7. Precipitation probably contributed to the additional input of 137Cs into the port via leaching and erosion of 137Cs from a terrestrial environment in the wet season, resulting in the steady variation of 137Cs activity in the wet season in contrast to a decreasing trend of 137Cs in the dry season. The source terms of 137Cs in the wet season could be quantified according to Equation 3, Equation 4.
where Swet refers to the source terms of 137Cs in the wet season. Other parameters are the same as in Equations 1, 2.
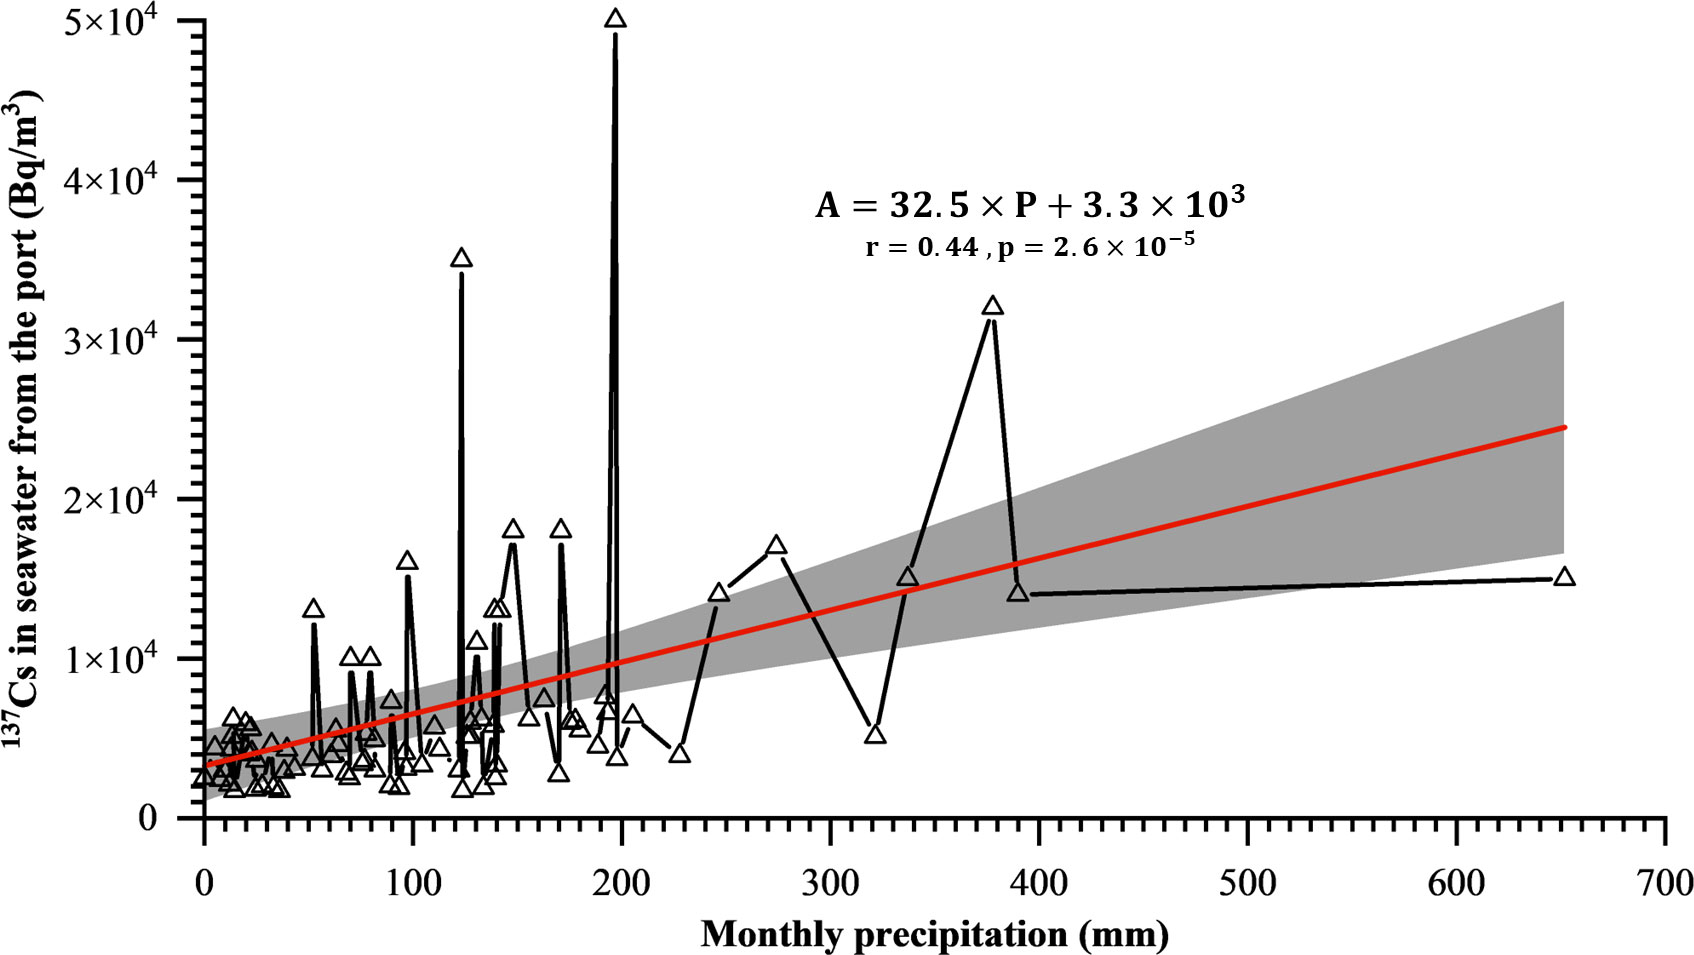
Figure 7 Positive relationship between 137Cs activity from the port and monthly precipitation from February 2016 to April 2023.
Therefore, historical 137Cs activity and its associated mechanisms are suggested to be delicately classified into the wet season and the dry season for quantitative discussion. Our study also implied that the source terms of radionuclides derived from the FDNPP to the Pacific Ocean should be different between the wet season (Equation 2) and the dry season (Equation 4) rather than a simple assumption of steady state in previous studies (Kanda, 2013; Machida et al., 2020, 2023). The annual flux of 137Cs discharged from the port to outer seawater was 3.9 PBq in 2011 and 19.3 TBq from 2012 to 2022, which is generally consistent with previous studies, as shown in Table 2 and Figure 8 (Machida et al., 2020).
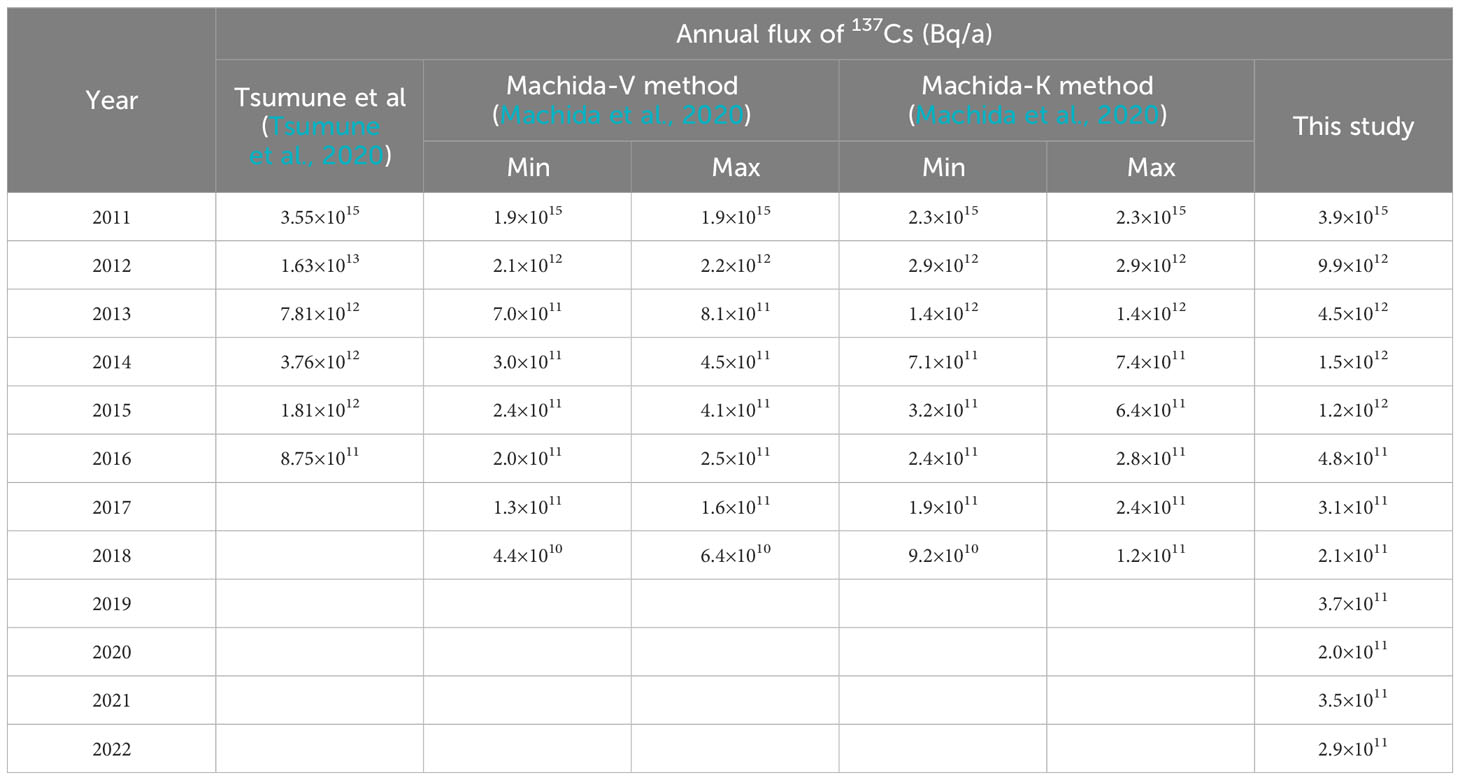
Table 2 Comparison of the annual flux of the 137Cs discharged from the port.
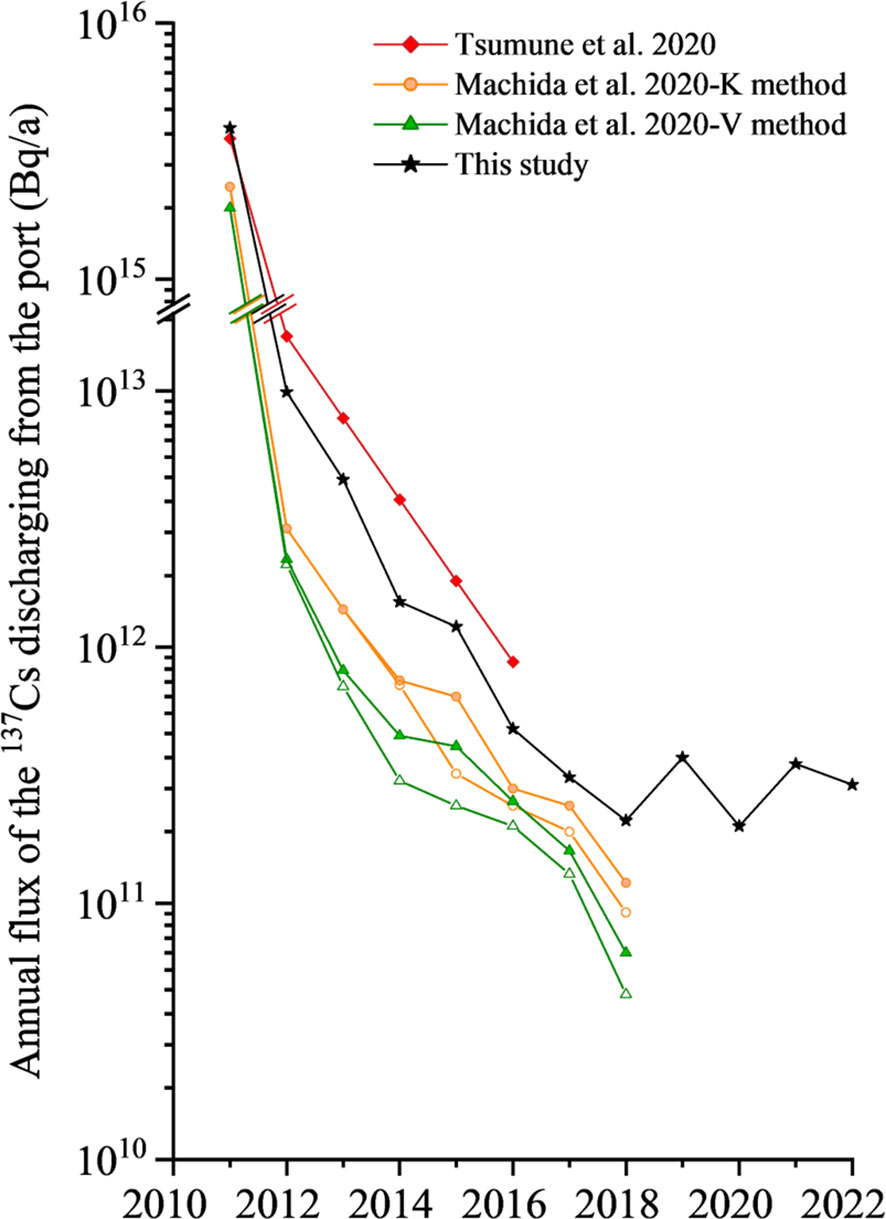
Figure 8 Comparison of the annual flux of the 137Cs discharged from the port from 2011 to 2022.
3.3 Delayed increase of 134 + 137Cs in marine fish following the 134 + 137Cs peak in seawater from the port
The long-term monthly 134 + 137Cs activity in marine fish and the corresponding value in seawater from the most polluted port are simultaneously shown in Figure 9 from December 2012 to May 2023. A clear decline in 134 + 137Cs activity in marine fish was observed before February 2016, consistent with the decreasing trend of 134 + 137Cs activity in seawater (Figures 9, 10A). In contrast, periodic increases in 134 + 137Cs activity without a decreasing trend in marine fish and seawater were observed after February 2016 (Figure 10B). The Japanese regulatory limit for marine fish (100 Bq/kg-wet) and the WHO guidance levels for drinking water (10,000 Bq/m3) for 134 + 137Cs were adopted to evaluate the radioactive level. We found that the ratio of over-standard for 134 + 137Cs in marine fish (>100 Bq/kg-wet) was 100% from December 2012 to January 2016 and 59% from February 2016 to May 2023. Meanwhile, the ratio of over-standard for 134 + 137Cs in seawater (>10,000 Bq/m3) was 89.5% from July 2014 to January 2016 and 20.5% from February 2016 to April 2023. Obviously, the ratio of over-standard for 134 + 137Cs in marine fish was higher than that in seawater, probably attributed to the biological concentration effect of marine fish.
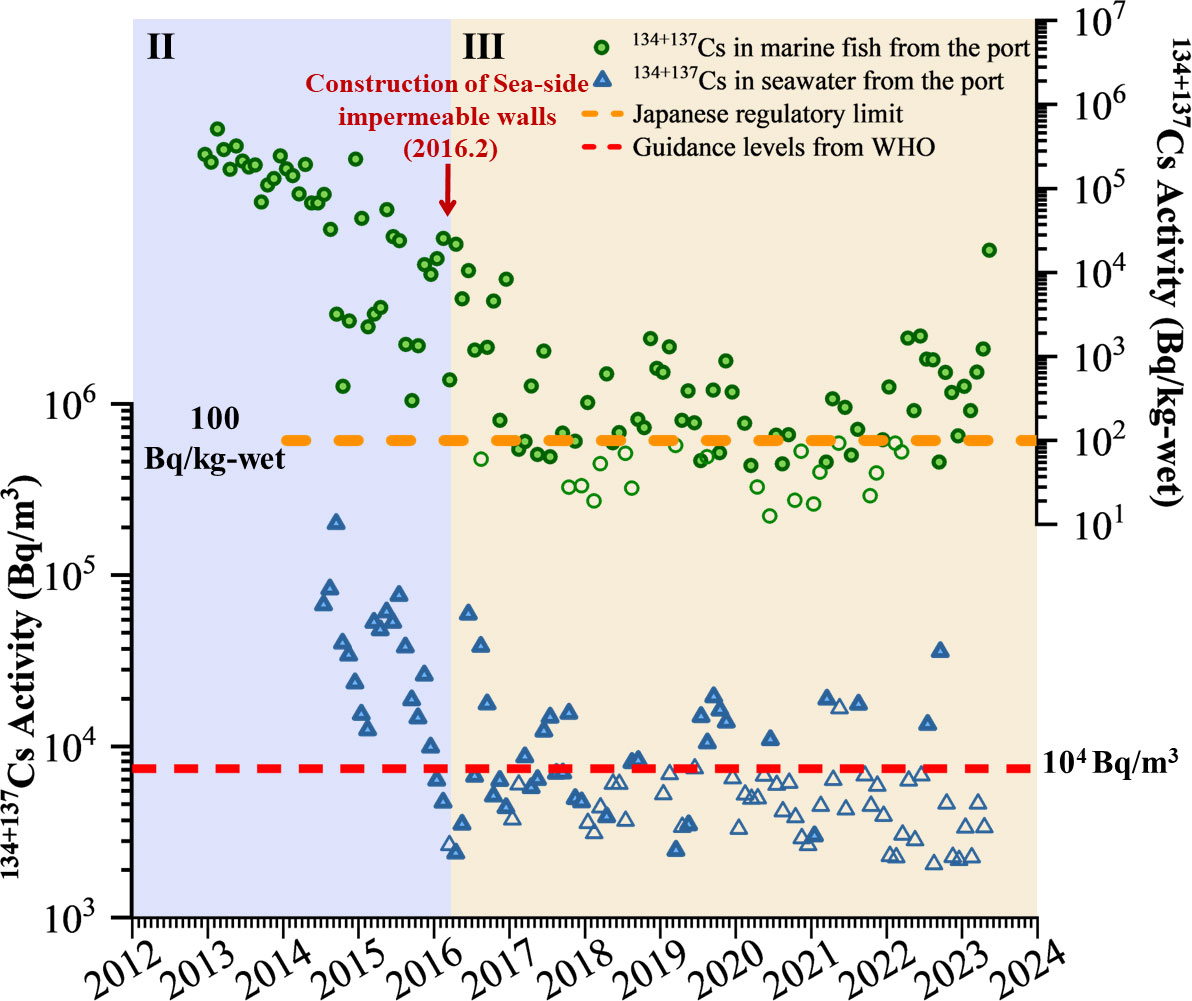
Figure 9 Simultaneous analysis of 134 + 137Cs in marine fish (green circle) from December 2012 to May 2023 and seawater (blue triangle) from July 2014 to April 2023. The solid symbols mean the sum of detectable 134Cs and measurable 137Cs, while the open symbols refer to the sum of measurable137Cs and the MDA of 134Cs. The brown and red dotted lines refer to the Japanese regulatory limit for marine fish (100 Bq/kg-wet) and the WHO guidance levels for drinking water (104 Bq/m3) for 134 + 137Cs.
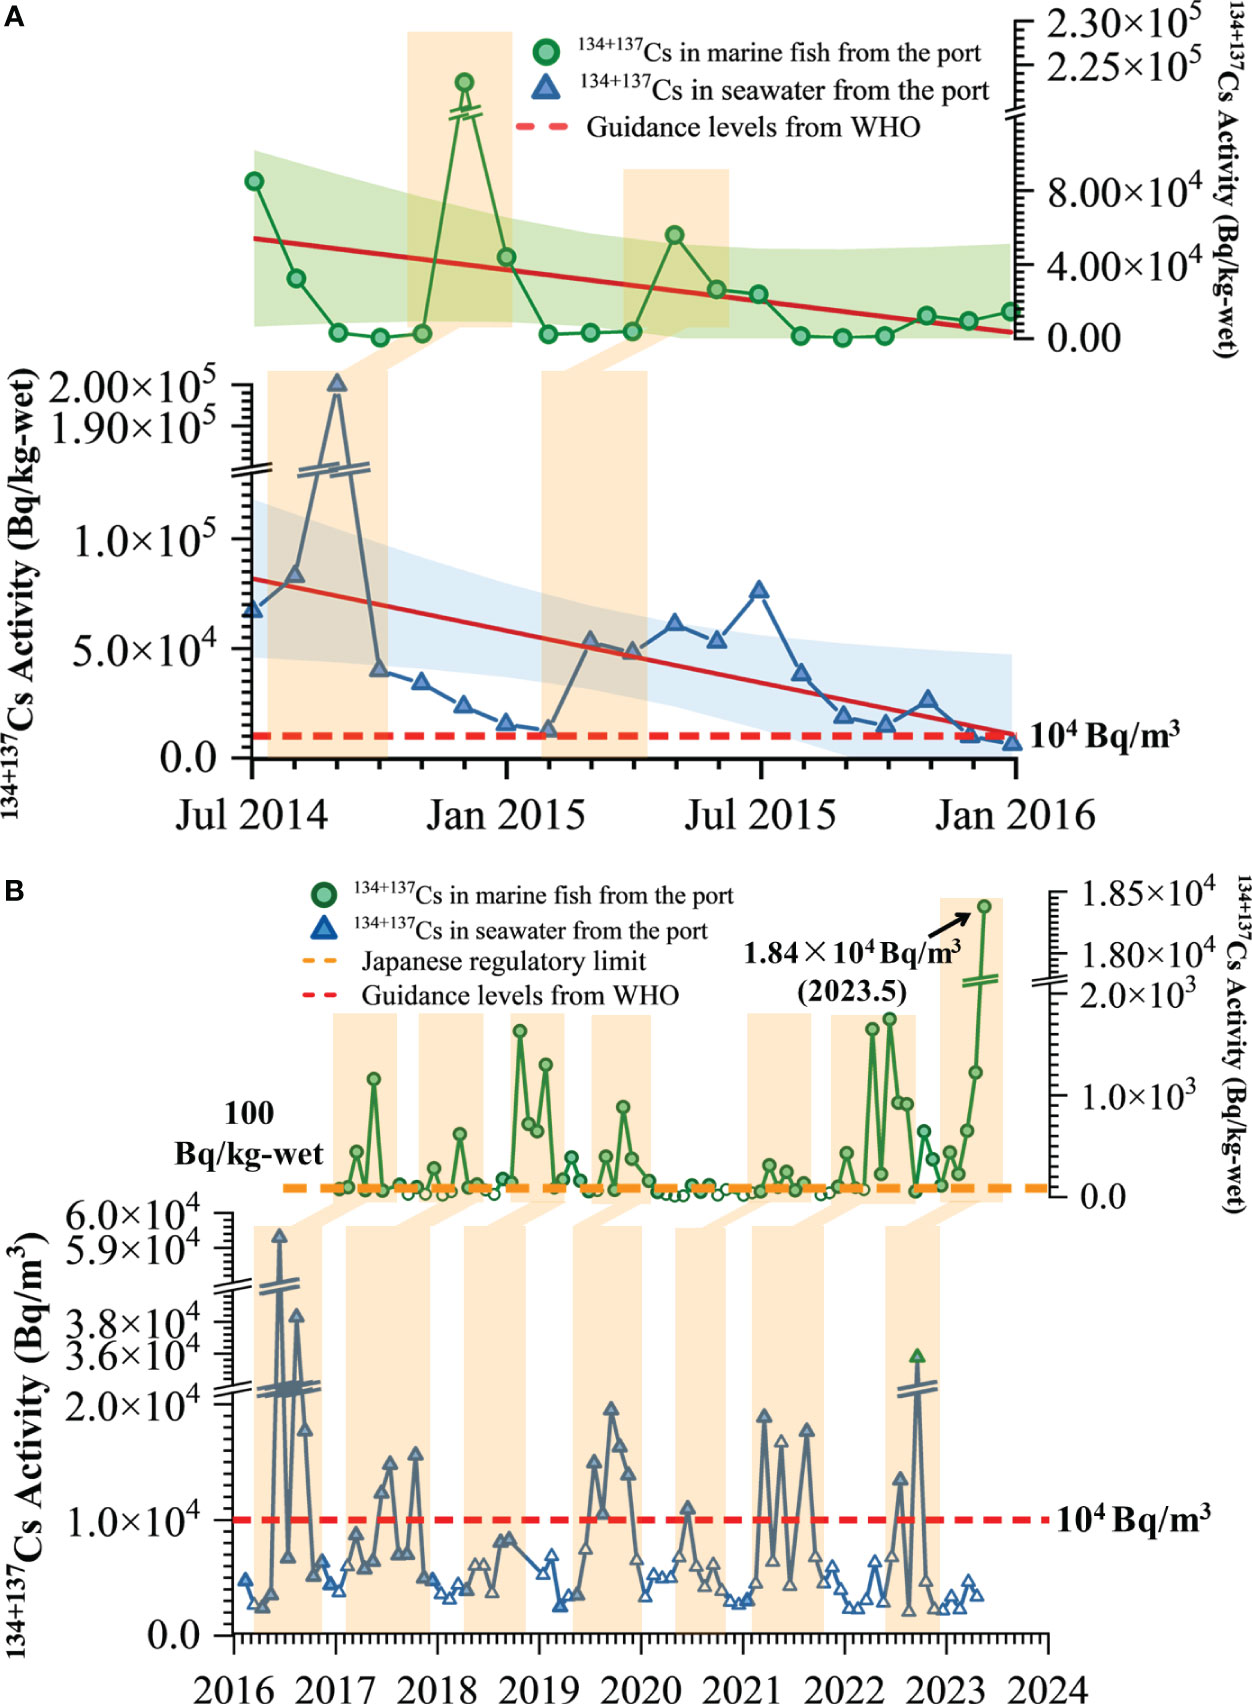
Figure 10 Delayed increase of 134 + 137Cs in marine fish following the 134 + 137Cs peak in seawater from July 2014 to January 2016 (A) and February 2016 to May 2023 (B). The orange rectangles indicate the corresponding 134 + 137Cs peak in marine fish and seawater.
Additionally, the delayed increase in 134 + 137Cs activity in marine fish following the 134 + 137Cs peak in seawater is also depicted by the orange shadow in Figures 10A, B. The positive relationship of peak 134 + 137Cs activity between marine fish and seawater is well-fitted in Figure 11 (r = 0.99, p< 0.0001) on the basis of the corresponding peaks of 134 + 137Cs activity in marine fish and seawater. The concentration factors of 134 + 137Cs in marine fish ranged from 29 L/kg to 514 L/kg, with an average value of 136 L/kg from February 2016 to May 2023. The average value of 136 L/kg in marine fish was consistent with the recommended value of 100 L/kg provided by the IAEA (2004), confirming the corresponding relationship of 134 + 137Cs peaks between marine fish and seawater.
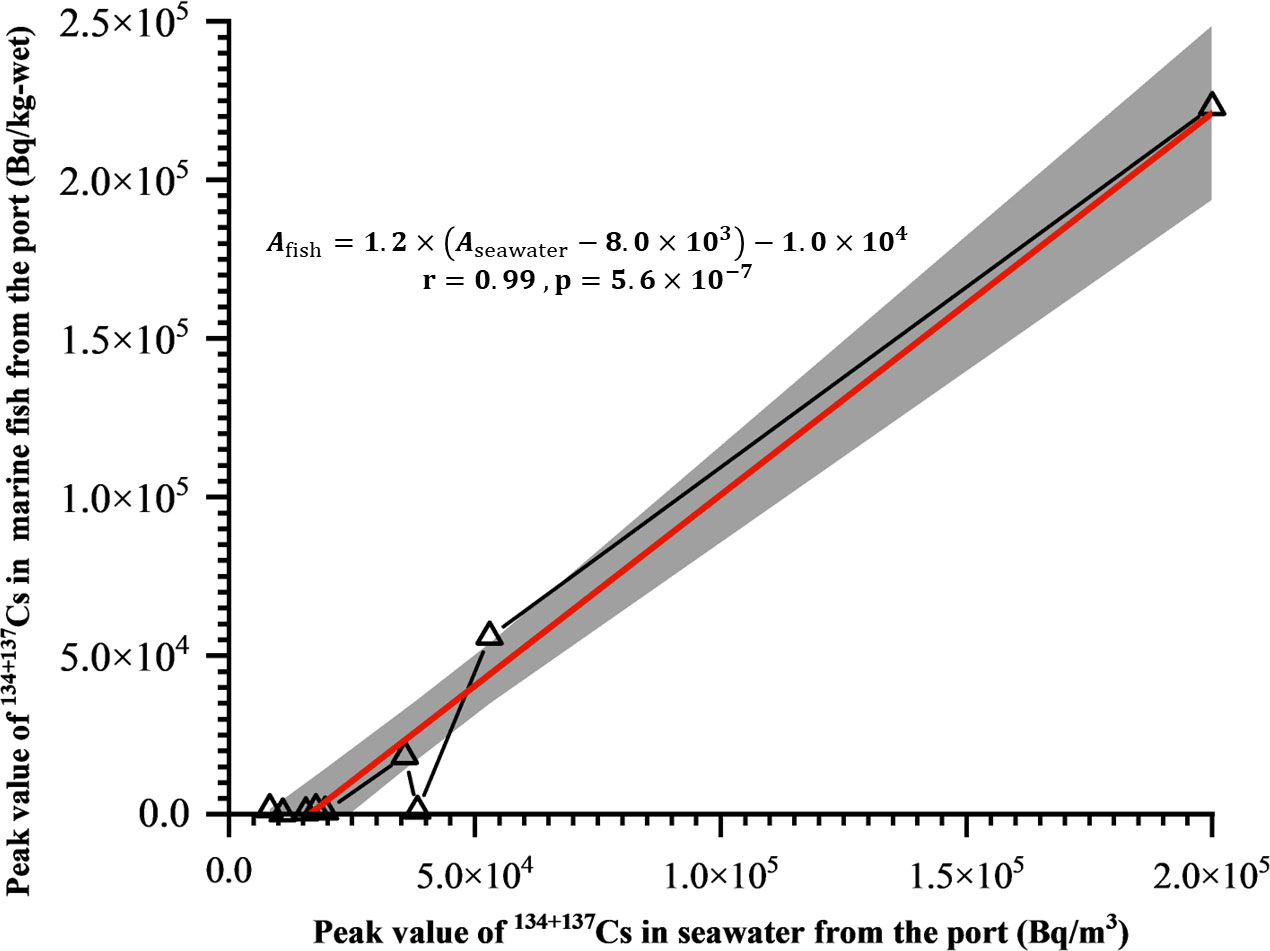
Figure 11 Positive relationship between the corresponding peak of 134 + 137Cs activity in marine fish and seawater.
It was noted that radiocesium in sediment also contributed to the elevated activity of radiocesium in marine fish (Wang et al., 2018; Song et al., 2020). Unfortunately, radiocesium in the sediment from the most polluted port was not available from TEPCO and METI, limiting our discussion of the pathway of sediment ingestion by marine fish. However, the continuing source of radiocesium derived from the FDNPP should increase radiocesium levels in seawater followed by those in sediment and marine fish. The corresponding peaks of radiocesium between seawater and marine fish should be logically correlated. Even so, radiocesium in the sediment from the most polluted port should be measured for a better understanding of frequent reports of extremely high radiocesium levels in marine fish from the port in the future.
4 Conclusion
Overall, we revealed the distinct seasonal patterns of an exponential decline in the dry season and steady variation in the wet season in detail based on the historical 137Cs activity in seawater and proposed a novel method to quantify the continuing source terms of 137Cs derived from the FDNPP (3.9 PBq in 2011 and 19.3 TBq from 2012 to 2022). Moreover, the biological concentration effect of marine fish was quantitatively emphasized on the basis of the higher ratio of excess 134 + 137Cs in marine fish compared to seawater. Long-term observation and analysis of radiocesium in marine fish and seawater from the most polluted port would benefit the scientific evaluation of the decommissioning of the FDNPP, and share lessons on the fate of Fukushima-derived radionuclides in the marine environment for the prediction and assessment of nuclear-contaminated water discharged into the ocean.
Data availability statement
The original contributions presented in the study are included in the article/supplementary material. Further inquiries can be directed to the corresponding author.
Author contributions
WL: Conceptualization, Data curation, Formal analysis, Funding acquisition, Investigation, Methodology, Project administration, Resources, Software, Supervision, Validation, Visualization, Writing – original draft. YZ: Methodology, Software, Visualization, Writing – original draft. JD: Data curation, Formal analysis, Resources, Visualization, Writing – original draft. JX: Funding acquisition, Methodology, Resources, Software, Writing – original draft. FT: Methodology, Resources, Visualization, Writing – original draft.
Funding
The author(s) declare that financial support was received for the research, authorship, and/or publication of this article. This work was supported by the National Natural Science Foundation of China (42276044); the Natural Science Foundation of Guangxi Province (2021GXNSFAA220053), and the open fund of the State Key Laboratory of Satellite Ocean Environment Dynamics, Second Institute of Oceanography, MNR (QNHX2320).
Acknowledgments
The authors would like to thank TEPCO, METI, and the Japan Meteorological Agency for sharing data on the websites.
Conflict of interest
The authors declare that the research was conducted in the absence of any commercial or financial relationship that could be construed as a potential conflict of interest.
Publisher’s note
All claims expressed in this article are solely those of the authors and do not necessarily represent those of their affiliated organizations, or those of the publisher, the editors and the reviewers. Any product that may be evaluated in this article, or claim that may be made by its manufacturer, is not guaranteed or endorsed by the publisher.
References
Buesseler K. O. (2020). Opening the floodgates at Fukushima. Science 369, 621–622. doi: 10.1126/science.abc1507
IAEA (2004). Sediment Distribution Coefficients and Concentration Factors for Biota in the Marine Environment (Vienna: IAEA).
Japan-Meteorological-Agency (2023) Past Weather Data. Available online at: https://www.data.jma.go.jp/gmd/risk/obsdl/index.php.
Kanda J. (2013). Continuing 137Cs release to the sea from the Fukushima Dai-ichi Nuclear Power Plant through 2012. Biogeosciences 10, 6107–6113. doi: 10.5194/bg-10-6107-2013
Lin W., Chen L., Yu W., Ma H., Zeng Z., Zeng S. (2016). Radioactive source terms for the Fukushima Nuclear Accident. Sci. China: Earth Sci. 59, 214–222. doi: 10.1007/s11430-015-5112-8
Lin W., Yu K., Du J., Lin H., Yu W., Mo M. (2021). Consequences of marine ecological environment and our preparedness for Fukushima radioactive wastewater discharge into the ocean. Chin. Sci. Bulletin 66, 4500–4509. doi: 10.1360/TB-2021-0743
Liu Y., Guo X.-Q., Li S.-W., Zhang J.-M., Hu Z.-Z. (2022). Discharge of treated Fukushima nuclear accident contaminated water: macroscopic and microscopic simulations. Natl. Sci. Rev. 9, nwab209. doi: 10.1093/nsr/nwab209
Machida M., Iwata A., Yamada S., Otosaka S., Kobayashi T., Funasaka H., et al. (2023). Estimation of temporal variation of tritium inventory discharged from the port of Fukushima Dai-ichi Nuclear Power Plant:analysis of the temporal variation and comparison with released tritium inventories from Japan and world major nuclear facilities. J. Nucl. Sci. Technol. 60, 258–276. doi: 10.1080/00223131.2022.2093800
Machida M., Yamada S., Iwata A., Otosaka S., Kobayashi T., Watababe M., et al. (2020). Seven-year temporal variation of Caesium-137 discharge inventory from the port of Fukushima Daiichi Nuclear Power Plant: continuous monthly estimation of Caesium-137 discharge in the period from April 2011 to June 2018. J. Nucl. Sci. Technol. 57, 939–950. doi: 10.1080/00223131.2020.1740809
Ministry-of-Economy-Trade-and-Industry (2023a) Monthly progress (January 26, 2023). Available online at: https://www.meti.go.jp/english/earthquake/nuclear/decommissioning/pdf/mp202301.pdf.
Ministry-of-Economy-Trade-and-Industry (2023b) Progress Status Reports. Available online at: https://www.meti.go.jp/english/earthquake/nuclear/decommissioning/progress_status.html.
Povinec P. P., Hirose K., Aoyama M., Tateda Y. (2021). Fukushima Accident: 10 Years After (Amsterdam: Elsevier).
Song J. H., Kim T., Yeon J.-W. (2020). Radioactivity data analysis of 137Cs in marine sediments near severely damaged Chernobyl and Fukushima nuclear power plants. Nucl. Eng. Technol. 52, 366–372. doi: 10.1016/j.net.2019.07.017
Tanaka K., Nagao S., Kitade Y., Niki M., Katsumata T., Miyama T., et al. (2022). Spread of Fukushima-derived radiocesium over the coastal ocean in response to typhoon-induced flooding in September 2011. Limnol. Oceanogr. 67, 1184–1193. doi: 10.1002/lno.12065
Tokyo-Electric-Power-Company (2011) Impact on the environment of Fukushima Daiichi nuclear power plant. Available online at: https://www.tepco.co.jp/nu/fukushima-np/f1/index2-j.html.
Tokyo-Electric-Power-Company (2013) Nuclide analysis of fish and shellfish (including data in port). Available online at: https://www.tepco.co.jp/nu/fukushima-np/f1/smp/2013/images/fish_130327-j.pdf.
Tokyo-Electric-Power-Company (2018) Analysis of radioactive substances around Fukushima Daiichi nuclear power plant. Available online at: https://www.tepco.co.jp/nu/fukushima-np/f1/smp/indexold-j.html.
Tokyo-Electric-Power-Company (2023a) Analytical results of fish and shellfish. Available online at: https://www.tepco.co.jp/decommission/data/analysis/pdf_csv/2023/2q/fish01_230605-j.pdf.
Tokyo-Electric-Power-Company (2023b) List of past analysis results archives. Available online at: https://www.tepco.co.jp/decommission/data/analysis/archive/index-j.html.
Tsumune D., Tsubono T., Misumi K., Tateda Y., Toyoda Y., Onda Y., et al. (2020). Impacts of direct release and river discharge on oceanic 137Cs derived from the Fukushima Dai-ichi Nuclear Power Plant accident. J. Environ. Radioactivity, 214–214. doi: 10.1016/j.jenvrad.2020.106173
Uchiyama Y., Tokunaga N., Aduma K., Kamidaira Y., Tsumune D., Iwasaki T., et al. (2022). A storm-induced flood and associated nearshore dispersal of the river-derived suspended 137Cs. Sci. Total Environ. 816, 151573. doi: 10.1016/j.scitotenv.2021.151573
Keywords: marine fish, 137Cs, Fukushima, contaminated water, nuclear pollution
Citation: Lin W, Zhang Y, Du J, Xuan J and Tuo F (2024) Deciphering decadal observation of Fukushima-derived radiocesium in the most polluted port near the Fukushima Daiichi Nuclear Power Plant: from seawater to marine fish. Front. Mar. Sci. 11:1382229. doi: 10.3389/fmars.2024.1382229
Received: 05 February 2024; Accepted: 02 April 2024;
Published: 03 May 2024.
Edited by:
Ruijie Zhang, Guangxi University, ChinaReviewed by:
Neven Cukrov, Ruđer Bošković Institute, CroatiaWu Men, Nanjing University of Information Science and Technology, China
Copyright © 2024 Lin, Zhang, Du, Xuan and Tuo. This is an open-access article distributed under the terms of the Creative Commons Attribution License (CC BY). The use, distribution or reproduction in other forums is permitted, provided the original author(s) and the copyright owner(s) are credited and that the original publication in this journal is cited, in accordance with accepted academic practice. No use, distribution or reproduction is permitted which does not comply with these terms.
*Correspondence: Wuhui Lin, linwuhui8@163.com