Reef design influences habitat provision on a restored oyster reef
 Jennifer Beseres Pollack
 Monisha Sugla
 Natasha J. Breaux
 Stacy N. Trackenberg
  Terence A. Palmer
- Harte Research Institute for Gulf of Mexico Studies, Texas A&M University-Corpus Christi, Corpus Christi, TX, United States
Habitat restoration efforts are often limited by cost, making it important that available funds are used efficiently and effectively to achieve desired restoration goals. In this study, we evaluate habitat provision for oysters and motile epifauna on restored oyster reefs in a northwestern Gulf of Mexico estuary constructed with discrete high vertical relief (~0.6 m “reef mounds”) or continuous low vertical relief (<0.08 m “reef flats”). Habitat provision on reef mounds exceeded that on reef flats within one month of construction and supported 0.75x higher oyster density, 2x higher motile epifauna biomass, and 3.6x higher motile epifauna density one year after construction. Oyster density on reef mounds remained relatively high throughout the study period, with ~2x higher oyster densities than reef flats 18 months after construction and ~1.5x higher oyster densities by the end of the study. Both reef mounds and reef flats increased oyster and epifaunal densities compared to unrestored areas. Although on-reef oyster densities were higher on reef mounds than reef flats, the total restored oyster areal density and volumetric density was higher in restored reef flat areas, primarily because the restored flats area had no gaps within its restoration boundaries. Our findings have practical value for better predicting restoration outcomes and achieving desired restoration goals based on restored oyster reef height, with reef mounds maximizing on-reef oyster and epifaunal densities and reef flats maximizing the total number of oysters per area restored or volume of substrate purchased. Understanding the benefits and tradeoffs between restoration designs will allow resource managers to improve cost-efficiencies in future restoration projects.
1 Introduction
Native oyster populations globally have experienced substantial declines over the past century, primarily due to unsustainable harvests and reef loss (Kirby, 2004; Jackson, 2008). In the United States, severe losses in oyster extent and biomass have also been documented (zu Ermgassen et al., 2012). Oyster reef degradation has been linked to loss of hard substratum, or cultch, from overharvesting via dredge (Rothschild et al., 1994). Suitable substratum is required for larval oyster settlement, and its’ loss can cause reef loss by decreasing a reef’s areal extent (including by fragmentation), vertical relief, and structural complexity. Reef loss negatively affects a reef’s ability to provide several ecosystem services, including sustaining fisheries, protecting shorelines, and improving water quality (Cuddington et al., 2011). Maintenance of vertical relief is important for supporting fauna on oyster reefs by enhancing recruitment, growth, and survival (Schulte et al., 2009; Colden et al., 2017; De Santiago et al., 2019). When the reef substratum degrades and reef height is lost, oyster reefs can experience higher sedimentation rates (Lenihan, 1999; Jordan-Cooley et al., 2011), greater exposure to bottom water hypoxia (Lenihan and Peterson, 1998), reduced exposure to higher food quality, and greater susceptibility to infection by the protozoan Perkinsus marinus (Lenihan, 1999; Powers et al., 2009), which accelerates the reef’s decline. Fragmentation of continuous reef habitat decreases the sizes of reef patches and increases the distance among reef patches, which can have negative effects on abundances of associated species if patch sizes decrease beyond a critical threshold (Harwell et al., 2011). However, the effects of fine-scale reef spacing on oyster populations requires further study (Breitburg et al., 2000).
Oyster reefs present the unique management challenge of existing both as a fishery resource and as habitat, with natural resource managers challenged to mediate these competing interests (Kasperski and Wieland, 2009). Within the management toolbox, habitat restoration has emerged as a best practice to combat reef loss and recover lost ecological and economic benefits, often by adding cultch to ameliorate the effects of overharvest (Peterson and Lipcius, 2003; Grabowski and Peterson, 2007). However, restoration is costly, and return on investments can vary widely among projects, locations, designs, and substratum (Graham et al., 2017; Bersoza Hernández et al., 2018; Blomberg et al., 2018b; Howie and Bishop, 2021). Numerous studies have quantified ecosystem services provided by oyster reefs—including habitat provision, faunal enhancement, and nitrogen regulation—to demonstrate potential benefits of habitat restoration activities (Newell, 1988; Peterson et al., 2003; Grabowski and Peterson, 2007; Beseres Pollack et al., 2013; zu Ermgassen et al., 2016; Lai et al., 2020). However, more information is needed to better understand how restored reef design may influence ecosystem service provision.
Restoration needs often exceed available resources, making it critical that limited funds be used efficiently and effectively to accelerate recovery of degraded habitats. One challenge is how to select among various oyster reef restoration designs that may have different ecological and economic benefits (Hogan and Reidenbach 2022). For example, given a limited amount of restoration substrate, restoration designs could be prioritized by their ability to meet criteria such as maximizing reef area available to be settled by oysters, or increasing reef height to potentially avoid deleterious conditions (e.g., hypoxia) and be exposed to favorable conditions (e.g., increased food quality) associated with deeper water (Breitburg et al., 2000). Whereas low-relief reef designs can be beneficial in increasing the restoration footprint and meeting large-scale ecosystem restoration goals (e.g., La Peyre et al., 2022; Hemraj et al., 2022), decreasing the areal footprint in exchange for increasing reef height can enhance ecological benefits and habitat resilience (Lenihan, 1999; Tolley and Volety, 2005; Powers et al., 2009; Gregalis et al., 2009; Schulte et al., 2009; Powell et al., 2012; Colden et al., 2017; Peters et al., 2017). In this study, we evaluate habitat provision for oysters and motile reef-resident fauna on high- and low-relief restored oyster reefs for 36 months after reef construction. We hypothesize that 1) oyster and epifaunal densities will be enhanced on both reef types relative to an unrestored control, 2) oyster and epifaunal densities will be greater and P. marinus infection will be lesser on the high vertical relief than low vertical relief reefs because of the avoidance of potentially harmful environmental conditions, and 3) the densities on the high-relief reefs will be great enough to compensate for the smaller areal extent of reef restored relative to the low-relief reefs built with a similar volume of substrate.
2 Methods
2.1 Study area
Aransas Bay is a shallow (~2 m), microtidal, primary bay of the 463 km2 Mission-Aransas Estuary, Texas, located in the northwestern U.S. Gulf of Mexico (Figure 1; Armstrong, 1987). Water circulation in the Mission-Aransas Estuary is predominantly wind-driven, with mean salinity ~19 (Beseres Pollack et al., 2011) and residence time of 360 days (Solis and Powell, 1999). Oyster reefs are common in subtidal areas of low to moderate salinity throughout the estuary—the southernmost in Texas to support a commercial oyster fishery—and conditions in a large portion of the estuary exhibit potential for successful oyster reef restoration (Beseres Pollack et al., 2012). At least five oyster reefs in the Mission-Aransas Estuary have been successfully restored (Blomberg et al., 2017; Graham et al., 2017; Rezek et al., 2017; Blomberg et al., 2018a; Martinez et al., 2022).
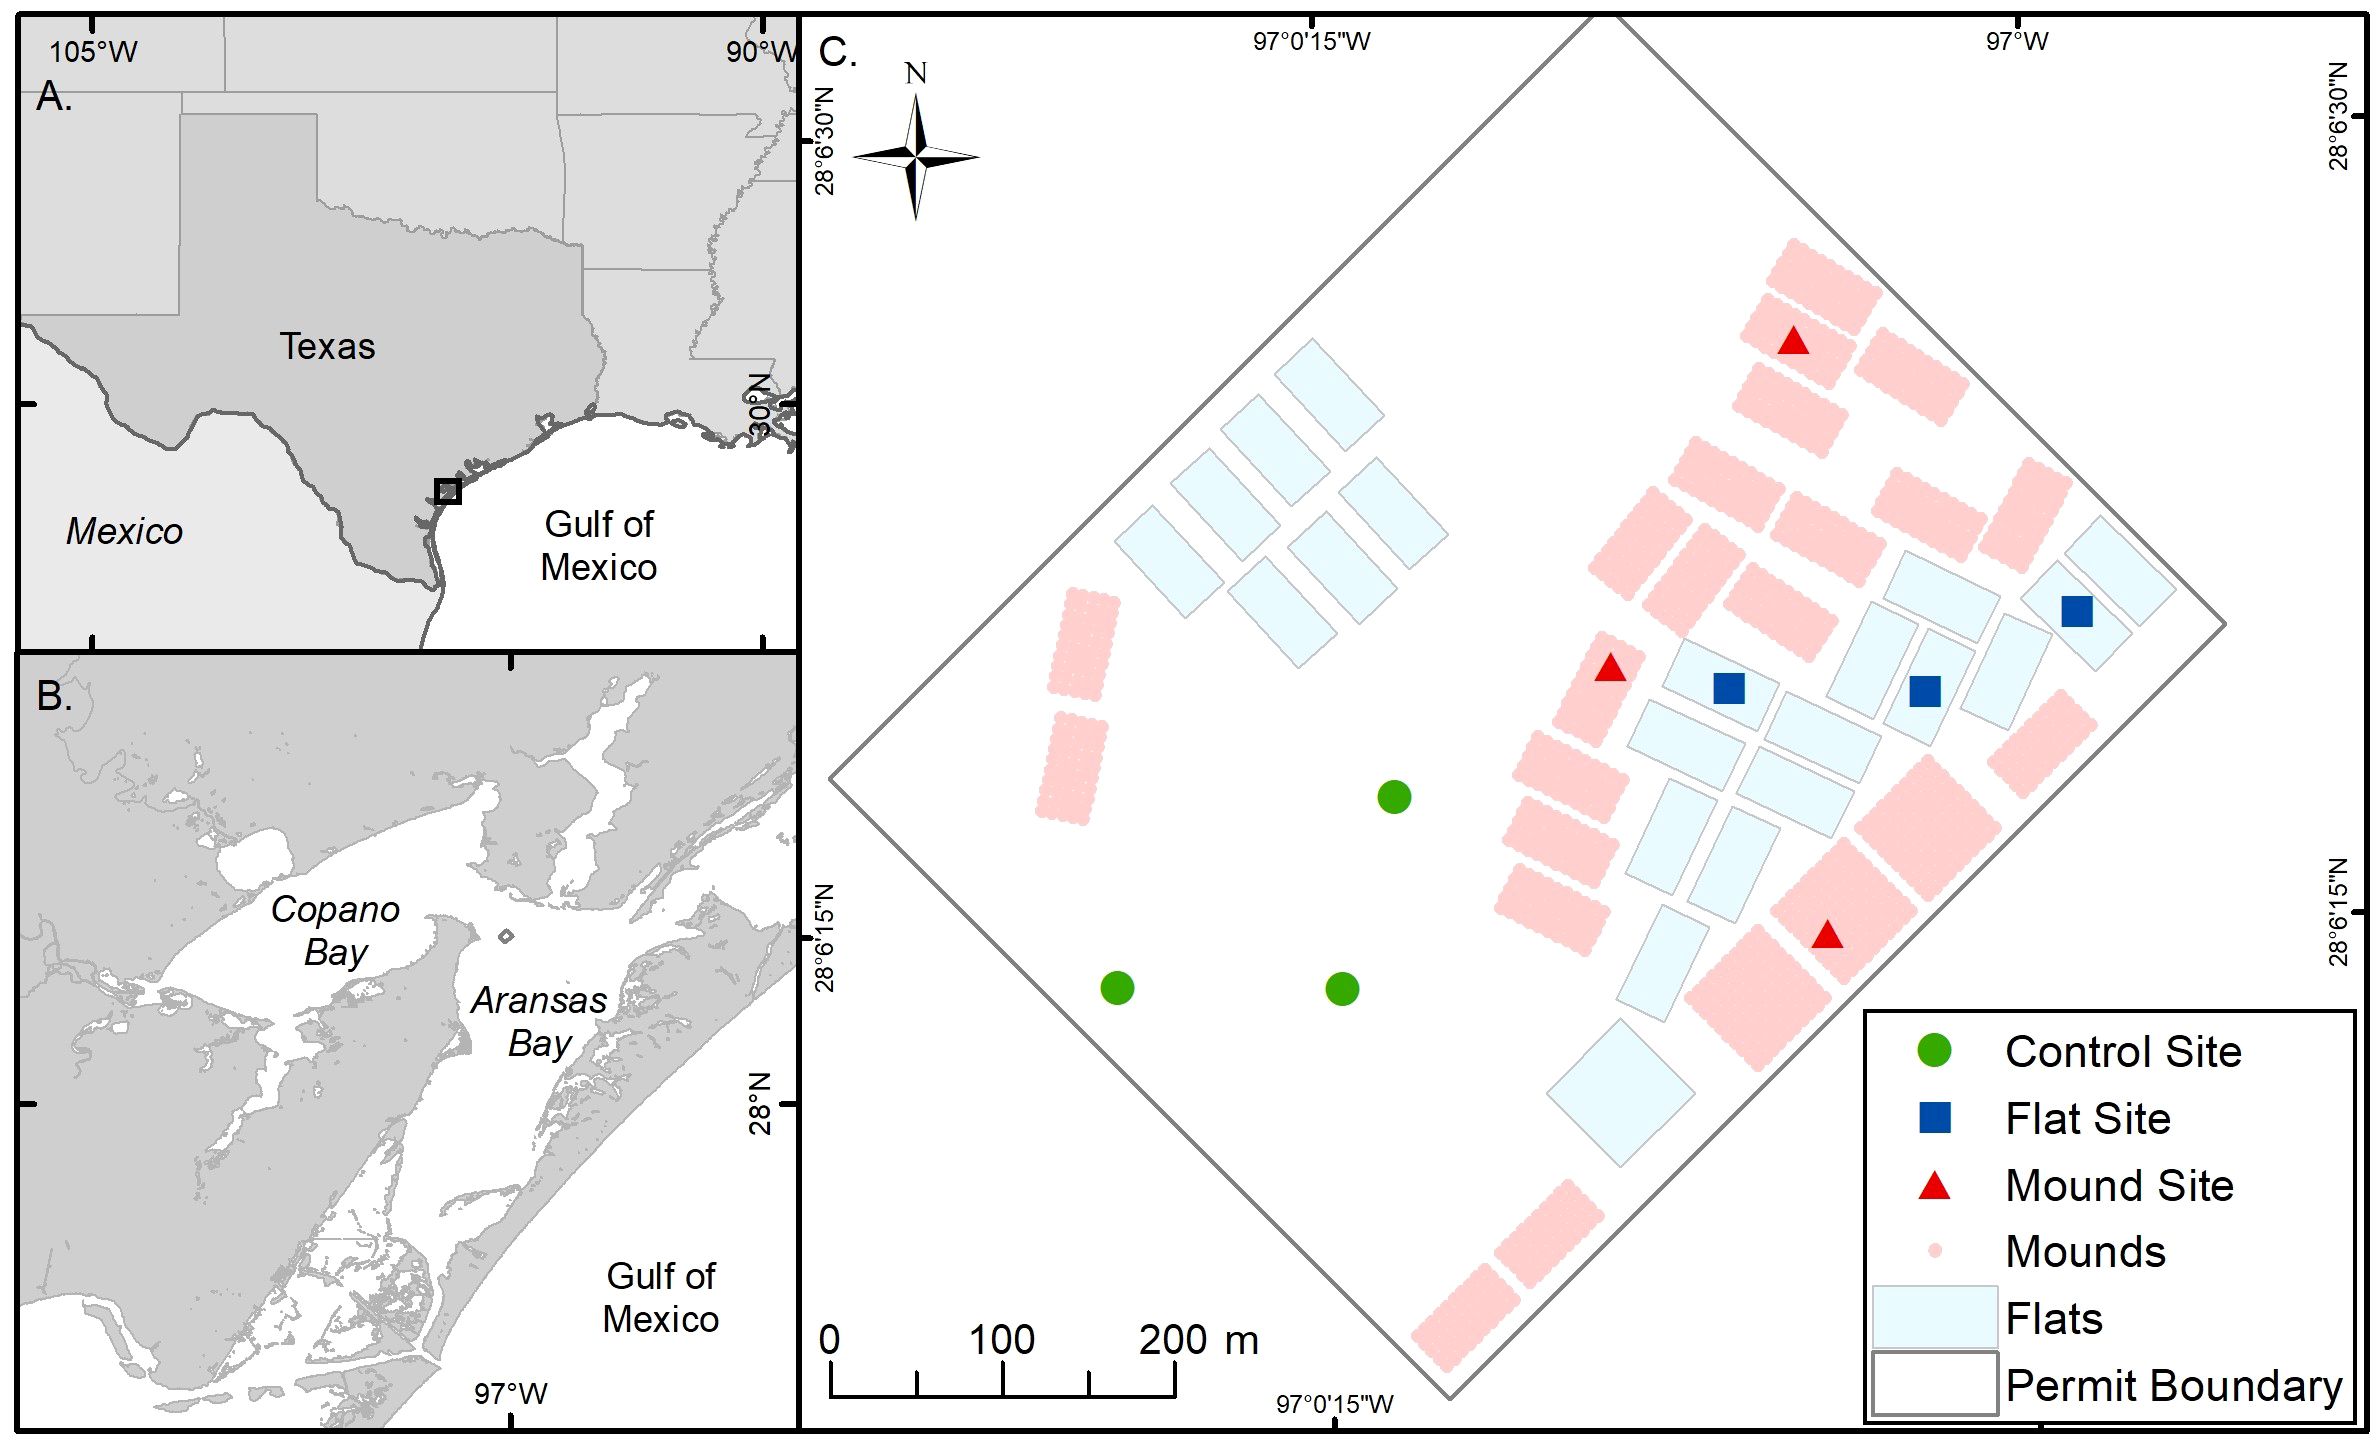
Figure 1 Map of the study area. (A) Texas coastline and Gulf of Mexico (B) Mission-Aransas Estuary, TX and (C) Grass Islands restored reef study area showing restored reef mounds (blue crosshatch), restored reef flats (light green) and unrestored areas (gray), as well as sampling sites within each. The natural reef is located outside the dashed reef boundary.
In August 2020, approximately 16.2 hectares (ha) of oyster reef were restored by the Texas Parks and Wildlife Department (TPWD) on the Grass Islands Reef complex in Aransas Bay. Grass Islands Reef was selected for restoration based on the degradation of substratum and relatively low abundance of oysters over the previous ten-year period; abundance of live oysters on the reef was below the 25th quantile of live oyster abundance of all Aransas Bay reefs (20 live oysters CPUE-1, see Martinez-Andrade, 2018 for sampling methodology), and substrata were characterized as being “hashy”, “pulverized”, and “muddy” (TPWD pers. comm.). Restoration of Grass Islands Reef occurred using 3976 m3 of #4 limestone cobble (diameter: 7.6–10.2 cm) to create 8.1 hectares of discrete high relief ‘reef mounds’ (0.6 m high, 3.04 m diameter, 3 m spacing) and 3389 m3 of the same material to create 8.1 hectares of continuous low relief ‘reef flats’ (0.08 m high; Figure 1), for a turnkey cost (i.e. transport, mobilization, labor, construction) of $284 m-3 and a total cost of $139,405 USD ha-1 for reef mounds and $118,824 USD ha-1 for reef flats (Table 1). Each reef type was built in either 30 x 61 m, or 61 x 61 m subunits. Water depth varied spatially from 2.4 to 2.9 m in the restored area before restoration, and water level varied temporally by 0.6 m (at unrestored control locations) from 2020 to 2023 (meaning that the reefs are never exposed at low tide). The restored reefs remained closed to harvest until February 2024 to allow for reef development and bay-wide population recovery.
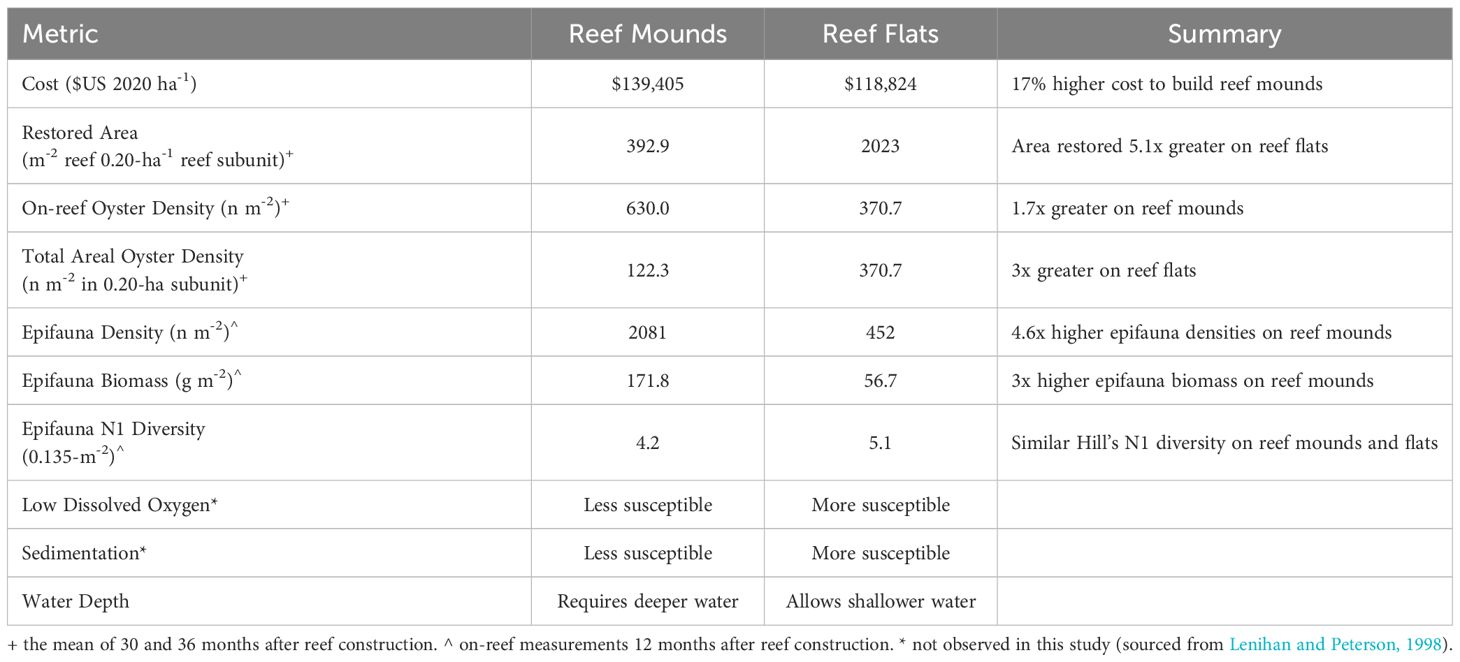
Table 1 Tradeoffs between restoring discrete, high-relief reef mounds, and continuous low-relief reef flats for a given volume of cultch material.
2.2 Study design
Oyster populations were sampled at three stations within each of three reef types (reef mounds, reef flats, and unrestored control; Figure 1). Pre-restoration monitoring was conducted in June 2020 (2 months before reef construction). Nine 0.5 m2 quadrats were sampled by divers in areas selected for construction of reef flats (3 quadrats) and reef mounds (3 quadrats), as well as in areas selected to remain unrestored (3 quadrats) to quantify densities and heights of live oysters. The quadrats were excavated to a depth of 5 cm, bagged, and assessed for oyster density at the surface. The benthic surface was homogenous with low structural complexity before restoration occurred.
Immediately following reef construction (13 August 2020), six sampling trays (45 x 30 x 10.5 cm; 0.135 m2) were placed by divers at 9 sites: three unrestored controls, three reef mounds, and three reef flats (n = 54). Each tray contained a single layer of limestone as restoration substratum. The trays were secured in place with hooked rebar. One tray was sampled from each of the sites without replacement monthly for the first three months after reef construction (14 September, 14 October, 16 November 2020), and then quarterly thereafter (09 February, 26 May, 11 August 2021). Sampling involved bringing a tray from each site to the boat and assessing for oyster metrics and motile epifauna community composition onboard. Additional sampling of oysters only occurred on reef mounds, reef flats, and unrestored control areas using 0.25 m2 or 0.5 m2 quadrats at 18, 24, 30, and 36 months after reef construction (02 February, 11 August 2022, 09 February, 16 August 2023). Sampling oyster populations using both trays and quadrats occurred on 21 occasions so that a conversion between tray density and actual background (quadrat) density could be calculated (Supplementary Table S1, Supplementary Figure S1). Hereafter, sampling dates will be referred to as months before and after reef construction (05 June 2020 = -2 months, 13 August 2020 = 0 months, 14 September 2020 = 1 month, 14 October 2020 = 2 months, 16 November 2020 = 3 months, 09 February 2021 = 6 months, 26 May 2021 = 9 months, 11 August 2021 = 12 months, 02 February 2022 = 18 months, 11 August 2022 = 24 months, 09 February 2023 = 30 months, 16 August 2023 = 36 months).
2.3 Field sampling and laboratory analysis
Water quality variables, including dissolved oxygen (mg l-1), temperature (°C), turbidity (NTU), salinity, and pH, were measured 0.1 m below the surface and 0.1 m above each oyster reef sampling tray location on each date to characterize local water quality conditions using a YSI Pro DSS multiparameter sonde.
All live oysters >25 mm shell height were enumerated from each tray sample and thirty randomly selected oysters were measured for shell height. Ten market-sized (≥ 76 mm) and ten submarket-sized (26–75 mm) live oysters from each reef type were collected to characterize infection by Perkinsus marinus; an intracellular protozoan parasite that causes Dermo disease in eastern oysters (Andrews and Ray, 1988; Powell et al., 1996). Oysters were also collected quarterly (January, April, July, October) from the existing natural reef outside the restoration footprint (within 100 m), via dredge and evaluated for shell height, density (applying a dredge efficiency rate to account for underestimated oysters collected via dredge; Beseres Pollack and Palmer, 2020), and P. marinus infection.
To assess for P. marinus infection, a 5 x 5-mm section of mantle-edge tissue was removed from just over the palps from each oyster and cultured for one week using Ray’s Fluid Thioglycollate culture method (Ray, 1966). Tissues were then stained with Lugol’s iodine solution and examined under a microscope for prevalence and intensity of P. marinus hypnospores. Perkinsus marinus intensity was scored from 0 (uninfected) to 5 (heavily infected) (Mackin, 1962; Craig et al., 1989). The proportion of oysters infected by P. marinus (prevalence) was calculated by dividing the number of infected oysters by the number of oysters sampled for each reef type for each date. Mean infection intensity was calculated for each reef on each date (Soniat et al., 2012), and weighted prevalence, a measure of the relative severity of P. marinus infection in a population, was calculated by multiplying prevalence by mean infection intensity.
Motile reef-resident fauna were collected in the field by rinsing the limestone cobble with seawater over a 0.5 mm mesh, and were then placed in 10% buffered formalin. In the laboratory, motile fauna from the trays were sorted, counted, and identified to the lowest practical taxon (usually species). Dry weight biomass for each taxon in each sample was measured after drying organisms for approximately 24 hours at 60°C. Mollusks were placed in 0.1 M HCl to remove shells before weighing.
2.4 Data analysis
To evaluate oyster densities across large subunits of the restored reef complex and accounting for spaces between reef mounds, the number of oysters per 0.20-ha (0.5-acre) reef subunit (50 mounds or continuous flat), the total areal density of oysters each 0.20-ha restored subunit (including bare spaces between mounds), and the density of oysters per volume of cobble was calculated (Supplementary Table S2).
The effects of reef type (reef flats, reef mounds, unrestored control) and sample date on motile epifauna density, biomass, and diversity (Hill’s N1), as well as oyster density and size were tested using separate two-way analysis of variance (ANOVA) tests for each dependent variable. Hill’s N1 diversity was used as a diversity measure because its’ units are the number of dominant species, so is more interpretable than many other diversity indices (Ludwig and Reynolds, 1988). The normality of residuals was assessed using the Shapiro-Wilks test. Oyster density and epifauna biomass data were square root transformed, and oyster height data were loge transformed to meet ANOVA normality assumptions. Epifauna density and Hill’s N1 diversity data did not need to be transformed to meet normality assumptions. Data from the harvested oyster reef were not included in analyses due to differences in sampling dates. The Tukey’s multiple comparison test was used to determine differences among or between treatments when significant differences were found (p < 0.05). All univariate analyses and data management were performed using SAS 9.4 software (SAS Institute Inc, 2013).
Spatio-temporal changes in motile epifauna community composition were determined using non-metric multidimensional scaling (nMDS) (Clarke and Warwick, 1994). Groupings of communities were identified using cluster analysis (group-average method) and meaningful clusters were verified using a Similarity Profile (SIMPROF) test (Clarke et al., 2008). The similarity percentages (SIMPER) routine was used to determine which taxa were characteristic of, and different among restored and unrestored reefs, and mound and flat restored reefs. Multivariate analyses were performed using a Bray-Curtis similarity matrix on loge(x+1)-transformed abundance data using PRIMER v7 software (Clarke and Gorley, 2015).
3 Results
3.1 Water quality
Salinities decreased steadily from 31.4 ± 0.1 (mean ± standard deviation) one month after restoration (September 2020) to 5.1 ± 1.6 twelve months later (August 2021) following periods of heavy rainfall, before increasing again to 35.9 ± 0.4 at 24 months post-construction (August 2022) (Figure 2). Water temperature followed expected seasonal patterns, with the warmest temperatures occurring each August (30.1 to 31.6 °C) and the coolest temperatures occurring each February (14.3 to 18.3°C). Dissolved oxygen concentrations were inversely related to temperature, ranging from a low of 5.2 to 5.9 mg L-1 each August to highs of 8.2 to 9.8 mg L-1 each February. pH was relatively similar throughout the study period, ranging from 7.9 to 8.3 throughout the study period.
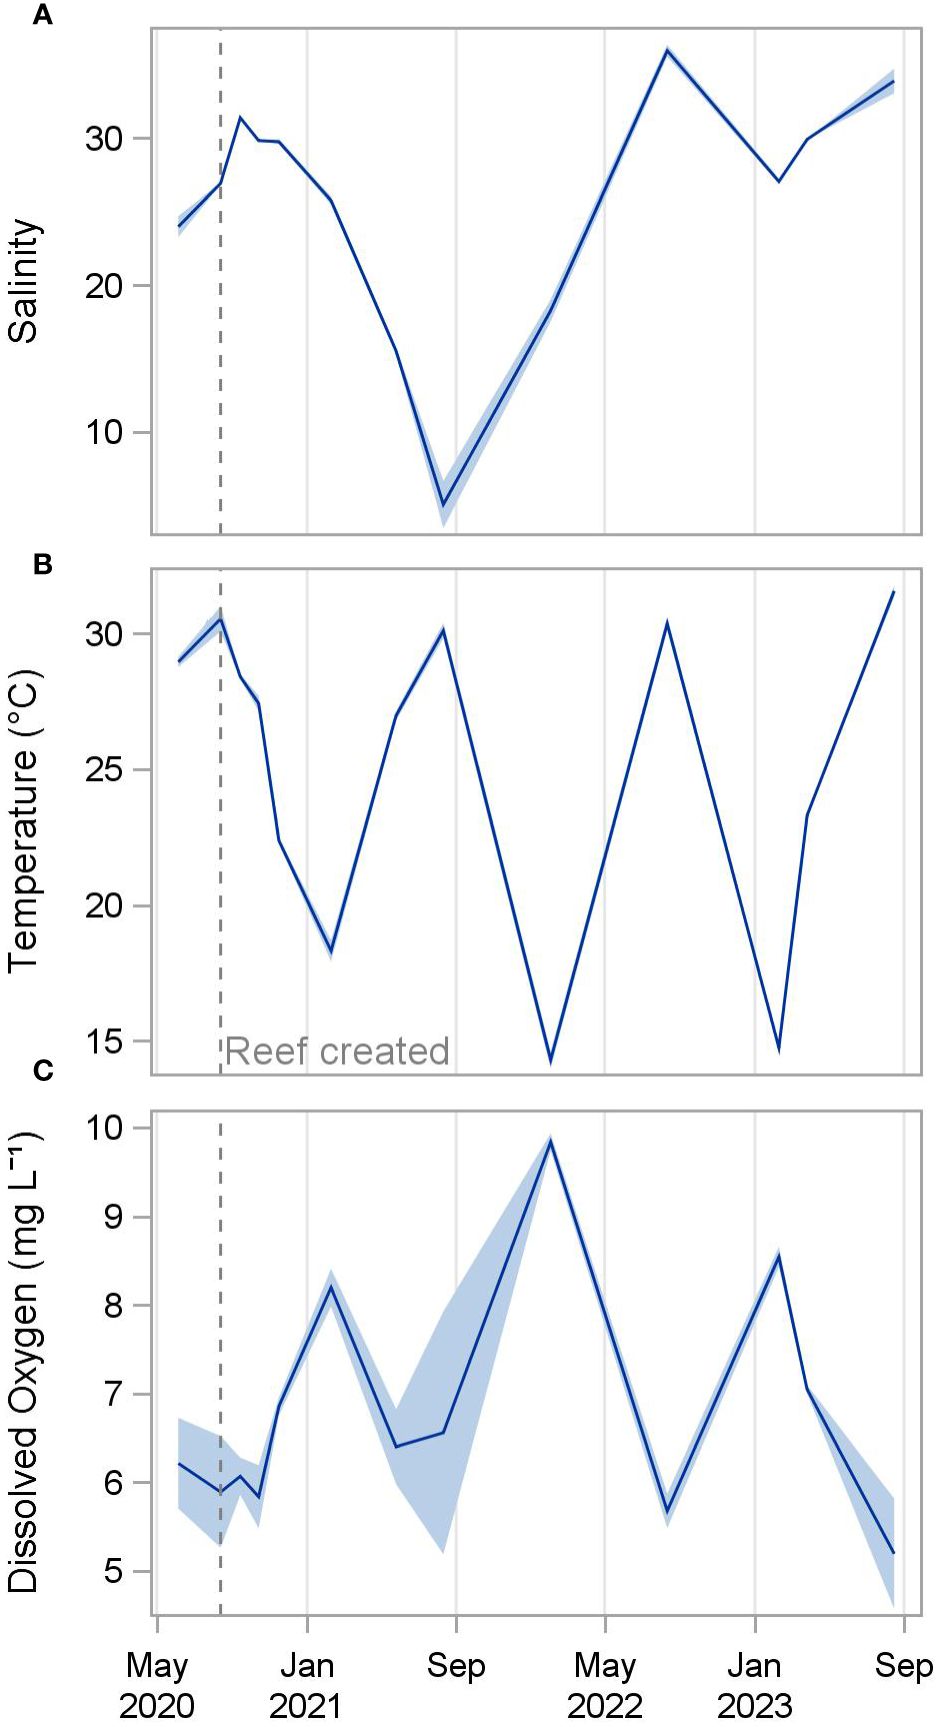
Figure 2 Mean salinity (A), temperature (B), and dissolved oxygen (C) of all reefs from June 2020 to August 2023. Shading indicates standard deviation.
3.2 Oysters
On-reef oyster densities increased rapidly on both the reef mounds and reef flats, peaking on reef mounds at 651 ± 73 n m-2 18 months after restoration, and on reef flats at 421 ± 148 n m-2 30 months after restoration. On-reef oyster densities were substantially lower in the unrestored control area, ranging from 0 n m-2 at 1 and 2 months after restoration to 9 ± 5 n m-2 after 36 months. A peak of 24 ± 7 n m-2 occurred 26 months after reef construction at the adjacent natural reef (Figure 3). Significant interaction terms between reef type and time in the two-way ANOVA models for on-reef oyster density required simple main effects analysis (Supplementary Table S3; Table S4). On-reef oyster density was significantly higher on reef mounds and reef flats (p < 0.05) than unrestored control areas for all sampling periods from November 2020, three months after restoration (p > 0.9; Supplementary Figure S2).
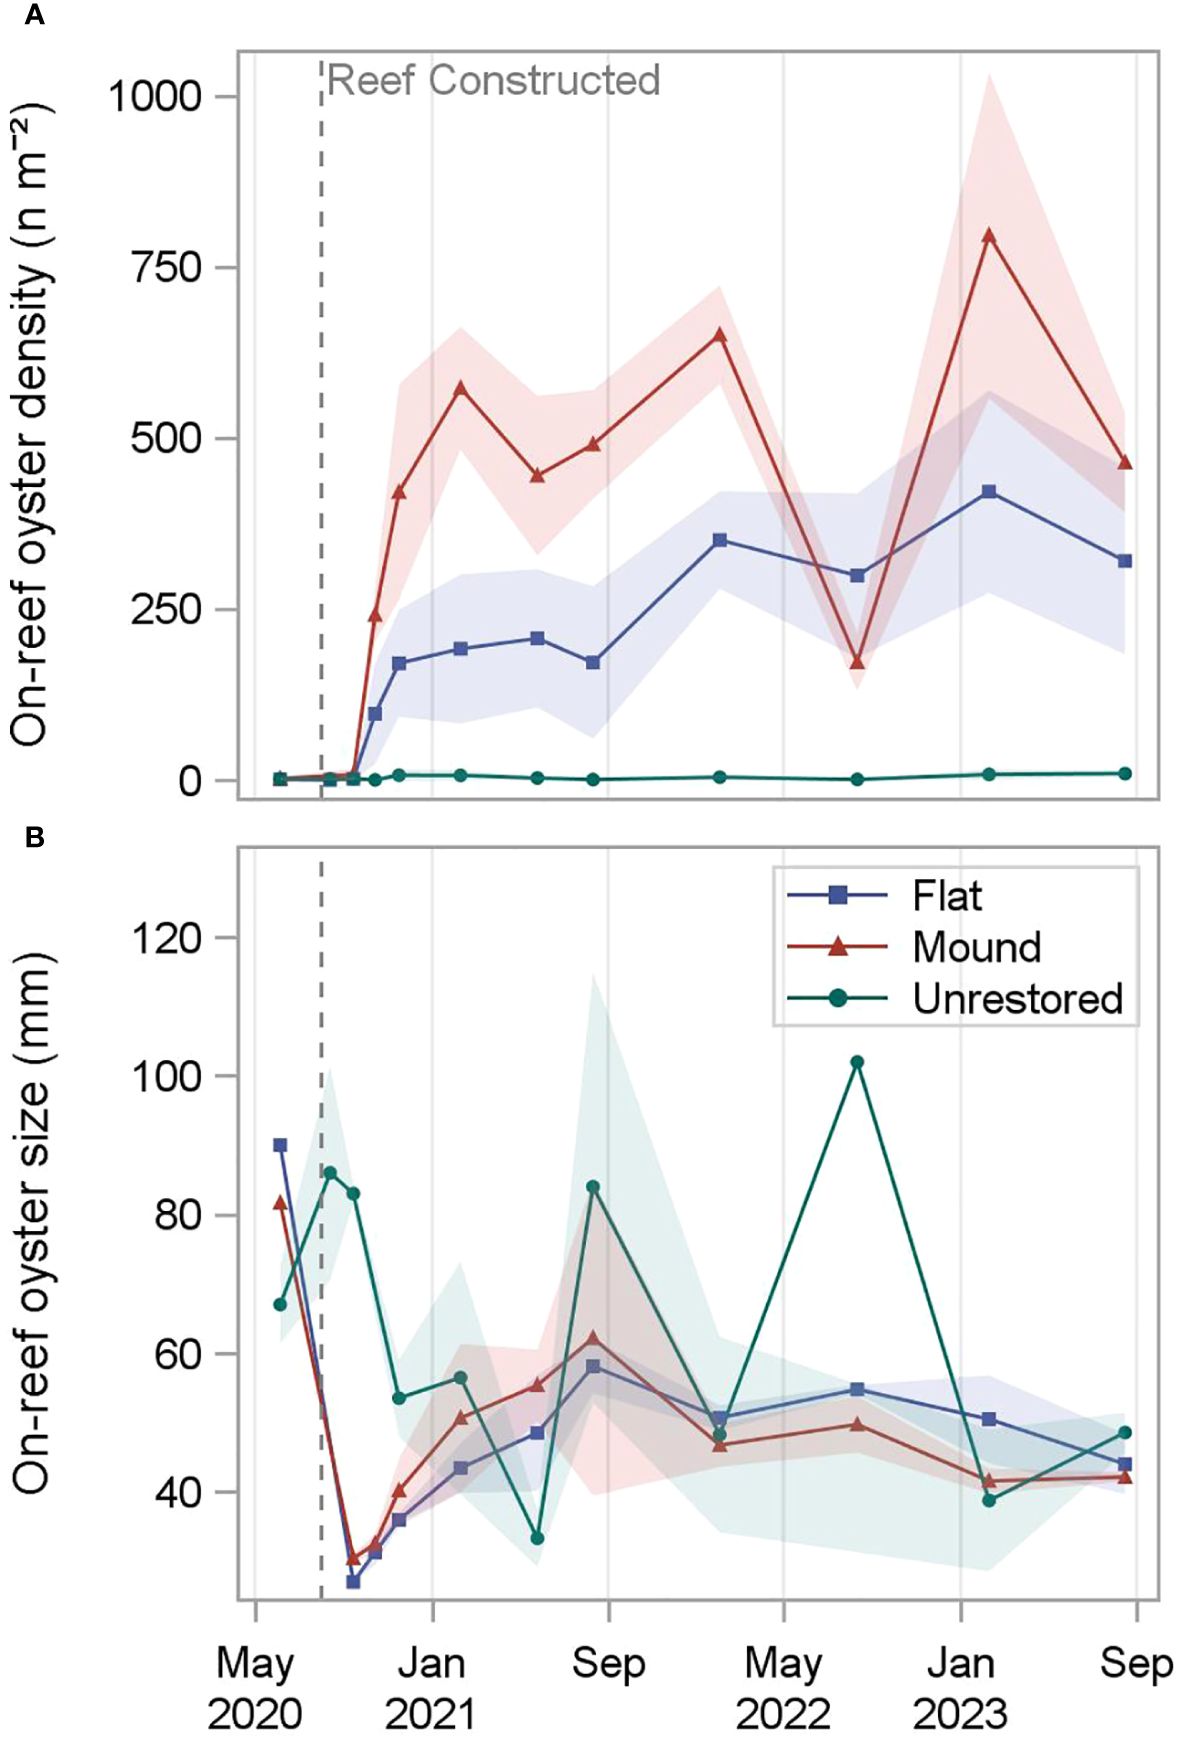
Figure 3 On-reef oyster density (A) and size (=shell height) (B) measured at reef mounds, reef flats, and unrestored control areas from June 2020 (-2 months before restoration) to August 2023 (36 months after restoration). Shading indicates standard deviation.
Following reef restoration, oyster size (shell height) steadily increased on both reef types to a high of 62 ± 23 mm on reef mounds and a high of 58 ± 4 mm on reef flats after 12 months. In the following two years, oyster size at reef mounds and reef flats remained relatively stable, ranging from 42 ± 2 mm 30 months after restoration to 50 ± 4 mm 24 months after restoration on reef mounds and 44 ± 4 mm 36 months after restoration to 55 ± 1 mm 24 months after restoration on reef flats. Oyster size in the unrestored control areas was the most variable after restoration, ranging from 33 ± 4 mm 9 months after restoration to 102 mm (only one oyster sampled) after 24 months. Oyster size on nearby natural reefs ranged from 32 ± 0.4 mm 26 months after restoration to 70 ± 11 mm 23 months after restoration. Significant interaction terms between reef type and time in the two-way ANOVA models for oyster size required simple main effects analysis (Supplementary Table S3; Table S4). Oyster height was significantly larger on unrestored control areas than reef mounds and reef flats (p < 0.05) one month after restoration, likely due to the presence of the existing natural reef outside the restoration footprint (Supplementary Figure S3; Supplementary Figure S4). Within the first three months after restoration, mean oyster growth rate was 0.15 mm day-1 on reef flats and 0.23 mm day-1 on reef mounds.
The 0.20-ha reef complex subunits (Figure 1) contained an average of 247,547 oysters on reef mounds and 750,018 oysters on reef flats over the final two sampling dates (30- 36 months after restoration), (Tables 1, 2). Mean restored oyster areal densities across 0.20-ha subunits were 122.3 oysters m-2 on reef mounds, 370.7 oysters m-2 on reef flats, and 8.7 oysters m-2 on unrestored control areas (Figure 4). Mean restored oyster volumetric densities were 1,619 oysters m-3 of cobble on reef mounds and 4,868 oysters m-3 of cobble on reef flats. Only 17,532 oysters (8.7 oysters m-2) occurred per 0.20-ha subunit of unrestored control area.
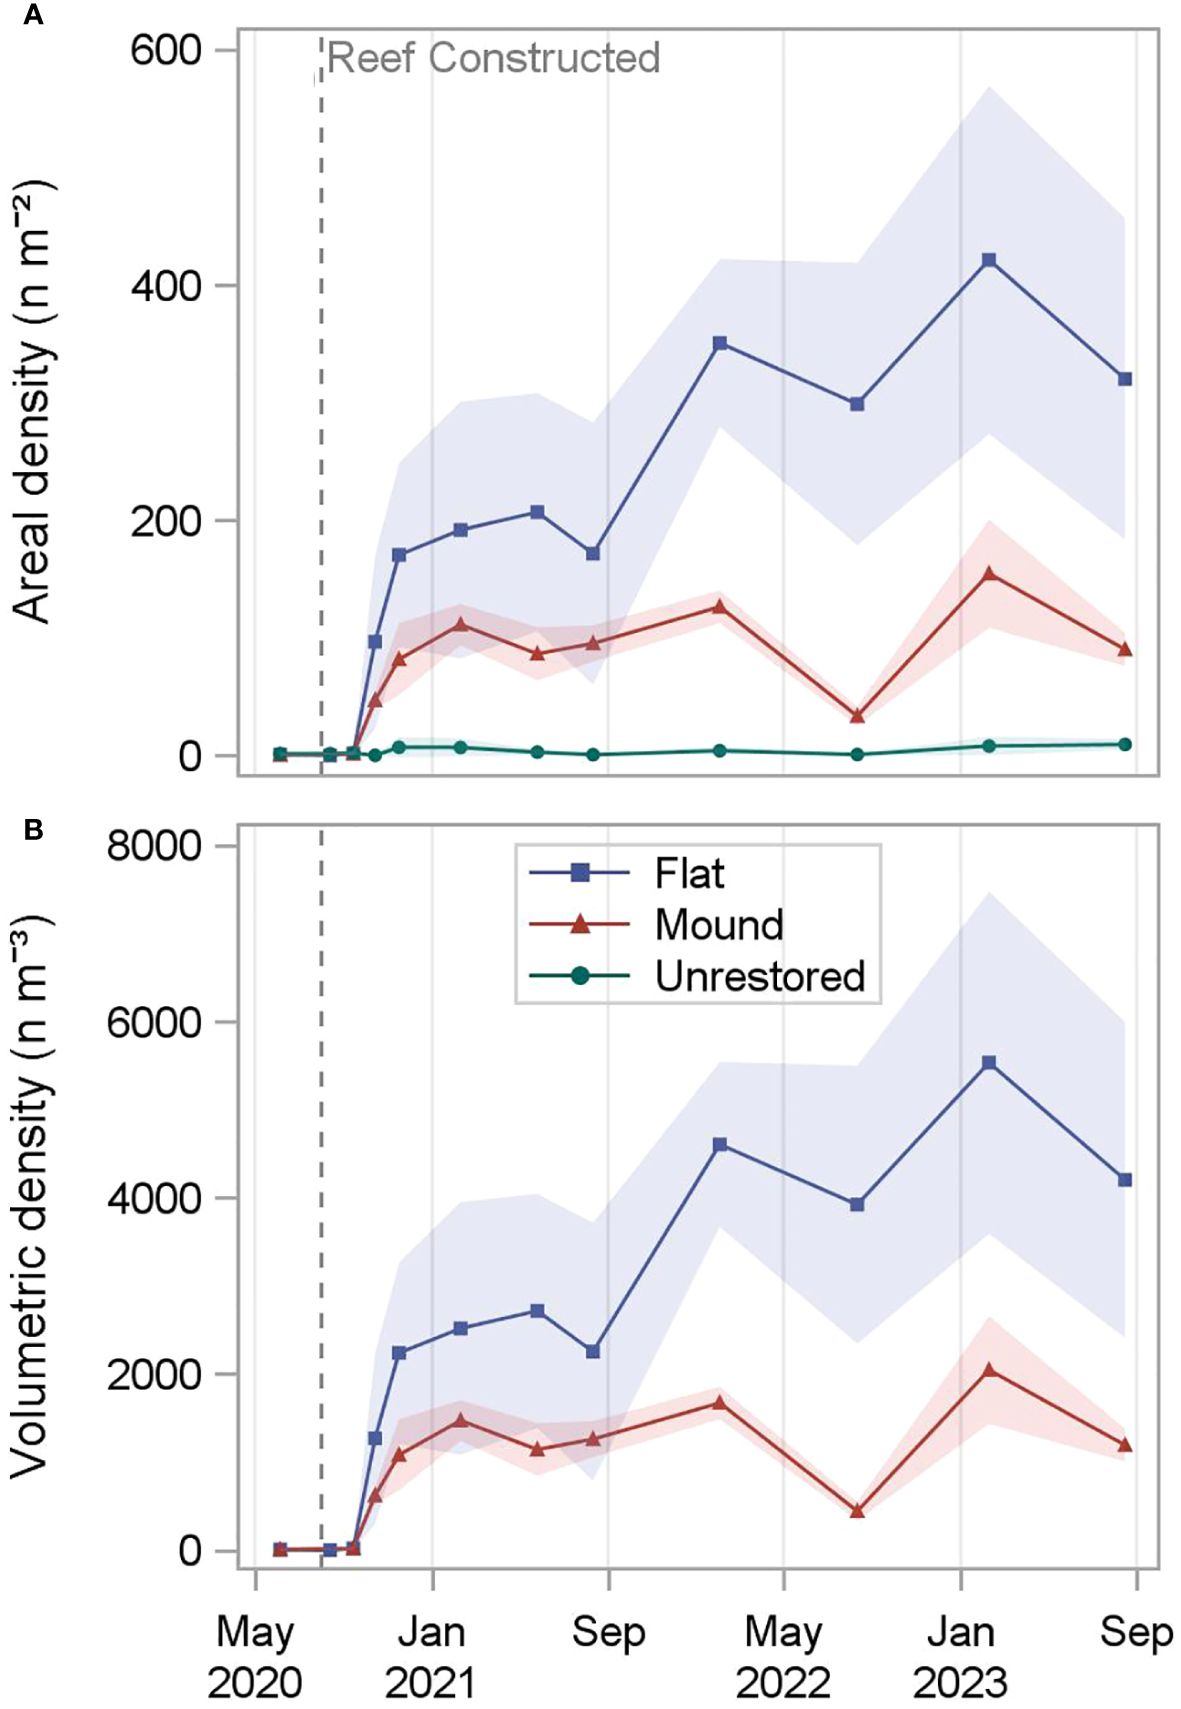
Figure 4 Total restored oyster areal density (n m-2; A) and oyster volumetric density (n m-3 of cobble; B) calculated for reef mounds, reef flats, and unrestored control areas (top only) from June 2020 (-2 months before restoration) to August 2023 (36 months after restoration). Densities are calculated assuming no oysters are present in spaces between mounds. Shading indicates standard deviation.
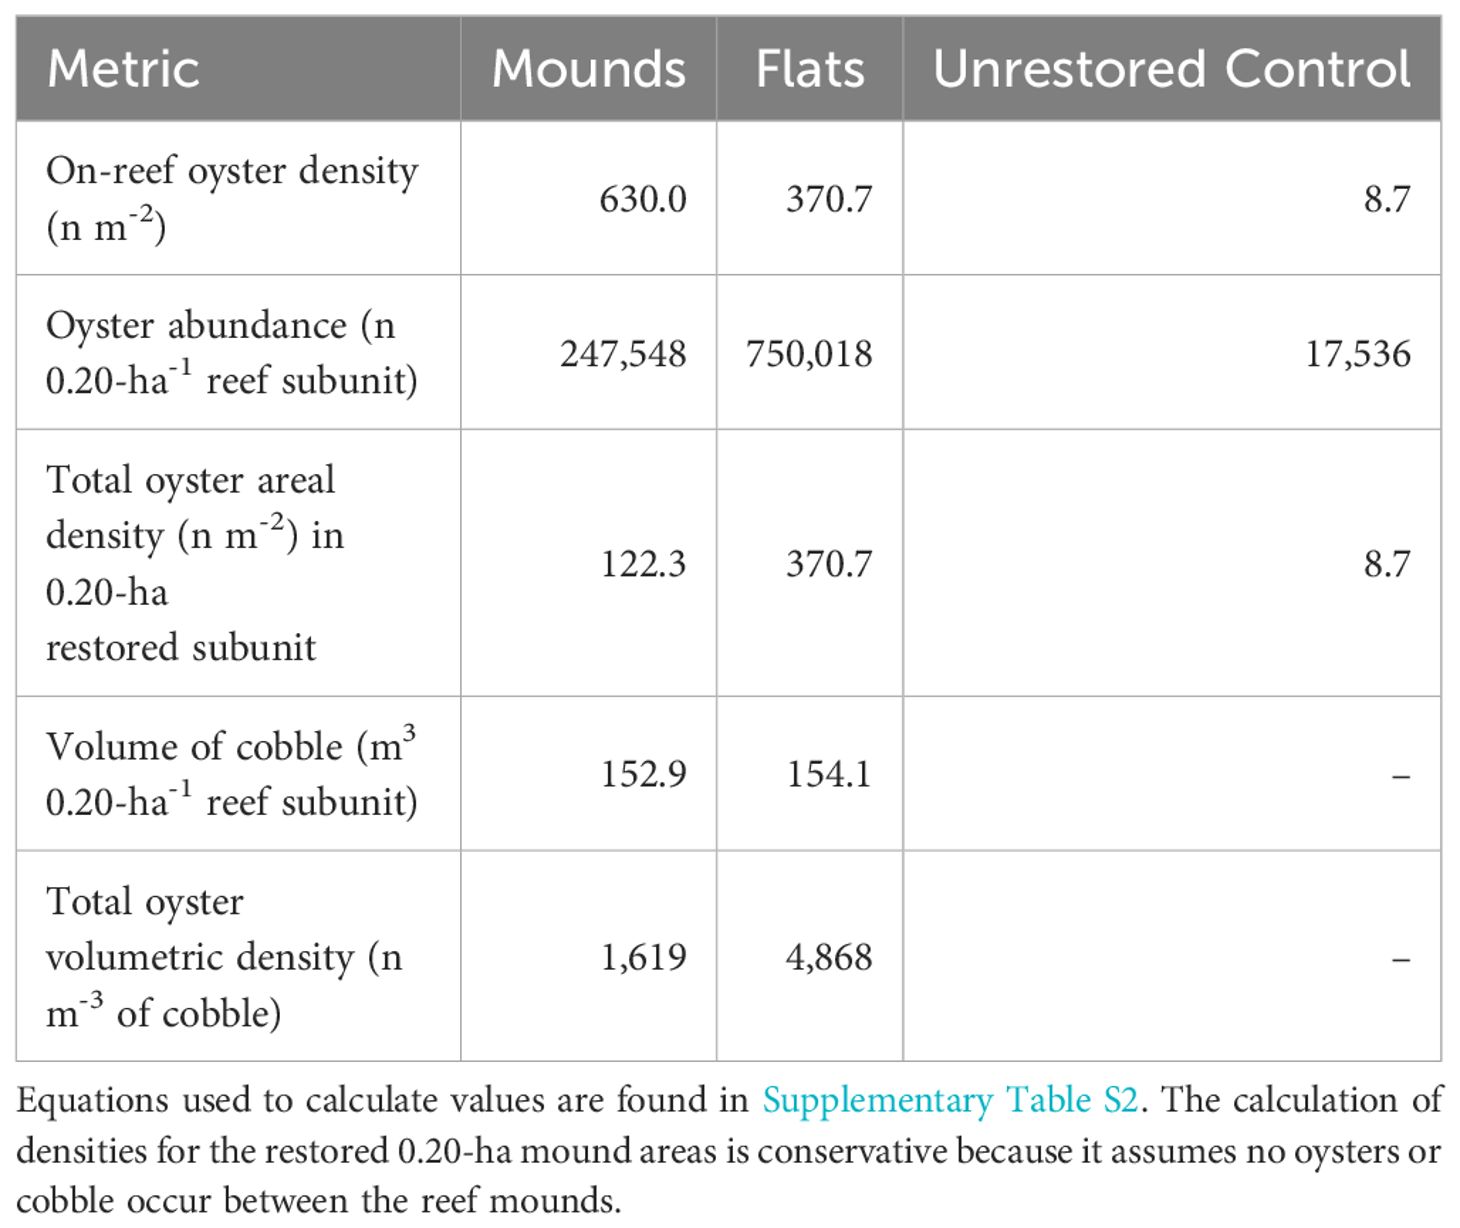
Table 2 Mean densities of oysters on each reef structure, and over a restored 0.20-ha restored area 30–36 months after restoration (mean of February and August 2023).
A total of 358 oysters, ranging in size from 27 mm to 123 mm, were collected and assessed for presence and severity of infection by P. marinus, starting 2 months after restoration (when oysters larger than spat were first present). Only 167 of the 358 sampled oysters were infected with P. marinus. Because P. marinus infections tend to increase with size (Andrews and Ray, 1988), results are presented for both submarket (≤75 mm) and market (>75 mm) size classes (Supplementary Figure S5). There were only small differences in infection prevalence (≤|30%|) and weighted prevalence (≤|0.37|) between the two reef types on all sampling dates except for in February 2021 (6 months after restoration). In February 2021, prevalence and weighted prevalence were greater in both submarket (100% prevalence, 0.57 weighted prevalence) and market size classes (100%, 1.07) on the reef mounds than in both submarket (40%, 0.17) and market size classes (50%, 0.17) on the reef flats. Prevalence and weighted prevalence of P. marinus on submarket size classes at the unrestored control sites were highest 3 months after restoration (November 2020; 86%, 1.18 respectively) after restoration, when there was no P. marinus detected at the restored sites. However, P. marinus prevalence and weighted prevalence in submarket classes at the unrestored control area were similar to both restored areas for all subsequent dates (differences ≤ |34%|, |0.45|) except for February 2021 when P. marinus infection was high at the reef mounds. Few market class oysters were found and analyzed for P. marinus from the unrestored control areas (20 oysters, 3 dates), therefore the only meaningful result is that weighted prevalence was higher in market classes at the unrestored control in February 2021 (2.0, n = 10) and August 2022 (1.4, n = 9) than on the restored reefs on the same dates (0.2 to 1.1). At the nearby natural reef, P. marinus prevalence and weighted prevalence were higher or similar at the natural reef than the restored reefs for the first 5 months after restoration, similar for most of the study period, and then decreased towards zero at the natural reef while prevalence and weighted prevalence increased at the restored reef from 30 to 36 months after restoration (February to Augst 2023).
3.3 Epifauna
A total of 23,110 motile epifaunal organisms were collected following reef construction (8,859 on mounds, 8,758 on flats, and 5,493 on unrestored control sites), including 44 species (26 on mounds, 32 on flats, 44 on unrestored control; Table 3). Mean epifauna density was greater on mounds (3649 n m-2) and flats (3604 n m-2) than on the adjacent unrestored control area (2260 n m-2; p = 0.0001, Supplementary Table S5; Supplementary Figure S6). On the restored reefs, epifauna densities increased to a peak after three months (4886 ± 1295 n m-2 on reef mounds and 4913 ± 152 n m-2 on reef flats), before slowly decreasing to a low at 12 months after construction (2081 ± 301 n m-2 on reef mounds and 452 ± 255 n m-2 on reef flats; Figure 5). Epifauna densities were lowest on the unrestored control sites, decreasing from a high of 3617 ± 1627 n m-2 after two months to a low of 37 ± 26 n m-2 after 12 months. Porcelain crab Petrolisthes spp. were the most abundant organisms reef mounds (2667 n m-2), reef flats (2406 n m-2), and the unrestored control (1495 n m-2), followed by Panopeidae crabs on reef mounds (350 n m-2), the gastropod Fargoa dianthophila on reef flats (385 n m-2), and the gastropod Parvanachis ostreicola (299 n m-2) in unrestored control areas.
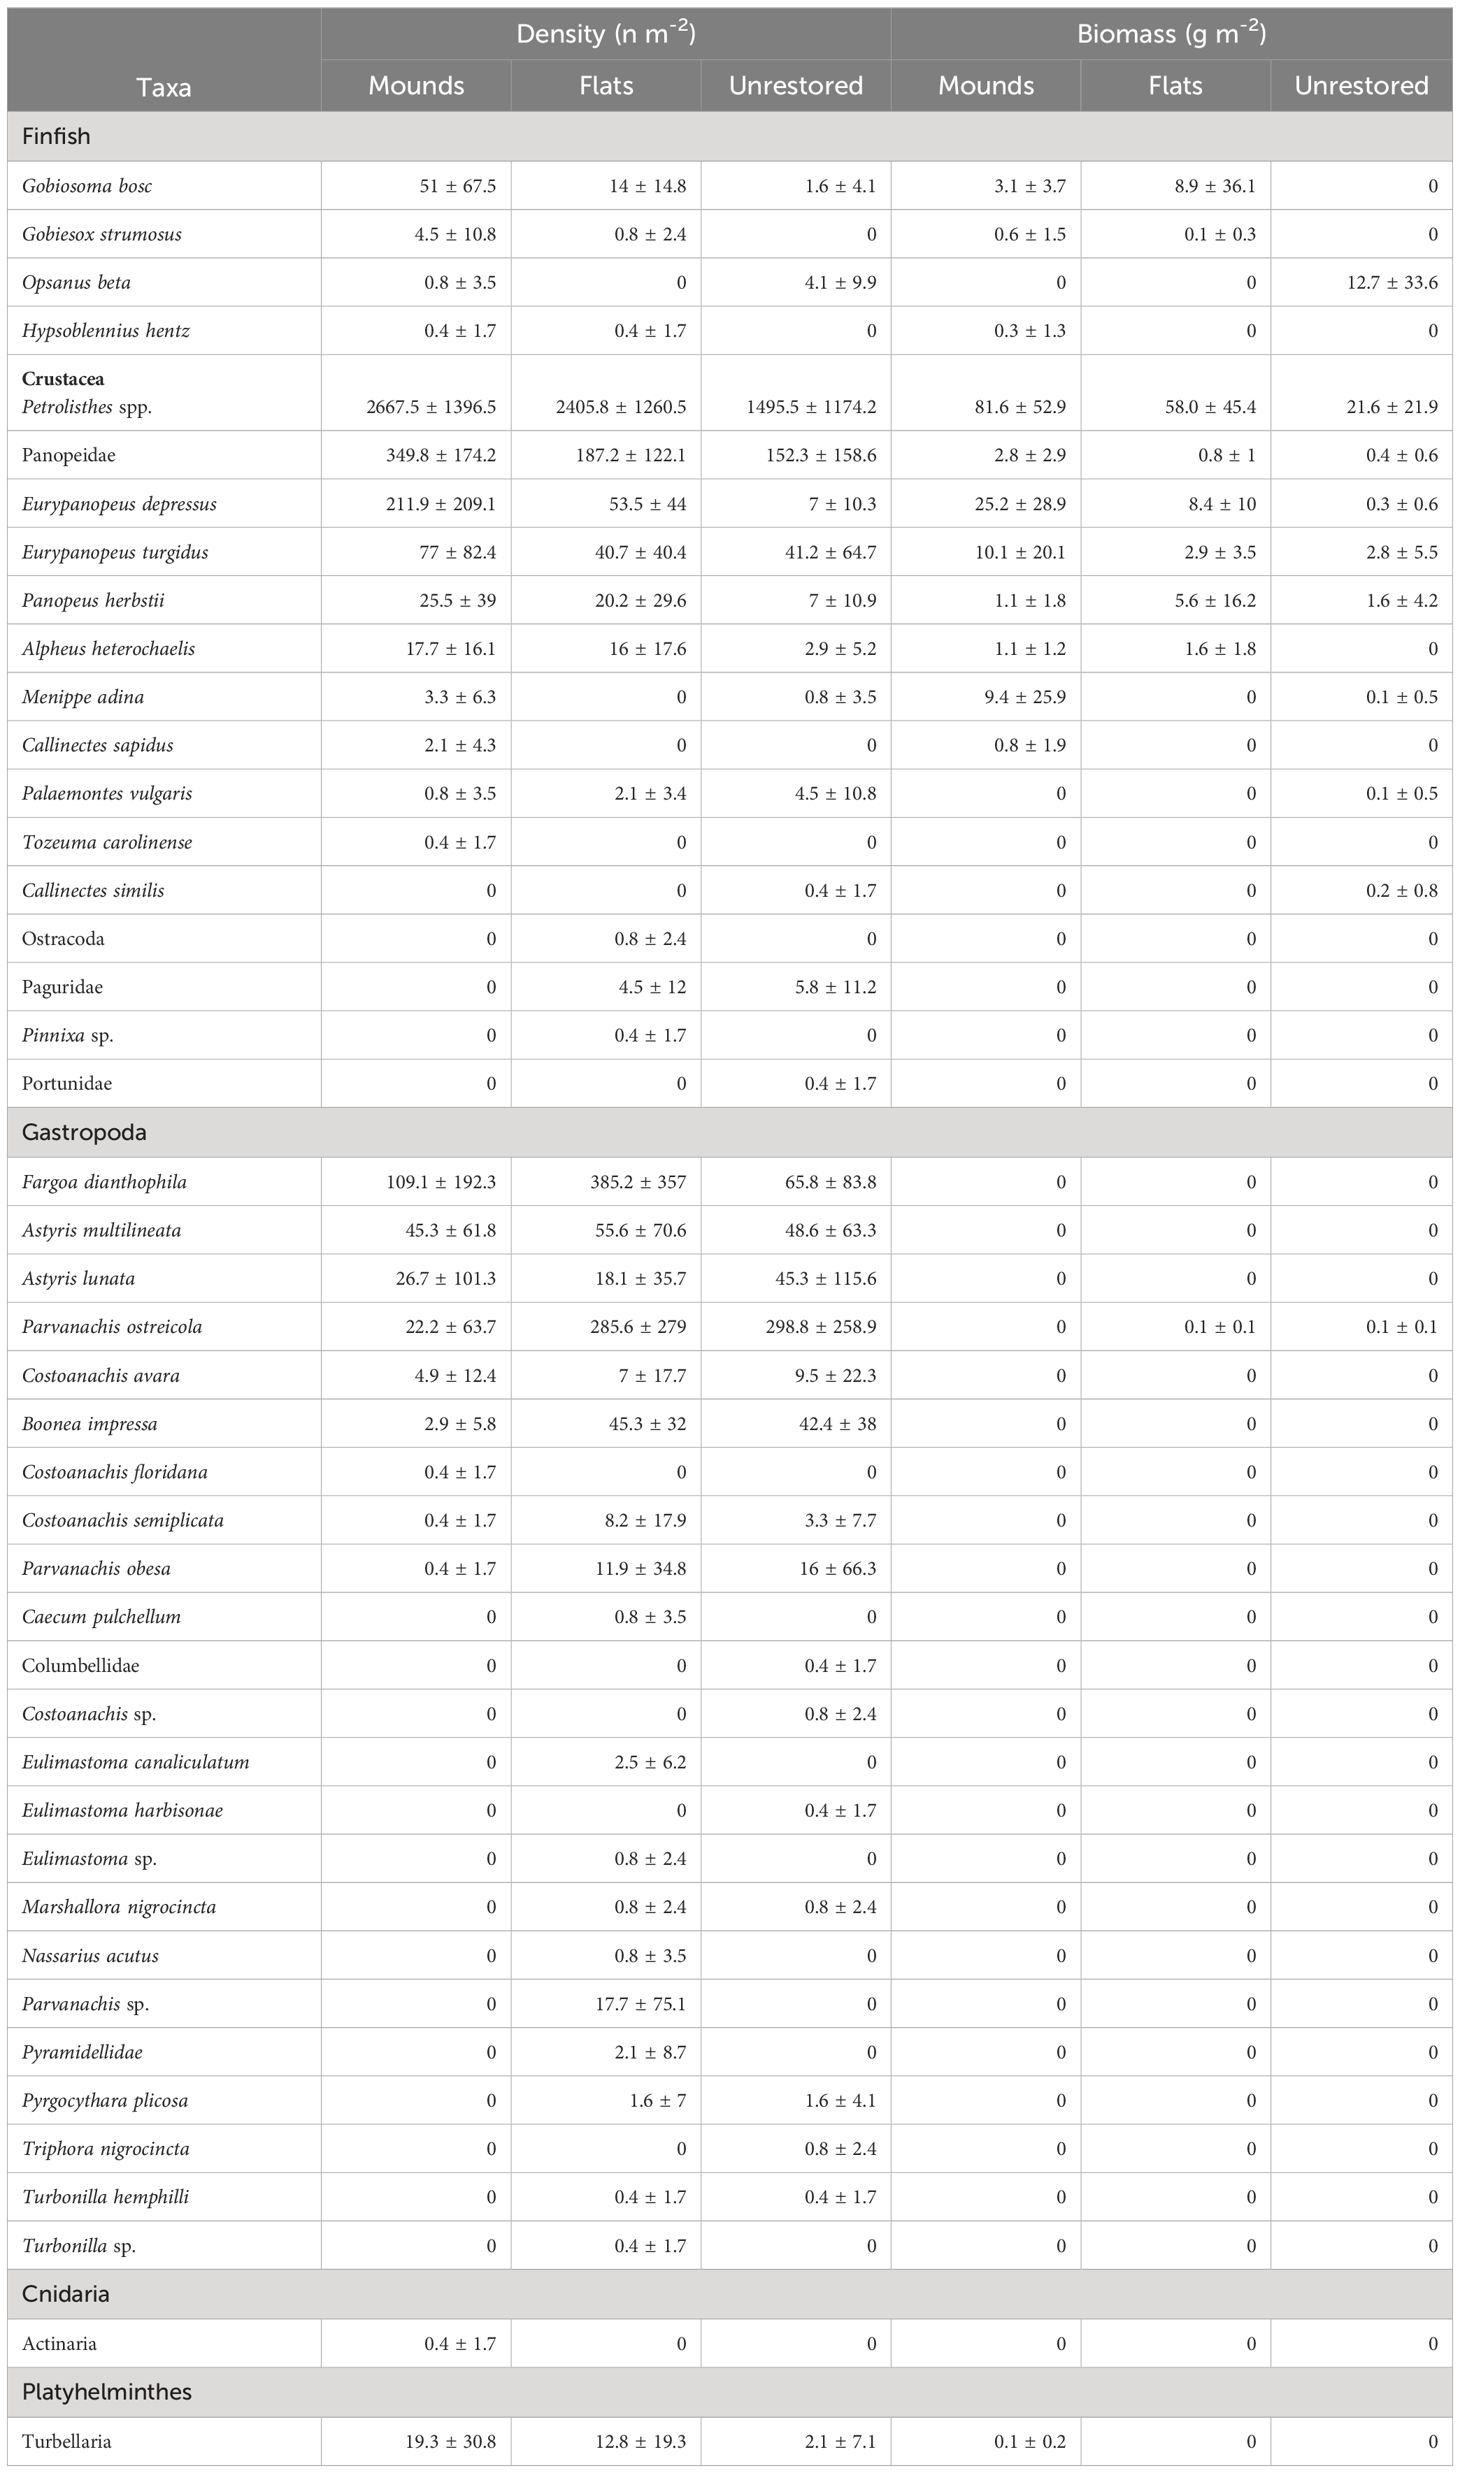
Table 3 Density and biomass (mean ± SD) of motile epifauna inhabiting mounds, flats, and unrestored (control) reefs.
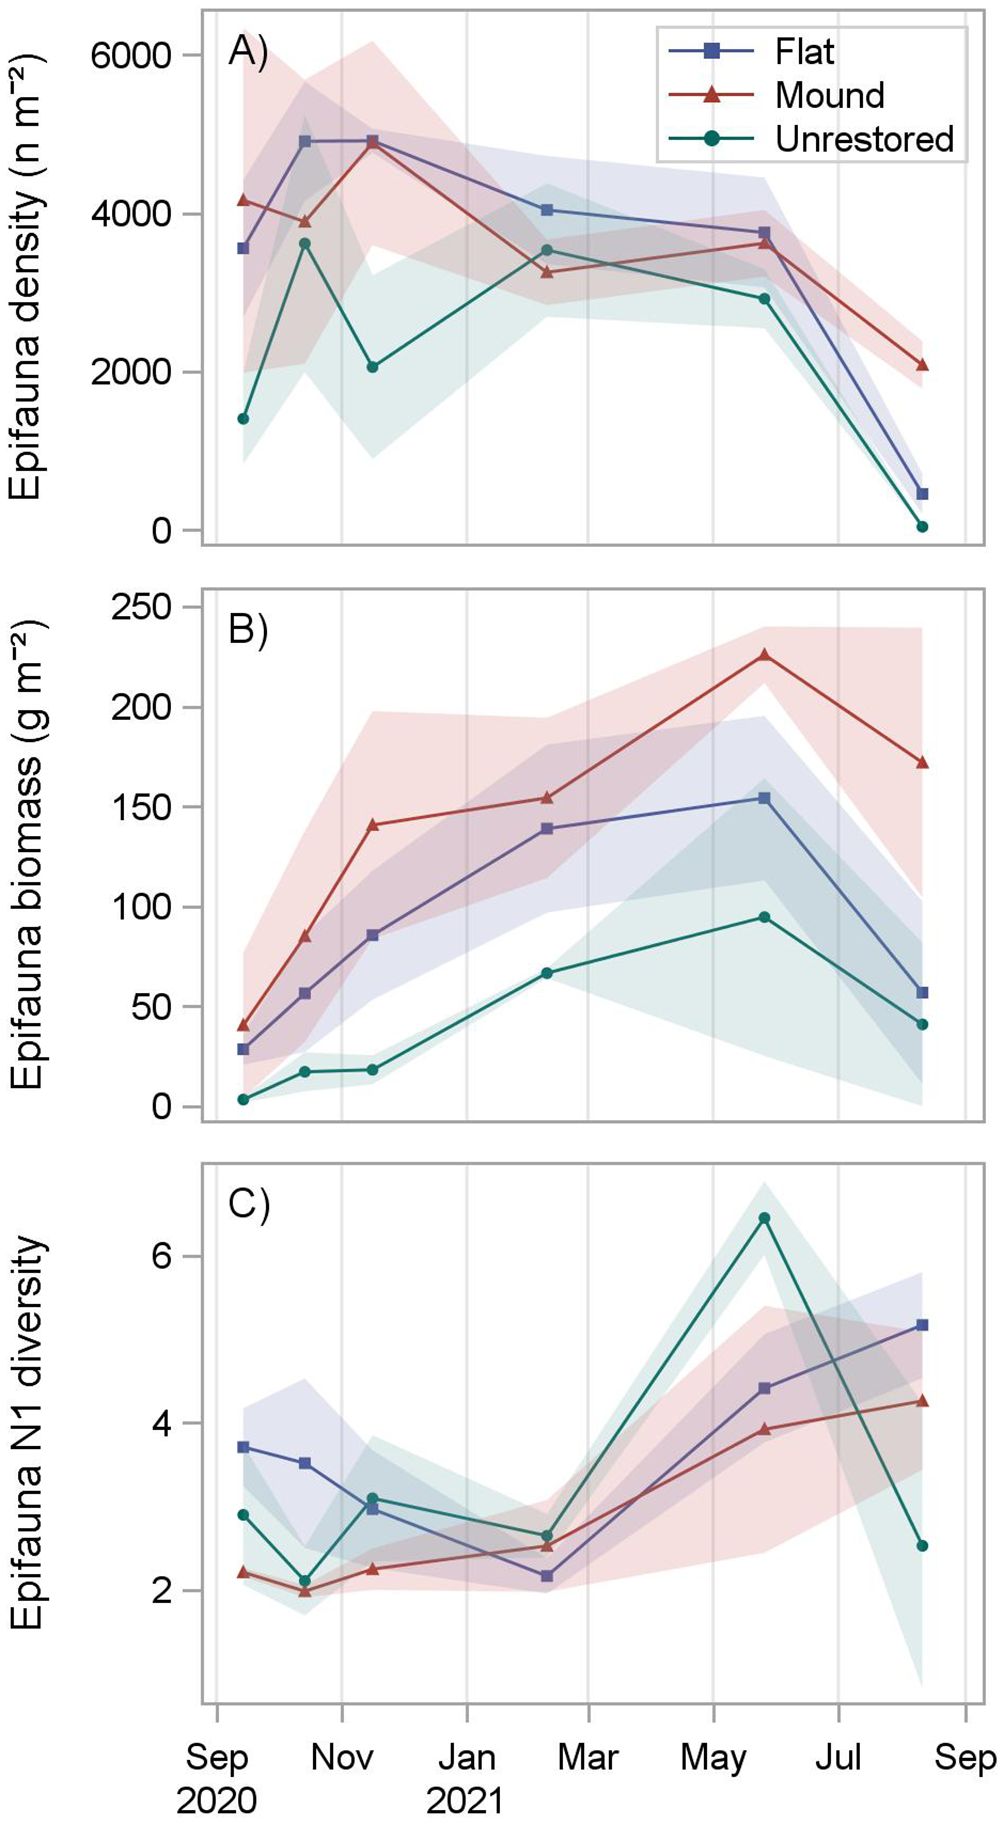
Figure 5 Motile epifauna density (A), biomass (B), and diversity (C) at reef mounds, reef flats, and unrestored control areas from September 2020 (1 month after restoration) to August 2021 (12 months after restoration). Shading indicates standard deviation.
Reef-associated epifaunal biomass was significantly greater on reef mounds (136.3 g m-2) than reef flats (86.7 g m-2), which in turn was greater than on the unrestored controls (40.1 g m-2; p < 0.0001, Supplementary Table S5; Supplementary Figure S7). Epifauna biomass increased for the first 9 months after reef construction to a peak of 225.8 ± 14.1 g m-2 on reef mounds, 154.1 g m-2 ± 41.2 g m-2 on reef flats, and 94.5 ± 69.5 g m-2 in unrestored control areas (Figure 5). Biomass then declined to 171.8 ± 67.5 g m-2 on reef mounds, 56.7 ± 45.7 g m-2 on reef flats, and 40.8 ± 41.0 g m-2 in unrestored control areas at 12 months after reef construction, coincident with a salinity decrease from 15.5 to 5.1 from 9–12 months after reconstruction (May to August 2021). Petrolisthes spp. was the dominant species by weight in reef mounds (81.5 g m-2), reef flats (58.0 g m-2), and the unrestored control (21.6 g m-2), followed by the crab Eurypanopeus depressus (25.2 g m-2) and Eurypanopeus turgidus (10.1 g m-2) on reef mounds, E. depressus (8.4 g m-2) and the fish Gobiosoma bosc (8.9 g m-2) on reef flats, and the Gulf toadfish Opsanus beta (12.7 g m-2) in unrestored control areas (Table 3).
Epifauna (Hill’s) N1 diversity was fairly consistent for the first 6 months after reef construction at reef mounds (2.0 to 2.5 ind. tray-1), reef flats (2.2 to 3.7 ind. tray-1) and the unrestored control (2.1 to 3.1 ind. tray-1), before increasing thereafter. N1 diversity increased to a peak of 4.2 ± 0.2 species on unrestored control areas after 9 months and 4.2 ± 0.8 species on reef mounds and 5.1 ± 0.6 species on reef flats after 12 months (Figure 5). Simple generalizations of differences among reef types or dates could not be made because of a significant interaction between date and reef type (p = 0.0005) (Supplementary Table S5; Table S6). However, epifauna diversity was significantly higher on reef flats (but not reef mounds) than unrestored control areas 12 months after restoration (Supplementary Figure S8).
Motile epifaunal community composition was similar in unrestored control and reef flats for the first 6 months after restoration (>71% similar), which grouped separately to the communities occurring in reef mounds during the same 6-month period (Figure 6). However, communities inhabiting all reef types grouped with each other by 9 months after restoration. Community composition at all habitats became distinctly different to all previous communities (< 51% similarity) at 12 months after restoration, which also coincided with the salinity minimum (5.1) of the study period. By 12 months after restoration, communities on both restored habitats were much more similar to each other than that of the unrestored control habitat, which was least similar to any other community in the study period (11% similar). Differences in community composition between reef mounds and reef flats throughout the study period were driven primarily by higher densities of the gastropods P. ostreicola and Boonea impressa in reef flats (mean dissimilarities [diss.] of 4.06 and 3.09) and higher densities of the crab E. depressus in reef mounds (mean diss. of 2.85; Supplementary Table S6). Differences between reef flats and unrestored control areas were driven primarily by higher densities of the crab E. turgidis and gastropod F. dianthophila in reef flats (mean diss. of 4.08 and 3.25). Higher gastropod densities in reef flats and unrestored control areas contributed to differences from reef mounds.
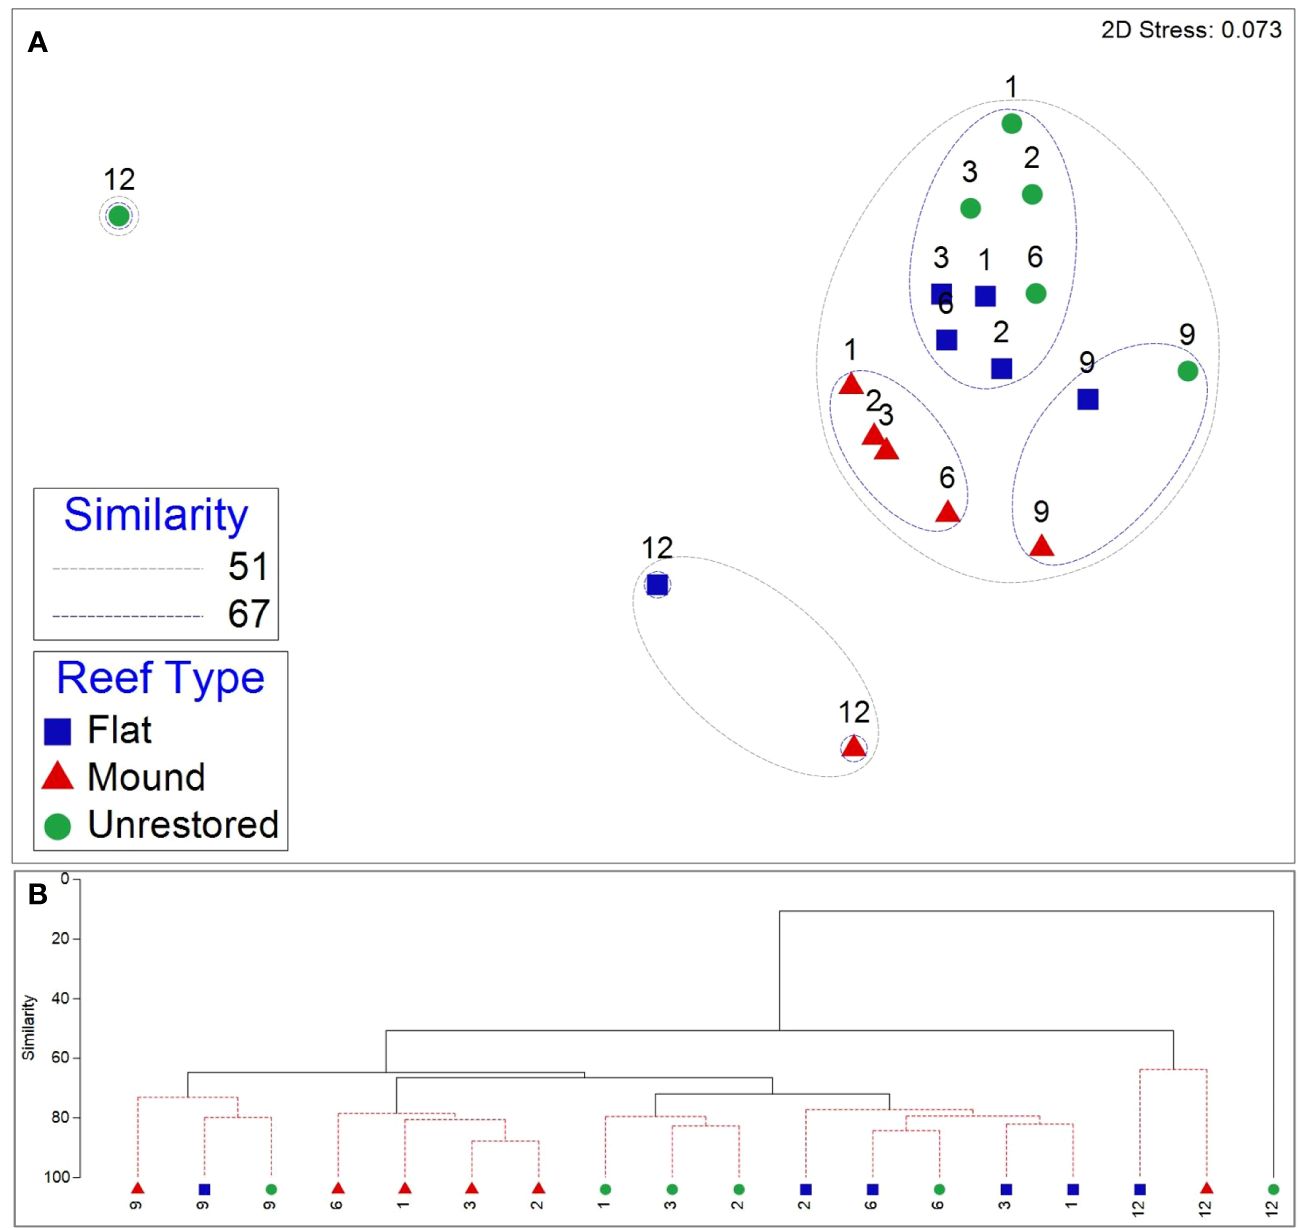
Figure 6 Nonmetric multidimensional scaling (nMDS) plot (A) overlaid with similarity contours from cluster analysis (B) of epifauna community composition from September 2020 (1 month after restoration) to August 2021 (12 months after restoration) at reef mounds, reef flats, and unrestored control areas. The numbers above the symbols indicate the number of months after restoration.
4 Discussion
Given limited funds for construction of restored oyster reefs, it is important to understand the suite of ecosystem services enhanced by restored reefs relative to an unrestored control, and the differences in services provided by different reef designs (e.g., continuous low-relief versus discrete high-relief reefs). Both oyster densities and epifaunal density, biomass and diversity were enhanced in restored reef relative to the unrestored control area in our study area. Although the construction cost for reef mounds in this study was slightly higher (17%) than for reef flats, reef mounds supported higher on-reef epifaunal and oyster densities than on reef flats (Table 1). Within one year after construction, reef mounds produced 1.7x the on-reef oyster density, 3.0x the motile epifauna biomass, and 4.6x the epifauna density per square meter of reef than reef flats. However, oyster densities of larger areas of continuous reef flats were 3x that of areas of discrete reef mounds (including spacing in between mounds) in both per unit area, and per volume of cobble used in restoration.
Designing reefs to maximize oyster densities is an important component of restoration planning. On-reef oyster density on high relief reef mounds quickly exceeded that on reef flats (after 1 month) and was ~ 2x higher 18 months after construction and remained ~1.5x higher by the end of the study, corroborating results from previous studies showing rapid development of oysters on high relief reefs (Lenihan and Peterson 1999; Schulte et al., 2009; De Santiago et al., 2019), and the influence of reef height on oyster population persistence (Colden et al., 2017). Motile epifauna density on reef mounds also exceeded that on reef flats, but it took longer to see a measurable difference (i.e., ~4.6x after 12 months), perhaps related to slower establishment and stability of reef structural complexity (Grabowski and Powers, 2004). A number of factors may have influenced development of oysters and epifauna on the different reef types, including differences in sediment deposition, exposure to bottom water hypoxia, accessibility of attachment surfaces and interstitial spaces, and predator-prey dynamics (Galtsoff, 1964; McKinney and Case, 1973; MacKenzie, 1983; Baker and Mann, 1992; Humphries et al., 2011).
Infection and subsequent mortality of oysters by the protozoan parasite, P. marinus, further influences oyster densities and survival (Andrews and Ray, 1988; Soniat et al., 2012). There was little difference in infection characteristics among the mound and flat restored reefs, and the unrestored control area. However, the similar temporal variation in infection throughout the restored reef complex indicates that the environmental conditions that influence P. marinus infection were similar among reef types. Perkinsus marinus is most prevalent in warm, high salinity waters (Andrews and Ray, 1988) with infection intensities decreasing during periods of low salinity (La Peyre et al., 2009). Prolonged periods of low salinity within the Mission Aransas Estuary have previously been linked with reductions in P. marinus infection presence and severity (Beseres Pollack et al., 2011). Low disease prevalence, particularly in the first year following reef construction, may have allowed for increased survival of oysters and steady increase in observed oyster densities and sizes for one year following restoration. Although P. marinus was present at every sampling date on the natural reef, infections can spread very slowly from reef to reef and local variations in prevalence and severity are well documented (Mackin, 1962; Soniat, 1985; Craig et al., 1989). Weighted prevalence across reef mounds, reef flats, and unrestored controls remained low (< 1) throughout the majority of the study, even when prevalence was high (100%). Previous modeling work indicates that for oysters at high population densities, like those found on the restored reef, foraging interference may deplete P. marinus parasites in the water column and effectively reduce per capita exposure (Bidegain et al., 2017). Because August 2023 was the final sampling date, additional research is needed to better understand how these low-severity but high prevalence infections develop among reef types and how they may impact long-term (>5 y) oyster densities and mortality.
Decapod crustacean abundance estimates in the current study were ~20x higher than reported by previous studies of Gulf of Mexico oyster reefs and were dominated by porcelain crabs on reef mounds and reef flats instead of the typically dominant panopeid mud crabs (reported as xanthid mud crabs; Zimmerman et al., 1989; Plunket and La Peyre, 2005). Panopeid mud crabs have a reported association with shell substrate (Day and Lawton, 1988; Plunket and La Peyre, 2005) and have been documented to occur at relatively lower densities on limestone cobble (Graham et al., 2017). However, mud crab densities on reef mounds and reef flats in the current study still exceeded densities reported in previous studies (Day and Lawton, 1988; Plunket and La Peyre, 2005; ~6x higher and ~1.8x higher respectively). Mud crab densities were also higher on both restored reef types compared to the unrestored control areas, highlighting the importance of substrate provision in enhancing faunal abundance. Indeed, regardless of reef style, provision of substrate increased oyster density and epifauna density (56.2x on reef mounds; 12.2x on reef flats) compared to unrestored control areas, plausibly through facilitation of larval recruitment and growth of oysters (Rothschild et al., 1994; Lenihan and Peterson, 1998; George et al., 2015; Graham et al., 2017; Blomberg et al., 2018a; De Santiago et al., 2019). Increases in epifauna densities are also likely related to increases in habitat complexity. Increases in complexity metrics, such as rugosity and oyster reef volume, have been demonstrated to enhance macrofauna populations in oyster reefs (Karp et al., 2018). An increase in habitat complexity provides additional structured habitat to reef residents such as grass shrimp, small bivalves, and benthic fish, which provides concentrated areas of food sources to crabs (Dame and Patten, 1981; Plunket and La Peyre, 2005).
The observed increase in on-reef oyster densities on reef mounds compared to reef flats is important because of positive effects on reproduction and local population dynamics. Higher densities of oysters can produce a greater number of larvae to recruit (and self-recruit) to the reef, supporting long-term reef sustainability (Schulte and Burke, 2014). A higher supply of larvae may also help replenish oyster populations to a greater extent following disturbances such as dredging or hypoxia than on reefs with a lower larvae supply (Lenihan and Peterson, 1998). In combination with reef height, higher larval supply can help overcome the effects of sedimentation that can degrade reef quality and impede reef development (Lipcius et al., 2021). Although sedimentation was not quantified at Grass Islands Reef, the relatively higher oyster densities on reef mounds support previous work (e.g., Schulte et al., 2009) indicating that high relief restoration designs provide a promising strategy for enhancing reef persistence.
Although on-reef oyster densities were higher on reef mounds than reef flats, conversely (and unexpectedly), the total restored oyster areal density across each restored reef complex and the per volume of substrate were larger on reef flats compared than reef mounds. Within a 0.2-ha subunit, individual mounds were constructed with 3 m spacing, creating unrestored spaces between each mound and reducing the total areal density of oysters for reef mounds. In contrast, for reef flats cobble is continuously distributed across the entire 0.2-ha subunit, resulting in a larger overall footprint of substratum and a higher total areal density of oysters. In calculating the restored oyster areal density across subunits, it was assumed that no oysters were present in the spaces between reef mounds due to absence of substratum. However, based on diver observations following restoration, cobble may fall from the reef mounds into the unrestored spaces and sustain oysters. Therefore, the calculated restored oyster areal densities across subunits of reef mounds are likely underestimates. Further, because cobble was piled in discrete vertical mounds rather than spread continuously, substratum on the interior of reef mounds was not available for larval attachment, reducing the density of oysters per volume of substratum compared to reef flats. Taken together, reef mounds may be a better design choice for restoration projects seeking to maximize on-reef oyster densities, facilitate reef persistence, and avoid issues such as sedimentation and hypoxia (Lenihan and Peterson, 1998; Powers et al., 2009), whereas reef flats may be more suitable for projects seeking to maximize the total number of oysters per area restored or volume of substratum, for example to support harvests. Recognizing the benefits and tradeoffs among different restoration designs can help resource managers utilize a given amount of substratum more efficiently and effectively to achieve desired restoration goals.
5 Conclusion
Resource managers have much to consider when determining how to use limited funds to design and construct oyster reefs that will maximize identified project goals. In this study, we provide information on how habitat provision for oysters and fauna can differ between high versus low relief restoration designs, and infection by P. marinus remains largely unaffected by these reef designs. Both reef mounds and reef flats increased oyster densities and motile epifauna biomass compared to unrestored areas. On-reef oyster densities were greater on higher relief reef mounds than lower-relief reef flats. However, the restored complex comprised of continuous low relief reef yielded greater total oyster densities than the restored reef complex comprised of discrete high relief reef mounds using a similar volume of cultch over the same area. Overall, project results indicate that one-size-fits-all does not apply when it comes to selecting restoration designs to meet specific project goals. Restoring high relief reefs increased oyster and faunal densities, which would better achieve goals for enhanced on-reef habitat provision, whereas restoring low relief reefs maximized the total number of oysters per area and per volume of substratum, which would better achieve goals of enhancing harvests.
Data availability statement
The datasets generated in this study are available from the Gulf of Mexico Research Initiative Information and Data Cooperative (GRIIDC) data repository (https://doi.org/10.7266/dqnde5q5).
Ethics statement
The animal study was reviewed and approved by the Institutional Animal Care and Use Committee of Texas A&M University-Corpus Christi (IACUC Number: TAMU-CC-IACUC-2023-0013). The study was conducted in accordance with the local legislation and institutional requirements.
Author contributions
JP: Conceptualization, Funding acquisition, Methodology, Project administration, Resources, Supervision, Validation, Writing – review & editing. MS: Formal analysis, Investigation, Visualization, Writing – original draft, Writing – review & editing. NB: Conceptualization, Investigation, Methodology, Writing – review & editing. ST: Formal analysis, Writing – review & editing. TP: Conceptualization, Investigation, Methodology, Writing – review & editing, Data curation, Formal analysis, Validation, Visualization.
Funding
The author(s) declare financial support was received for the research, authorship, and/or publication of this article. This paper was partially funded by financial assistance provided by the Coastal Zone Management Act of 1972, as amended, administered by the National Oceanic and Atmospheric Administration (NOAA), Office for Coastal Management, pursuant to NOAA Award No. NA20NOS4190184. The views expressed herein are those of the author(s) and do not necessarily reflect the views of NOAA, the U.S. Department of Commerce, or any of their subagencies. This publication was also made possible by the NOAA, Office of Education Educational Partnership Program awards (NA21SEC4810004 and NA16SEC4810009). Its contents are solely the responsibility of the award recipient and do not necessarily represent the official views of the U.S. Department of Commerce, NOAA. Any opinions, findings, conclusions, or recommendations expressed in this publication are those of the author(s) and do not necessarily reflect the view of the U.S. Department of Commerce, NOAA. We would also like to acknowledge financial support from the Crutchfield Fellowship Fund, the William and Lyell Snyder Memorial Endowed Scholarship in Marine Science, and The Next Swell Marine Conservation Scholarship.
Acknowledgments
Thank you to Dr. Emma Clarkson from the Texas Parks and Wildlife Department for information on restoration designs used at Grass Islands Reef and to Dr. Kim Withers for her feedback on an earlier version of the manuscript. Thank you also to researchers and students from the Coastal Conservation and Restoration Lab at the Harte Research Institute for their assistance with field and laboratory work, especially Daphne White. We appreciate the constructive criticisms of two reviewers who assisted in improving this manuscript.
Conflict of interest
The authors declare that the research was conducted in the absence of any commercial or financial relationships that could be construed as a potential conflict of interest.
Publisher’s note
All claims expressed in this article are solely those of the authors and do not necessarily represent those of their affiliated organizations, or those of the publisher, the editors and the reviewers. Any product that may be evaluated in this article, or claim that may be made by its manufacturer, is not guaranteed or endorsed by the publisher.
Supplementary material
The Supplementary Material for this article can be found online at: https://www.frontiersin.org/articles/10.3389/fmars.2024.1385866/full#supplementary-material
References
Andrews J. D., Ray S. M. (1988). Management strategies to control the disease caused by Perkinsus marinus. Am. Fish. Soc Special. Publ. 18, 257–264.
Armstrong N. E. (1987). The ecology of Open-bay Bottoms of Texas: A Community Profile (U.S. Department of the Interior, Fish and Wildlife Service, Research and Development, National Wetlands Research Center).
Baker S. M., Mann R. (1992). Effects of hypoxia and anoxia on larval settlement, juvenile growth, and juvenile survival of the oyster Crassostrea virginica. Biol. Bull. 182, 265–269. doi: 10.2307/1542120
Bersoza Hernández A., Brumbaugh R. D., Frederick P., Grizzle R., Luckenbach M. W., Peterson C. H., et al. (2018). Restoring the eastern oyster: how much progress has been made in 53 years? Front. Ecol. Environ. 16, 463–471. doi: 10.1002/fee.1935
Beseres Pollack J., Cleveland A., Palmer T. A., Reisinger A. S., Montagna P. A. (2012). A restoration suitability index model for the eastern oyster (Crassostrea virginica) in the Mission-Aransas Estuary, TX, USA. PloS One 7, e40839. doi: 10.1371/journal.pone.0040839
Beseres Pollack J., Kim H.-C., Morgan E. K., Montagna P. A. (2011). Role of flood disturbance in natural oyster (Crassostrea virginica) population maintenance in an estuary in South Texas, USA. Estuaries. Coast. 34, 187–197. doi: 10.1007/s12237-010-9338-6
Beseres Pollack J., Palmer T. A. (2020). Crassostrea virginica dredge efficiency in Texas estuaries. Exp. Results 1, e2. doi: 10.1017/exp.2019.2
Beseres Pollack J., Yoskowitz D., Kim H.-C., Montagna P. A. (2013). Role and value of nitrogen regulation provided by oysters (Crassostrea virginica) in the Mission-Aransas Estuary, Texas, USA. PloS One 8, e65314. doi: 10.1371/journal.pone.0065314
Bidegain G., Powell E. N., Klinck J. M., Hofmann E. E., Ben-Horin T., Bushek D., et al. (2017). Modeling the transmission of Perkinsus marinus in the Eastern oyster Crassostrea virginica. Fish. Res. 186, 82–93. doi: 10.1016/j.fishres.2016.08.006
Blomberg B. N., Lebreton B., Palmer T. A., Guillou G., Beseres Pollack J., Montagna P. A. (2017). Does reef structure affect oyster food resources? A stable isotope assessment. Mar. Environ. Res. 127, 32–40. doi: 10.1016/j.marenvres.2017.03.003
Blomberg B. N., Palmer T. A., Montagna P. A., Beseres Pollack J. (2018a). Habitat assessment of a restored oyster reef in South Texas. Ecol. Eng. 122, 48–61. doi: 10.1016/j.ecoleng.2018.07.012
Blomberg B. N., Pollack J. B., Montagna P. A., Yoskowitz D. W. (2018b). Evaluating the U.S. Estuary Restoration Act to inform restoration policy implementation: A case study focusing on oyster reef projects. Mar. Policy 91, 161–166. doi: 10.1016/j.marpol.2018.02.014
Breitburg D. L., Coen L. D., Luckenbach M. W., Mann R., Posey M., Wesson J. A. (2000). Oyster reef restoration: convergence of harvest and conservation strategies. J. Shellfish. Res. 19, 371–377.
Clarke K. R., Gorley R. N. (2015). Getting started with PRIMER v7. PRIMER-E.: Plymouth. Plymouth. Mar. Lab. 20.
Clarke K. R., Sommerfield P. J., Gorley R. N. (2008). Testing of null hypotheses in exploratory community analyses: Similarity profiles and biota-environmental linkage. J. Exp. Mar. Biol. Ecol. 366, 56–69. doi: 10.1016/j.jembe.2008.07.009
Clarke K. R., Warwick R. M. (1994). Similarity-based testing for community pattern: the two-way layout with no replication. Mar. Biol. 118, 167–176. doi: 10.1007/BF00699231
Colden A. M., Latour R. J., Lipcius R. N. (2017). Reef height drives threshold dynamics of restored oyster reefs. Mar. Ecol. Prog. Ser. 582, 1–13. doi: 10.3354/meps12362
Craig A., Powell E. N., Fay R. R., Brooks J. M. (1989). Distribution of Perkinsus marinus in Gulf Coast oyster populations. Estuaries 12, 82–91. doi: 10.2307/1351499
Cuddington K., Byers J. E., Wilson W. G., Hastings A. (2011). Ecosystem Engineers: Plants to Protists (Elsevier Science).
Dame R. F., Patten B. C. (1981). Analysis of energy flows in an intertidal oyster reef. Mar. Ecol. Prog. Ser. 5, 115–124. doi: 10.3354/meps005115
Day E. A., Lawton P. (1988). Mud crab (Crustacea: Brachyura: Xanthidae) substrate preference and activity. J. Shellfish. Res. 7, 421–426.
De Santiago K., Palmer T. A., Dumesnil M., Pollack J. B. (2019). Rapid development of a restored oyster reef facilitates habitat provision for estuarine fauna. Restor. Ecol. 27, 870–880. doi: 10.1111/rec.12921
Galtsoff P. S. (1964). The American Oyster, Crassostrea Virginica (Gmelin) (Washington, D.C., USA: US Fish and Wildlife Service: U.S. Government Printing Office).
George L. M., De Santiago K., Palmer T. A., Beseres Pollack J. (2015). Oyster reef restoration: effect of alternative substrates on oyster recruitment and nekton habitat use. J. Coast. Conserv. 19, 13–22. doi: 10.1007/s11852-014-0351-y
Grabowski J. H., Peterson C. H. (2007). Restoring oyster reefs to recover ecosystem services. Ecosyst. Engineers.: Plants to. Protists. 4, 281–298.
Grabowski J. H., Powers S. P. (2004). Habitat complexity mitigates trophic transfer on oyster reefs. Mar. Ecol. Prog. Ser. 277, 291–295. doi: 10.3354/meps277291
Graham P. M., Palmer T. A., Beseres Pollack J. (2017). Oyster reef restoration: substrate suitability may depend on specific restoration goals. Restor. Ecol. 25, 459–470. doi: 10.1111/rec.12449
Gregalis K. C., Johnson M. W., Powers S. P. (2009). Restored oyster reef location and design affect responses of resident and transient fish, crab, and shellfish species in mobile bay, Alabama. Trans. Am. Fish. 138, 314–327. doi: 10.1577/T08-041.1
Harwell H. D., Posey M. H., Alphin T. D. (2011). Landscape aspects of oyster reefs: Effects of fragmentation on habitat utilization. J. Exp. Mar. Bio. Ecol. 409, 30–41. doi: 10.1016/j.jembe.2011.07.036
Hemraj D. A., Bishop M. J., Hancock B., Minuti J. J., Rusell B. D. (2022). Oyster reef restoration fails to recoup global historic ecosystem losses despite substantial biodiversity gain. Sci. Adv. 8, eabp8747. doi: 10.1126/sciadv.abp8747
Hogan S., Reidenbach M. (2022). Quantifying tradeoffs in ecosystem services under various oyster reef restoration designs. Estuar. Coasts. 45, 677–690. doi: 10.1007/s12237-021-01010-4
Howie A. H., Bishop M. J. (2021). Contemporary oyster reef restoration: responding to a changing world. Front. Ecol. Evol. 9. doi: 10.3389/fevo.2021.689915
Humphries A. T., Peyre M. K. L., Decossas G. A. (2011). The effect of structural complexity, prey density, and “predator-free space” on prey survivorship at created oyster reef mesocosms. PloS One 6, e28339. doi: 10.1371/journal.pone.0028339
Jackson J. B. C. (2008). Ecological extinction and evolution in the brave new ocean. Proc. Natl. Acad. Sci. 105, 11458–11465. doi: 10.1073/pnas.0802812105
Jordan-Cooley W. C., Lipcius R. N., Shaw L. B., Shen J., Shi J. (2011). Bistability in a differential equation model of oyster reef height and sediment accumulation. J. Theor. Biol. 289, 1–11. doi: 10.1016/j.jtbi.2011.08.013
Karp M. A., Seitz R. D., Fabrizio M. C. (2018). Faunal communities on restored oyster reefs: effects of habitat complexity and environmental conditions. Mar. Ecol. Prog. Ser. 590, 35–51. doi: 10.3354/meps12470
Kasperski S., Wieland R. (2009). When is it optimal to delay harvesting? The role of ecological services in the Northern Chesapeake Bay oyster fishery. Mar. Resour. Econ. 24, 361–385. doi: 10.1086/mre.24.4.42629662
Kirby M. X. (2004). Fishing down the coast: Historical expansion and collapse of oyster fisheries along continental margins. in. Proc. Natl. Acad. Sci. U.S.A. 101, 13096–13099. doi: 10.1073/pnas.0405150101
Lai Q. T., Irwin E. R., Zhang Y. (2020). Quantifying harvestable fish and crustacean production and associated economic values provided by oyster reefs. Ocean. Coast. Manage. 187, 105104. doi: 10.1016/j.ocecoaman.2020.105104
La Peyre M. K., Gossman B., La Peyre J. F. (2009). Defining optimal freshwater flow for oyster production: effects of freshet rate and magnitude of change and duration on eastern oysters and Perkinsus marinus infection. Estuaries. Coast. 32, 522–534. doi: 10.1007/s12237-009-9149-9
La Peyre M. K., Marshall D. A., Buie S. C. L., Hijuelos A., Steyer G. D. (2022). Are we falling short on restoring oysters at a regional scale? Environ. Manage 70, 581–592. doi: 10.1007/s00267–022-01691-y
Lenihan H. S. (1999). Physical–biological coupling on oyster reefs: how habitat structure influences individual performance. Ecol. Monogr. 69, 251–275. doi: 10.1890/0012–9615(1999)069[0251:PBCOOR]2.0.CO;2
Lenihan H. S., Peterson C. H. (1998). How habitat degradation through fishery disturbance enhances impacts of hypoxia on oyster reefs. Ecol. Appl. 8, 128–140. doi: 10.1890/1051-0761(1998)008[0128:HHDTFD]2.0.CO;2
Lipcius R. N., Zhang Y., Zhou J., Shaw L. B., Shi J. (2021). Modeling oyster reef restoration: larval supply and reef geometry jointly determine population resilience and performance. Front. Mar. Sci. 8. doi: 10.3389/fmars.2021.677640
Ludwig J. A., Reynolds J. F. (1988). Statistical Ecology: A Primer on Methods and Computing (New York: John Wiley and Sons), 368 p.
Mackin J. G. (1962). Oyster disease caused by Dermocystidium marinum and other microorganisms in Louisiana. Publ. Inst. Mar. Sci. Univ. Tex. 7, 132–229.
Martinez M. J., Palmer T. A., Breaux N. J., Beseres Pollack J. (2022). Dynamics of restored and natural oyster reefs after a hurricane. Front. Ecol. Evol. 10, 791739. doi: 10.3389/fevo.2022.791739
Martinez-Andrade F. (2018). Trends in relative abundance and size of selected finfishes and shellfishes along the Texas coast: November 1975-December 2016 (Austin, Texas: Texas Parks and Wildlife Department, Coastal Fisheries Division, Management Data Series 293).
McKinney D., Case R. (1973). Effects of siltation on organisms associated with oyster reefs. Environ. Impact. Assess. Shell. Dredging. San. Antonio. Bay. Texas. 5, 124–173.
Newell R. I. E. (1988). “Ecological changes in Chesapeake Bay: are they the result of overharvesting the American oyster, Crassostrea virginica,” in Understanding the Estuary: Advances in Chesapeake Bay Research. Eds. Lynch M. P., Krome E. C., 536–546.
Peters J. W., Eggleston D. B., Puckett B. J., Theuerkauf S. J. (2017). Oyster demographics in harvested reefs vs. no-take reserves: Implications for larval spillover and restoration success. Front. Mar. Sci. 4, 326.
Peterson C. H., Grabowski J. H., Powers S. P. (2003). Estimated enhancement of fish production resulting from restoring oyster reef habitat: quantitative valuation. Mar. Ecol. Prog. Ser. 264, 249–264. doi: 10.3354/meps264249
Peterson C. H., Lipcius R. N. (2003). Conceptual progress towards predicting quantitative ecosystem benefits of ecological restorations. Mar. Ecol. Prog. Ser. 264, 297–307. doi: 10.3354/meps264297
Plunket J., La Peyre M. (2005). Oyster beds as fish and macroinvertebrate habitat in Barataria Bay, Louisiana. Bull. Mar. Sci. 77, 155–164.
Powell E., Klinck J., Ashton-Alcox K., Hofmann E., Morson J. (2012). The rise and fall of Crassostrea virginica oyster reefs: The role of disease and fishing in their demise and a vignette on their management. J. Mar. Res. 70, 505–558. doi: 10.1357/002224012802851878
Powell E., Klinck J., Hofmann E. (1996). Modeling diseased oyster populations. II. Triggering mechanisms for Perkinsus marinus epizootics. J. Shellfish. Res. 15, 141–165.
Powers S. P., Peterson C. H., Grabowski J. H., Lenihan H. S. (2009). Success of constructed oyster reefs in no-harvest sanctuaries: implications for restoration. Mar. Ecol. Prog. Ser. 389, 159–170. doi: 10.3354/meps08164
Ray S. M. (1966). A review of the culture method for detecting Dermocystidium marinum with suggested modifications and precautions. Proc. Natl. Shellfish. Assoc. 54, 55–69.
Rezek R. J., Lebreton B., Roark E. B., Palmer T. A., Pollack J. B. (2017). How does a restored oyster reef develop? An assessment based on stable isotopes and community metrics. Mar. Biol. 164, 54. doi: 10.1007/s00227-017-3084-2
Rothschild B. J., Ault J. S., Goulletquer P., Héral M. (1994). Decline of the Chesapeake Bay oyster population: a century of habitat destruction and overfishing. Mar. Ecol. Prog. Ser. 111, 29–39. doi: 10.3354/meps111029
Schulte D. M., Burke R. P. (2014). Recruitment enhancement as an indicator of oyster restoration success in Chesapeake Bay. Ecol. Res. 32, 434–440. doi: 10.3368/er.32.4.434
Schulte D. M., Burke R. P., Lipcius R. N. (2009). Unprecedented restoration of a native oyster metapopulation. Science 325, 1124–1128. doi: 10.1126/science.1176516
Solis R. S., Powell G. L. (1999). ““Hydrography, mixing characteristics, and residence times of Gulf of Mexico Estuaries,” in Biogeochemistry of Gulf of MEXICO Estuaries (John Wiley and Sons, New York), 29–61.
Soniat T. M. (1985). Changes in levels of infection of oysters by Perkinsus marinus, with special references to the interaction of temperature and salinity upon parasitism. Northeast Gulf. Sci. 7, 171–174. doi: 10.18785/negs.0702.08
Soniat T. M., Klinck J. M., Powell E. N., Hofmann E. E. (2012). understanding the success and failure of oyster populations: Periodicities of Perkinsus marinus, and oyster recruitment, mortality, and size. J. Shellfish. Res. 31, 635–646. doi: 10.2983/035.031.0307
Tolley S. G., Volety A. K. (2005). The role of oysters in habitat use of oyster reefs by resident fishes and decapod crustaceans. J. Shellfish. Res. 24, 1007–1012. doi: 10.2983/0730–8000(2005)24[1007:TROOIH]2.0.CO;2
Zimmerman R. J., Minello T. J., Baumer T., Castiglione M. (1989). Oyster reef as habitat for estuarine macrofauna. NOAA. Tech. Memo. NMFS-SEFC. 249, 16.
zu Ermgassen P. S. E., Grabowski J. H., Gair J. R., Powers S. P. (2016). Quantifying fish and mobile invertebrate production from a threatened nursery habitat. J. Appl. Ecol. 53, 596–606. doi: 10.1111/1365-2664.12576
Keywords: Crassostrea virginica, habitat, management, reef-resident fauna, restoration, vertical relief, Texas, USA
Citation: Beseres Pollack J, Sugla M, Breaux NJ, Trackenberg SN and Palmer TA (2024) Reef design influences habitat provision on a restored oyster reef. Front. Mar. Sci. 11:1385866. doi: 10.3389/fmars.2024.1385866
Received: 13 February 2024; Accepted: 15 May 2024;
Published: 30 May 2024.
Edited by:
Stelios Katsanevakis, University of the Aegean, GreeceReviewed by:
Aldo S. Pacheco, Royal Roads University, CanadaChester Zarnoch, Baruch College (CUNY), United States
Copyright © 2024 Beseres Pollack, Sugla, Breaux, Trackenberg and Palmer. This is an open-access article distributed under the terms of the Creative Commons Attribution License (CC BY). The use, distribution or reproduction in other forums is permitted, provided the original author(s) and the copyright owner(s) are credited and that the original publication in this journal is cited, in accordance with accepted academic practice. No use, distribution or reproduction is permitted which does not comply with these terms.
*Correspondence: Jennifer Beseres Pollack, jennifer.pollack@tamucc.edu