Response of river delta hydrological connectivity to changes in river discharge and atmospheric frontal passage
 Sajjad Feizabadi
 Chunyan Li
 Matthew Hiatt
- 1Department of Oceanography and Coastal Sciences, College of the Coast and Environment, Louisiana State University, Baton Rouge, LA, United States
- 2Coastal Studies Institute, Louisiana State University, Baton Rouge, LA, United States
Atmospheric frontal passage is a common meteorological event that can significantly affect hydrodynamics in coastal environments, including the hydrological connectivity between channels and floodplains that regulates material transport in river deltas. This study is focused on the influence of atmospheric cold fronts on the hydrological connectivity between channels and floodplains within the Wax Lake Delta using the Delft3D FM model. The results demonstrate a substantial effect of passing cold fronts on the exchange of water and transport fraction between the primary channels and floodplains. This impact is intricately connected to the morphodynamical characteristics of the floodplains, the intensity of cold fronts, river discharge, Coriolis force, and tidal currents. The passing cold fronts can enhance or reverse the direction of water exchange between channels and floodplains. For floodplains, the passage of cold fronts can lead to an increase in the rate of water exchange by as much as five times. In the WLD, a substantial fraction of water, 39-58%, is flowing through the floodplains to the bay at the delta front influenced by the prevailing discharge, although there is a significant spatial heterogeneity. Passing cold fronts can alter the transport distribution, depending on the phase of the front. An increase in river discharge tends to bolster floodplain connectivity and lessen the effects of cold fronts. Conversely, decreased river discharge results in reduced connectivity and exacerbates the fluctuations induced by cold fronts. Moreover, the findings indicate that from the apex to downstream, the contribution of channels decreases as they become shallower, while the role of the floodplains increases, leading to a less distinct demarcation between channels and floodplains. It has also been noted that an increase in river discharge correlates with an increased contribution from floodplains to transfer water to the bay.
1 Introduction
Hydrological connectivity refers to the water-mediated transport among various components of a landscape (Tetzlaff et al., 2007; Bracken et al., 2013). In river deltas, the concept focuses on the pathways and mechanisms through which water is exchanged or transported primarily between distributary channels and deltaic floodplains (Passalacqua, 2017). Numerous studies have shown that hydrological connectivity regulates landscape evolution, water and material transport, and water quality in river deltas and other water bodies (e.g., Hiatt and Passalacqua, 2015; Coffey and Shaw, 2017; Christensen et al., 2020; Olliver and Edmonds, 2021; Feizabadi et al., 2022b, 2023). The need to understand deltaic hydrological connectivity and its impact on deltaic eco-geomorphology is motivated by the necessity to address challenges associated with the continued loss of coastal wetlands (Engle, 2011; Wu et al., 2017), heightened nutrient loading in receiving waters (Rabalais et al., 2002; Wurtsbaugh et al., 2019), and anthropogenic impacts (Moon et al., 2022; Constantinescu et al., 2023). These challenges are especially pertinent in the Mississippi River Delta in coastal Louisiana, USA, where the average rate of land loss from 1932–2016 exceeds about 57 km2 yr−1 (Couvillion et al., 2017). Since 2007, the Coastal Protection and Restoration Authority (CPRA) has secured $21.4 billion for coastal restoration and risk reduction in Louisiana and estimated that, from 2023, its 50-year Coastal Master Plan will cost $50 billion to address future environmental changes (CPRA, 2023).
Hydrological connectivity is primarily determined through an examination of structural and functional connectivity of the system of interest (Bracken et al., 2013; Wohl et al., 2019). Structural connectivity pertains to the physical interconnections between geographical points within a landscape. In deltaic environments, the configuration of structural connectivity is intricately tied to the bed topography of the delta topset and front (Hiatt and Passalacqua, 2015). Functional connectivity delves into the underlying processes governing the magnitude and direction of fluxes within the hydrological system (Lexartza-Artza and Wainwright, 2009; Wainwright et al., 2011). Within deltaic systems, external influences, such as riverine discharge, tides, winds, waves, seasonal cold fronts, hurricanes, and internal drivers like vegetation can act as determinants of functional connectivity (Hiatt and Passalacqua, 2015).
While previous research has assessed the impacts of river discharge, tides, and vegetation on channel-floodplain hydrological connectivity in river deltas (Hiatt and Passalacqua, 2015; Olliver et al., 2020), there still remains uncertainty as to how atmospheric processes drive connectivity. The coastal Louisiana water is a microtidal system and as such the river discharge has a major role in controlling the overall water level on seasonal time scales. The periodic passages of atmospheric cold fronts are known to generate significant winds that modulate water levels and impact coastal and deltaic circulation patterns (Li, 2013; Huang and Li, 2017; Feizabadi et al., 2023). The cold front wind generates short term effect to the water level (e.g., drying effect post front, Huang et al., 2024). Thus, it follows that cold fronts should drive functional hydrological connectivity in river deltas.
A cold front refers to the transitional zone between two atmospheric air masses with differing densities (Hsu, 1988). In the northern Gulf of Mexico, the regular occurrence of cold front passages is notable from late fall through early spring. Over a 40-year statistical analysis of weather data, it was determined that coastal Louisiana encounters an average of 41 ± 5 cold front passages annually from October through the subsequent April (Li et al., 2020). The pre-frontal phase, occurring approximately 24-48 hours before the frontal passage, is characterized by robust southerly and easterly winds. These winds generate waves and currents that drive water towards the coast, causing water level elevations of more than 0.5 meter above predicted levels (Roberts et al., 1989; Feng and Li, 2010; Li et al., 2011; Feizabadi et al., 2023). This process also leads to the resuspension of sediment from coastal bays and deltaic wetlands. As the cold front progresses through the coastal zone, there is usually a sharp reduction in barometric pressure accompanied by precipitation, and a change in wind direction. This phase is succeeded by the post-front period, marked by a rise in barometric pressure and a decrease in temperature and humidity. During this post-frontal phase, fronts move in three distinct directions: westerly, northerly, and northwesterly. These different directional movements have varied effects on water transport and hydrodynamics in deltaic environments (Hiatt et al., 2019; Feizabadi et al., 2022a). The relatively strong post-front winds play a crucial role in expelling water from coastal bays, inducing a rapid decline in water levels (Feng and Li, 2010). Concurrently, these winds contribute to the transport of suspended sediments (Walker and Hammack, 2000), nutrients, and organic matter from coastal bays, and adjacent wetlands onto the continental shelf of the Gulf of Mexico (Childers and Day, 1990; Perez et al., 2000; Huang and Li, 2017). For example, water and sediment transport processes associated with cold-front passages have been identified as beneficial for accretion along the eastern section of the chenier-plain on the central Louisiana coast (Draut et al., 2005; Jaramillo et al., 2009; Zhang et al., 2022; Feizabadi et al., 2023). Therefore, the incorporation of cold fronts into numerical models designed for morphodynamics and hydrodynamics applications in the northern Gulf of Mexico is essential.
While various studies have explored functional connectivity in deltas linked to drivers such as river discharge, tides, and vegetation (Hiatt and Passalacqua, 2015; Bevington et al., 2017; Hiatt et al., 2018; Christensen et al., 2020; Olliver and Edmonds, 2021), a few have addressed the impact of wind on inundation of deltaic floodplains (e.g., Geleynse et al., 2015; O’Connor and Moffett, 2015) and quantifications of functional connectivity due to periodic wind events like cold fronts remain lacking. In this study, we investigate the functional connectivity between channels and floodplains, focusing on how passing cold fronts affect this connectivity under various river discharge conditions through the assessment of water exchange and transport fraction. The transport fraction is defined as the fraction of river flow crossing the boundary between floodplains and channels.
2 Study area
The Wax Lake Delta (WLD) is a prograding bayhead delta situated in the Atchafalaya Basin (Figure 1) positioned at the end of the Wax Lake Outlet (WLO), a human-constructed fluvial pathway to convey water from the Atchafalaya River, a significant tributary of the Mississippi River, into the Atchafalaya Bay. Atchafalaya Bay is characterized as a shallow and comparatively low-energy basin, featuring an average wave height of around 0.5 m and exhibiting mixed diurnal-semidiurnal tides with a Form number of ~ 1.3 derivable from the spectrum result of Zhang et al. (2022), and an average range of approximately 0.34 m (Rosen and Xu, 2013). The WLO carries an average annual flow rate of 2,500 m3s-1 and peak flows exceeding 5,000 m3s-1 (Hiatt and Passalacqua, 2015). This 22-kilometer-long channel was designed in 1941 with the primary objective of mitigating flood hazards in Morgan City. Since 1960, a subaqueous delta started to develop at the mouth of the WLO. By 1973, this delta had become emergent, with several deltaic islands appearing above the mean low tide level (Roberts et al., 1997). The WLD receives around 30-40% of the complete water and sediment discharge from the Atchafalaya River, making up approximately 10-12% of the total discharge from both the Mississippi and Red Rivers (Allison et al., 2012). Within a coastal wetland system exhibiting some of the most rapid rates of land loss globally, the WLD continues to expand both horizontally and vertically (Day et al., 2000; Olliver and Edmonds, 2017). The WLD experiences areal land growth rates ranging from 1.0 to 3.3 km² year-1, alongside a vertical elevation change rate estimated at 2.7 cm year-1 between 1981 and 1994 (Majersky et al., 1997; Allen et al., 2012). We utilized the WLD as a comprehensive numerical experimental system, strategically chosen to isolate the impacts of various forcing factors. Due to its placement within Atchafalaya Bay, the WLD is a relatively sheltered environment, with relatively low wave actions (Georgiou et al., 2005).
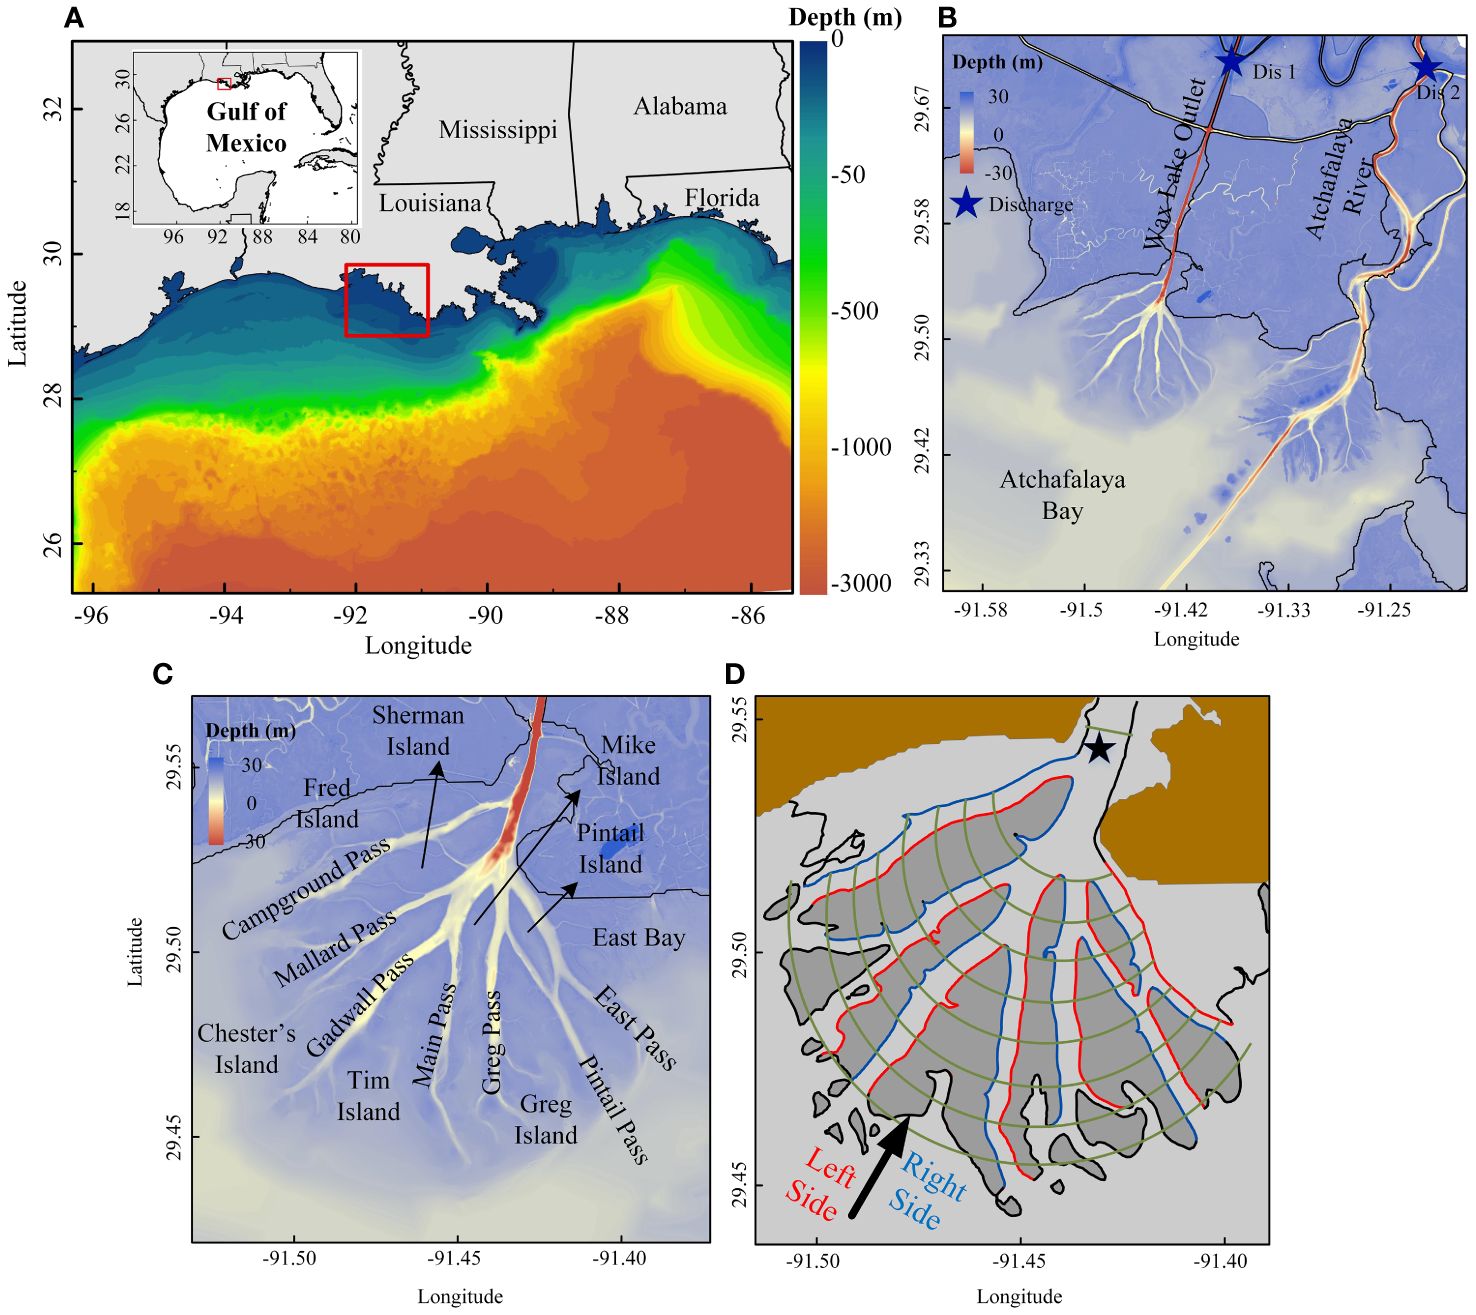
Figure 1 Study site and Wax Lake Delta channels and islands. (A) The bathymetry of northern Gulf of Mexico (negative values are below mean sea level); (B) Zoom in view of the study site and bathymetry, and the location of discharge measurement stations (stars); (C) The names of islands and 8 main channels in the Wax Lake Delta; and (D) Arcs and boundary used in analysis between islands and channels, with the apex point shown by a star.
3 Methods
3.1 Numerical model
This study utilized D-Flow Flexible Mesh (D-Flow FM), which succeeds the structured Delft3D 4 Suite. D-Flow FM is a hydrodynamic and morphodynamic simulation program with multi-dimensional capabilities (1D, 2D, and 3D). It can calculate non-steady flow and transport processes resulting from tidal and meteorological forces, utilizing both structured and unstructured grids (D-Flow FM, 2023). The three-dimensional hydrostatic shallow equations (Equations 1–3), in Cartesian coordinates for horizontal presented and σ-coordinates for vertical dimensions, include the following momentum and continuity equations:
where , , and are the velocity components in the horizontal x, y and vertical σ-directions, respectively. The total water depth, H(x, y), is defined as the sum of d(x, y), the depth below a reference plane, and ζ(x, y), the water level above this plane. Here, t represents time, f is the Coriolis parameter, P stands for pressure, ρ is density, and vV denotes the coefficient of vertical eddy viscosity. Moreover, Sp is identified as the non-local source term associated with precipitation, and SE as the non-local sink term resulting from evaporation. In the momentum equations (Equations 1, 2), the forces Fu and Fv represent the unbalance of horizontal Reynolds stresses.
In the σ-coordinate system, the vertical velocities (ω), are computed from the continuity equation:
by integrating in the vertical from the bottom to a level σ with U and V the depth-averaged velocities. The vertical velocity w in the Cartesian co-ordinate system can be expressed in the horizontal velocities, water depths, water levels and vertical σ-velocities according to Equation 5:
In Equation 4, as defined by Equation 6, Q signifies the per unit area contributions from water discharge or withdrawal, along with precipitation and evaporation:
where qin and qout are the local sources and sinks of water per unit of volume, respectively.
The model uses a horizontal triangle mesh and 10 layers in the vertical, with higher vertical resolution for both the bottom and surface boundary layers (Figure 2). The computational domain for this study encompasses the region extending from the west side of the Mississippi River to southeastern corner of Texas, covering the Louisiana inner shelf and coastal waters that extend offshore to the shelf-break in the south. The model domain consists of 1,542,859 grid cells, with grid sizes varying from 5000 m at offshore boundaries to approximately 30 m within the WLD domain. Ensuring a smooth transition from 5000 m to 30 m is crucial to meet orthogonality and smoothness requirements. The flexible time step is constrained by a maximum Courant number of 0.7. D-Flow-FM offers support for both Chezy and Manning’s n formulations of bottom friction. The Manning’s n bottom friction scheme was chosen due to its capability to yield lower drag coefficients compared to the Chezy formulation, particularly in deep waters. The specific Manning coefficient value used is 0.023 m-1/3s (Shafiei et al., 2022; Feizabadi et al., 2023).
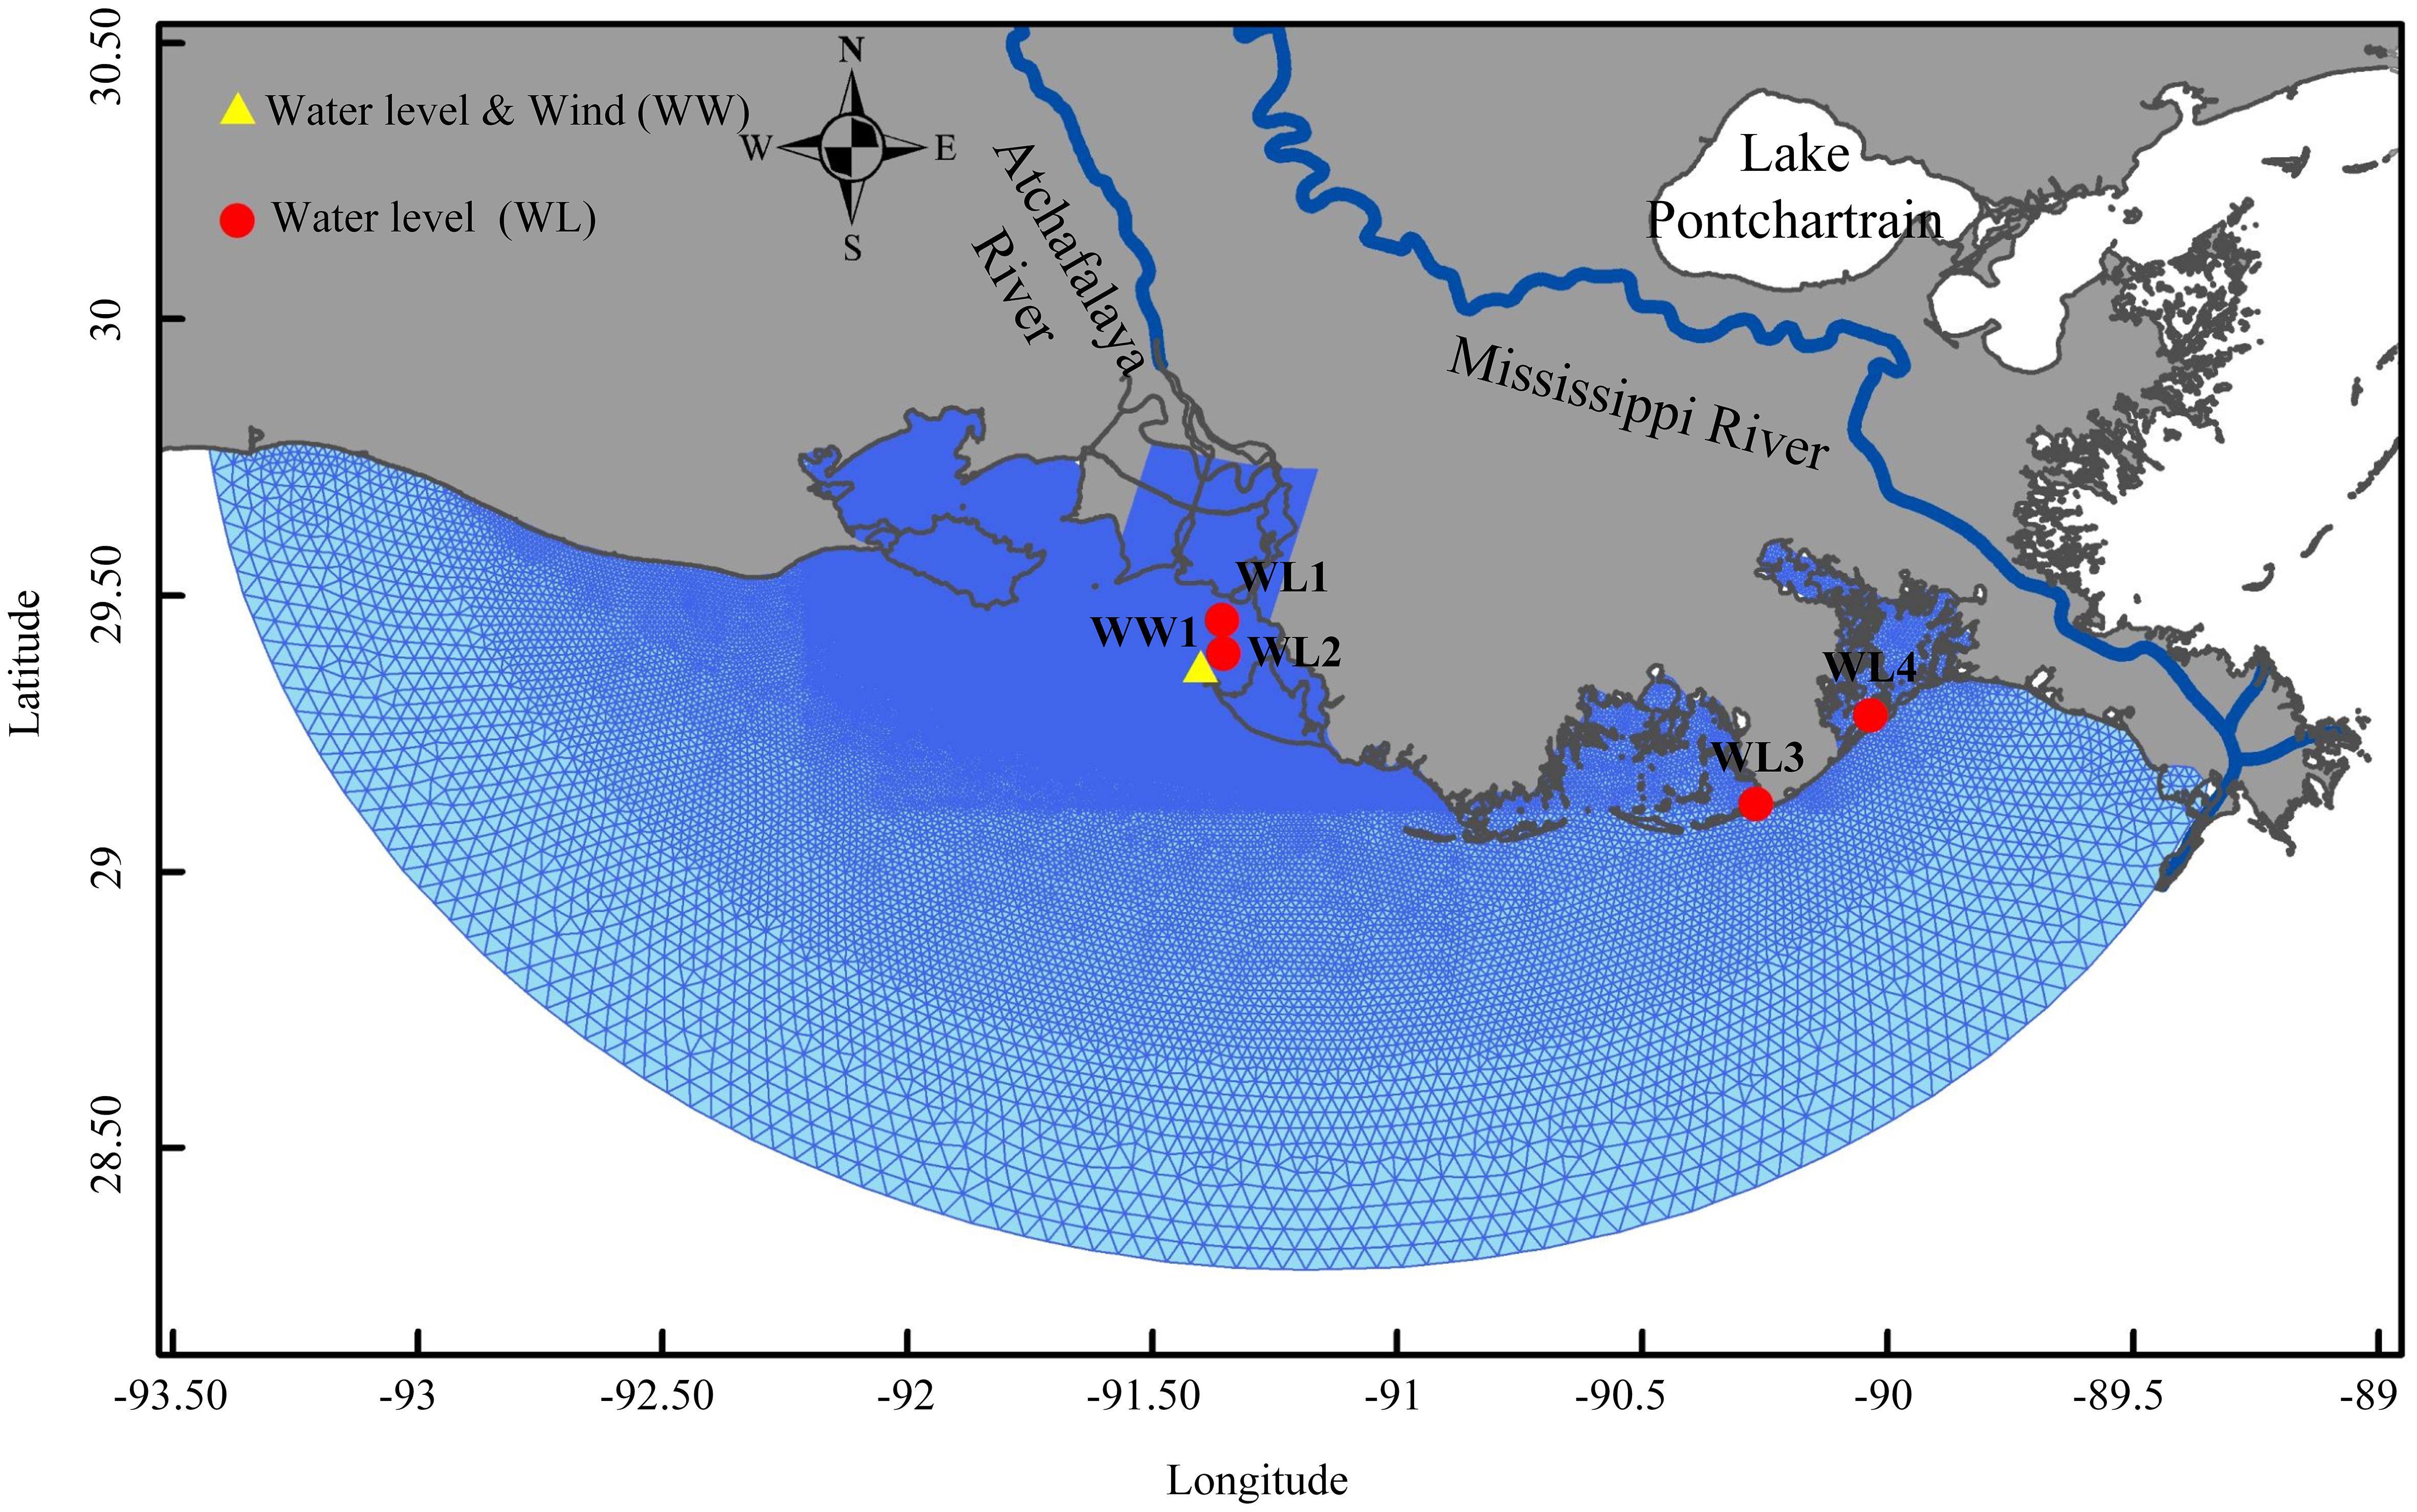
Figure 2 Computational mesh for the model. The stations of observations for water level (WL) and wind & water level (WW) are shown.
3.1.1 Data acquisition
The model is driven by river discharge at the northern boundary, wind on the surface, and tides at the open boundary. The daily river discharge into the WLO and Atchafalaya River is from the USGS monitoring stations, namely the Wax Lake Outlet at Calumet (USGS 07381590) and the Lower Atchafalaya River at Morgan City (USGS 07381600). The surface wind forcing for the model is spatially uniform and temporally variable measured at the Eugene Island (WW1), with 6-min sampling intervals (NOAA, 2023). Since wind speed varies with height and is measured at different heights above the water surface, the wind velocity data is standardized to a standard height of 10 meters above the surface (U10) using the power law approach (Hsu, 1988), as described in Equation 7:
where z is the anemometer height in m, and Uz is the measured wind speed in m/s.
Drag coefficient, Cd, is evaluated by using the empirical formula proposed by Wu (1980, 1994):
The default values for the empirical factors in Equation 8 proposed by Wu (1980, 1994) were Ca = 1.255 × 10⁻³, Cb = 2.425 × 10⁻³, Wa = 7 m/s, and Wb = 25 m/s. The open boundary condition is provided using amplitude and phase information for four diurnal (O1, K1, P1, Q1) and three semi-diurnal tidal constituents (M2, N2, S2) along with the M4 and M6 tidal constituents. These tidal constituents are derived from the US Army Corps of Engineers (USACE) East Coast 2015 computation carried out using ADCIRC 2DDI (Szpilka et al., 2018). The model uses the bathymetric and topographic data for the Atchafalaya/Vermilion Bays and their upstream region, which were obtained in 2016 as part of the NASA-sponsored Delta-X project. The data has a resolution of 10 meters (Denbina et al., 2020). Additionally, the dataset was enriched with offshore information sourced from the National Geophysical Data Center (NGDC), characterized by a resolution of 90 meters (NGDC, 2001).
3.1.2 Model calibration and verification
The hydrodynamic model was run for the period from November 20, 2022, to January 31, 2023. This period was chosen because it was during the cold front season and because of the availability of hydrodynamics data throughout the Bay. A model spin-up period of 10 days was performed from November 20, 2022, to December 1, 2022, and tidal water levels were used as calibration parameters over the period from December 1, 2022, to December 31, 2022. The model’s validation was done by comparing the simulation results with observations for the period between January 1, 2023, and January 31, 2023.
The model’s proficiency in simulating water level distribution was assessed through a comparison with 6-minute water level measurements at five locations within the computational domain (Figure 2). The measurements were from Eugene Island (WW1), LAWMA (WL1), Mouth of Atchafalaya (WL2), Port Fourchon (WL3), and Grand Isle (WL4).
The Skill score, coefficient of determination (R2), and root mean square error (RMSE) were calculated to quantify the model’s overall performance in the entire domain (Equations 9–11). The Skill score was defined as (Willmott, 1981):
where miand oi are i th predicted and observed values, respectively, oi is the mean observed value, and N is the total number of data points.
The root mean squared error (RMSE) was defined as:
The coefficient of determination, which quantifies the matching between observed and modeled data, was defined as:
Table 1 contains a summary of model coefficient of determination, skill score, and RMSE of water levels for the calibration and validation periods. During the validation period, the skill scores range between 0.92 and 0.95, signifying an acceptable agreement between the simulated and observed water levels. This conclusion is further corroborated by the low RMSE values and a high coefficient of determination. Specifically, the error indices computed for the validation period reflect the accuracy of the model in simulating the hydrodynamics.
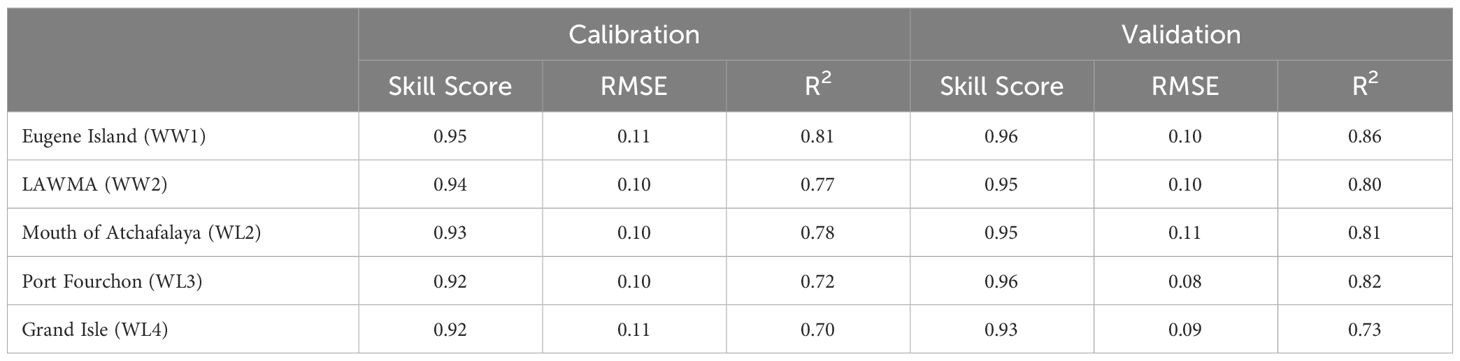
Table 1 Statistics of the model-data comparison in water elevation (m).
The evaluation of simulated water level time series against field measurements at stations throughout the timeframe encompassing December 2022 to January 2023 illustrates a level of accuracy deemed satisfactory within the model (Figure 3).
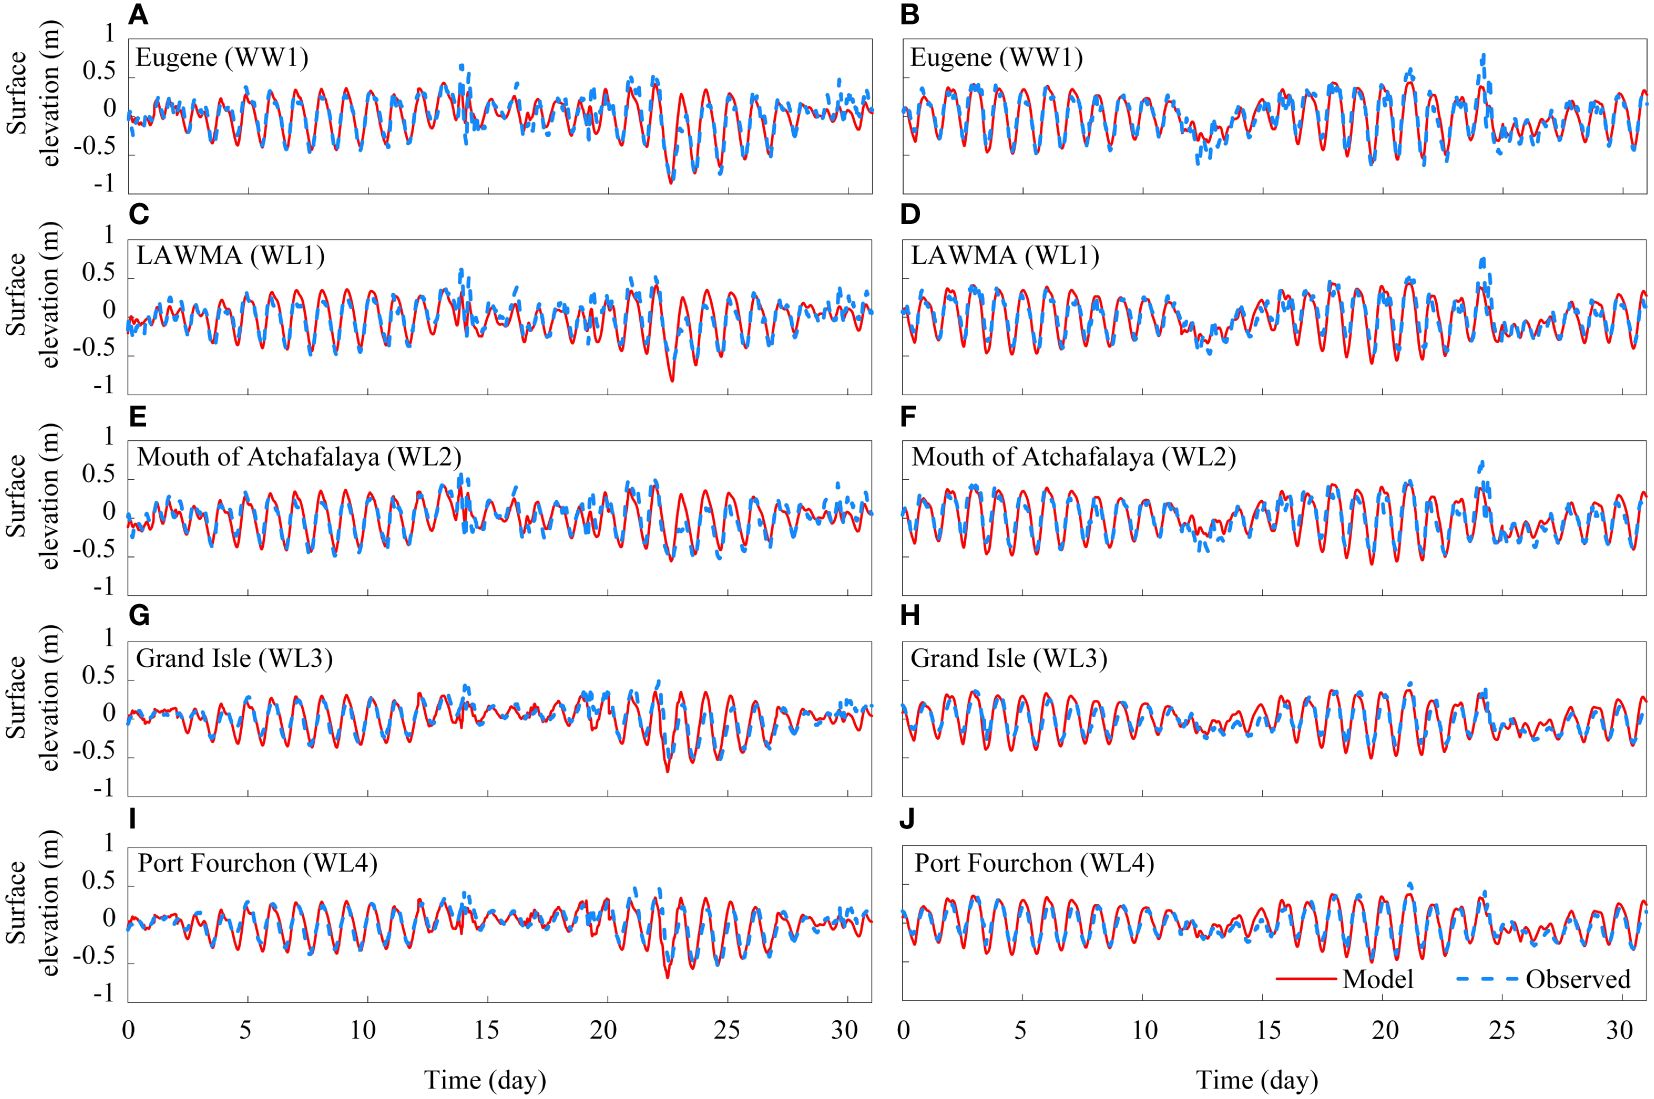
Figure 3 Model-data comparison. Modeled and measured water level elevation at Eugene (A, B), LAWMA (C, D), Mouth of Atchafalaya (E, F), Grand Isle (G, H), and Port Fourchon (I, J) stations. The left and right panels correspond to the calibration and validation, respectively.
3.2 Channel-floodplain exchange and transport fraction
This study is dedicated to investigating hydrological connectivity within the WLD, with an emphasis on channel-floodplain water exchange, transport fraction, and the contribution of channels and floodplains to water transport. The discrimination between primary channels and submerged floodplains is established through the application of a sediment surface elevation threshold set at −0.75 m NAVD88 (Figure 1C). The employment of this specific threshold, though somewhat subjective, defines a boundary between channels and floodplains and facilitates an in-depth analysis of the effect of bathymetry. This approach contributes to a nuanced comprehension of the intricate interactions governing the channel-floodplain system. The study seeks to advance current understanding by exploring the morphological distinctions and the functional aspects of hydrological connectivity between channels and floodplains.
The channel-floodplain exchange is characterized by the movement of water across the boundary between channels and floodplains. The quantification of net channel-floodplain exchange involves computing the average water transport (m³/s) from the channels to the floodplains (for convenience of discussion, we define this as positive exchange), and conversely, from the floodplains to the channels (negative exchange) at a given time. This calculation provides a measure of the bidirectional flow dynamics between channels and floodplains.
The transport fraction is defined by Equation 12 as the ratio between the integrated water transport (m³/s) across the boundary of fluvial channels and floodplains, and the total upstream main channel discharge entering the delta through the apex:
where is the horizontal velocity component perpendicular to the boundary of fluvial channels and floodplains, as shown in Figure 1D. The water depth is represented by H, ζ is the surface elevation, L is the width of the cross-section, and Qc represents the upstream channel discharge (m³/s). In other words, the transport fraction signifies the portion of WLO discharge that is transferred between floodplains and channels, serving as the primary source for sediment and nutrient transport in the WLD.
This quantity is positive when the transport is from channel to floodplain and negative if the transport is from floodplain to channel. To examine the subtidal water transport, a sixth-order Butterworth low-pass filter, characterized by a cutoff frequency of 0.6 cycles per day, is applied.
To quantify the contribution of channels and floodplains to the transport of water in WLD, discharges are calculated across ten arcs drawn at one-kilometer intervals, commencing from a point about 3 km from the delta apex to the delta front (Figure 1C). Arcs intersecting the pre-established boundaries between fluvial channels and floodplains serve as the basis for defining channel segments and floodplain segments. A channel segment is defined as the section of an arc that lies between two channel boundaries, while a floodplain segment is defined as the section of the arc located between two floodplain boundaries.
The Water Transport Contribution (WTC) for each of these segments, as defined by Equation 13, is as follows:
where QCi is the transport within each channel segment and QIj represents the transport through each floodplain segment, each corresponding to a segment of an arc. The i, indicating the number of channels in each arc, varies from 3 channels at the initial curve boundary located 3 km from the apex to 7 channels at the last boundary, 10 km from the apex. Similarly, j, which denotes the number of floodplains, changes between 2 and 7 from the upstream end outward (Figure 1C). For any arc, the sum of the WTC of the channel and floodplain segments is 100%.
The WLD comprises seven primary channels and eight floodplains, with six of the floodplains bordered by channels on both the left and right sides. Although these areas are technically characterized as deltaic floodplains in geological terms, they are colloquially referred to as islands in some publications, with names like Mike Island and Tim Island. For clarity and distinction, the two boundaries between the channels and floodplains have been demarcated as right side and left side. These are depicted in Figure 1D using blue and red at the boundary of the floodplains, respectively. This classification is informed by the direction of movement along floodplains and channels, from downstream to upstream (facing land).
Throughout the simulation period, eight distinct cold front events occurred, traversing the WLD (Table 2). The determination of the cold fronts’ timing was based on their entry and exit from the state of Louisiana as in Huang and Li (2017), using 3-hour surface analysis maps sourced from NOAA’s Hydrometeorological Prediction Center (HPC, 2023). The results of the simulation are discussed and presented in the following sections.

Table 2 Summary of cold front scenarios for numerical simulations.
4 Results
4.1 Water exchange
Figure 4 delineates the average net channel-floodplain water volume exchanges through left and right sides, when facing land, within the WLD over the entire simulation period. The black arrows indicate positive transport, i.e., water movement from channels to floodplains. In contrast, the yellow arrows signify the negative transport, from floodplains to channels. Although most of the floodplains predominantly exhibit water transport from channel to floodplain (black arrows, 11 out of 14 possibilities), a distinct pattern is evident for three specific floodplains: Mike, Chester, and Sherman Islands (Figure 4, 3 out of 14 possibilities). Each of these floodplains showcases a pronounced negative transport of water, as denoted by the yellow arrows, toward their left side. Specifically, Chester’s Island manifests a marked water outflow of approximately 123 m³/s directed toward Mallard Pass. Concurrently, Mike Island demonstrates a notable leftward water discharge of 46 m³/s. Meanwhile, Sherman Island, although displaying a lower transport value than the former two, still indicates a discernible western water egress amounting to about 15 m³/s. The consistent left-sided net water transport in these three floodplains can be attributed to high connectivity and substantial water discharge of channel in their right sides, including Greg Pass, Gadwall which transfer about 18% and 27% of the WLO discharge based on the previous study (Feizabadi et al., 2023).
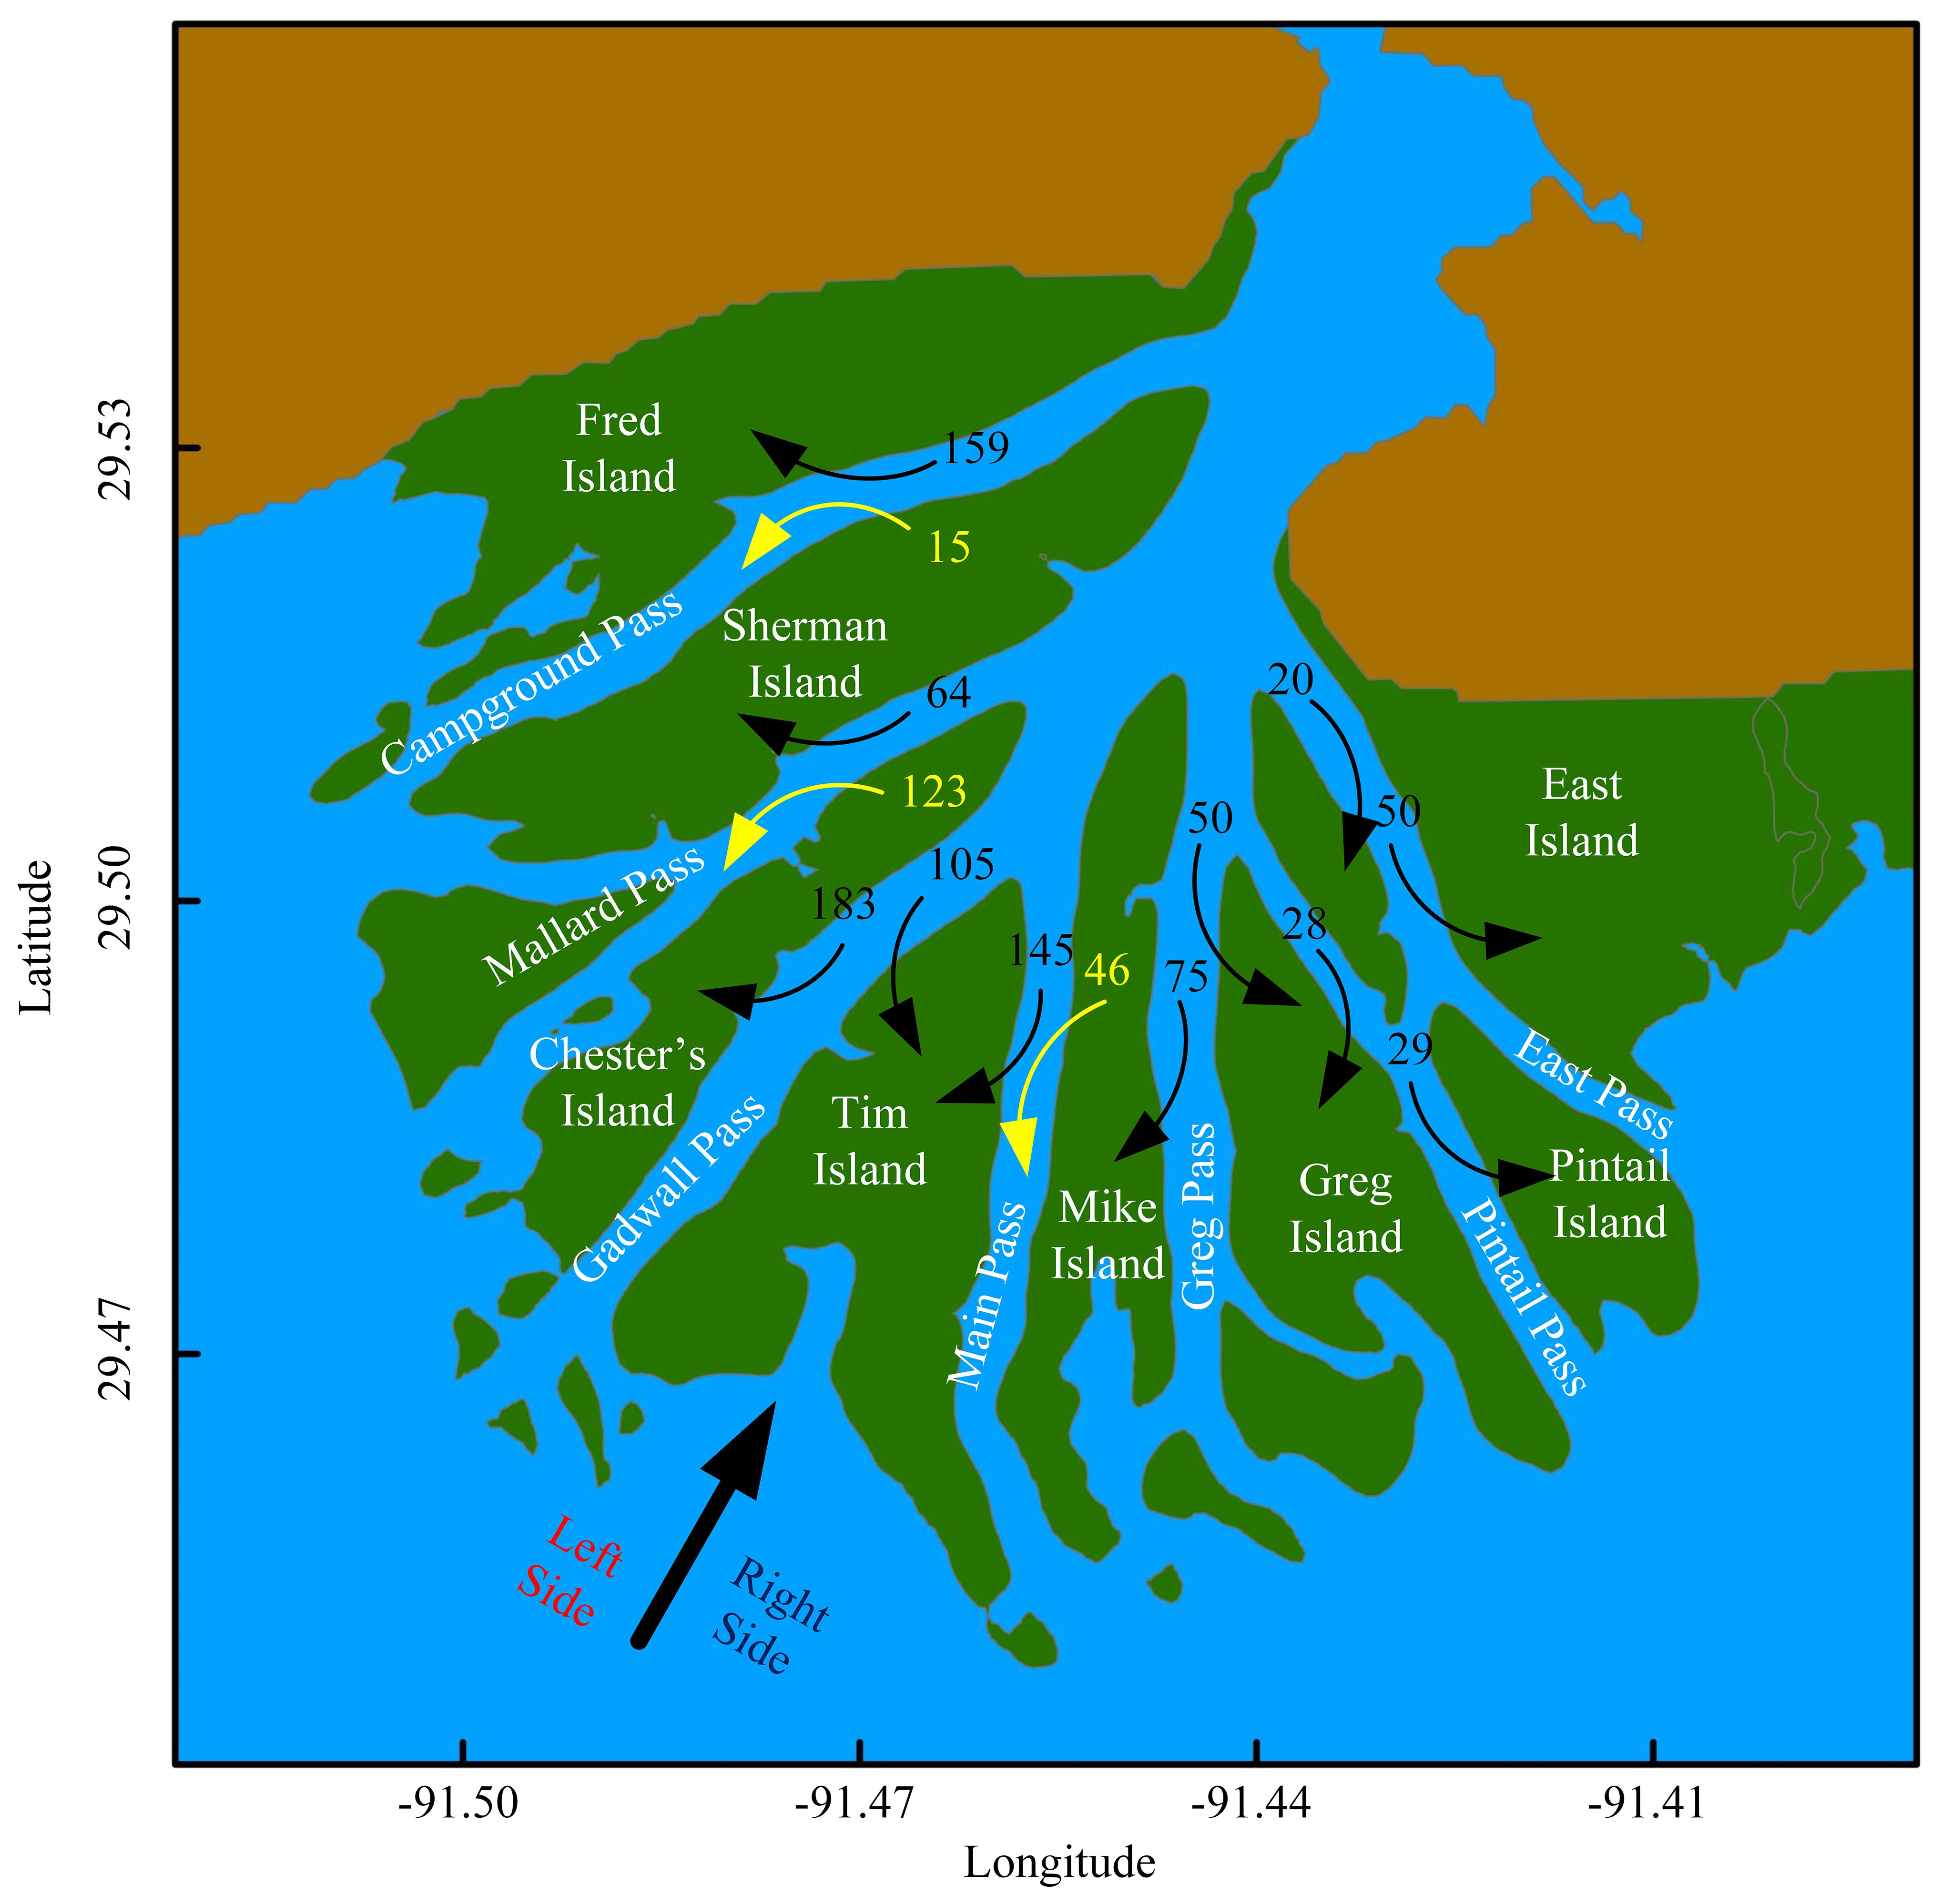
Figure 4 Average net water exchange (m³/s) between channels and islands. Black arrows represent water flowing from channels to islands, while yellow arrows indicate flow from islands to channels.
The average net water exchange from channels to each floodplain is approximately 90 m³/s, with a range from 29 to 250 m³/s. For Mike Island, there is a water transport (positive) from Greg Pass to the floodplain on the right side approximating 75 m³/s, contrasted by a negative transport from the floodplain to Main Pass, measuring around 49 m³/s. Meanwhile, Tim Island experiences positive average water transport on both its right and left flanks, with rates of approximately 145 m³/s from the Main Pass and 105 m³/s from Gadwall Pass, respectively.
Figure 5 represents the time series of the alteration in water exchange between channels and different floodplains from December 1, 2022, to January 31, 2023. It shows the bidirectional water exchange between channels and their adjacent floodplains influenced by tidal currents. However, the impact of tidal currents on water exchange varies among the floodplains: it is pronounced on Chester, Tim, Mike, and Greg Islands, while it is notably less significant on Pintail and East Islands (Figures 5A–H).
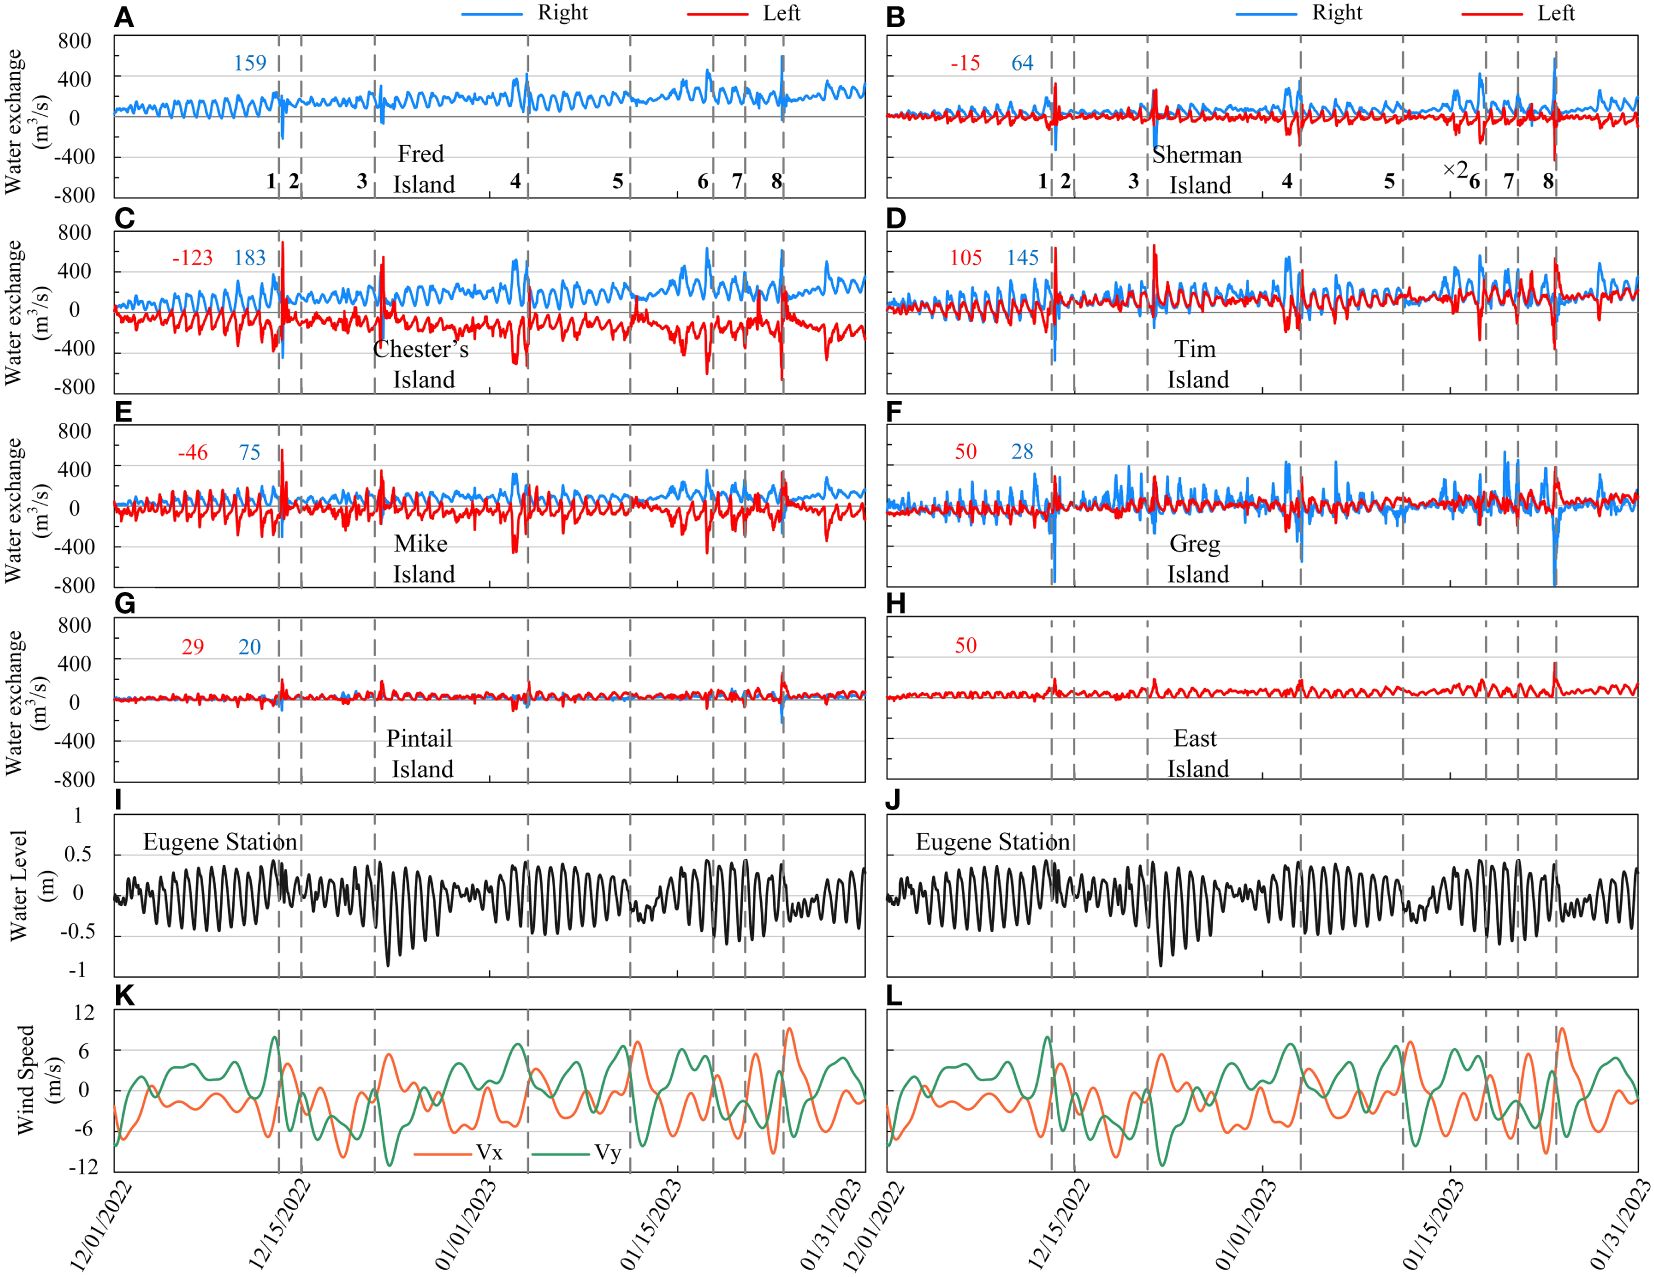
Figure 5 Time series of the water exchange (volume transport) between islands and channels, water level, and wind velocity components from December 2022 to January 2023. Water exchange relative to the average net water exchange (A–H), water elevation at the Eugene station (I, J), wind velocity components Vx and Vy (K, L). Colored numbers indicate the average net water exchange on the left and right sides of floodplains. Dashed lines across the figures mark the time of cold fronts passing through. Positive values signify the movement of water from channels to floodplains, and negative values suggest the reverse flow. The water flow on the left and right sides of the floodplains is represented by red and blue lines, respectively.
In Figure 5, the gray dashed lines demarcate the specific times when cold fronts pass through the WLD, serving as temporal markers for analyzing the associated changes in water exchange patterns. The results indicate that significant variations in water exchange are evident during the pre-frontal phase with dominant southerly winds and the post-frontal phase characterized by prevailing northerly and northwesterly winds (Figures 5A–H). For instance, Mike Island experiences a positive average net water transport of approximately 75 m³/s from its right side, and a contrasting negative transport of around -46 m³/s from its left side towards the Main Pass. During the first cold front’s pre-frontal phase, water transport along the left side increases by roughly fivefold, reaching -280 m³/s (Figure 5E). Simultaneously, on the right side, the transport enhances to about 210 m³/s, marking a twofold rise in the water exchange. However, during the post-frontal phase, the water exchange patterns reverse and intensify, with the water exchange on the left and right sides enhancing to 553 m³/s and -305 m³/s, respectively. On Tim Island, where net water transport is around 105 m³/s and 145 m³/s on the left and right sides, respectively, a similar cold front significantly amplifies exchanges in both frontal phases (Figure 5D). During the pre-frontal phase, the left side undergoes a reversal, increasing to about -191 m³/s, while the right side shows an increase to 315 m³/s without changing direction. In the post-frontal phase, the water transport on the left side of Tim Island surges to around 635 m³/s, whereas on the right side it inverts with an increased magnitude to about -470 m³/s. A similar response in water exchange patterns can be observed for other floodplains, though the magnitude varies, which shows the significant impact of passing cold fronts on the channel-floodplain water volume exchanges in a deltaic system.
When comparing cold fronts 3 and 5, even though they have similar characteristics in terms of their movement directions, northwesterly, and nearly identical wind speeds (cold front 3 at 10.4 ± 2 m/s and cold front 5 at 9.1 ± 0.9 m/s), the variation observed in cold front 5 is significantly lower than that in cold front 3 in all of floodplains. This difference can be attributed to the tidal currents depicted in Figures 5I and J. Specifically, during cold front 3, there is a presence of a spring tidal current, while cold front 5 coincides with a neap tide. During a spring tide, the volume of water in the WLD is larger, leading to higher water levels during the flood tide. Consequently, the passage of a given cold front during a spring tide enhances the water transport between channels and floodplains. It can be concluded that one of the significant factors affecting water exchange between primary channels and floodplains is the water level in the delta.
The analysis reveals that the passage of a cold front alters both the magnitude and direction of water transport between channels and floodplains and the characteristics of connectivity. This change should have impacts on the ecological and geological processes on the floodplains, including sediment transport and deposition, nutrient cycling, biodiversity, and overall productivity (e.g., Bevington et al., 2017; Knights et al., 2020; Olliver and Edmonds, 2021). The extent of this water exchange is influenced by factors such as wind speed and the water level in the delta, which in turn are determined by tidal currents and river discharge.
4.2 Transport fraction
In this section, the transport fraction between channels and floodplains is explored on both the left and right sides, when facing land. The percentage of non-tidal upstream discharge that interacts with the floodplains on each side is determined by assessing the transport fraction. Figure 6 displays the fraction time series for all floodplains based on water input from the WLO measured at the delta apex cross-section (Figure 1D).
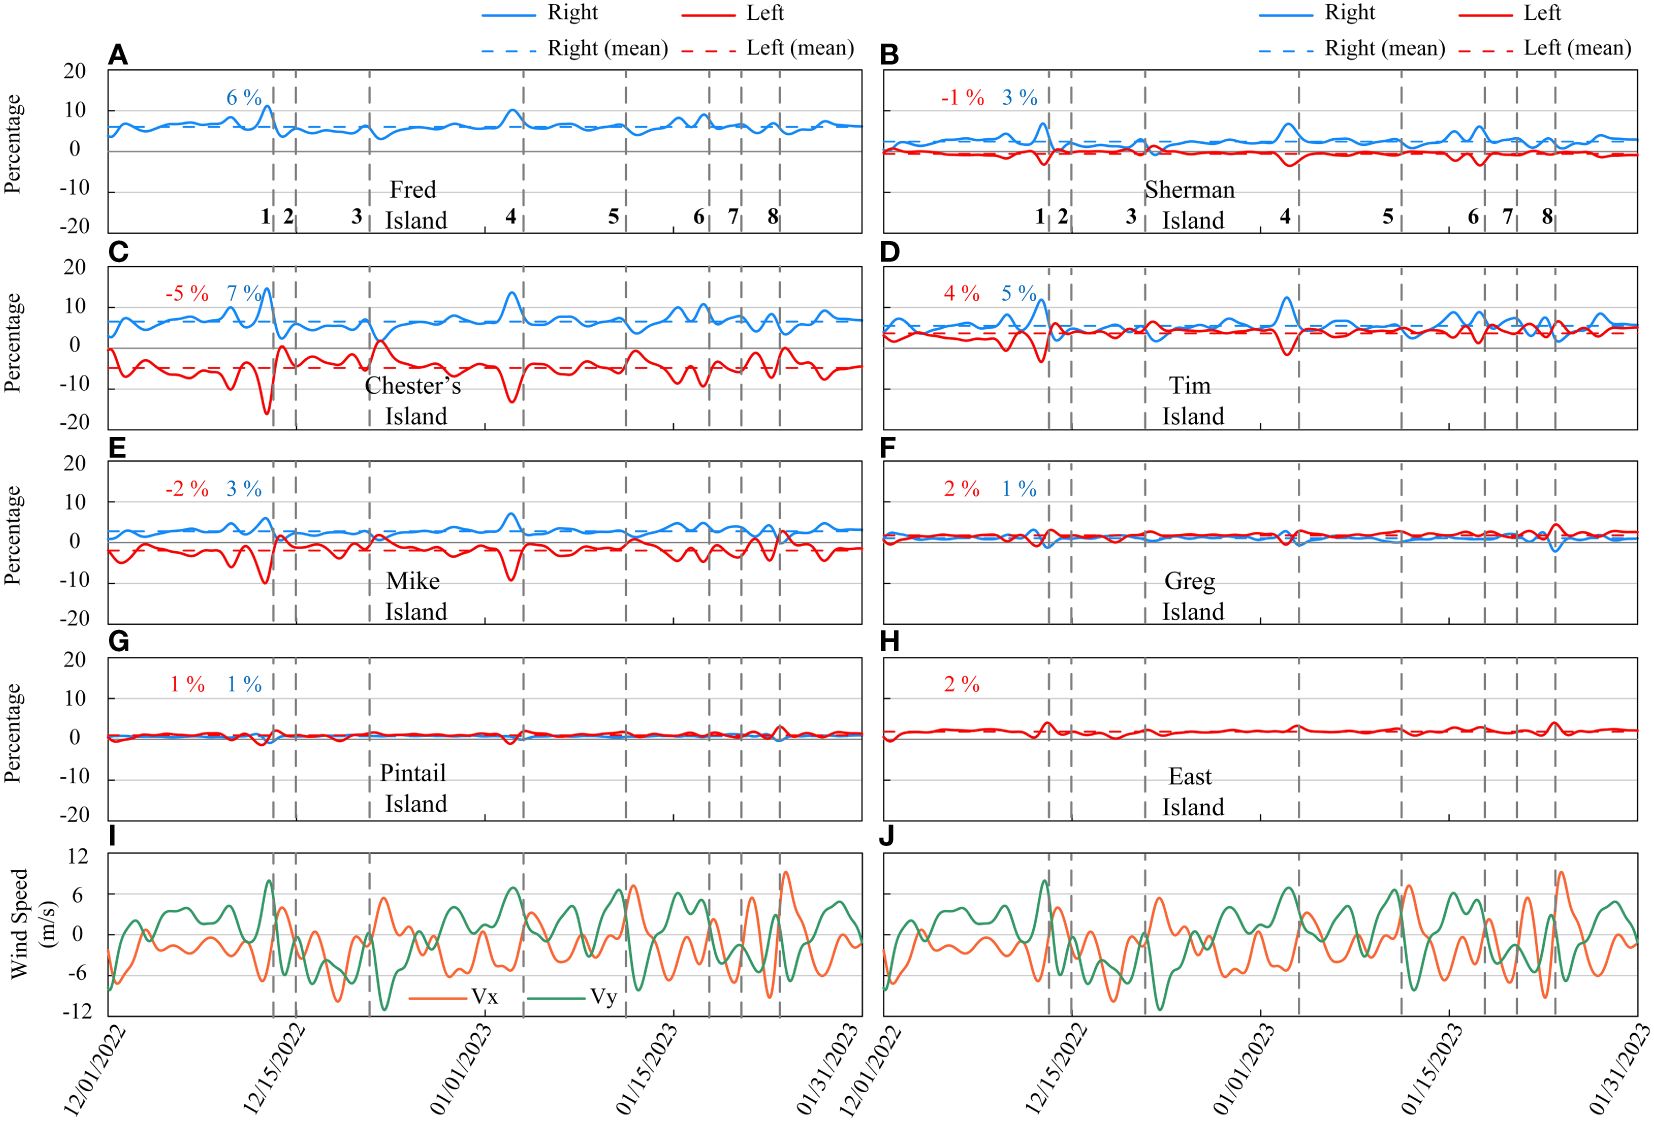
Figure 6 Time series of the transport fraction between islands and channels from December 2022 to January 2023 relative to the non-tidal inflow from the WLO, average connectivity for each side of islands (A–H), and wind velocity components Vx and Vy (K, L). Colored numbers indicate the average net water exchange on the left and right sides of floodplains. Dashed lines across the figures mark the time of cold fronts passing through. Positive values signify the movement of water from channels to floodplains, and negative values suggest the reverse flow. The water flow on the left and right sides of the floodplains is represented by red and blue lines, respectively.
The average and temporal patterns of transport fraction for each floodplain indicate that the floodplains can have different connectivity characteristics (Figures 6A–H). Pronounced cold front-induced fluctuations in transport fraction are observed for Chester, Mike, and Tim Islands. Conversely, Greg, Pintail, and East Islands demonstrate relatively consistent and less variability, potentially attributed to their distinct geomorphological features. Pintail, Greg, and East Islands, with average fractions ranging between 1% and 2%, exhibit the lowest transport fraction when compared to other islands (Figures 6A–H). This reduced fraction can be partially attributed to the presence of natural levees along these floodplains, which act as natural barriers (Supplementary Figure S1A). The cross-sectional views of floodplains in the WLD show that Pintail Island possesses the highest natural levees on both sides compared to other floodplains (Supplementary Figure S2). These levees, formed by sediment deposition during flooding events, influence the connectivity of these floodplains with adjacent channels. Such variations underscore the integral role of topography and structural attributes of the floodplains in determining the extent and nature of their connectivity with surrounding waters.
For floodplains like Greg and Tim Islands, with positive average fraction on both sides indicating water transport from the main channel to the floodplain, the pre-frontal phase typically sees decreased fraction on the left side and increased fraction on the right. However, in the post-frontal phase, this pattern reverses. On Tim Island, with an average fraction of 4% on the left and 5% on the right, the pre-frontal phase of cold front 1 leads to a reversal and decrease in fraction on the left side to -3%, while on the right side, it increases to 13%. In contrast, the post-frontal phase causes an increase in fraction to 5% on the left and a decrease to 2% on the right side (Figure 6D). For floodplains like Chester and Mike Islands, with a positive average fraction on the right side and negative one on the left side, an augmentation in fraction is seen during the pre-frontal phase, which subsequently diminishes during the post-frontal phase. Chester Island, with a transport fraction of 7% on the right side and -5% on the left side, experiences intensified fraction during the pre-frontal phase of cold front 1, with values surging to 14.5% and -16% for the right and left sides, respectively. However, in the post-frontal phase, the right-side fraction significantly drops to 2.4%, while on the left, there is not only a reduction but a reversal to 0.5% from channel to floodplain (Figure 6C).
4.3 Effect of river discharge on transport fraction
As discussed in section 4.1, the water levels within the delta play an important role in influencing water exchange. Consequently, the river discharge, which invariably impacts the water level in the delta, can be a determinant for floodplain connectivity. This forms the premise for the investigation into the interplay between river discharge and connectivity. Three distinct scenarios are assessed to provide a comprehensive perspective on transport fraction under different river discharge scenarios, including low, moderate, and high discharge conditions. To consider the variability in hydrological conditions, an analysis is performed on the daily water discharge records for the Wax Lake Outlet and the Atchafalaya River, spanning from 2006 through August 2023. For the categorization of discharge levels, the first quartile is selected to represent low discharge (1845 m3/s), the mean value indicates moderate discharge (3210 m3/s), and a value under which 90% of records fall in is designated as high discharge (5600 m3/s).
Figure 7 shows the transport fraction for Chester, Tim, and Mike Islands during both low (dotted lines in Figures 7A, C, E) and high (dashed lines in Figures 7B, D, F) discharge conditions, as compared with the actual simulation (solid lines). Examining the water discharge data (Figures 7G, H) reveals a clear correlation that a decline in water discharge tends to reduce transport fraction, while an increase in discharge generally enhances fraction on both sides of the floodplains. Furthermore, results show that the response of transport fraction to passing cold fronts varies depending on river discharge. While an increase in river discharge does bolster the average fraction, it concurrently mitigates the fluctuations attributable to cold fronts. Conversely, a decrease in river discharge exacerbates the fluctuations induced by cold fronts, which is associated with smaller water depth and thus higher nonlinearity (Li and O’Donnell, 1997; Feizabadi et al., 2024a). For example, during the cold front 4 in the pre-frontal phase in the low discharge scenario, the transport fraction of Mike Island through the left side is approximately -11% and 8% for the right side from the channel to the floodplain (Figure 7E). Meanwhile, in the high discharge scenario, their magnitudes decrease to -4% and 5%, respectively (Figure 7F).
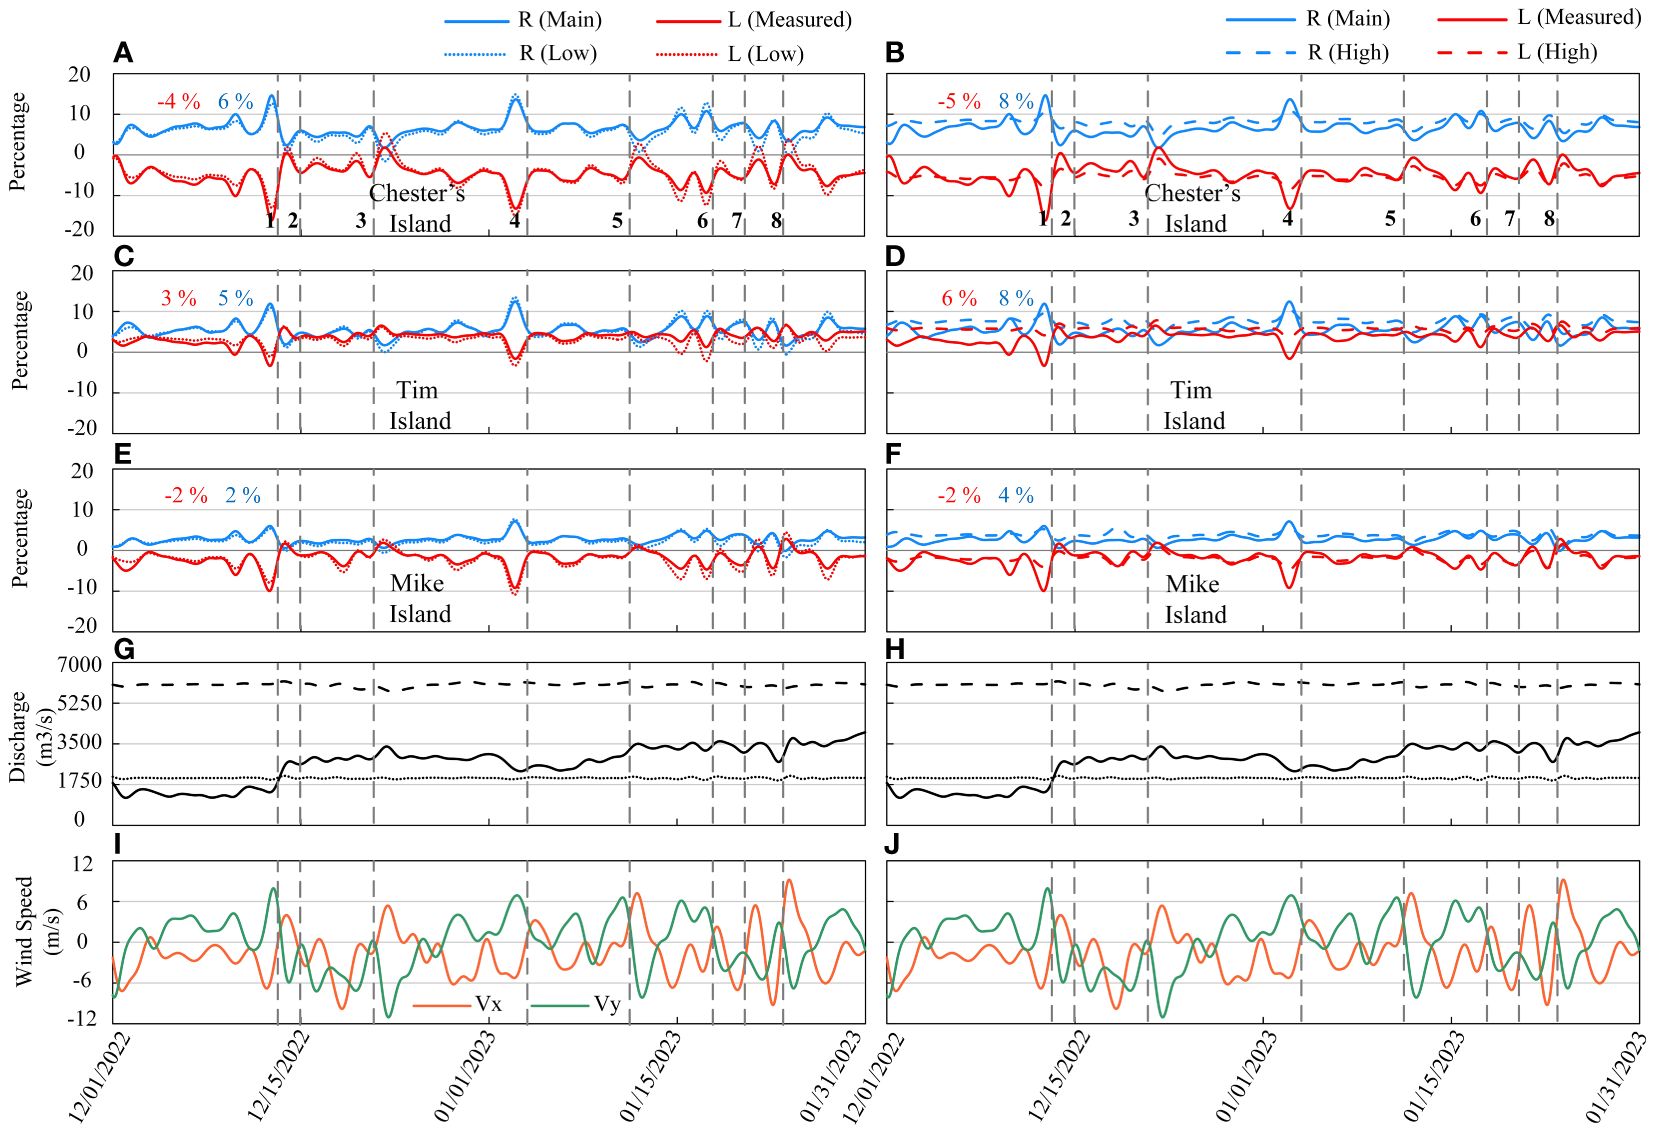
Figure 7 Time series of the transport fraction for Chester, Tim, and Mike islands from December 2022 to January 2023 relative to the non-tidal inflow from the WLO under low (A, C, E) and high (B, D, F) discharge scenarios, average connectivity for each side of islands, the Wax Lake Outlet discharge time series represented by solid (measured), dotted (low), and dashed (high) lines (G, H), and wind velocity components Vx and Vy (I, J). Colored numbers indicate the average net water exchange on the left and right sides of floodplains. Dashed lines across the figures mark the time of cold fronts passing through. Positive values signify the movement of water from channels to floodplains, and negative values suggest the reverse flow. The water flow on the left and right sides of the floodplains is represented by red and blue lines, respectively.
Table 3 illustrates the average transport fraction of all floodplains to WLO water discharge under different conditions, split between the right and left sides of each floodplain. The fraction values appear to be influenced by the discharge values; as the discharge increases, the transport fraction for many floodplains tends to rise. However, floodplains like Mike Island exhibit varied responses, with Mike’s left side showing consistent transport fraction across scenarios. Chester and Tim Islands exhibit a greater fraction relative to the other floodplains. In contrast, the Pintail and East Islands present the lowest fraction values among all floodplains, suggesting they might be least affected by changes in water discharge. Additionally, the findings indicate that the transport fraction on the right side of the floodplains is higher than that on the left side, which may be attributed to the influence of the Coriolis force and topography (Feizabadi et al., 2023).
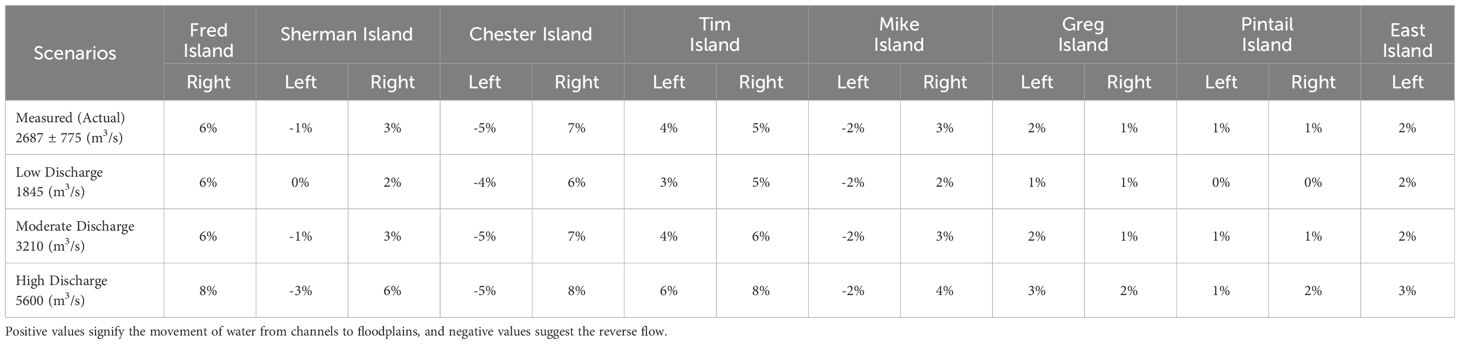
Table 3 Comparison of the transport fraction for each channel and two adjacent floodplains in relation to water discharge conditions.
To assess the impact of the Coriolis force on transport fraction across different river discharges, simulations without the Coriolis force are performed for low and high WLO discharges. The findings highlight the significant influence of the Coriolis force, which amplifies transport fraction on the right (eastern) side and diminishes it on the left (western) side of floodplains in the northern hemisphere, when facing land (Supplementary Figure S3). However, the influence on the right side is considerably more pronounced than that on the left side. Specifically for Tim Island, the Coriolis force increases transport fraction by 5-12% on the right side and reduces it by approximately 1-2% on the left, depending on river discharge (Supplementary Figure S3). In Mike, Chester’s, and Sherman Islands, the net water exchange is characterized by a dominant flow from the floodplain to the channel on the left side, where the volume of water transferring from the floodplain to the channel surpasses that from the channel to the floodplain. The Coriolis force enhances the volume of water directed toward the floodplain from the right side while simultaneously reducing the volume directed toward the channel from the left side, when facing land. This interaction results in an elevated transport fraction on the left side of these floodplains. Furthermore, the results indicate that the impact of the Coriolis force on transport fraction is more pronounced during periods of low discharge, aligning with the findings of prior studies (Feizabadi et al., 2023). The difference in the responses of these floodplains underscores the complexity of hydrodynamic processes and implies that each floodplain’s topography, position, and surrounding channel morphology might play a crucial role in determining its connectivity behavior.
To quantify the water exchange between each channel and their adjacent floodplains under multiple discharge conditions, an evaluation of the average fraction of channels based on the water discharge of each channel is provided in Table 4. The data illustrates a wide variability in average transport fraction depending on both the specific channel and the discharge condition. As concluded in the previous sections, the magnitude of fraction increases with higher discharge rates. The Main, Mallard, and Campground Passes demonstrate consistently elevated total fraction rates, quantified as the summation of absolute fraction values with two adjacent floodplains. Under the high discharge, this rate has been observed to exceed 90% (Table 4). In other words, it indicates that the integrated average water transport between these passes and their corresponding floodplains accounts for over 90% of their channel discharge. Nonetheless, the high fraction rates of Main, Mallard, and Campground Passes do not necessarily indicate the greatest volume of water exchange with floodplains relative to other channels. While Gadwall Pass demonstrates a total fraction rate of 53%, it accounts for approximately 27% of the water transport from the WLO, as reported in previous studies (Feizabadi et al., 2023). In contrast, the contribution from each of Main, Mallard, and Campground Passes is approximately 11% (Feizabadi et al., 2023). Furthermore, results show that Greg Pass has the lowest total fraction compared to other channels, ranging from 20% to 37% depending on the discharge conditions. Typically, the average total fraction for all passes is around 50%, with a variation from 23 to 77%, under the moderate discharge condition as the mean WLO discharge to the delta. The disparities in transport fraction among channels underscore the heterogeneity of water and sediment dynamics in the system.
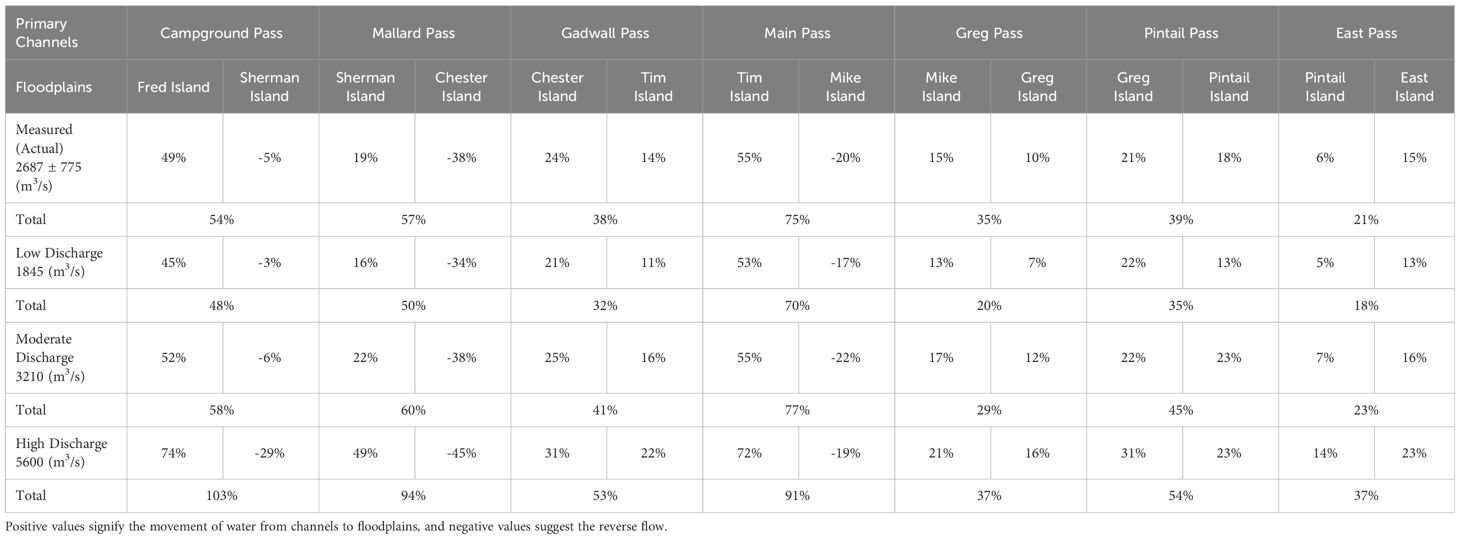
Table 4 Comparison of the transport fraction for each channel and two adjacent floodplains in relation to water discharge of each channel.
4.4 Floodplain and channel contributions
The average contributions of channels and floodplains, from the delta apex to the delta front, are evaluated to determine their roles in water transport relative to the total inflow from the WLO (Figure 8). In Figure 8, the blue curves represent the channels’ contribution, with varying line patterns delineating different discharge conditions: solid (measured), dotted (low discharge), solid-circles (moderate discharge), and dashed (high discharge). The remainder of the contribution is attributed to the floodplains (red lines), encompassing six floodplains bordered by channels on both sides, along with the Fred and East Islands. As the distance from the delta apex increases, the percentage contribution of the channels, regardless of the discharge condition, shows a generally declining trend, while the percentage contribution of the floodplains shows an increasing trend. At 8 to 10 km from the apex, there is a notable shift in the contributions from channels to floodplains, which is largely due to the bathymetry of the channels (Supplementary Figure S1B). The bathymetry of channels indicates a sudden reduction in water depth within this specific range due to an adversely sloping channel, leading to a significant diversion of water into the floodplains (Supplementary Figures S1C, D). Also, the results demonstrate that with the increase in river discharge, the contribution of channels diminishes, and conversely, the contribution of the floodplains enhances. At 10-km from the delta apex, the average contribution of floodplains in water transport oscillates between 39% and 58%, depending on the river discharge from low to high.
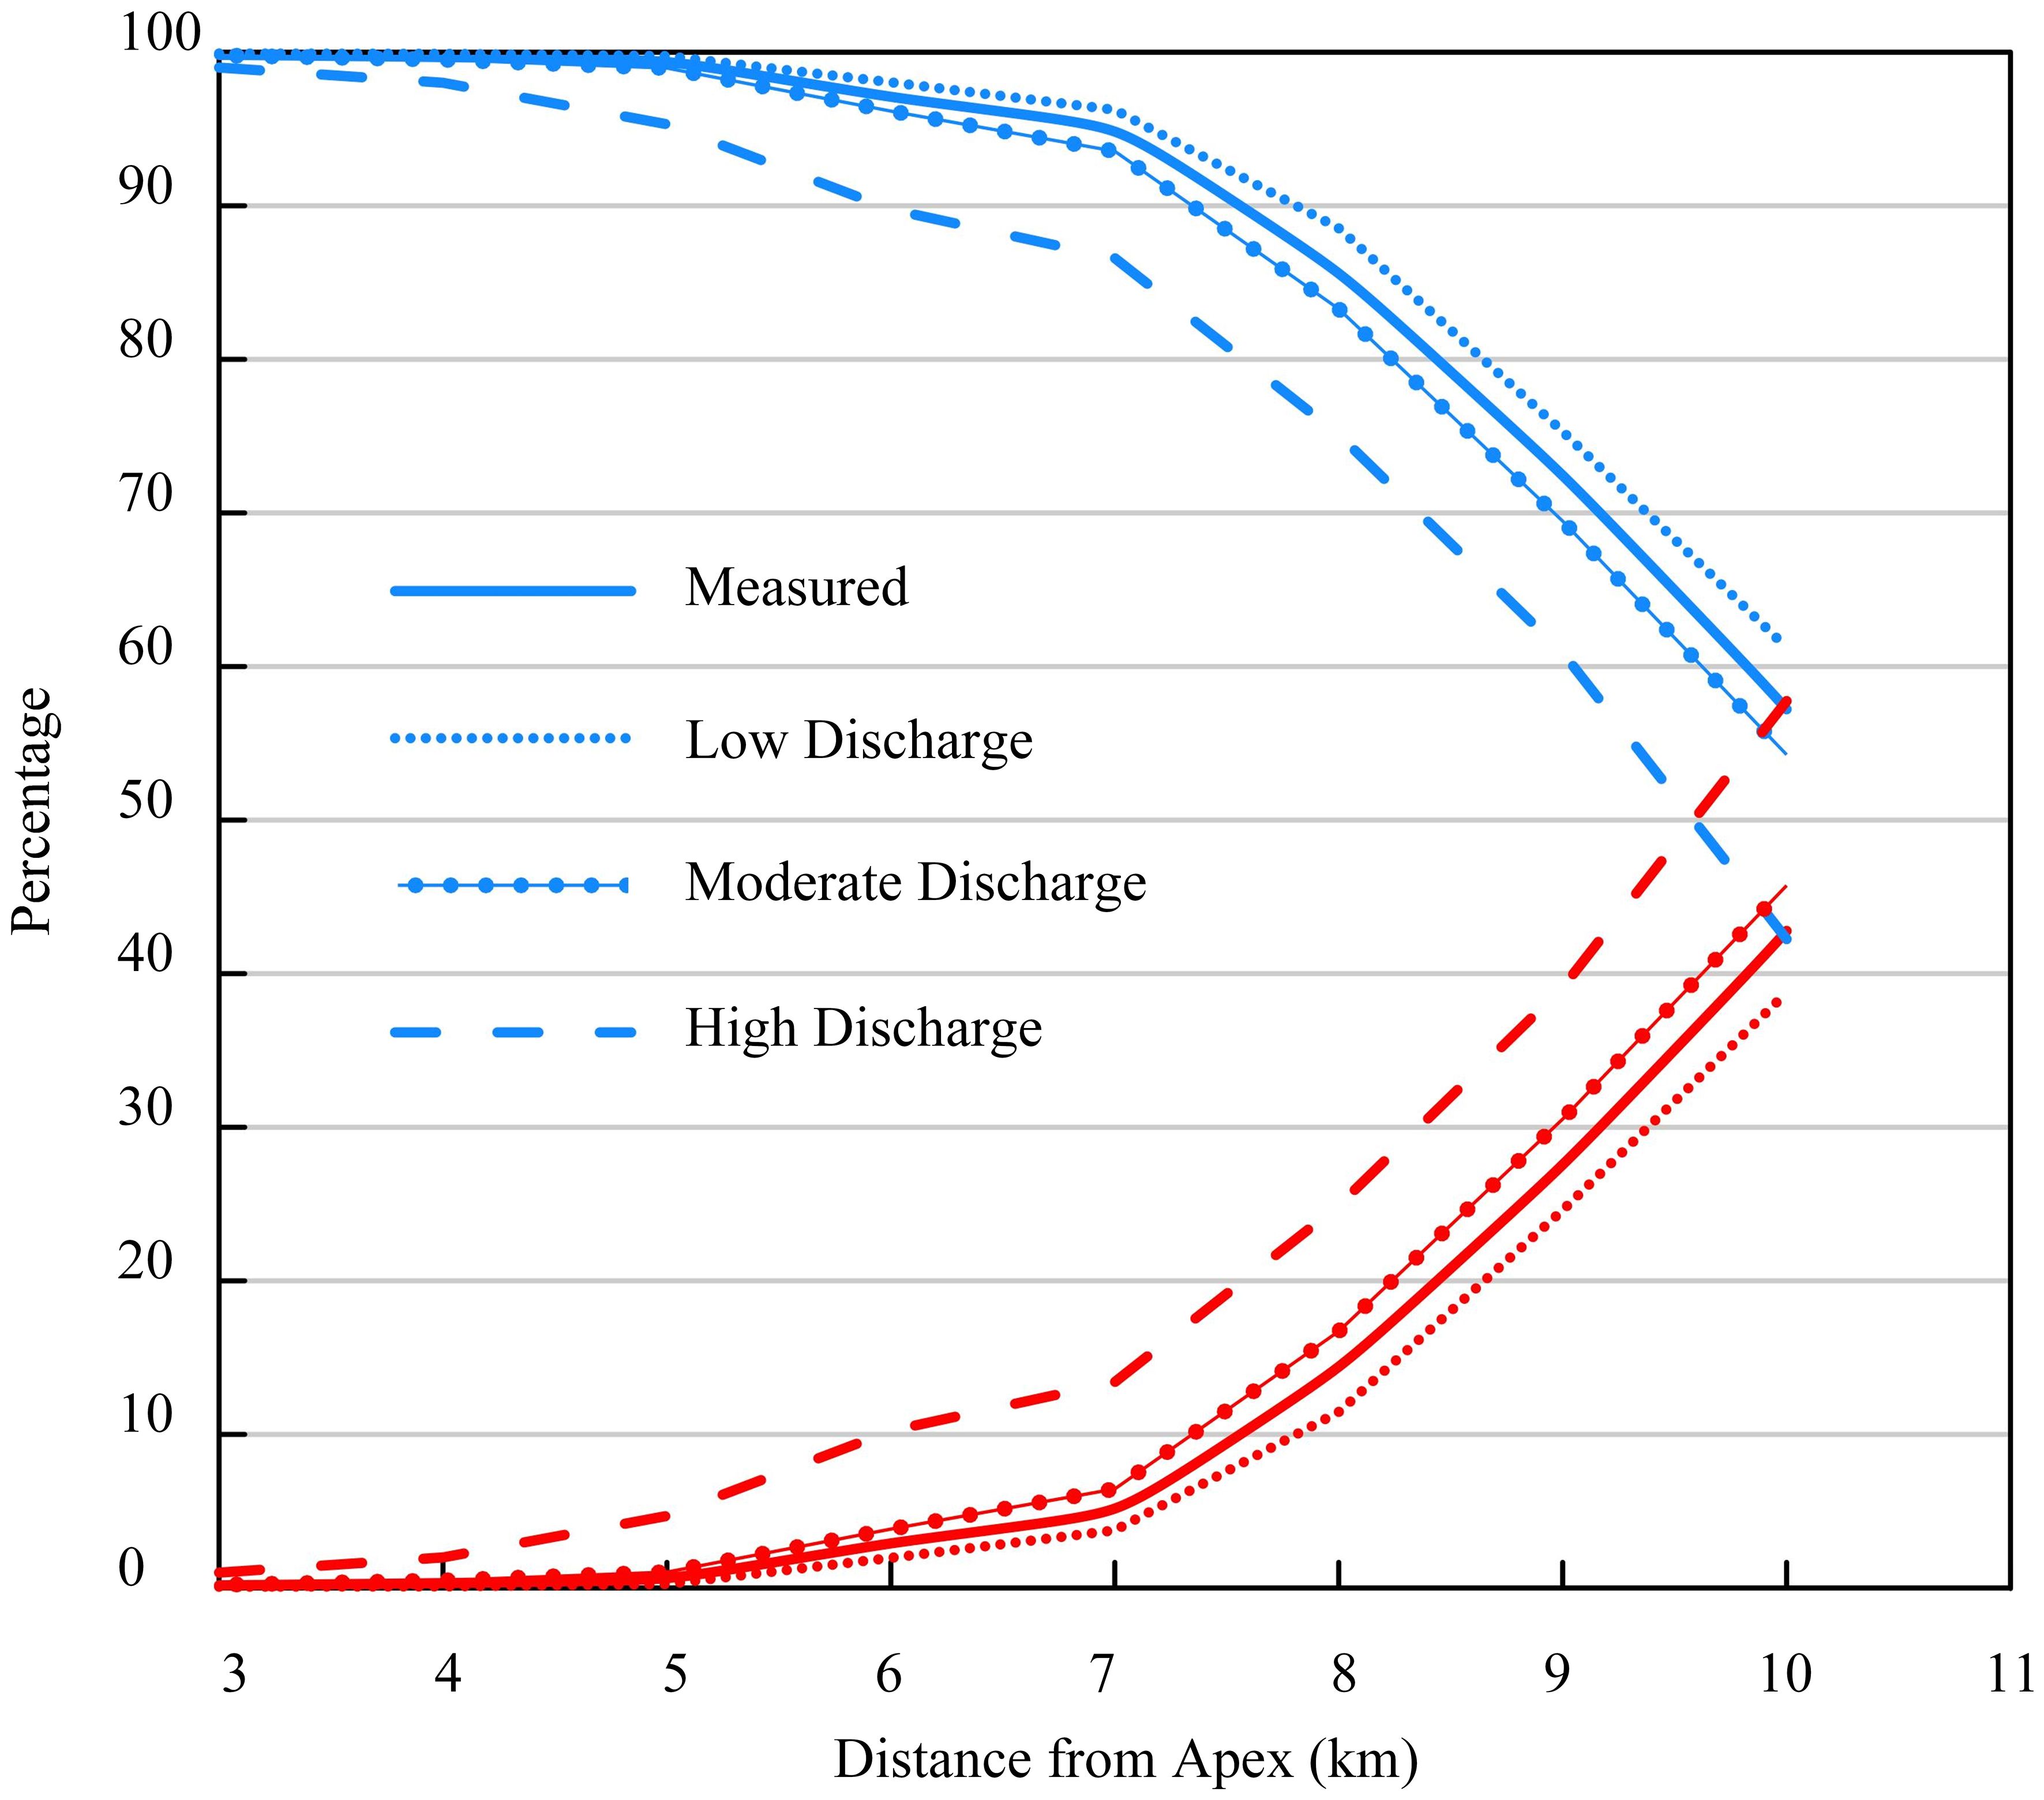
Figure 8 The average water transfer contribution by channels and floodplains based on their distance from the apex under different discharge conditions, measured (solid), low (dotted), moderate (solid-circles), and high discharge (dashed) scenarios, over a span of 3 to 10 kilometers from the apex. Blue and red lines represent the contribution of channels and floodplains, respectively.
To further understand the role of individual floodplains and channels at various distances from the delta apex under different river discharge scenarios, the average contribution of each floodplain and channel segment has been quantified based on the total water flux along the respective arc boundary illustrated in Figure 1D (Figure 9). The cumulative contribution of all segments in each arc equates to 100%, without considering the roles of Fred and East Islands. This is attributed to the low-lying nature of the floodplain bathymetry, which presents no distinct boundaries to demarcate these two islands from the upper reaches of the delta. The uniformity of the low-lying terrain precludes the definition of discrete segments in the hydrological analysis of the area. The results indicate that moving away from the delta apex to the delta front, there is an uptick in the role floodplains play in water transport, while the contribution of channels diminishes conversely. For example, the average contribution of Gadwall Pass, which serves as the main water transport channel, diminishes from 28% at 5 km from the apex to 14% at 10 km under moderate discharge conditions. Conversely, the contribution of Tim Island rises from 0% to 11% (Figure 9C). The floodplains located at the delta have a modest gradient extending from the delta front to its apex, marked by a progressive shift from subtidal zones to intertidal and eventually to supratidal regions. Natural levees hinder flow between channels and floodplains, notably during low discharge. Consequently, pronounced channel-floodplain interactions are evident in places where sediment surface elevations are diminished, and the subtidal zone is prevalent.
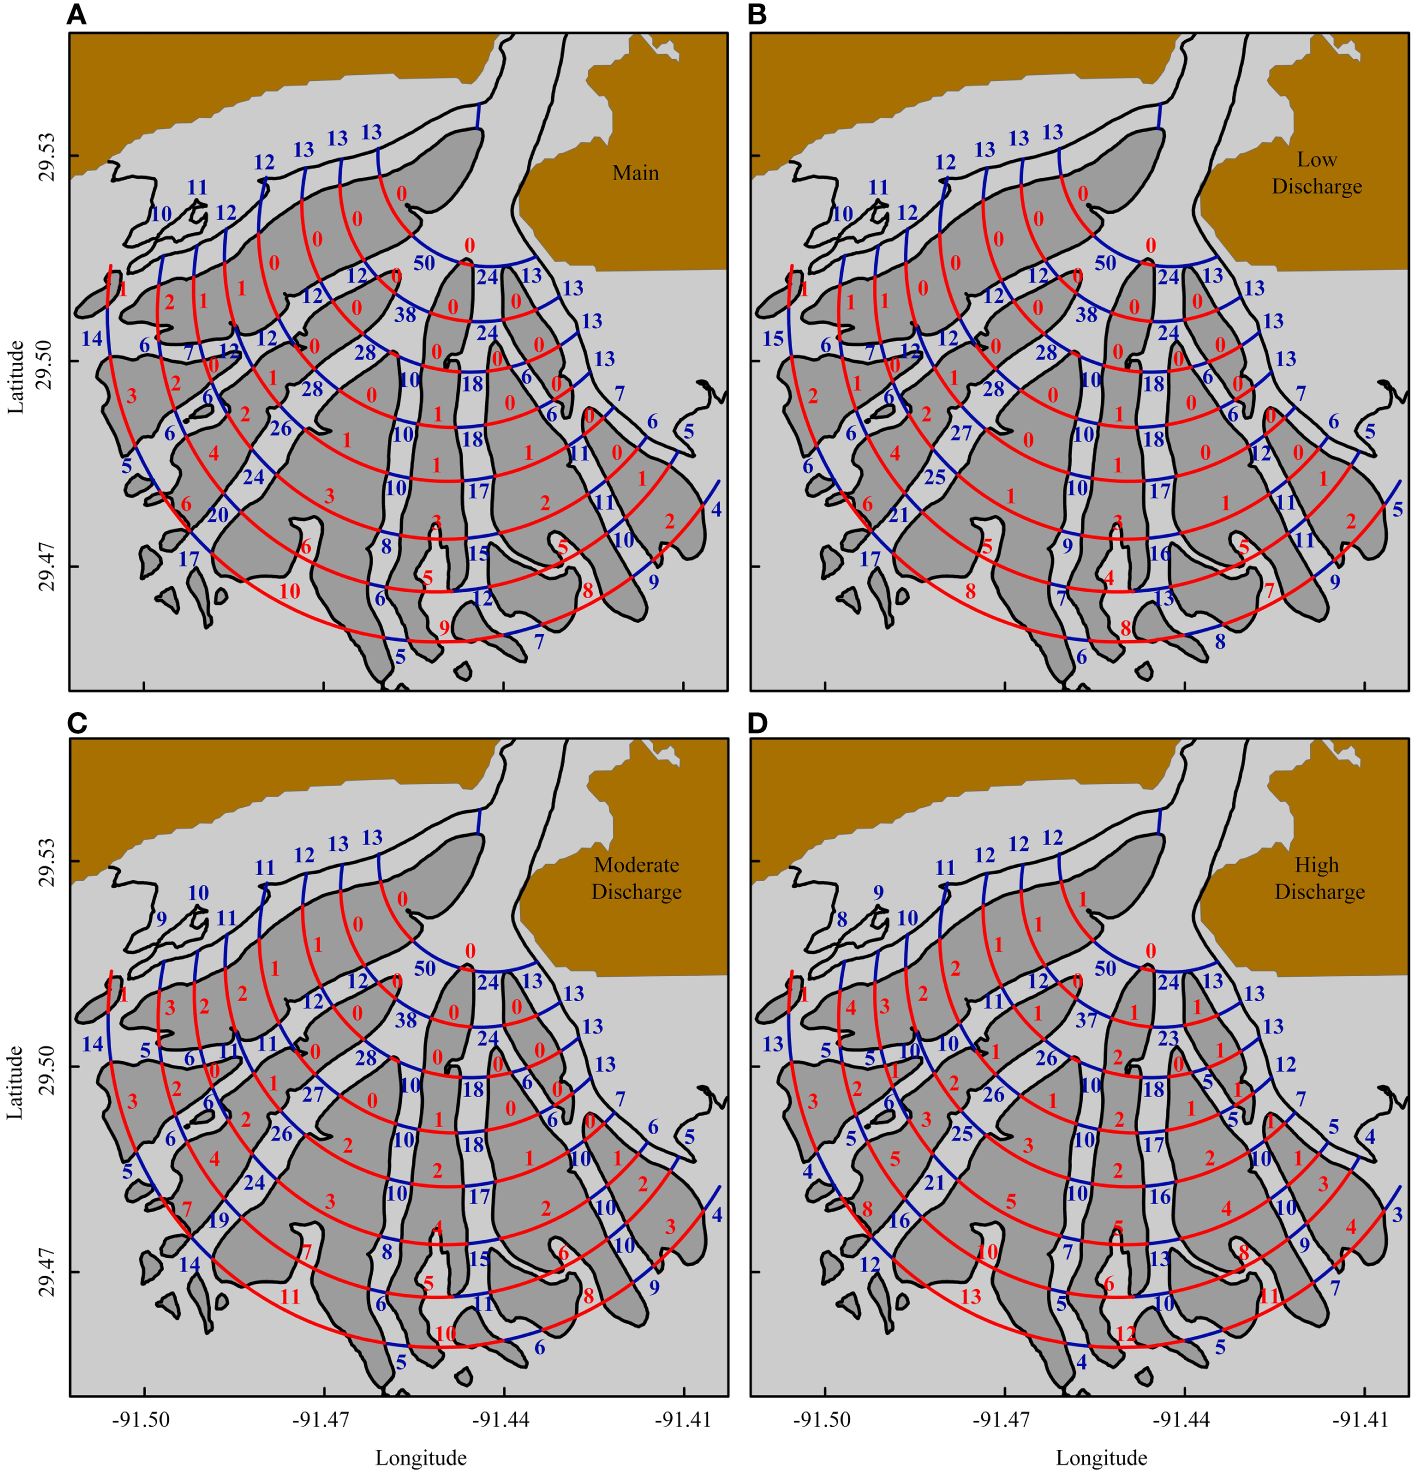
Figure 9 The average water transport contribution of channels and floodplains under various discharge conditions. (A) the actual or “Measured” discharge, (B) the Low Discharge, (C) the Moderate Discharge, and (D) High Discharge. Blue and red numbers represent the contribution of channels and floodplains, respectively.
In comparison to other floodplains, Tim, Mike, and Greg Islands have the highest average contribution in water transport, with their contributions ranging from about 8 to 12%, depending on the water discharge, at 10 km from the apex of the delta (Figure 9). The substantial contribution of these floodplains can be due to their relative youth compared to others (Bevington and Twilley, 2018), and their extensive shallow areas (Supplementary Figures S1A, 2). In contrast, Sherman and Pintail Islands have the lowest contributions in water transport. Furthermore, results illustrate that an increase in WLO discharge amplifies the role of floodplains in the conveyance of water and materials, encompassing sediments, nutrients, and other relevant elements. Concurrently, there is a discernible reduction in the contribution of channels. In particular, the Gadwall Pass, with a considerable 17% contribution in low discharge conditions, experiences a reduction to 14% under high discharge conditions at 10 km from the apex. Conversely, the contribution of Tim Island increases from 8% to 13% when the discharge changes from low to high. It can be attributed to the general rise in water depth in the channels and floodplain during high discharge conditions, leading to an enhanced flow across the boundary separating the channel and the floodplain.
5 Discussion
The present study adds more understanding of the impact of atmospheric cold front to the deltaic system. The previous studies (e.g., Feizabadi et al., 2023) examined different forcing factors to the circulations in the system. These factors include the geomorphological setup of the floodplains, orientation and intensity of the cold front, variations in river discharges, tides, and Coriolis force.
In contrast, the present study further explored the hydrological connectivity between channels and floodplains under cold fronts, providing more understanding of the complex geomorphological impact to the water transport distribution and pathways under the influence of cold fronts in a deltaic system. While earlier studies broadly investigated the factors influencing water level variations, water volume transport in channels, and overall water circulation within the WLD (e.g., Zhang et al., 2022; Feizabadi et al., 2024b), the present research delves into the specifics of hydrological connectivity between channels and floodplains and the variations. Specifically, we highlight the spatial variation in the critical role of floodplains in water transport under different conditions, a previously underexplored facet. Thus, this study progresses from a general examination of hydrodynamic forces to a detailed exploration of localized interactions between channels and floodplains, advancing the understanding of how these dynamics manifest at another level within the deltaic system.
5.1 Reaction of floodplain water exchange patterns to passing cold fronts
For a clearer comprehension of how water exchange on the floodplains reacts to the passage of cold fronts, the floodplains have been categorized into two distinct groups as depicted in Figure 10, based on their net water exchange with adjacent channels. In this classification, Sherman, Chester, and Mike Islands are designated as Type 2 Chevron shaped floodplains, whereas the rest fall under the Type 1 category. For Type 1 floodplains, under the non-frontal state, the net water exchange is characterized by a flow from the channels to the floodplain on both sides. With the advent of a cold front, this water exchange intensifies on both sides. During the pre-frontal phase, the water exchange on the left side undergoes a reversal, transitioning from the floodplain to the channel. Similarly, in the post-frontal phase, the right side reflects this alteration, shifting its flow from the floodplain towards the channel. For Type 2 floodplains, as depicted in the non-frontal state shows water exchange from the channel to the floodplain on the right side and from the floodplain to the channel on the left side. The passage of a cold front amplifies the water exchange during both the pre- and post-frontal phases. In the pre-frontal phase, the direction remains consistent with the non-frontal state. Conversely, during the post-frontal phase, both sides undergo a reversal in their water exchange direction. This classification offers a valuable perspective for predicting how the hydrological connectivity of floodplains respond to passing cold fronts and variations in discharge levels. The distinct characteristics of these two types of floodplains could potentially be attributed to their morphological structures and features, which may be influenced by factors such as water circulation patterns, sediment transport dynamics, and meteorological conditions.
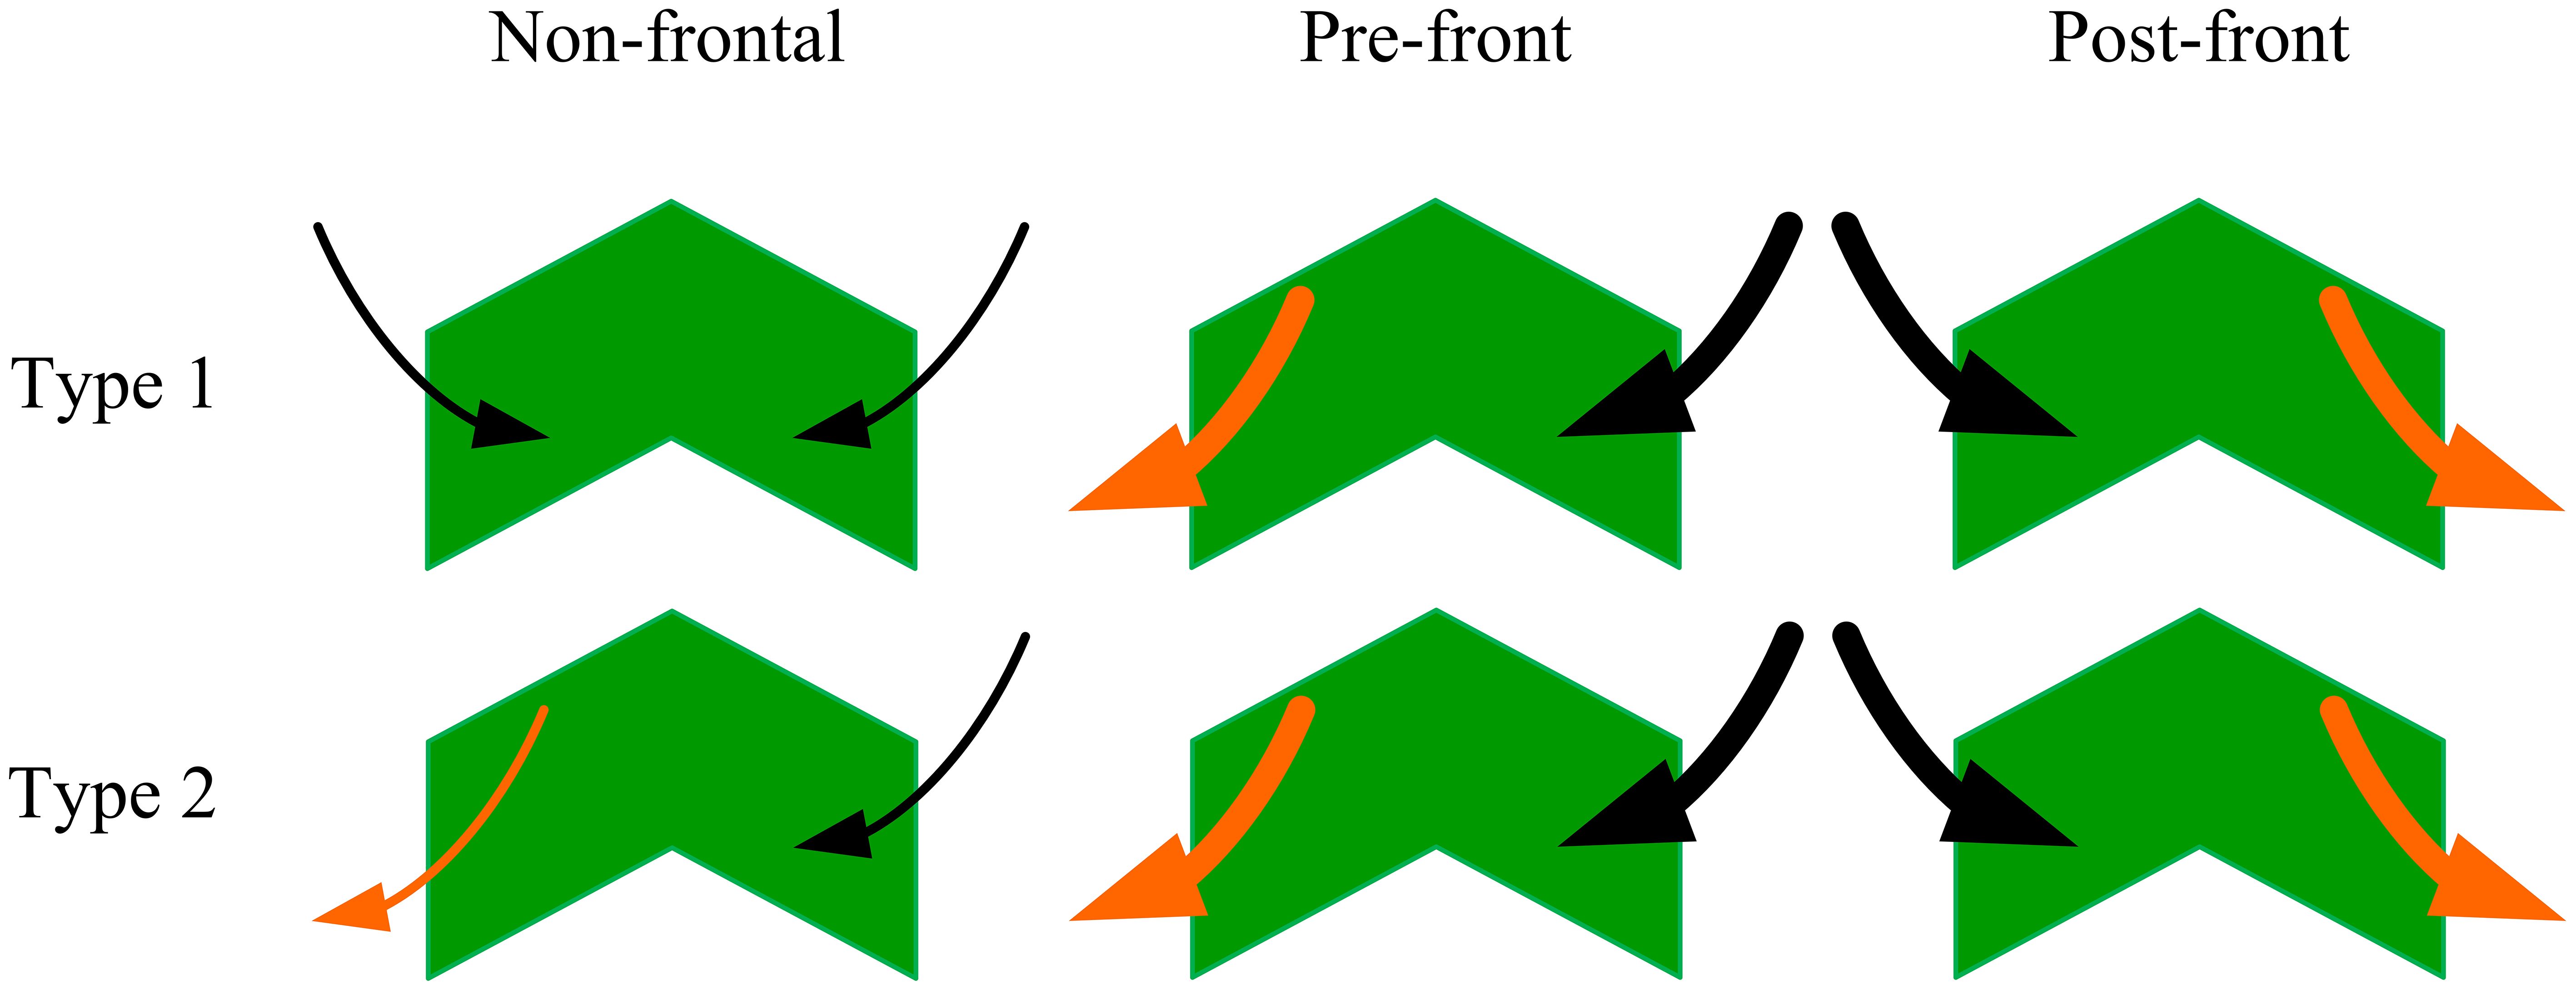
Figure 10 Visual representation of floodplain classifications based on water exchange responses to passing cold fronts. Black arrows indicate water movement from channel to floodplain, while orange arrows depict water transport from floodplain to channel. The increased thickness of arrows highlights the amplification of water exchange during cold front passages relative to normal state.
5.2 Verification of floodplain contributions to water transportation
The results indicate that between 39-58% of the water exchange from the WLD to the bay passes through floodplains, aligning with the 24–54% range observed in field measurements (Hiatt and Passalacqua, 2015). These measurements were conducted on 11 different Acoustic Doppler Current Profiler (ADCP) transects along Gadwall and Main Pass, encompassing 5 transects in each pass and one in the upper section, during the period of 16 to 19 June 2014 (Figure 11A). This period, characterized by both falling and rising tides, saw an average discharge at the Calumet gauge of 3344 m³/s.
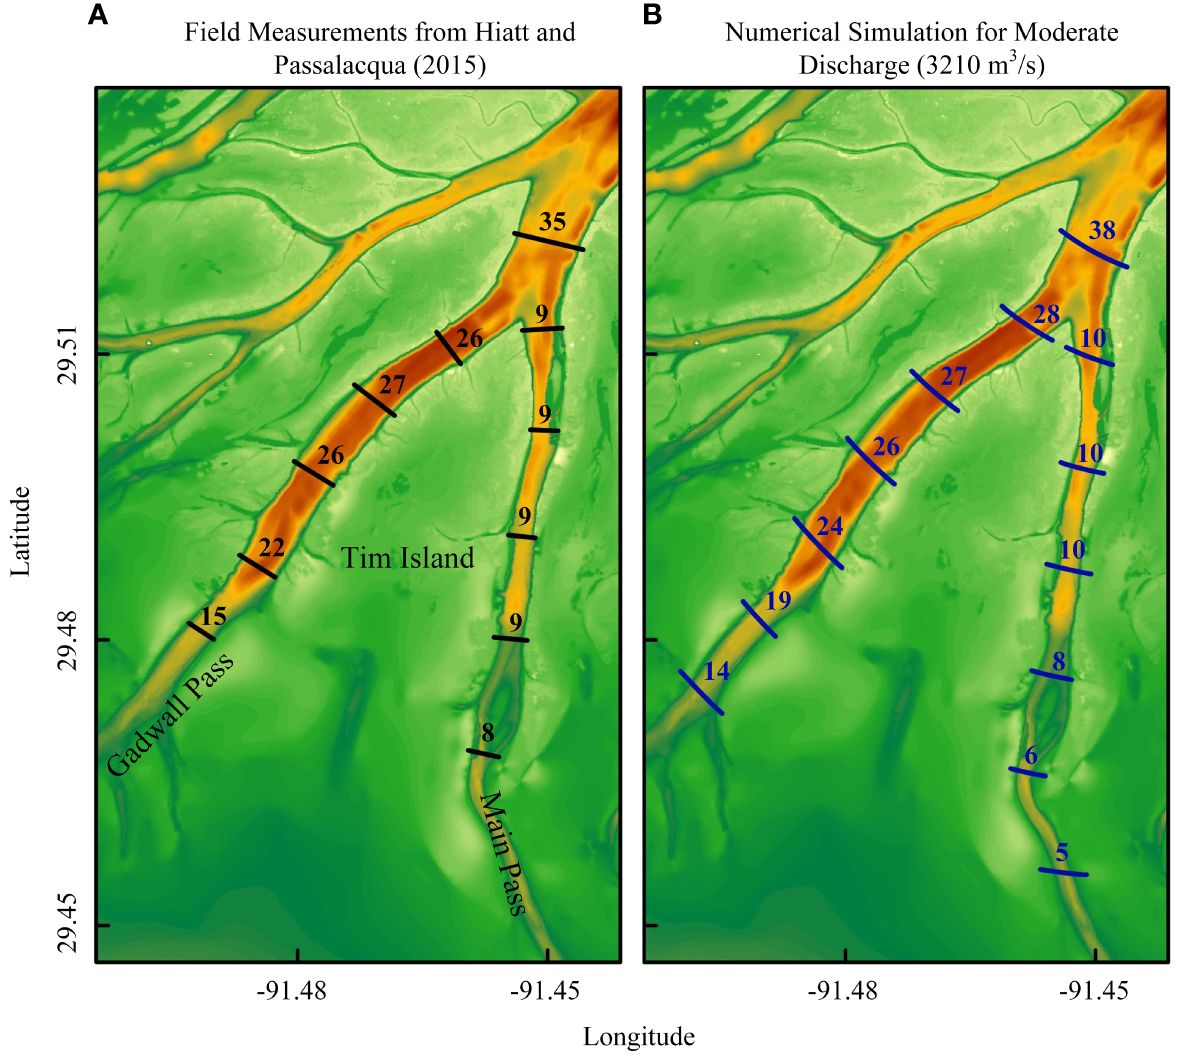
Figure 11 Comparison of percentage contribution of water transport for Gadwall Pass and Main Pass, as determined by field measurement (A) and simulation (B).
The data collected by Hiatt and Passalacqua (2015) were used to calculate the average discharge at each transect within the Gadwall and Main Passes, and to determine the respective contributions of each transect. These findings are subsequently compared with the contribution estimates derived from our simulations at these channels under a moderate discharge of 3210 m³/s (Figure 11). The comparison reveals that the measured and simulated contributions share similarities in both magnitude and pattern, notably a trend of diminishing channel contribution from upstream to downstream transects. This similarity underscores that the adjusted control model effectively captures the channels and floodplains interaction at the WLD. However, certain disparities are observed, potentially stemming from variations in river discharge conditions, the impact of tidal currents on measured data, and the specific locations of the transects.
5.3 Implication of findings on sediment transport
In deltaic environments, sediment transport determined by hydrodynamics plays a pivotal role in the formation and sustenance of the delta’s land area. Olliver and Edmonds (2021) observed that within the Wax Lake Delta, the amount of inorganic sediment flux and average accretion of a given floodplain is related to the hydrological connectivity between the floodplain and the primary channel network. This is crucial as the exchange patterns, via secondary channels, determine both the trajectory and the overall flow of water and sediment onto and from the floodplains. In a specific scenario in Olliver and Edmonds (2021), with a river flow of 2000 m3/s, absence of vegetation, and a 0.236 m semi-diurnal tidal amplitude, Tim Island receives about 29% of sediment deposits, followed by Mike and Greg Islands with 24% and 15% respectively.
Among the top three floodplains in terms of sediment deposition, both Tim and Greg Islands exhibit positive transport fraction on both their left and right sides (Type 1). In contrast, Mike Island shows a positive transport fraction on its right side and negative fraction on the left (Type 2). A comparison between the connectivity patterns of Mike Island and those of Chester and Sherman Islands reveals some intriguing differences. Although Mike Island has either similar or slightly lower positive transport fraction on the right side (Table 3) under varying discharge conditions than both Chester and Sherman Islands, it still ranks second in terms of sediment transport. This shows the high sediment retention efficiency of Mike Island in contrast to the others. Given a constant river discharge scenarios are explored in both and other studies (e.g., Olliver and Edmonds, 2021), the variance in sediment retention highlights the significant influence of tidal currents on sediment retention, which is consistent with previous studies (Allison et al., 2017; Olliver et al., 2020).
Furthermore, the findings of this research emphasize the significant impact of passing cold fronts on the expansion of floodplain land and sediment accumulation in a delta. The interplay of the pre-front and post-frontal phases of a passing cold front does not just amplify the fraction rate between floodplains and channels; it can also remarkably shift the very direction of water movement, particularly in low discharge conditions. However, in the WLD, Bevington et al. (2017) conducted measurements of sediment surface elevation along seven transects from February 2008 to August 2011 and found that during the winter cold front season, sediment was eroded from the deltaic floodplains. There is a research gap in understanding the interaction effects of passing cold fronts, tidal currents, and river discharge on sediment distribution and transport within individual floodplain.
6 Conclusion
This research examines the impact of cold fronts on hydrological connectivity between primary channels and floodplains of the Wax Lake Delta (WLD), by considering different factors including atmospheric cold front related wind forcing, river discharge, tides, geomorphology, and the Coriolis force. Utilizing the hydrodynamic model D-Flow FM, this study conducts simulations and subsequent analyses to investigate the water exchange, transport fraction, and contributions of channels and floodplains to water volume transport in the WLD.
The study categorizes floodplains into two types based on their water exchange patterns and transport fraction. The first type experiences net water exchange from channels to floodplains on both the left and right sides of the channel-floodplain interface, while the other type shows a significant net water flow from channels to the floodplains on only one side, which can influence water exchange on the opposite side, altering it from flowing to the floodplains to moving towards the channels. The net water exchange from channels to floodplains averages about 90 m3/s, varying between 29 and 250 m3/s.
The water exchange and transport fraction between primary channels and floodplains under the influence of cold fronts depend on several factors, including morphodynamic characteristics of floodplains, the intensity of the cold front, the river discharge, Coriolis force, and tidal currents. The passage of a cold front can amplify or reverse the direction of water exchange between floodplains and channels during different frontal phases. In the pre-frontal phase, there is an increased water transport from the channel to the floodplain on one side (usually east side), while simultaneously, a reverse transport occurs from the floodplain to the channel on the opposite side of floodplain (usually west side). Conversely, the post-frontal phase is characterized by a reversal of this pattern, with an amplified exchange of water between floodplains and channels. The passage of cold fronts significantly enhances water exchange between channels and floodplains during both the pre- and post-frontal phases, particularly when coinciding with high water levels during spring tidal periods. Cold fronts can increase the rate of water exchange across one side of the channel-floodplain interface by up to five times.
The ratio of volumetric flow rate across the channel-floodplain interface, here termed the transport fraction, is modulated by atmospheric frontal passage. For floodplains experiencing transport into the floodplain from both channel boundaries, the passage of cold fronts may enhance transport fraction on one side of a floodplain (usually east side) and diminish it on another side (usually west side) during the pre-frontal phase. This pattern is reversed during the post-frontal phase. Meanwhile, for floodplains that have positive fraction on one side and negative on the other, there is an increase in transport fraction on both sides during the pre-frontal phase, followed by a decrease during the post-frontal phase. Cold fronts have the potential to enhance the transport fraction on one side of a floodplain by approximately threefold, rising from an average of 5% to 16%. Furthermore, results illustrate that increased river discharge enhances the transport fraction of floodplains and mitigates the impact of cold fronts, whereas a reduction in river discharge diminishes the transport fraction and intensifies the variations caused by cold fronts.
The transport fraction between each channel and its adjacent floodplains is typically about 50%, which is supported by previous field measurements at WLD. Furthermore, results show that the Coriolis force can diminish the transport fraction on the left side of floodplains and substantially enhance it on the right side. However, this effect is more pronounced during periods when the river discharge is low.
Findings regarding the roles of channels and floodplains in water exchange with the receiving basin reveal that the contribution of channels decreases from the apex towards downstream, whereas floodplain contributions show an increase. From the delta apex to the delta front, channels become shallower, so there is less distinction between channel and floodplains in terms of water depth and water spreads readily spreads laterally to floodplains via overbank flow. Consequently, with a rise in river discharge, the capacity of floodplains to transport water also increases. For the WLD, a significant portion of water, ranging from 39% to 58%, is transported through floodplains to the bay at the delta front, depending on the discharge condition. A substantial portion of this water is transported through relatively young floodplains with subaqueous levees versus mature floodplains with established levees and subaerial platforms.
Data availability statement
The original contributions presented in the study are included in the article/Supplementary Material. Further inquiries can be directed to the corresponding author.
Author contributions
SF: Writing – original draft, Visualization, Validation, Software, Methodology, Formal Analysis, Data curation. CL: Methodology, Writing – review & editing, Supervision, Project administration, Funding acquisition, Conceptualization. MH: Methodology, Funding acquisition, Writing – review & editing, Supervision, Conceptualization.
Funding
The author(s) declare financial support was received for the research, authorship, and/or publication of this article. The study was supported by the National Science Foundation (EAR-2023443), the National Science Foundation and Natural Environment Research Council (NSF-NERC 1736713), and NOAA through GCOOS (NOAA-NOS-IOOS-2016-2004378 and NA21NOS0120092).
Acknowledgments
The numerical modeling was performed on the WAVCIS computers, and the cluster computers of the MIKE HPC systems at LSU.
Conflict of interest
The authors declare that the research was conducted in the absence of any commercial or financial relationships that could be construed as a potential conflict of interest.
The author(s) declared that they were an editorial board member of Frontiers, at the time of submission. This had no impact on the peer review process and the final decision.
Publisher’s note
All claims expressed in this article are solely those of the authors and do not necessarily represent those of their affiliated organizations, or those of the publisher, the editors and the reviewers. Any product that may be evaluated in this article, or claim that may be made by its manufacturer, is not guaranteed or endorsed by the publisher.
Supplementary material
The Supplementary Material for this article can be found online at: https://www.frontiersin.org/articles/10.3389/fmars.2024.1387180/full#supplementary-material
References
Allen Y. C., Couvillion B. R., Barras J. A. (2012). Using multitemporal remote sensing imagery and inundation measures to improve land change estimates in Coastal Wetlands. Estuaries Coasts 35, 190–2005. doi: 10.1007/s12237-011-9437-z
Allison M. A., Demas C. R., Ebersole B. A., Kleiss B. A., Little C. D., Meselhe E. A., et al. (2012). A water and sediment budget for the lower mississippi–atchafalaya river in flood years 2008–2010: implications for sediment discharge to the oceans and coastal restoration in Louisiana. J. Hydrology 432–433, 84–97. doi: 10.1016/j.jhydrol.2012.02.020
Allison M. A., Yuill B. T., Meselhe E. A., Marsh J. K., Kolker A. S., Ameen A. D. (2017). Observational and numerical particle tracking to examine sediment dynamics in a mississippi river delta diversion. Estuarine Coast. Shelf Sci. 194, 97–108. doi: 10.1016/j.ecss.2017.06.004
Bevington A. E., Twilley R. R. (2018). Island edge morphodynamics along a chronosequence in a prograding deltaic floodplain wetland. J. Coast. Res. 34, 806–175. doi: 10.2112/JCOASTRES-D-17-00074.1
Bevington A. E., Twilley R. R., Sasser C. E., Holm G. O. Jr. (2017). Contribution of river floods, hurricanes, and cold fronts to elevation change in a deltaic floodplain, Northern Gulf of Mexico, USA. Estuarine Coast. Shelf Sci. 191, 188–200. doi: 10.1016/j.ecss.2017.04.010
Bracken L. J., Wainwright J., Ali G. A., Tetzlaff D., Smith M. W., Reaney S. M., et al. (2013). Concepts of hydrological connectivity: research approaches, pathways and future agendas. Earth-Science Rev. 119, 17–34. doi: 10.1016/j.earscirev.2013.02.001
Childers D. L., Day J. W. (1990). Marsh-water column interactions in two louisiana estuaries. I. Sediment dynamics. Estuaries 13, 3935. doi: 10.2307/1351784
Christensen A., Twilley R. R., Willson C. S., Castañeda-Moya E. (2020). Simulating hydrological connectivity and water age within a coastal deltaic floodplain of the mississippi river delta. Estuarine Coast. Shelf Sci. 245, 106995. doi: 10.1016/j.ecss.2020.106995
Coffey T. S., Shaw J. B. (2017). Congruent bifurcation angles in river delta and tributary channel networks. Geophysical Res. Lett. 44, 11–4275. doi: 10.1002/2017GL074873
Constantinescu A. M., Tyler A. N., Stanica A., Spyrakos E., Hunter P. D., Catianis I., et al. (2023). A century of human interventions on sediment flux variations in the danube-black sea transition zone. Front. Mar. Sci. 10, 1068065. doi: 10.3389/fmars.2023.1068065
Couvillion B. R., Beck H., Schoolmaster D., Fischer M. (2017). Land Area Change in Coastal Louisiana, (1932 to 2016) (US Geological Survey). doi: 10.3133/sim3381
CPRA (2023) Coastal Protection and Restoration Authority 2023 Coastal Master Plan. Available online at: https://coastal.la.gov/our-plan/2023-coastal-master-plan/.
Day J. W., Britsch L. D., Hawes S. R., Shaffer G. P., Reed D. J., Cahoon D. (2000). Pattern and process of land loss in the mississippi delta: A spatial and temporal analysis of wetland habitat change. Estuaries 23, 4255. doi: 10.2307/1353136
Denbina M. W., Simard M., Pavelsky T. M., Christensen A. I., Liu K., Lyon C. (2020). Pre-Delta-X: Channel Bathymetry of the Atchafalaya Basin, LA, USA 2016 (ORNL Distributed Active Archive Center). doi: 10.3334/ORNLDAAC/1807
D-Flow FM (2023) Delft3D Flexible Mesh Suite | Deltares. Available online at: https://www.deltares.nl/en/software-and-data/products/delft3d-flexible-mesh-suite.
Draut A. E., Kineke G. C., Huh O. K., Grymes J. M. III, Westphal K. A., Moeller C. C. (2005). Coastal mudflat accretion under energetic conditions, Louisiana Chenier-Plain Coast, USA. Mar. Geology 214, 27–47. doi: 10.1016/j.margeo.2004.10.033
Engle V. D. (2011). Estimating the provision of ecosystem services by gulf of Mexico coastal wetlands. Wetlands 31, 179–193. doi: 10.1007/s13157-010-0132-9
Feizabadi S., Li C., Hiatt M. R. (2022a). A numerical experiment of cold front induced circulation in wax lake delta: effect of the frontal orientation. In. AGU Fall Meeting Abstracts 2022, H32C–H307.
Feizabadi S., Li C., Hiatt M. (2023). A numerical experiment of cold front induced circulation in wax lake delta: evaluation of forcing factors. Front. Mar. Sci. 10. doi: 10.3389/fmars.2023.1228446
Feizabadi S., Li C., Hiatt M. (2024a). Non-linear interaction between cold front induced storm surge and tides in a shallow bayhead delta. Authorea Preprints, H51N-1280. doi: 10.22541/essoar.170800921.10269261/v1
Feizabadi S., Li C., Hiatt M. (2024b). “Evaluating the effect of river discharge on cold front induced water transport in the Wax Lake Delta, Louisiana,” in Ocean Sciences Meeting (AGU), CP14A-1776.
Feizabadi S., Rafati Y., Ghodsian M., Neyshabouri A. A. S., Abdolahpour M., Mazyak A. R. (2022b). Potential sea-level rise effects on the hydrodynamics and transport processes in Hudson–Raritan Estuary, NY–NJ. Ocean Dynamics 72, 421–425. doi: 10.1007/s10236-022-01512-0
Feng Z., Li C. (2010). Cold-front-induced flushing of the Louisiana bays. J. Mar. Syst. 82, 252–645. doi: 10.1016/j.jmarsys.2010.05.015
Geleynse N., Hiatt M., Sangireddy H., Passalacqua P. (2015). Identifying environmental controls on the shoreline of a natural river delta. J. Geophysical Research: Earth Surface 120, 877–893. doi: 10.1002/2014JF003408
Georgiou I. Y., FitzGerald D. M., Stone G. W. (2005). The impact of physical processes along the Louisiana coast. J. Coast. Res. 44, 72–89.
Hiatt M., Castañeda-Moya E., Twilley R., Hodges B. R., Passalacqua P. (2018). Channel-island connectivity affects water exposure time distributions in a coastal river delta. Water Resour. Res. 54, 2212–2325. doi: 10.1002/2017WR021289
Hiatt M., Passalacqua P. (2015). Hydrological connectivity in river deltas: the first-order importance of channel-island exchange. Water Resour. Res. 51, 2264–2825. doi: 10.1002/2014WR016149
Hiatt M., Snedden G., Day J. W., Rohli R. V., Nyman J.A., Lane R., et al. (2019). Drivers and impacts of water level fluctuations in the mississippi river delta: implications for delta restoration. Estuarine Coast. Shelf Sci. 224, 117–137. doi: 10.1016/j.ecss.2019.04.020
HPC (2023) NOAA’s Hydrometeorological Prediction Center. 2023. Available online at: https://www.wpc.ncep.noaa.gov/index.shtml#page=ovw.
Huang W., Li C. (2017). Cold front driven flows through multiple inlets of lake pontchartrain estuary. J. Geophysical Research: Oceans 122, 8627–8455. doi: 10.1002/2017JC012977
Huang W., Li C., Rivera-Monroy V. H. (2024). “Cold fronts control multiscale spatiotemporal hydroperiod patterns in a man-made subtropical coastal delta (Wax Lake Region, Louisiana USA),” in Ocean Dynamics 74, 355–372. doi: 10.1007/s10236-024-01608-9
Jaramillo S., Sheremet A., Allison M. A., Reed A. H., Holland K. T. (2009). Wave-mud interactions over the muddy atchafalaya subaqueous clinoform, louisiana, United States: wave-supported sediment transport. J. Geophys. Res.: Oceans 114, C04002. doi: 10.1029/2008JC004821
Knights D., Sawyer A. H., Barnes R. T., Piliouras A., Schwenk J., Edmonds D. A., et al. (2020). Nitrate removal across ecogeomorphic zones in Wax Lake Delta, Louisiana (USA). Water Resour. Res. 56, e2019WR026867. doi: 10.1029/2019WR026867
Lexartza-Artza I., Wainwright J. (2009). Hydrological connectivity: linking concepts with practical implications. Catena 79, 146–525. doi: 10.1016/j.catena.2009.07.001
Li C. (2013). Subtidal Water Flux through a Multiple-Inlet System: Observations before and during a Cold Front Event and Numerical Experiments. J. Geophysical Research: Oceans 118, 1877–1892. doi: 10.1002/jgrc.20149
Li C., Huang W., Wu R.-h., Sheremet A. (2020). Weather induced quasi-periodic motions in estuaries and bays: meteorological tide. China Ocean Eng. 34, 299–3135. doi: 10.1007/s13344-020-0028-2
Li C., O’Donnell J. (1997). Tidally driven residual circulation in shallow estuaries with lateral depth variation. J. Geophysical Research: Oceans 102, 27915–27929. doi: 10.1029/97JC02330
Li C., Roberts H., Stone G. W., Weeks E., Luo Y. (2011). Wind surge and saltwater intrusion in Atchafalaya bay during onshore winds prior to cold front passage. Hydrobiologia 658, 27–395. doi: 10.1007/s10750-010-0467-5
Majersky S., Roberts H. H., Cunningham R., Paul Kemp G., John C. J. (1997). Facies development in the wax lake outlet delta: present and future trends. Basin Res. Institute Bull. 7, 50–665.
Moon J. A., Feher L. C., Lane T. C., Vervaeke W. C., Osland M. J., Head D. M., et al. (2022). Surface elevation change dynamics in coastal marshes along the Northwestern Gulf of Mexico: anticipating effects of rising sea-Level and intensifying hurricanes. Wetlands 42, 495. doi: 10.1007/s13157-022-01565-3
NGDC (2001) U.S. Coastal Relief Model Vol.4 - Central Gulf of Mexico. Available online at: https://www.ncei.noaa.gov/products/coastal-relief-model.
NOAA (2023) Tides and Currents. Available online at: https://tidesandcurrents.noaa.gov/.
O’Connor M. T., Moffett K. B. (2015). Groundwater dynamics and surface water–groundwater interactions in a prograding delta island, Louisiana, USA. J. Hydrology 524, 15–29. doi: 10.1016/j.jhydrol.2015.02.017
Olliver E. A., Edmonds D. A. (2017). Defining the ecogeomorphic succession of land building for freshwater, intertidal wetlands in Wax Lake Delta, Louisiana. Estuarine Coast. Shelf Sci. 196, 45–57. doi: 10.1016/j.ecss.2017.06.009
Olliver E. A., Edmonds D. A. (2021). Hydrological connectivity controls magnitude and distribution of sediment deposition within the deltaic islands of Wax Lake Delta, LA, USA. J. Geophysical Research: Earth Surface 126, e2021JF006136. doi: 10.1029/2021JF006136
Olliver E. A., Edmonds D. A., Shaw J. B. (2020). Influence of floods, tides, and vegetation on sediment retention in Wax Lake Delta, Louisiana, USA. J. Geophysical Research: Earth Surface 125, e2019JF005316. doi: 10.1029/2019JF005316
Passalacqua P. (2017). The delta connectome: A network-based framework for studying connectivity in river deltas. Geomorphology 277, 50–62. doi: 10.1016/j.geomorph.2016.04.001
Perez B. C., Day J. W. Jr., Rouse L. J., Shaw R. F., Wang M. (2000). Influence of atchafalaya river discharge and winter frontal passage on suspended sediment concentration and flux in Fourleague Bay, Louisiana. Estuarine Coast. Shelf Sci. 50, 271–905. doi: 10.1006/ecss.1999.0564
Rabalais N. N., Turner R.E., Wiseman W. J. Jr. (2002). Gulf of Mexico hypoxia, aka ‘The dead zone. Annu. Rev. Ecol. Systematics 33, 235–635. doi: 10.1146/annurev.ecolsys.33.010802.150513
Roberts H. H., Huh O. K., Hsu S. A., Rouse L. J. Jr, Rickman D. A. (1989). Winter storm impacts on the chenier plain coast of southwestern Louisiana. Gulf Coast. Assoc. Geological Societies Trans. 39, 515–522.
Roberts H. H., Walker N., Cunningham R., Paul Kemp G., Majersky S. (1997). Evolution of sedimentary architecture and surface morphology: Atchafalaya and Wax Lake Deltas, Louisiana, (1973-1994). AAPG Bulletin. doi: 10.1306/3B05C2BC-172A-11D7-8645000102C1865D
Rosen T., Xu Y.J. (2013). Recent decadal growth of the Atchafalaya River delta complex: effects of variable riverine sediment input and vegetation succession. Geomorphology 194, 108–120. doi: 10.1016/j.geomorph.2013.04.020
Shafiei H., Soloy A., Turki I., Simard M., Lecoq N., Laignel B. (2022). Numerical investigation of the effects of distributary bathymetry and roughness on tidal hydrodynamics of Wax Lake region under calm conditions. Estuarine Coast. Shelf Sci. 265, 107694. doi: 10.1016/j.ecss.2021.107694
Szpilka C., Dresback K., Kolar R., Massey T.C. (2018). Improvements for the eastern North Pacific ADCIRC tidal database (ENPAC15). J. Mar. Sci. Eng. 6, 1315. doi: 10.3390/jmse6040131
Tetzlaff D., Soulsby C., Bacon P. J., Youngson A. F., Gibbins C., Malcolm I. A. (2007). Connectivity between landscapes and riverscapes-a unifying theme in integrating hydrology and ecology in catchment science? Hydrol. Process. 21, 1385–1389. doi: 10.1002/hyp.6701
Wainwright J., Turnbull L., Ibrahim T. G., Lexartza-Artza I., Thornton S. F., Brazier R. E. (2011). Linking environmental regimes, space and time: interpretations of structural and functional connectivity. Geomorphology 126, 387–404. doi: 10.1016/j.geomorph.2010.07.027
Walker N. D., Hammack A. B. (2000). Impacts of winter storms on circulation and sediment transport: Atchafalaya-Vermilion Bay Region, Louisiana, USA. J. Coast. Res. 16, 996–1010.
Willmott C. J. (1981). ON THE VALIDATION OF MODELS. Phys. Geogr. 2, 184–194. doi: 10.1080/02723646.1981.10642213
Wohl E., Brierley G., Cadol D., Coulthard T. J., Covino T., Fryirs K. A., et al. (2019). Connectivity as an emergent property of geomorphic systems. Earth Surface Processes Landforms 44, 4–265. doi: 10.1002/esp.4434
Wu J. (1980). Wind-Stress Coefficients over Sea Surface near Neutral Conditions—A Revisit. J. Phys. Oceanography 10, 727–740. doi: 10.1175/1520-0485(1980)010<0727:WSCOSS>2.0.CO;2
Wu J. (1994). “The sea surface is aerodynamically rough even under light winds,” in Boundary-Layer Meteorology, 69, 149–158. doi: 10.1007/BF00713300
Wu W., Biber P., Bethel M. (2017). Thresholds of sea-level rise rate and sea-level rise acceleration rate in a vulnerable coastal wetland. Ecol. Evol. 7, 10890–19035. doi: 10.1002/ece3.3550
Wurtsbaugh W. A., Paerl H. W., Dodds W. K. (2019). Nutrients, eutrophication and harmful algal blooms along the freshwater to marine continuum. Wiley Interdiscip. Reviews: Water 6, e13735. doi: 10.1002/wat2.1373
Keywords: deltaic system, cold front, water exchange, hydrological connectivity, wax lake delta, three dimensional model
Citation: Feizabadi S, Li C and Hiatt M (2024) Response of river delta hydrological connectivity to changes in river discharge and atmospheric frontal passage. Front. Mar. Sci. 11:1387180. doi: 10.3389/fmars.2024.1387180
Received: 16 February 2024; Accepted: 06 May 2024;
Published: 21 May 2024.
Edited by:
Donald B. Olson, University of Miami, United StatesReviewed by:
Qinghua Ye, Deltares, NetherlandsHannah Baranes, Gulf of Maine Research Institute, United States
Copyright © 2024 Feizabadi, Li and Hiatt. This is an open-access article distributed under the terms of the Creative Commons Attribution License (CC BY). The use, distribution or reproduction in other forums is permitted, provided the original author(s) and the copyright owner(s) are credited and that the original publication in this journal is cited, in accordance with accepted academic practice. No use, distribution or reproduction is permitted which does not comply with these terms.
*Correspondence: Chunyan Li, cli@lsu.edu