Study of wave-current coupling on offshore flexible photovoltaic foundation columns
 Jian Zhang
  Yibing Lou*
- School of Ship and Ocean Engineering, Jiangsu University of Science and Technology, Zhenjiang, Jiangsu, China
Due to the increasingly serious global energy problems, the photovoltaic industry has experienced significant growth. China has dominated this industry, and there is huge potential for future development and market demand. Offshore photovoltaic installations can be installed on a large scale due to China's long coastline, making it an area of great interest. Structures in water subject to complex hydrodynamic loads due to the joint action of wave-current. These loads differ significantly from those produced by conventional waves. In order to simulate the response of the wave-current coupling to the structure and the fluctuation of the slamming load with the position of the foundation column, this article builds a numerical wave tank using FLUENT. The results indicate that the maximum wave force on the structure occurs at a wave incidence angle of 30°. When there is forward current, the wave-current coupled wave height is smaller than the wave height alone, and the period becomes shorter while the wave speed accelerates. Wave force for wave-current coupling is 9.2% greater than that for linear superposition of wave-current. In the range of free liquid surface wave height, the slamming loads gradually increases while the incremental speed decreases for a single foundation column. The foundation column that meets the wave first is larger than the one that meets the wave later at the same height. However, the blocking effect of the front foundation column and the height difference do not have the same magnitude of influence on the slamming loads.
1 Introduction
Since the 21st century, the global energy security and ecological environment protection issues have become increasingly serious. Despite China’s remarkable achievements in renewable energy development, the country’s energy structure is still dominated by fossil fuels. This has resulted in China becoming the world’s largest greenhouse gas emitter9 (Shen et al., 2020; Zhang and Chen., 2022). To effectively advance and achieve the target of ‘Carbon Emission Peak and Carbon Neutralization’ and inject new momentum into China’s economy, the large-scale development of renewable energy is necessary (Wang et al., 2020; Meng et al., 2022). In this context, the photovoltaic industry has grown tremendously, and offshore PV is an important part of it. Photovoltaic power generation in efficiency, capacity, technical level and other aspects continue to maintain an international leading position (China Electricity Council, 2021). The installed capacity of non-fossil fuel energy generation is the highest in the world, with wind and solar power generation having an installed capacity of 280 GW and 250 GW respectively (Li et al., 2023).
Extremely large waves, also known as rogue or giant waves, exist. Many physical mechanisms are proposed for the formation of offshore structures, which have been a key driver in their design (Onorato et al., 2013). For example, the linear focusing of surface waves may result from the refraction of surface waves caused by varying bathymetry or currents (White and Fornberg, 1998; Janssen and Herbers, 2009), modulational instability of deepwater waves in both presence and absence of an opposing current (Benjamin and Feir, 1967; Onorato et al., 2013), and nonlinear effects caused by waves experiencing inhomogeneous media, e.g., a varying depth (Trulsen et al., 2012, 2020; Zheng et al., 2020; Li et al., 2021a, b), or current whose velocity profile has spatial variation (Shrira and Slunyaev, 2014; Ardhuin et al., 2017; Zhang et al., 2022; Zheng et al., 2023).
Offshore floating photovoltaic systems and other offshore photovoltaic systems are developing rapidly, and the impact of waves on offshore photovoltaics has become an indispensable factor in structural design and safety assessment (Shi et al., 2023; Yan et al., 2023). Offshore bridge structures, offshore buildings and other offshore engineering structures are located in a complex marine environment and subject to the combined action of waves and currents. When the current velocity is relatively high, the combined action of waves and currents on structures in water differs significantly from their separate actions (Yu and Bin., 2002). Currently, there is a greater body of research on the individual effects of waves on structures in water (Shen et al., 2012; Yan et al., 2013), with relatively fewer studies on the combined effects of waves and currents. A number of studies have pointed out that the impact of currents on marine structures cannot be ignored (Liu and Guedes Soares, 2023, 2024; Ye et al., 2024). To ensure safety, it is necessary to analyze the dynamic response of structures in water under the joint action of waves and currents. The first step is to obtain the wave current load acting on the structure. Existing research methods include analytical, experimental, and numerical simulation methods. The numerical wave current flume method is commonly used to study wave current loads on structures in water due to its cost and time-saving advantages, independence from scale effects, flexible modelling, and convenient measurement of results.
In recent years, there has been extensive research on numerical simulation and calculation of wave-flow coupling by scholars both domestically and internationally. Analysis of the influence of flow on linear and non-linear waves through the solution of the three conservation equations: mass, energy and momentum (Baddour and Song, 1990). They also studied the effect of flow on the flow velocity and depth of the flow field. The analysis of the mutual exchange of wave energy and water flow energy shows that wave height increases under the action of isotropic flow. It was concluded that this results in longer wavelengths and steeper wave steepness (Olmez and Milgram, 1995). This is consistent with the theoretical results (Da, 1986). The method of wave generation was modelled in a laboratory by creating waves through the boundary (Xiao et al., 2013). They introduced the inlet and outlet of water flow in the flume to simulate the wave-flow interaction. However, this method faces difficulties in solving the steady flow state. Additionally, the boundary wave generation method generates the secondary reflection problem when simulating the interaction between waves and structures. A two-dimensional wave-flow coupling model was established by adding a uniform velocity at the inlet boundary and a source function in the mass conservation equation (Zhang et al., 2014). However, it is important to note that the interaction between wave flow and structure belongs to a three-dimensional problem. Therefore, it is necessary to establish a three-dimensional wave-flow coupling model for wave-flow and structure interaction. A three-dimensional wave-current coupling model must be established to solve wave-current and load.
The study examined the force exerted by wave lapping on the bearing structure’s base when subjected to regular waves and water currents (Liu et al., 2013). They also examined the influence of group pile effect on the wave current force of the bearing. In recent years, computational fluid dynamics (CFD) technology has facilitated the use of numerical flumes in wave-current coupling research (Xu and Wei, 2019). This technology can effectively simulate the interaction between complex wave currents and structures. The study established a numerical flume by incorporating wave-structure interaction, boundary current and boundary wave generation (Kang et al., 2019). The study analyzed the spatial distribution of wave pressure on the wave-facing surface of the bearing platform in the same and opposite directions of wave flow (Wei et al., 2023). They also analyzed the spatial distribution of wave pressure on the wave-facing surface of the bearing platform at the peak of the horizontal wave current, under the same and opposite direction of the wave current. A three-dimensional numerical wave current model was established to investigate the impact of wave current on a high-pile bearing platform. The wave current force time-course curves were compared under the conditions of wave current in the same direction and reverse direction. The study focused on the impact of non-uniform terrain and inhomogeneous wave–current loads on an SFT (Xu et al., 2023). The study studied the Implications of wave–current interaction on the dynamic responses of a floating offshore wind turbine (Elobeid et al., 2023).
Since waves alone do not accurately reflect actual conditions and the role of nonlinear wave-current coupling for the offshore flexible photovoltaic involved in this paper is not clear, and the safety under extreme sea conditions is unknown, this paper adopts a viscous numerical tank to simulate the role of nonlinear wave-current coupling for offshore flexible photovoltaic under extreme sea conditions, which will provide a reference basis for further research on the safety performance.
2 Methodology
2.1 Numerical tank model parameters and meshing
FLUENT is a computer program used to simulate fluid flow with complex shapes and heat transfer. Because FLUENT is written in C, it has a great deal of flexibility and capability, and it offers complete mesh flexibility.
Determining which wave theory to use is crucial for the simulation. The current wave theories are only applicable to their respective sea state conditions. The commonly used wave theories include Airy wave theory (also known as linear wave theory or sine wave theory), stokes higher order wave theory, circular cosine wave theory, and isolated wave theory. Each wave theory is based on assumptions and simplifications, which result in different theoretical calculations and applications. To determine the scope of each theory, researchers have conducted theoretical analyses and experimental observations. Linear waves are defined as Equation 1:
stokes waves are defined as Equation 2:
shallow water waves are defined as Equation 3:
where h is the water depth, L is the wavelength and H is the wave height. For the offshore PV in the eastern sea area of Wenzhou City included in this paper, the extreme wave height of one in 50 years is taken (Hu, 2019), and the wave parameters are shown in Table 1:
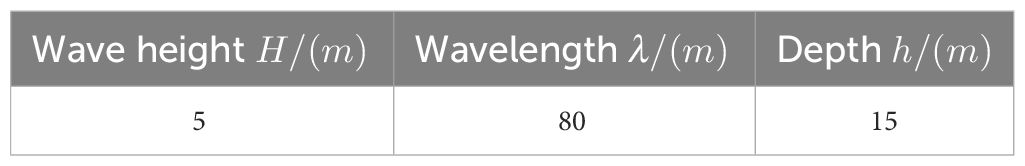
Table 1 Parameters of wave simulating.
This is obtained by calculation:
thus, conforming to the definition of a stokes wave. And since . Therefore, it belongs to transition wave, and stokes wave theory is chosen for simulation.
This paper describes the use of the ICEM module to create a three-dimensional numerical wave tank. The tank has a length of 620m, a width of 180m, and a height of 40m. The working area is 560m long and has a water depth of 15m. The wave dissipation area is twice the wavelength and the damping method used is damping dissipation. The type of damping chosen is Two Dimensional. Figure 1A shows the entire numerical tank in two dimensions, with G1, G2, and G3 representing the wave height monitors set at half wavelength, one wavelength, and 1.5 times the wavelength, respectively. The wave height monitors were set at one-fold wavelength and 1.5-fold wavelength. Figure 1B shows the geometric model of the fixed offshore flexible PV, which is a positive hexagonal shape, with a single pile radius of 3 m, a column height of 24 m, a column-to-column spacing of 36 m and a PV column distance of 160 m from the inlet. Figure 2 uses a structured grid for meshing and includes 500 grid numbers in the free liquid level wave height range and 3200 grid numbers per unit wavelength. The meshing of the boundary surface uses a hexahedral mesh due to its regularity, while the cylindrical area requires a tetrahedral unstructured grid due to its irregularity. Within the range of the free liquid surface wave height, the number of grids is increased by a factor of 100 for each unit wave height. The number of grids is encrypted by 3200 for the unit wavelength, and the mesh size of the wave-absorbing area gradually becomes sparser. This reduces the number of grids while enhancing the numerical dissipation, thereby strengthening the wave dissipation effect. Table 2 compares the wave height error under different grid numbers. Table 2 shows that increasing the number of grids results in a gradual decrease in wave height error. However, this also significantly increases computation time. For the simulation, 2,470,000 grids were selected.
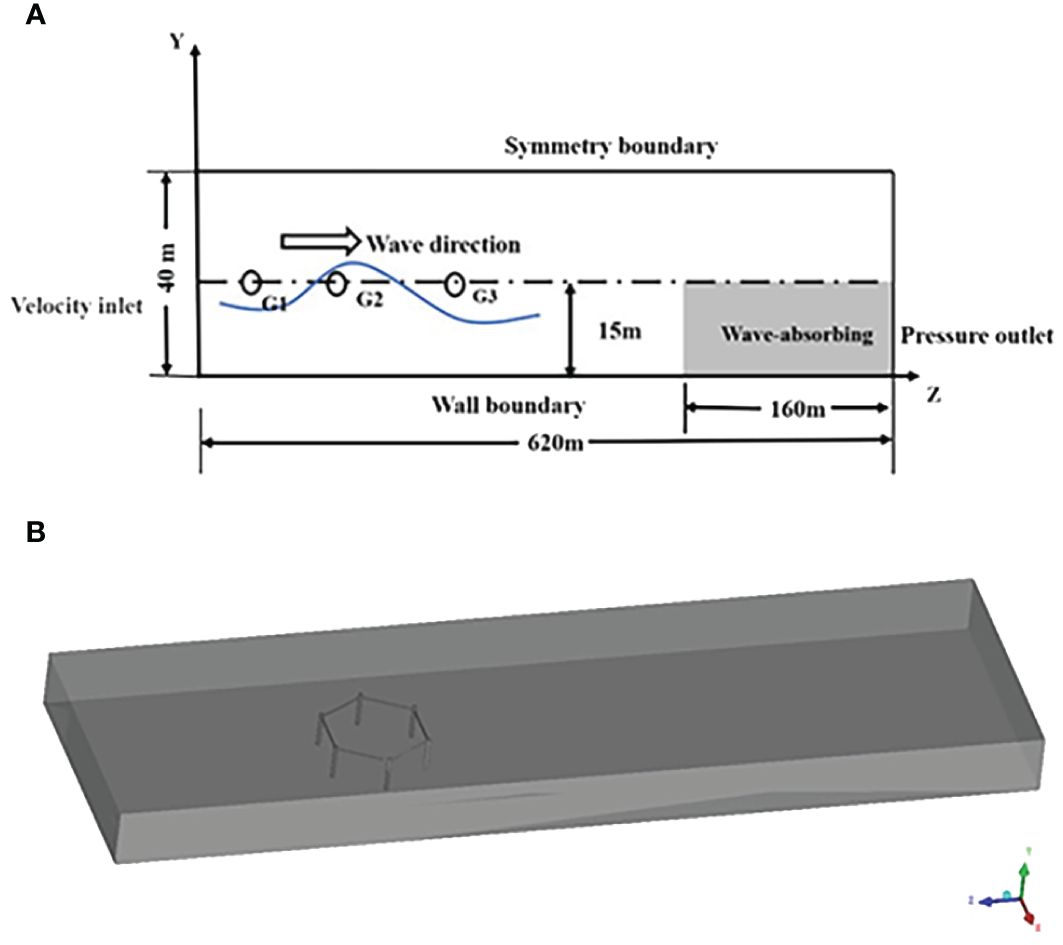
Figure 1 Numerical wave tank model. (A) Numerical tank side view. (B) Geometric model.
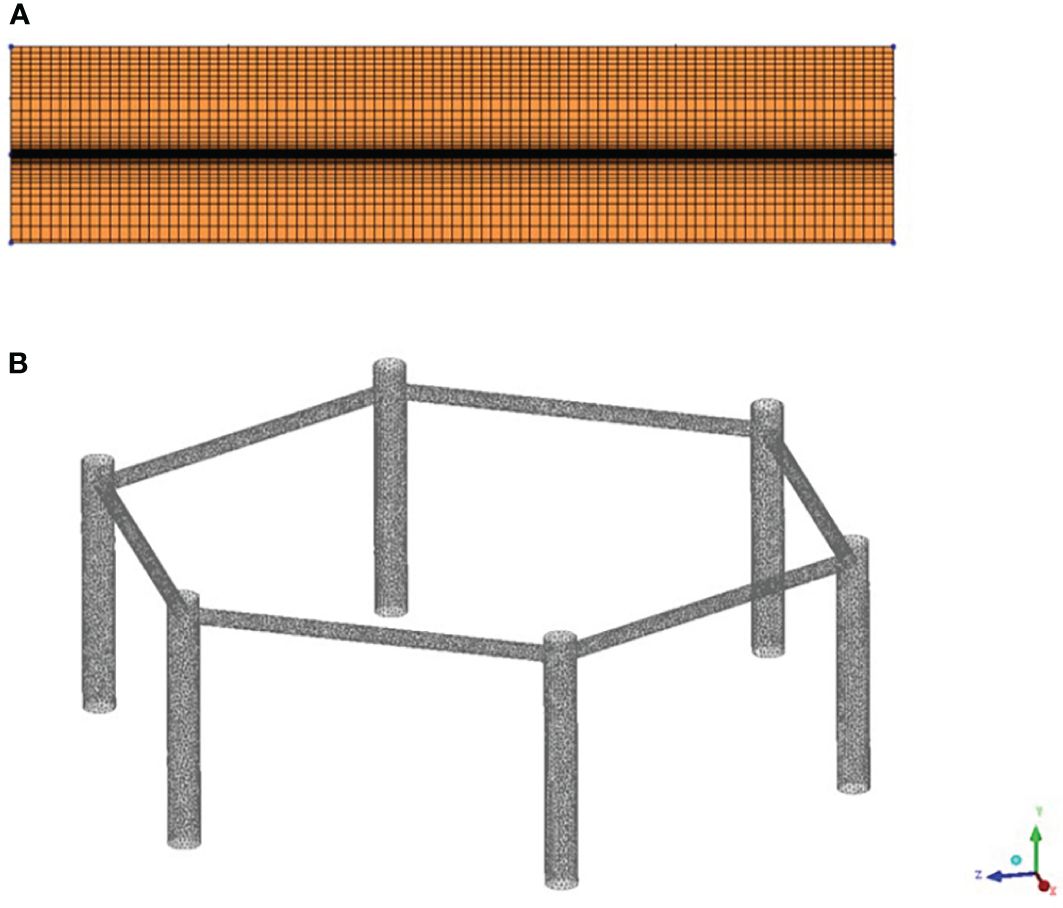
Figure 2 Model meshing. (A) Front view of numerical tank meshing. (B) Offshore photovoltaic grid division.

Table 2 Grid-independent verification.
2.2 Boundary conditions and calculation parameter settings
Boundary conditions of the 3D numerical wave tank established in this paper are shown in Table 3, and the wave generation, propagation and absorbing are achieved by Open Channel Flows in FLUENT software.
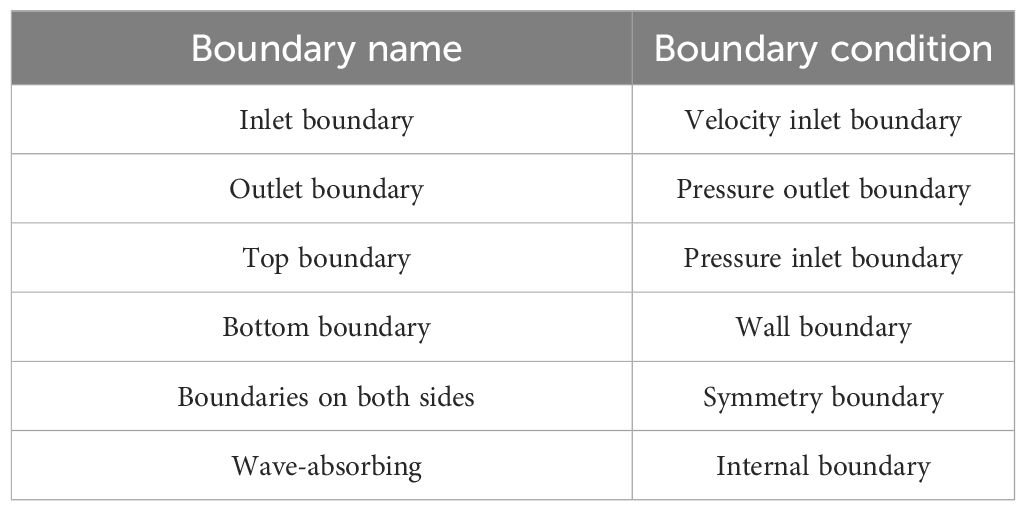
Table 3 Boundary condition setting in numerical tank.
This paper employs a two-phase flow model to simultaneously solve for water and air motions. The controlling equations are the incompressible continuity equation and the time-averaged Navier-Stokes equation. The volume function in the volume of fluid (VOF) must satisfy the convection equation. The model adheres to the Cartesian coordinate system, with the coordinate origin situated at the left rear corner point of the flume. The x-axis points in the positive direction of wave propagation, the y-axis in the vertical direction, and the z-axis along the width of the flume. The control equations are as follows:
Equation 4 is the continuity equation, U is the velocity vector; Equation 5 is the momentum equation, is the effective vortex viscosity coefficient taking into account molecular dynamics viscosity and turbulence. is the correction pressure, , z is the position vector, is the surface tension coefficient, the usual value is 0.7, is the mean curvature of the free surface, , Surface tension has minimal impact on coastal engineering problems. is the fluid volume function; Compared to the classical Navier-Stokes equation, the momentum equation has two additional terms on the right-hand side, is a distributed wave source term, is an extinction term, is the damping dissipation factor, is the fluid density.
In this paper, the turbulence model adopts the k-epsilon model, the implicit discrete format is selected, the implicit volume force is selected, then the PISO algorithm is used for the solution, the momentum, turbulent kinetic energy and turbulence dissipation rate are selected as second-order upwind, the residual margin of the control equations is taken as 10-3, the number of time steps is set to 2000, and the length of the time step is set to 0.05s.
In this paper, the turbulence model adopts the k-epsilon model, the implicit discrete format is selected, Offshore PV boundary conditions are rigidly fixed, the implicit volume force is selected, then the PISO algorithm is used for the solution, the momentum, turbulent kinetic energy and turbulence dissipation rate are selected as second-order upwind, the residual margin of the control equations is taken as 10-3, the number of time steps is set to 2000, and the length of the time step is set to 0.05s, max interactions is 20.
The ocean current is a large-scale and relatively stable flow of seawater that is affected by wind stress, geostrophic deflection force, and tidal attraction force. It is characterized by different densities resulting from thermal radiation, evaporation, precipitation, and cold shrinkage. In the process of joint wave-current interaction, the characteristics of wave height, wavelength and flow velocity and other flow field elements are particularly important to reveal the mechanism of wave-current interaction. The fifth order stokes wave is coupled with the water flow, and for the mechanism of wave-current interaction, The study proposes a theory of the flow velocity field under the joint action of waves and currents, As a result of wave-current interactions, the cross sectional flow velocity distribution of the water changes from the logarithmic distribution law in the case of pure water flow to a uniform distribution (Li, 1983). The horizontal flow velocity value of the flow velocity field under the joint action of wave and water flow can be obtained by applying the superposition of the horizontal flow velocity values of wave and water flow, and the computational expression is as follows:
In Equation 6, is the horizontal current velocity of the combined wave-current field, is the horizontal current velocity of the wave field, is the horizontal current velocity of a uniform current field. The current rate is taken as 0.9m/s (Hu, 2019).
2.3 Numerical simulation and analysis of results
In order to verify the reliability of the Stokes 5th order wave simulation results, the comparison between the numerical wave and the theoretical wave is shown in Figure 3. The water body transitions smoothly from static to dynamic, the difference between the theoretical and numerical wave heights is 1.12%, the difference between the theoretical and numerical wave periods is 0.53%, and the numerical and theoretical waveforms match well after the waveforms are stabilized, which verifies the correctness of the waveform generation.
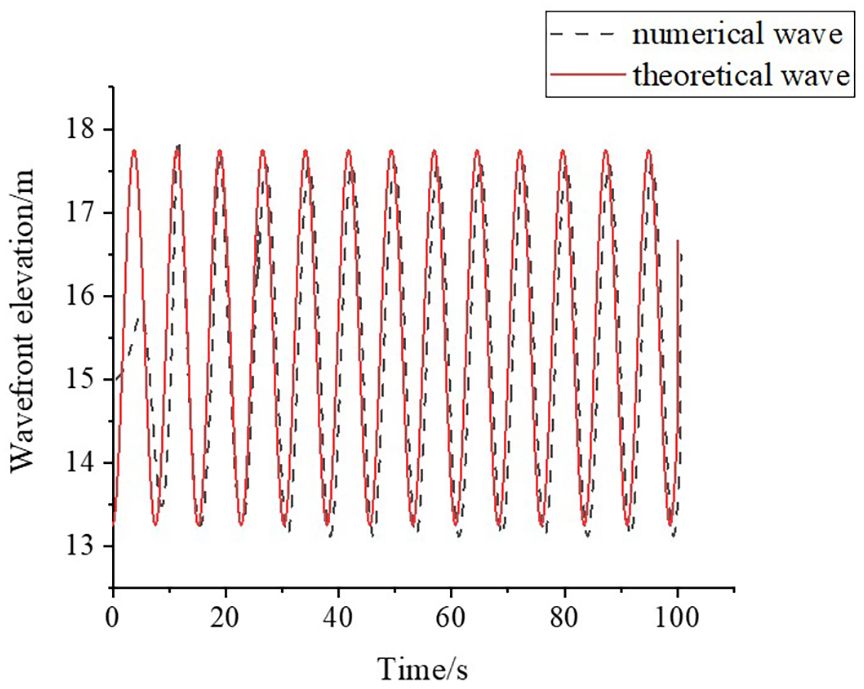
Figure 3 Time course of numerical and theoretical wavefront rise at double wavelengths.
2.4 Offshore flexible photovoltaic foundation column model
Flexible PV mounts are made up of flexible cables (wire ropes or steel strands), steel columns, steel beams and diagonal cables or inclined steel columns to form the support system. In this paper, the offshore flexible PV in Wenzhou City is studied as a background, as shown in Figure 4. Since waves only act on the foundation columns of the fixed offshore flexible PV, only the effect of wave-current coupling on the foundation columns is investigated. The model is simplified accordingly by neglecting the upper flexible cables and the PV panels. Figure 5 is the naming of offshore photovoltaic geometric foundation columns. To investigate the impact loads on the foundation column of the offshore flexible PV due to the wave-current coupling field, the monitoring points are placed on the foundation columns as shown in Figure 6 The height of P1 is 17m, the distance between the upper and lower spacings of P1-P5 is 1m, the distance between the upper and lower spacings of P6 and 7 is 45° from the column surface, and P8 is the monitoring point along the column. The height of P1 is 17m, the distance between the top and bottom of P1-P5 is 1m, P6 and 7 are at 45° along the column surface, P8 and 9 are at 90° along the column surface. The density of seawater is generally between 1.02 and 1.07 g/cm3, depending on temperature, salinity and pressure (or depth). In different sea areas, different latitude and longitude, different seasons are different, the density of seawater in this paper take 1.025 g/cm3.
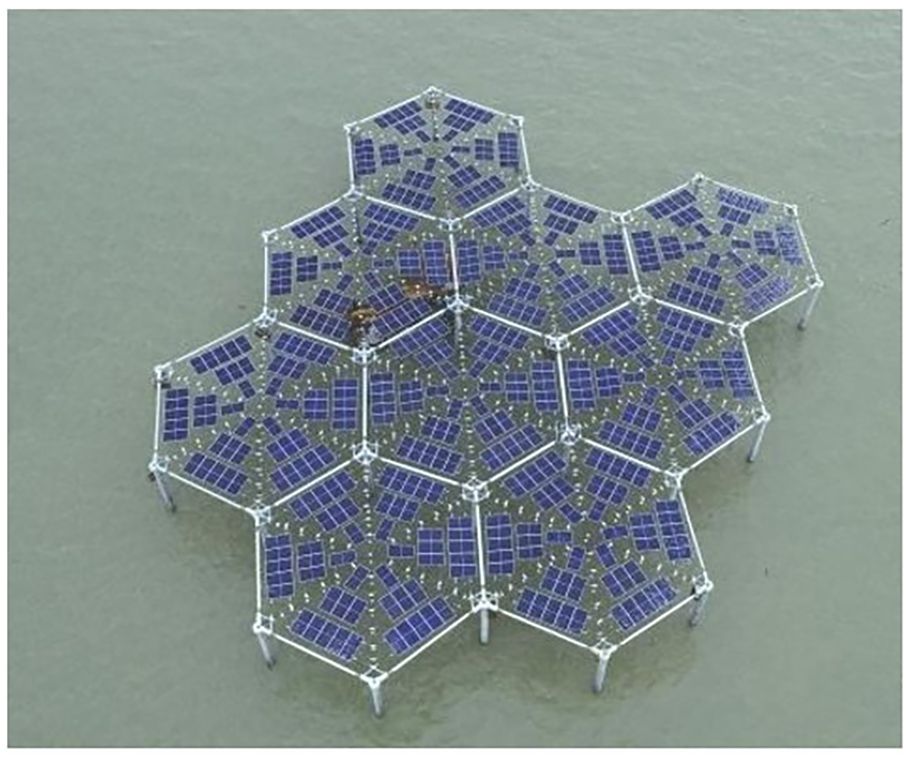
Figure 4 Wenzhou Offshore Flexible Photovoltaic Project.
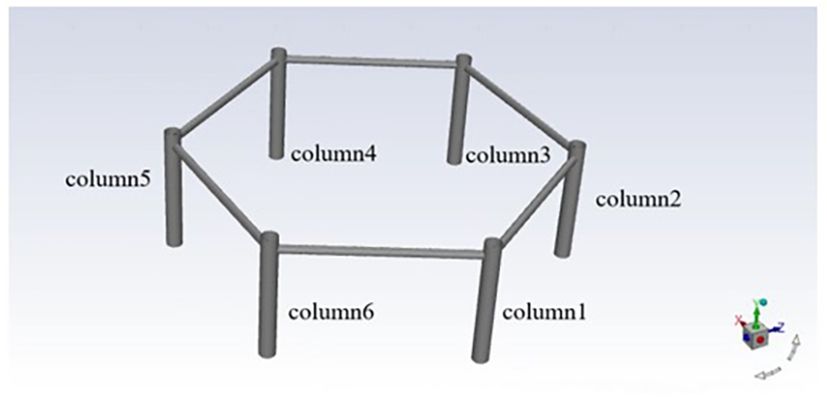
Figure 5 Schematic of offshore flexible PV geometric model.
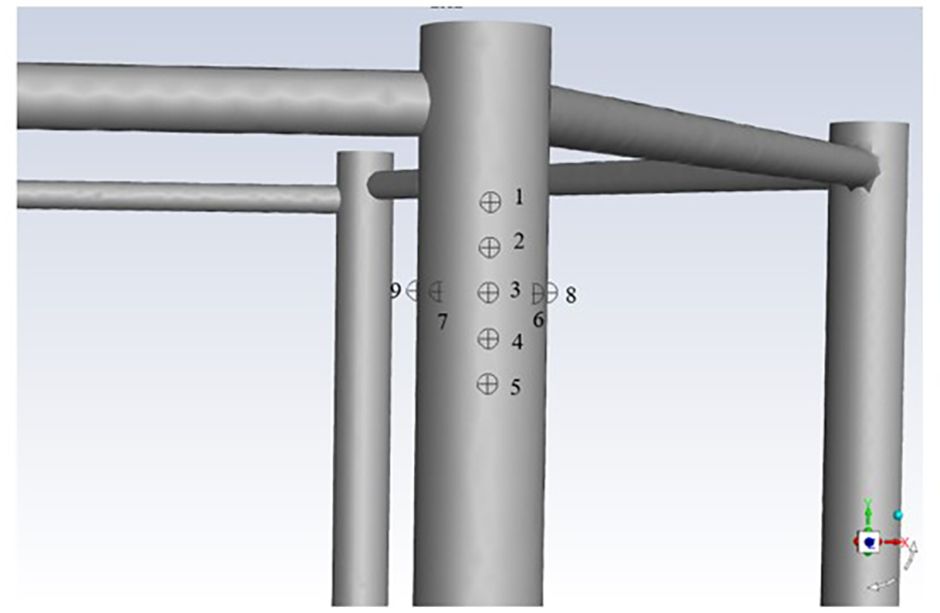
Figure 6 Offshore flexible photovoltaic monitoring point.
3 Numerical simulation results of offshore flexible photovoltaic foundation columns
3.1 Effects of wave incidence angle on structures
In order to investigate the effect of different wave incidence angles on the structure, the incidence angles are taken to be 0°, 30°, 60°, 90°, 120°, 150°, 180°, and the wave incidence angle is set to be α. Since the structure is a hexagonal shape with a high degree of symmetry, it is only necessary to take the incidence angles of 0° and 30° to represent the case of all the above wave incidence angles. The wave forces on the offshore flexible PV columns for wave incidence angles of 0° and 30°. It can be seen from the Figure 7 that the 0° incidence columns are closer to the velocity inlet than the 30° columns and therefore generate the horizontal force versus time curve earlier. α=0° Column 1 is subjected to a force of 1.231 times that of the α=30° columns, this is due to the fact that at α=0°, along the x-direction, columns 1 and column 6 are juxtaposed along the x-direction, whereas at α=0°, the wave action is applied at the same time as the wave arrives, which disperses the wave action on the foundation column.
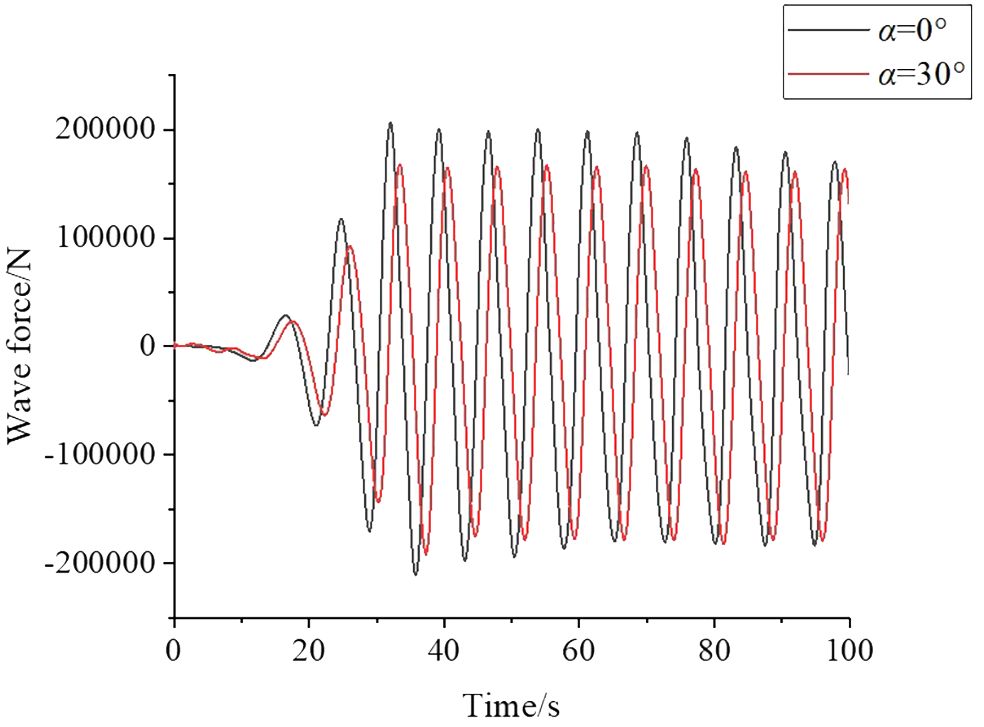
Figure 7 Time course of wave force in foundation column 1 for different wave incidence angles α.
As columns 1-3 are symmetrical to columns 4-6 when α=0°, only the wave forces for columns 1-3 are shown in Figure 8. Due to the blocking effect of the columns in front on the columns behind, the maximum wave force of column 1 is 1.15 times the maximum wave force of column 2 and 1.22 times the maximum wave force of column 3, and the maximum wave force of column 2 is 1.05 times the maximum wave force of column 3. Although column 3 receives the greatest total blocking effect from the columns in front of it, the blocking effect of column 2 on column 3 is greater than the blocking effect of column 1 on column 2. Figure 9 shows the wave force time histories of columns 1-4 when α=30°, the maximum wave force of column 1 is 1.12 times that of column 2, 1.21 times that of column 3 and 1.34 times that of column 4.
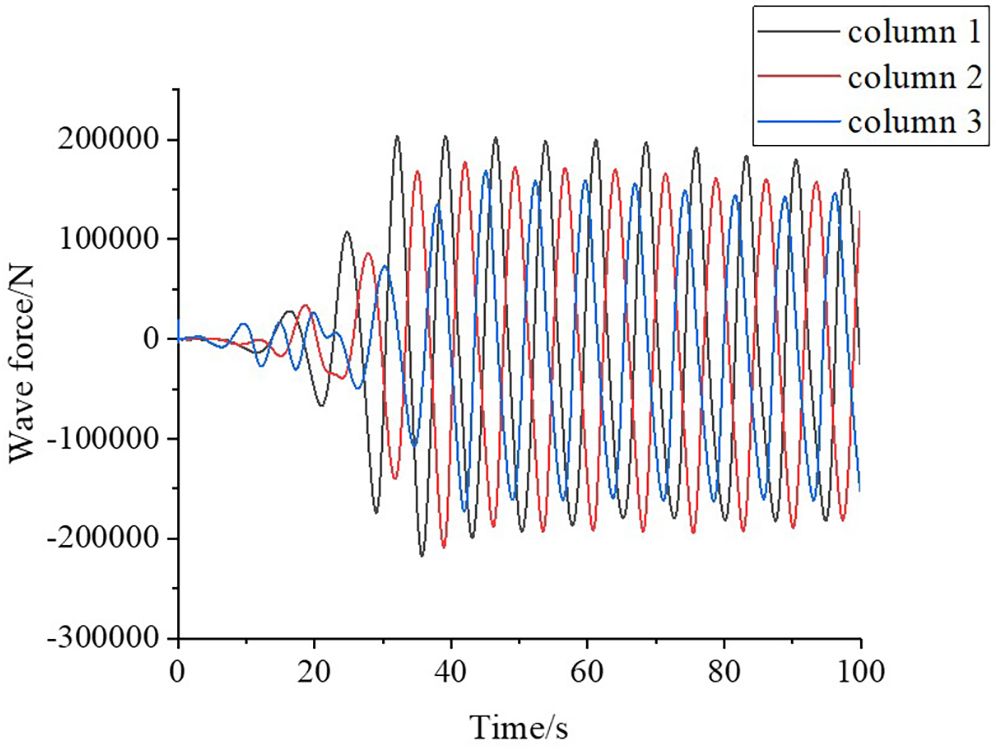
Figure 8 Time course of wave force on columns 1-3 for α=0° waves.
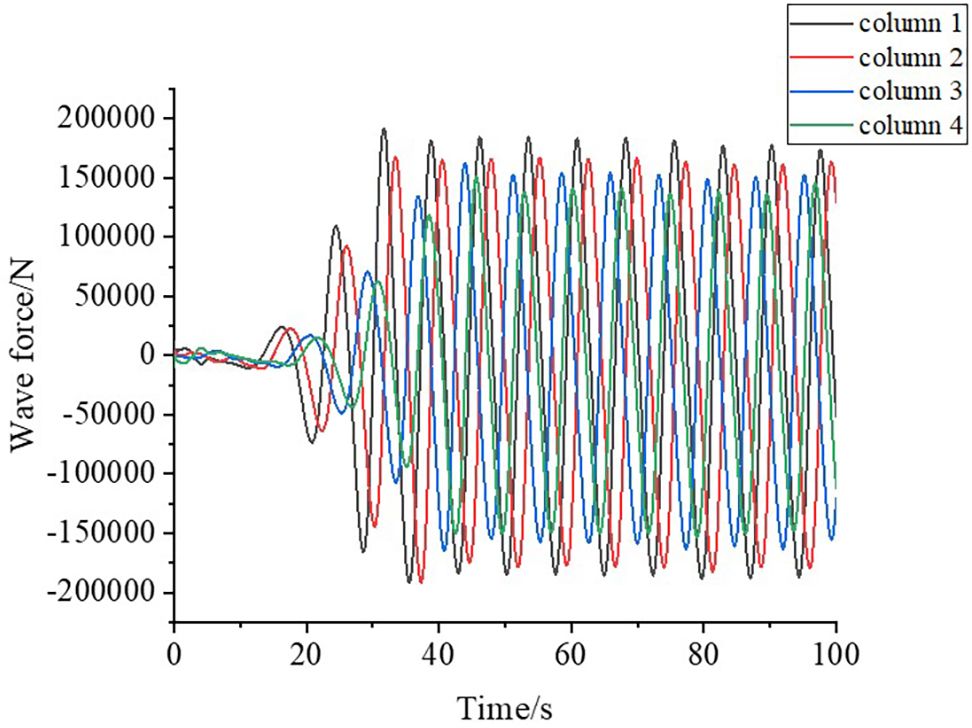
Figure 9 Time course of wave force on columns 1-4 for α=30° waves.
3.2 Combined numerical simulation of wave-current
To ensure that the results of the joint wave-current numerical simulation and the results of the separate wave numerical simulation are comparable, the geometric model, mesh delineation, boundary conditions, the hydrological properties and computational parameter settings of the joint wave-current numerical flow and computational parameter settings of the joint wave-current numerical channel are exactly the same as those of the numerical simulation of separate waves., and the wave dissipation setup of the same wave dissipation region as the wave field is carried out in the water phase, and because the negative current plays a blocking role on the waves, only the coupling between the downward current and the waves is considered, and the maximum effect of the wave-current coupling on the structure is considered.
Wave height is an important characteristic element in the wave propagation process, in order to more accurately analyze the effect of the flow field in the wave-current joint field on the wave height, the wave height of the wave-current coupling and the wave height of the wave alone at 0.5, 1, 1.5 times the wavelength are investigated, and it can be seen in Figure 10, the wave height of the wave-current coupling field is smaller than that of the wave alone, when at 0.5 times the wavelength and the wave under the effect of the same direction current wave height becomes 98.95% of the original wave height, at 1 times the wavelength, the wave-current wave height becomes 98.32% of the original wave height, at 1.5 times the wavelength, the wave height becomes 97.4% of the original wave height, which is due to the fact that the farther away from the inlet, the more adequate coupling between the wave and the current. And the period becomes 93.96% of the original due to the influence of the downstream current, which accelerates the wave speed. Wave clustering effects occur from 80s onwards, due to the partial transfer of wave energy to the air above and possible interactions between the waves, leading to some nonlinear effects.
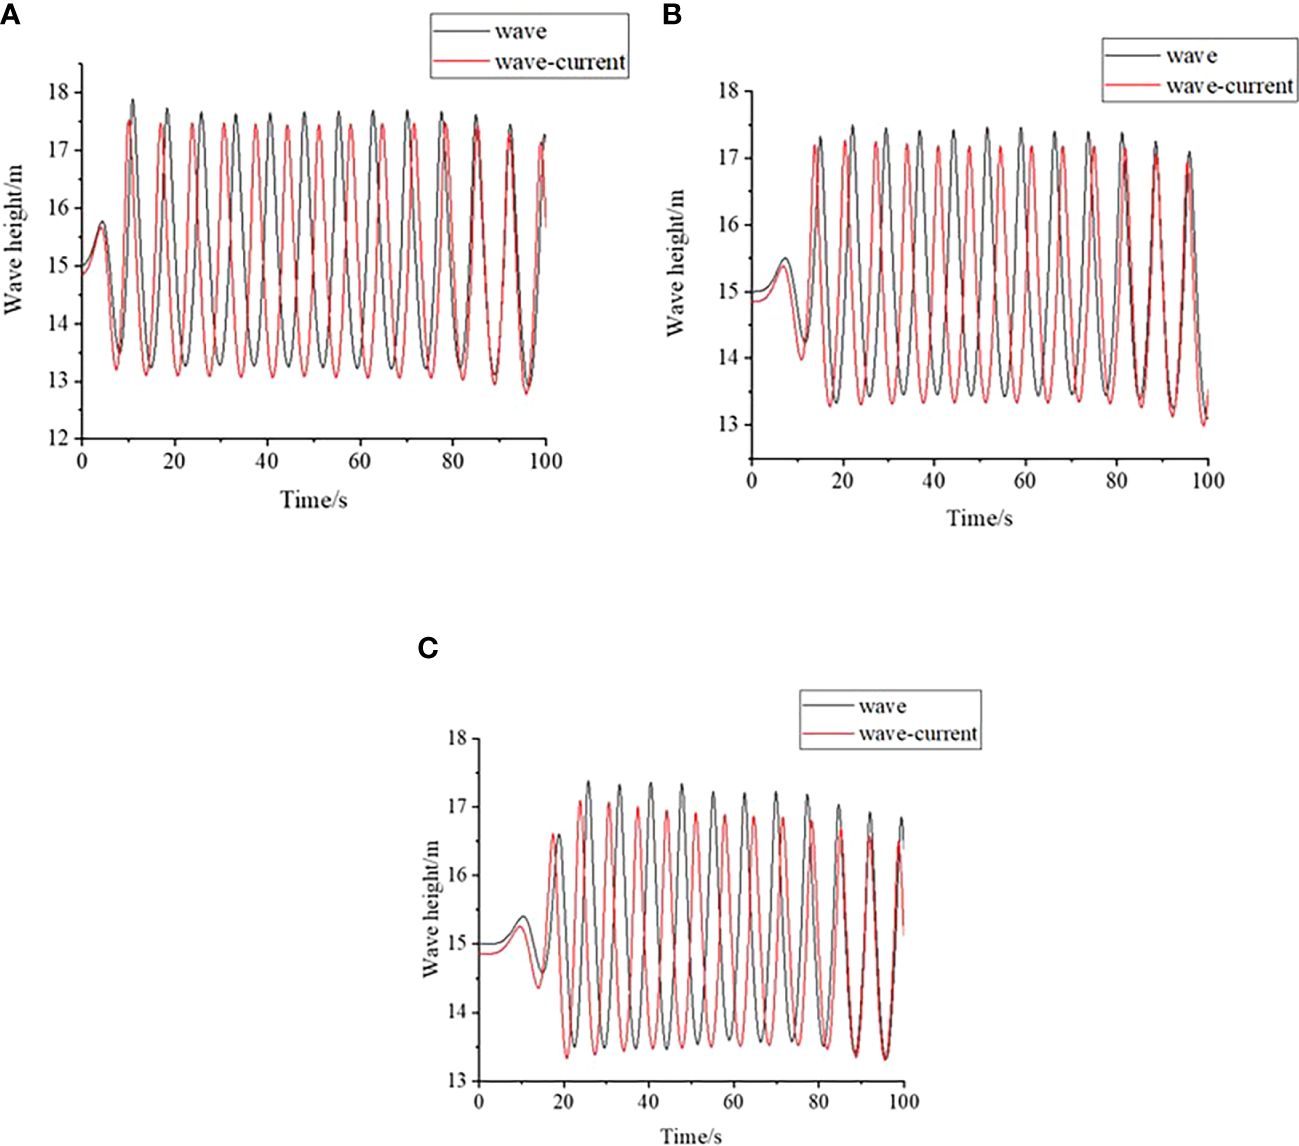
Figure 10 Wave height time history curves at different multiples of wavelengths. (A) Time course curve of wave height at 0.5 times wavelength. (B) Time-course profile of wave height at 1 times wavelength. (C) Time course curve of wave height at 1.5 times wavelength.
The total horizontal wave force is calculated by integrating the Morision formula on the cylindrical action surface. According to “Code for sea port hydrology”, the theoretical calculation formula of the wave force of cylindrical members is:
In Equation 7, according to the specification, is the drag force coefficient and has a value of 1.2. is the inertial force coefficient, which takes a value of 2.0 according to the specification; is the bulk density of water. The definitions of K1 and K2 are shown in Equation 8, in theoretical calculations, the total force of waves can be divided into the superposition of drag force and inertia force, that is Equation 9:
the phase and value of the maximum horizontal wave force :
, the occurrence phase is , Maximum value , the occurrence phase is , Maximum value
Figure 11 shows the comparison between the theoretical and numerical simulation values of wave force, the numerical simulation value of maximum wave force is 95.65% of the theoretical value. Since Morision is a half-theoretical and half-empirical formula, and this paper adopts the viscous flow theory, coupled with the fact that in the numerical simulation, the structure has a counteraction to the wave, and this paper involves the offshore PV has a number of foundation columns, and the theoretical value does not take into account the effect of the group of columns, therefore, the error is an acceptable range, and the method adopted in this paper is able to simulate the wave force in the actual situation better.
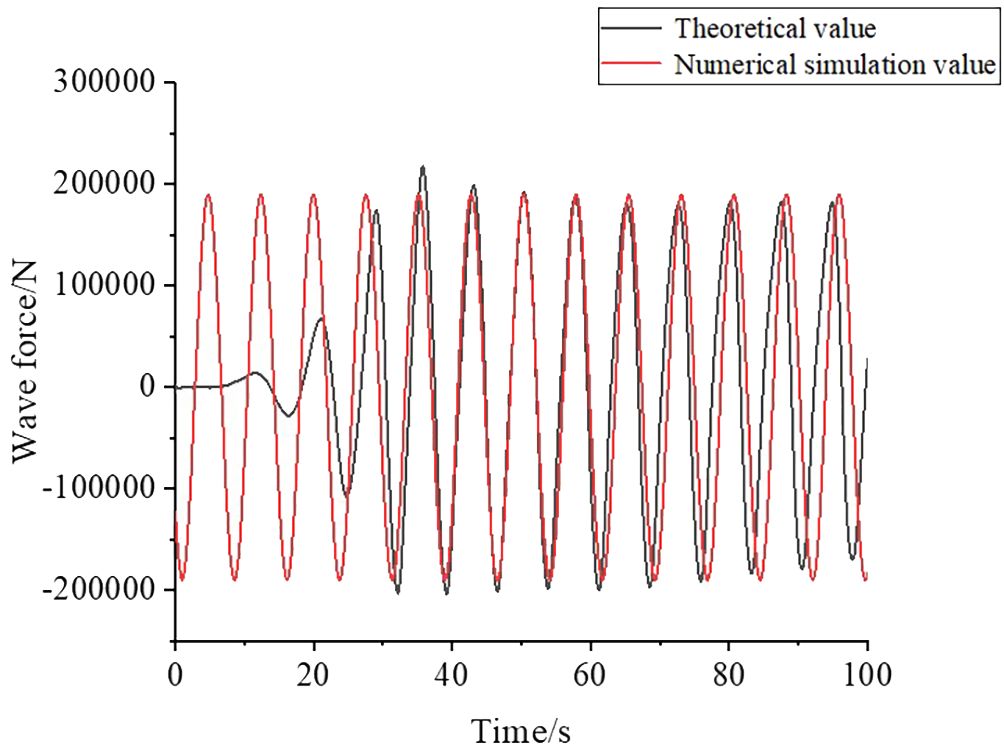
Figure 11 Comparison of wave force timescales.
Figure 12 shows the comparison of wave force between wave-current coupling and wave action alone. In the wave-current coupling, in the vicinity of the wave peak position, the horizontal velocity direction of the fluid mass point is in the same direction as along the wave propagation direction, and is strengthened under the action of isotropic current, so when the wave peak comes to the column by the positive horizontal force is larger compared to the separate wave action; in the vicinity of the wave trough position, the horizontal velocity of the fluid mass point is in the opposite direction of the wave propagation direction, and the velocity magnitude is suppressed under the action of isotropic current, and with the increase of the current velocity, the column is changed from negative value to positive value, so that when the wave trough comes to the column by the negative wave force. And with the increase of current velocity, the velocity of the fluid mass point is changed from negative value to positive value, so when the wave trough comes to the column subject to the reverse horizontal force and the wave alone becomes smaller, and when the current velocity is large enough to change the force from the reverse direction to the positive direction. The wave force under the action of wave-current coupling is 1.2 times, the wave force under the action of a separate wave.
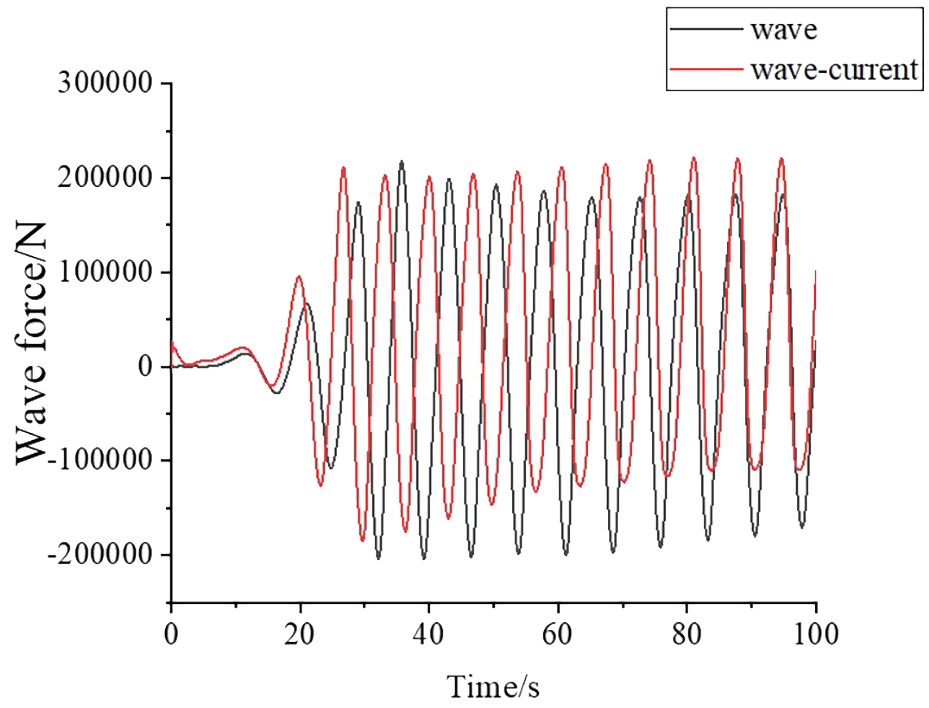
Figure 12 Wave force time-course curves for wave-current coupling and separate waves.
The Figure 13 illustrates that the wave peak has a stronger impact on the surface of the foundation column due to the acceleration of the wave propagation speed and the movement speed of the fluid particles. The height of the wave climbing on the surface of the foundation column is greater compared to when the wave acts alone.
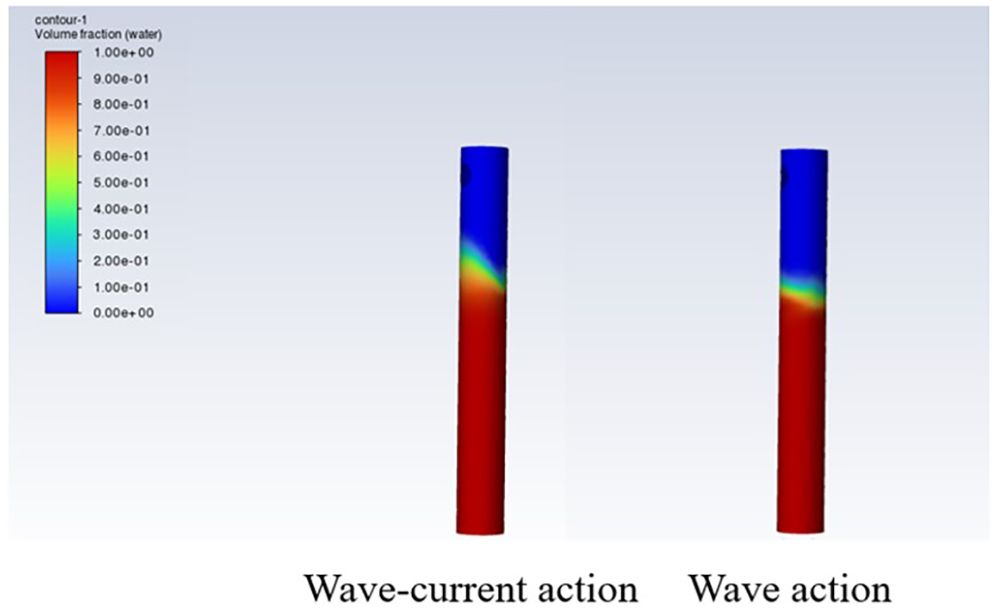
Figure 13 Comparison of volume fraction (water) at wave peak position.
Table 4 shows the comparison between the wave-current coupling effect and the linear superposition value of wave-current for different foundation columns. Because the linear superposition of the wave-current responses to the horizontal force does not fully reflect the changes in period caused by their coupling, it deviates from the actual environmental conditions. For example, the combined action of wave-current does not change the period of motion of the waves, and the propagation speed of the waves becomes faster in the case of longer wavelengths. The combined action of the velocity of the current and the velocity of the wave water quality point inevitably affects the drag force acting on the column. In the combined action of the wave-current, the horizontal velocity of the water quality point is approximately equal to the linear superposition of the respective horizontal velocities of the two. Since the drag force is proportional to the square of the velocity of the current, the drag force of the joint action is not equal to the linear superposition of the drag forces of the wave and the current. The combined effect of wave and current is on average 9.2% greater than the linear superposition of wave and current. When the peak of the wave passes the upright cylinder, the pressure difference generated by the water exerts a significant force on the cylinder. This force has a large horizontal component (Z) that can cause the cylinder to drift if it is not secured in place. As a result, the cylinder will oscillate laterally due to the lateral force.
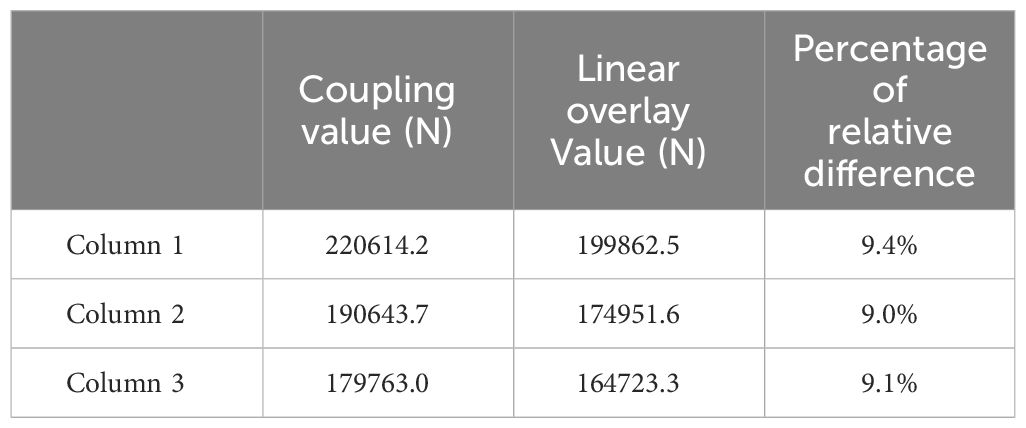
Table 4 Comparison between wave-current coupling value and linear superposition value.
3.3 Slamming loads on offshore flexible photovoltaics by wave-current coupling fields
Figure 14A shows the wave impact loads at different monitoring points along the height change of column 1 at α=0°. The slamming loads become larger with increasing depth in the range of wave height in the free side, and the incremental speed becomes gradually smaller. As can be seen in Figure 14B, the pressure at P6 and P8 is slightly larger than that at P7 and P9, which is due to the parallelism between column 1 and column 6, and the wave-current to the sides of two columns causes mutual cancellation, so for the points near the middle of the two columns, the impact loads are smaller than that of the full flow outside the two columns, and the pressure at P8 and P9 becomes smaller until the final equilibrium. Therefore, for the point near the center of the two columns, the slamming load is smaller than that of the full flow outside the two columns, and the pressure at P8 and P9 continues to decrease until the final equilibrium. Figure 15 shows the comparison of the pressure at different columns P1 and P2. The pressure at column 1 P2 is 1.08 times the pressure at column 2 P2 and 3.32 times the pressure at column 3 P2, so column 3 is subjected to more blocking. As the pressure at Pillar 2 P2 is greater than the pressure at Pillar 1 P1, the blocking effect of Pillar 1 on Pillar 2 is less than the effect of the height difference for a height difference of 1m. Since the pressure at column 3 P2 is less than the pressure at column 2 P1, the blocking effect of column 3 is greater than the effect of the height difference. First, the foundation columns facing the waves receive the highest impact loads at the lowest wave heights and should be given priority consideration.
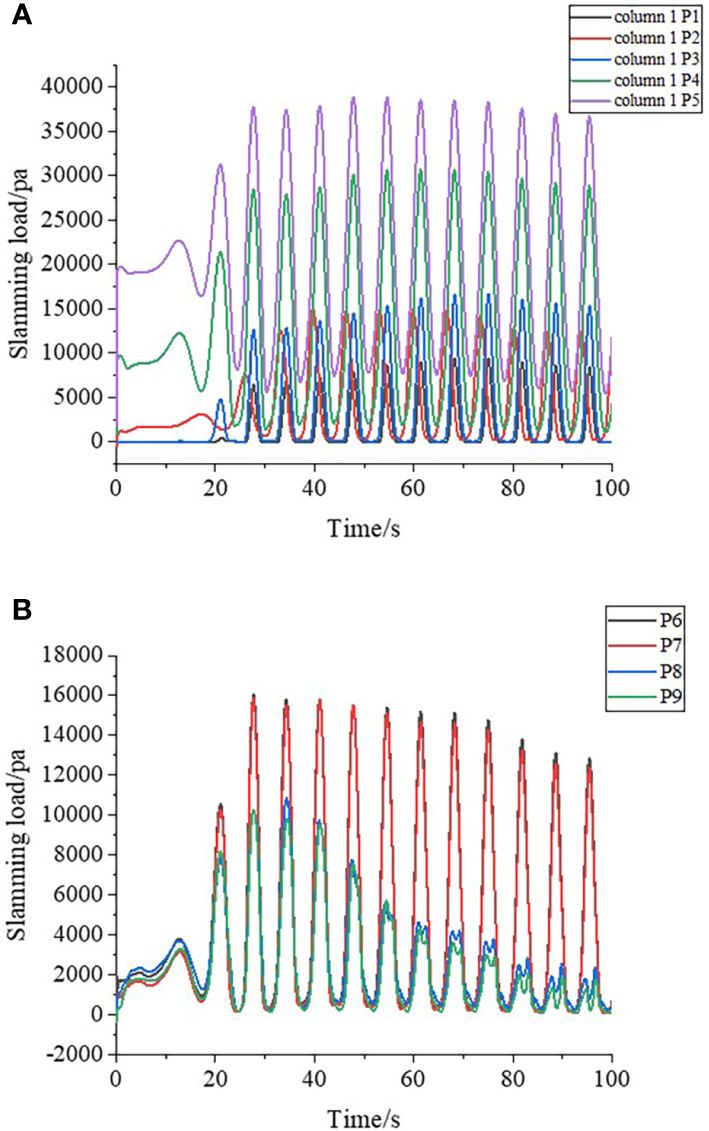
Figure 14 Time course of wave slamming loads at detection point of column 1. (A) P1-5 wave slamming loads timescales. (B) P6-9 wave slamming loads timescales.
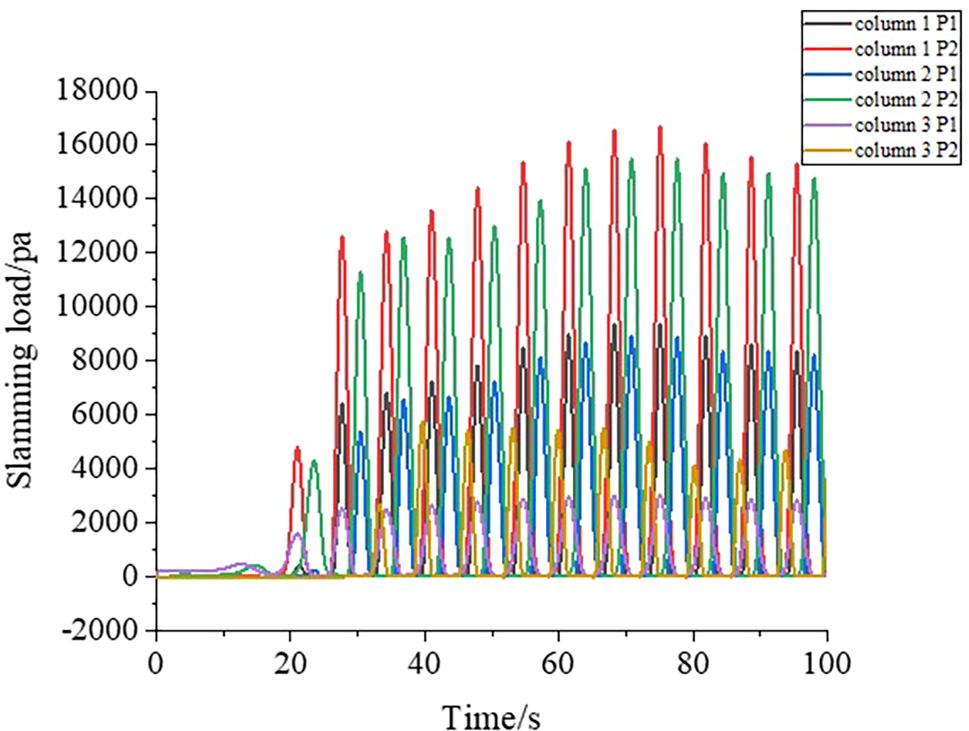
Figure 15 Time course of slamming loads for different columns P1 and P2.
4 Conclusions
This paper selects a nonlinear wave that is suitable for extreme working conditions by considering the applicable conditions of different types of waves. A three-dimensional numerical tank is established using ICEM for mesh-independence validation. Subsequently, a suitable method of wave and current coupling action is adopted for further studies. FLUENT is used to carry out the study of wave horizontal force and wave impact load on the offshore flexible PV foundation column under the action of wave-current coupling field, and the results of the study show that:
(1) Different wave incidence angles have inconsistent effects on the offshore flexible PV foundation columns considered in this paper, and the maximum wave force on the columns occurs at an incidence angle of 30°, which is 23.1% larger than that at an incidence angle of 0°, which should be given special attention.
(2) Under the combined wave-current loading, the maximum value of the horizontal force is larger than the maximum value of the linear superposition of the horizontal forces of the wave-current acting on the foundation column, respectively. This shows that for the coupled wave-current marine environmental loads, the joint action for marine structures cannot simply be linearly superimposed on their separate actions, and the joint action of wave-current is 9.2% greater than the linear superposition of wave-current.
(3) For the foundation columns considered in this paper, in the range of free liquid surface wave heights, the slamming loads becomes progressively larger and the incremental rate becomes progressively smaller. For the base column with α=0°, column 2 is subjected to a height difference greater than the blocking effect of the forward base column, while column 3 is subjected to a blocking effect of the forward base column greater than the effect of the height difference.
(4) This article does not consider the effect of wind on wave-current because it mainly investigates the effect of waves on foundation columns, and the role of wind-wave-current coupling can be further considered in later studies, additionally, irregular wave simulation can be performed.
Data availability statement
The raw data supporting the conclusions of this article will be made available by the authors, without undue reservation.
Author contributions
JZ: Formal analysis, Funding acquisition, Project administration, Resources, Supervision, Writing – original draft, Writing – review & editing. YL: Conceptualization, Data curation, Investigation, Methodology, Software, Validation, Visualization, Writing – original draft, Writing – review & editing.
Funding
The author(s) declare financial support was received for the research, authorship, and/or publication of this article. This work is supported by the National Natural Science Foundation of China (Grant No. 51979130, 52201323). This support is gratefully appreciated.
Acknowledgments
The authors would especially like to thank the School of Shipbuilding and Ocean Engineering, Jiangsu University of Science and Technology for providing support.
Conflict of interest
The authors declare that the research was conducted in the absence of any commercial or financial relationships that could be construed as a potential conflict of interest.
Publisher’s note
All claims expressed in this article are solely those of the authors and do not necessarily represent those of their affiliated organizations, or those of the publisher, the editors and the reviewers. Any product that may be evaluated in this article, or claim that may be made by its manufacturer, is not guaranteed or endorsed by the publisher.
References
Ardhuin F., Gille S. T., Menemenlis D., Rocha C. B., Rascle N., Chapron B., et al. (2017). Small-scale open ocean currents have large effects on wind wave heights. J. Geophys. Res.: Oceans 122, 4500–4517. doi: 10.1002/2016JC012413
Baddour R. E., Song S. W. (1990). Interaction of higher-order hater waves with uniform currents. Ocean Eng. 17, 551–568. doi: 10.1016/0029-8018(90)90023-Y
Benjamin T. B., Feir J. E. (1967). The disintegration of wave trains on deep water Part 1. Theory. J. Fluid Mech. 27, 417–430. doi: 10.1017/S002211206700045X
China Electricity Council (2021) Research on Coordinated Development of New Energy and Energy Storage. Available online at: https://www.cec.org.cn/detail/index.html?3-305088.
Da H. Q. (1986). Wave Theory and its Application to Engineering (Beijing: Higher Education Press), 140–146.
Elobeid M., Pillai A. C., Tao L., Ingram D., Hanssen J. E., Mayorga P. (2023). Implications of wave–current interaction on the dynamic responses of a floating offshore wind turbine. Ocean Eng. 292, 116571. doi: 10.1016/j.oceaneng.2023.116571
Hu H. (2019). Hydrodynamic characteristic and calculating of wave-current forces of offshore wind power foundation in rudong (Zhoushan, Zhejiang: Zhejiang Ocean University). doi: 10.27747/d.cnki.gzjhy.2019.000273
Janssen T., Herbers T. (2009). Nonlinear wave statistics in a focal zone. J. Phys. Oceanogr. 39, 1948–1964. doi: 10.1175/2009JPO4124.1
Kang A. Z., Zhang J. W., Zhu B. (2019). Numerical simulation of interacting of oblique waves and currents and large-scale rectangular pile cap. World Bridge 47, 65–70.
Li Y., Draycott S., Adcock T. A. A., Van Den Bremer T. S. (2021a). Surface wavepackets subject to an abrupt depth change. Part II: experimental analysis. J. Fluid Mech. 915, A72. doi: 10.1017/jfm.2021.49
Li Y. C. (1983). Velocity field for interaction waves and current. Ocean Eng. 04, 12–23. doi: 10.16483/j.issn.1005-9865.1983.04.002
Li W. Y., Xiao Q. G., Zhen C. L. (2023). An overview of the policies and models of integrated development for solar and wind power generation in China. Res. Cold Arid Regions 15, 122–131. doi: 10.1016/j.rcar.2023.09.001
Li Y., Zheng Y., Lin Z., Adcock T. A. A., Van Den Bremer T. S. (2021b). Surface wavepackets subject to an abrupt depth change. Part I: second-order theory. J. Fluid Mech. 915, A71. doi: 10.1017/jfm.2021.48
Liu Z., Guedes Soares C. (2023). Sensitivity analysis of a numerical model of the dynamics of gravity cages subjected to current and waves. Ocean Eng. 287, 115715. doi: 10.1016/j.oceaneng.2023.115715
Liu Z., Guedes Soares C. (2024). Numerical study of rope materials of the mooring system for gravity cages. Ocean Eng. 298, 117135. doi: 10.1016/j.oceaneng.2024.117135
Liu H., Wang B. L., Xue L. P., He Y. P. (2013). Recent progress in wave-current loads on foundation structure with piles and cap. Appl. Math. Mech. 34, 1098–1109. doi: 10.3879/j.issn.1000-0887.2013.10.010
Meng S., Sun R., Guo F. (2022). Does the use of renewable energy increase carbon productivity? ——an empirical analysis based on data from 30 provinces in China. J. Clean. Product. 365, 132647. doi: 10.1016/j.jclepro.2022.132647
Olmez H. S., Milgram J. H. (1995). Nonlinear energy transfer to short gravity waves in the presence of long waves. J. Fluid Mech. 289, 199–226. doi: 10.1017/S0022112095001303
Onorato M., Residori S., Bortolozzo U., Montina A., Arecchi F. T. (2013). Rogue waves and their generating mechanisms in different physical contexts. Phys. Rep. 528, 47–89. doi: 10.1016/j.physrep.2013.03.001
Shen J., Tang P., Zeng H. (2020). Does China’s carbon emission trading reduce carbon emissions? Evidence listed firms. Energy Sustain. Dev. 59, 120–129. doi: 10.1016/j.esd.2020.09.007
Shen J., Gou Y., Teng B. (2012). Numerical simulation of the interaction between waves and floating elastic plate. Eng. Mech. 29, 287–294. doi: 10.6052/j.issn.1000-4750.2011.05.0292
Shi W., Yan C. J., Ren Z. R., Yuan Z. M., Liu Y. Y., Zheng S. M., et al. (2023). Review on the development of marine floating photovoltaic systems. Ocean Eng. 286, 115560. doi: 10.1016/j.oceaneng.2023.115560
Shrira V. I., Slunyaev A. V. (2014). Trapped waves on jet currents: asymptotic modal approach. J. fluid mech. 738, 65–104. doi: 10.1017/jfm.2013.584
Trulsen K., Raustøl A., Jorde S., Bæverfjord Rye L. (2020). Extreme wave statistics of long-crested irregular waves over a shoal. J. Fluid Mech. 882, R2. doi: 10.1017/jfm.2019.861
Trulsen K., Zeng H. M., Gramstad O. (2012). Laboratory evidence of freak waves provoked by non-uniform bathymetry. Phys. Rev. Fluids 24, 097101. doi: 10.1063/1.4748346
Wang C., Cheng X., Shuai C., Huang F. B., Zhang P., Zhou M., et al. (2020). Evaluation of energy and environmental performances of solar photovoltaic-based targeted poverty alleviation plants in China. Energy Sustain. Dev. 56, 73–87. doi: 10.1016/j.esd.2020.04.003
Wei K., Hu K. Y., Zhou C. (2023). Hydrodynamic Pressure distribution characteristics the Upstream Surface of Elevated Pile Caps with Rectangular Cross-sections Under wave-current interaction. China Highway J. 36, 357–367. doi: 10.19721/j.cnki.1001-7372.2023.10.028
White B., Fornberg B. (1998). On the chance of freak waves at sea. J. fluid mech. 335, 113–138. doi: 10.1017/S0022112097007751
Xiao H., Huang W., Tao J., Liu C. G. (2013). Numerical modeling of wave-current forces acting on horizontal cylinder of marine structures by VOF method. Ocean Eng. 67, 58―67. doi: 10.1016/j.oceaneng.2013.01.027
Xu G. J., Chen X., Xue S. H., Townsend J. F., Chen X. B., Tang M. L. (2023). Numerical assessment of non-uniform terrain and inhomogeneous wave–current loading effects on the dynamic response of a submerged floating tunnel. Ocean Eng. 288, 115942. doi: 10.1016/j.oceaneng.2023.115942
Xu B., Wei K. (2019). Numerical simulation of wave forces on elevated pile cap of sea−crossing bridges based on RANS. Railway Stand. Design 63, 79–84. doi: 10.13238/j.issn.1004-2954.201902250002
Yan C. J., Shi W., Han X., Li X., Verma A. S. (2023). Assessing the dynamicbehavior of multiconnected offshore floating photovoltaic systems under combined wave-wind loads: A comprehensive numerical analysis. Sustain. Horizons 8, 100072. doi: 10.1016/j.horiz.2023.100072
Yan K., Zou Z. L., Li X. L. (2013). The results contrast with different theory formula of second-order diffraction wave force. Eng. Mech. 30, 28–34. doi: 10.6052/j.issn.1000-4750.2011.12.0833
Ye H., Li W., Lin S., Ge Y. Y., Lv Q. T. (2024). A framework for fault detection method selection of oceanographic multi-layer winch fibre rope arrangement. Measurement 226, 114168. doi: 10.1016/j.measurement.2024.114168
Zhang Z., Chen H. (2022). Dynamic interaction of renewable energy technological innovation, environmental regulation intensity and carbon pressure: evidence from China. Renewable Energy 192, 420–430. doi: 10.1016/j.renene.2022.04.136
Zhang J., Ma Y., Tan T., Dong G., Benoit M. (2022). Enhanced extreme wave statistics of irregular waves due to accelerating following current over a submerged bar. J. Fluid Mech. 954, A50. doi: 10.1017/jfm.2022.1022
Zhang J. S., Zhang Y., Jeng D. S., Liu P. L. F., Zhang C. (2014). Numerical simulation of wave-current interaction using a RANS solver. Ocean Eng. 75, 157―164. doi: 10.1016/j.oceaneng.2013.10.014
Zheng Z., Li Y., Ellingsen S. A. (2023). Statistics of weakly nonlinear waves on currents with strong vertical shear. Phys. Rev. Fluids 8, 014801. doi: 10.1103/PhysRevFluids.8.014801
Keywords: offshore photovoltaic, numerical simulation, wave-current coupling, slamming loads, nonlinear wave
Citation: Zhang J and Lou Y (2024) Study of wave-current coupling on offshore flexible photovoltaic foundation columns. Front. Mar. Sci. 11:1387353. doi: 10.3389/fmars.2024.1387353
Received: 17 February 2024; Accepted: 22 March 2024;
Published: 03 April 2024.
Edited by:
He Li, University of Lisbon, PortugalReviewed by:
Zhongchi Liu, University of Lisbon, PortugalJialong Jiao, South China University of Technology, China
Shan Wang, University of Lisbon, Portugal
Wei Shi, Dalian University of Technology, China
Ray-Yeng Yang, National Cheng Kung University, Taiwan
Copyright © 2024 Zhang and Lou. This is an open-access article distributed under the terms of the Creative Commons Attribution License (CC BY). The use, distribution or reproduction in other forums is permitted, provided the original author(s) and the copyright owner(s) are credited and that the original publication in this journal is cited, in accordance with accepted academic practice. No use, distribution or reproduction is permitted which does not comply with these terms.
*Correspondence: Yibing Lou, 1065351676@qq.com