Research on floating body resistance characteristics of floating photovoltaic and analysis of influencing factors
 Hao Wang
  Xiaolei Liu
 Kan Wang
- College of Ocean Science and Engineering, Shanghai Maritime University, Shanghai, China
The floating structure of floating photovoltaic can be attached by aquatic organisms, resulting in changes in the draft depth of the floating body, which can affect the resistance characteristics of the floating body at different water velocities. The analysis for the characteristics of flow field is the key to revealing the change law of resistance under different conditions. The k-ϵ turbulence model which has been verified by water channel experiment is used to research the influence of draft depths, velocities and number of floating bodies for the drag in the paper. The research results show that the draft depth has more influence on the drag of the single floating body than on the velocity of water flow. The main reason is that the separation of the boundary layer produces a larger separation bubble, which increases the pressure difference between the front and back surfaces of the floating body, leading to a larger entrainment range and reflux velocity in the wake. The high flow velocity will enlarge the influence of the draft depth on the drag. The shielding effect of the tandem floating bodies is reflected in the non-uniform fluctuation of velocity and pressure along the flow direction, which affects the wake development of the tandem floating bodies, resulting in the typical spatial characteristics of resistance at different positions. The increase of the number of tandem floating bodies will further expand the difference of flow field, which can affect the resistance distribution law. The research results can provide theoretical support for the stability design of floating photovoltaic.
1 Introduction
As traditional fossil energy reserves continue to decline due to continuous consumption, countries around the world are developing new energy sources to reduce their dependence on fossil fuels and mitigate the negative impact on the environment (Zou T. et al., 2023). In recent years, new forms of energy represented by solar energy have developed rapidly. In particular, the installed solar capacity has exceeded 392 GW in China, accounting for more than a third of the global total (Bai et al., 2024). However, traditional photovoltaic applications generally rely on land, which are vulnerable to restrictions on land resources, environmental issues and related policies (Bukhary et al., 2018; Heinrichs et al., 2021 and Lyrio et al., 2020). The surface space of water has long light time and less occlusion. In this regard, people have started to transfer the photovoltaic application scenarios to the vast surface space of water in recent years. Various reservoirs, lakes, coal mining subsidence areas, oceans, etc., have emerged as application objects of aquatic photovoltaic (Spencer et al., 2019 and Choi K. et al., 2016).
When any object exists on the water surface or bottom for a long time, it will attach to a large number of aquatic organisms, thus changing the flow characteristics of the object in the water (Liu and Guedes Soares, 2023; Zou Y. et al., 2023; Ye et al., 2024 and Liu and Guedes Soares, 2024) (Figure 1). Floating photovoltaic systems typically use a floating structure to anchor in a specific area on the water surface. Due to prolonged exposure to water, a large number of aquatic organisms may attach to the bottom of the floating structure, which can significantly alter its draft depth. The increase of draft depth means that the area of the floating body facing the incoming flow increases, which can cause the more complex vortex shedding phenomenon to generate large unsteady force under the action of different water velocities, seriously compromising the stability of the photovoltaic array system and the flow capacity of the water flow (Irwin, 2008). Therefore, it is of practical significance to study the variation rule and influence mechanism of the resistance of floating body structure under different factors.
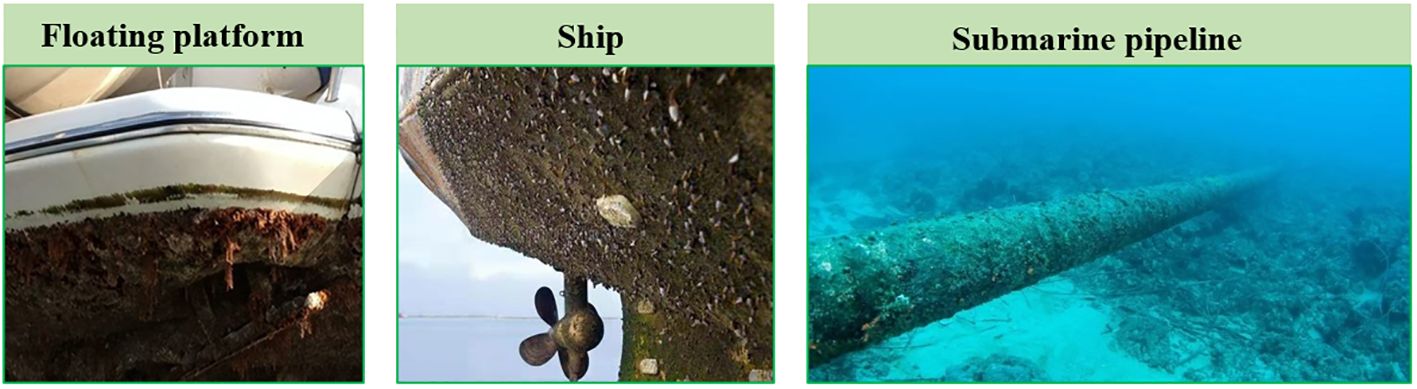
Figure 1 Structures attached to aquatic organisms. (https://cn.bing.com/images/search?q=Attachment%20of%20Marine%20organism&qs=n&form=BESBTB&sp=-1&lq=0&pq=attachment%20of%20marine%20organism&sc=10-29&cvid=37759EB5C83E4DFFAF64E5CFD001042C&ghsh=0&ghacc=0&first=1&ensearch=1).
The key to studying the resistance characteristics of floating body is to analyze the flow characteristics of floating body. Water flow around a floating body is actually a flow around the blunt plate. The typical flow characteristic of the flow around the plate is that the boundary layer separation occurs at the sharp corner of the fluid after contact with the plate, and then reattaches to the back part of the plate (Kiya and Sasaki, 1985; Hudy et al., 2007). The separation and reattachment of shear layer and the development of wake have important influence on the structure (Hourigan et al., 2001; Zhang and Liu, 2012; Nakamura et al., 1991). Tafti and Vanka (1991) conducted a numerical simulation to study the development of the stable laminar flow state around the blunt plate to the unstable state under medium Reynolds number conditions. The phenomenon of quasi-periodic vortices shed in the vicinity of the reattachment was observed. Yanaoka et al. (2002) studied the laminar separation and reattachment flow over a blunt flat plate in a square channel through numerical simulations. It was clarified from the present results that the reattachment length increases with an increase of Reynolds number and the flow, which becomes three-dimensional in the recirculation region becomes. Abdalla and Yang (2004) used large eddy simulation to study the transition behavior of the separated boundary layer on the leading edge of the blunt plate, and analyzed the characteristics of the changes of the velocity and pressure spectrum. Ohya et al (2006) studied the vortex shedding characteristics of plates with different chord thickness ratios at constant Reynolds number by finite difference analysis, and discussed the mechanism of instability of the impact shear layer. Stefan and Wolfgang (2008) investigated the unsteady response of the flow over a blunt plate to velocity perturbations introduced by local suction and blowing through a slot in the body surface, indicating distinct disturbance/shock-wave interactions in the subsonic region around the leading edge for both types of forcing. Lamballais et al. (2010) studied the boundary layer separation characteristics when the leading edge of a blunt plate was circular. Taylor et al. (2011) used modal analysis to explain the motion characteristics of vortices in the flow field of blunt plates. Sicot et al. (2012) employed PIV measurement method to study the separation and reattachment behaviors of boundary layer on the surface of a bluff plate under specific Reynolds number conditions. Then, the swirl intensity and Finite Time Lyapunov Exponents were used to detect and characterize the structure and dynamic characteristics of the vortices. Tenauda et al. (2016) analyzed the turbulent coherent structure of separation and reattachment over the blunt plate and the variation characteristics of its pressure field. A special compressible method was then used to describe the relationship between the pressure fluctuations around the separation bubble and the vortex dynamics. Hu and Liu (2018) used proper orthogonal decomposition (POD) and Extended POD to reveal the relationship between coherent vortices and wall physics of a flow over a finite blunt plate. Four typical coherent structures were found by using POD, namely, shedding mode, flapping mode, Karman mode and force mode. Deng et al. (2020) experimentally determined the interaction process between the separation bubble and the leading-edge collision vortex in the unsteady separation and reattachment flow on a finite dull plate, which was used to analyze the variation rule of DMD mode coefficient of wall pressure fluctuation. Researchers have used various analytical means to carry out in-depth research on different forms of blunt plate and obtained a lot of results due to the wide use of blunt plate. However, current studies largely focus on the phenomenon of flow around a blunt body when it is inside a flow field. The flow field will show significant turbulence characteristics including a variety of turbulence parameters with obvious differences under different external conditions when the blunt body is completely enveloped by the flow field. The phenomenon of flow over the body is not obvious when the blunt body is floating in the flow field, which can result in the low probability of significant vortex shedding. The floating body of floating photovoltaic exist on the water surface in semi-submersible mode, meaning that such small draft depth could not affect the free passage of water from the bottom of the floating body. The flow mechanism has not been studied yet. Therefore, the method and content of numerical simulation are introduced in the paper at first. Then, the resistance data of the floating body under a certain condition is obtained by a resistance experiment in the water channel, which is used to compare with the numerical simulation results to verify the correctness of the simulation results. The influence of flow field characteristics on the drag under different draft depths, water flow velocities and the number of floating bodies is studied by using the simulation model at last. The research can provide guidance for the design and analysis of floating photovoltaic system.
2 CFD calculation
2.1 Governing equations of the fluid flow
The study considers the fluid to be an incompressible continuous fluid due to the low water flow velocity. The solution for the fluid domain is obtained by solving the time-averaged continuity and momentum conservation equations of the incompressible Newtonian fluid during the interaction between water and the floating blunt body. The influence of turbulence pulsations is ignored, and the fluid density is determined to be constant in the Cartesian coordinate system. The mass and momentum conservation equations are in the form of dimensionless continuity equations and Navier-Stokes equations. The differential form is shown as follows Equations (1), (2):
where, s density of fluid; s dynamic viscous coefficient; and there time-averaged components of velocity; and are pulse components of velocity; is time-averaged pressure; is generalized term of momentum equation.
In the widely-used standard model of FLUENT, is turbulent kinetic energy and is turbulent dispassion rate, which can be expressed as the following Equations (3), (4):
The transport equations with unknown variables k and ϵ can be expressed as the following Equations (5), (6):
where, s an added term of ue to velocity gradient; s an added term of ue to buoyancy; re empirical constants; re user-defined source terms.
2.2 Model parameter
The model calculation region of the floating body of floating photovoltaic is shown in Figure 2 below. The resistance analysis model of tandem system with four floating bodies is taken as an example because of many calculation cases. The floating body is determined to be a square with side length equal to 0.5 m according to the size of the actual photovoltaic floating body and the experimental model. The distance between the two floating bodies is 0.2 m. The distance between the two sides of the floating body and the basin boundary is determined to be 0.5 m based on the actual size of the experimental water channel. The draft depths of the floating body are 0.03 m and 0.06 m, and the water depth is 1 m. The simulation experimental conditions are shown in Table 1 below:
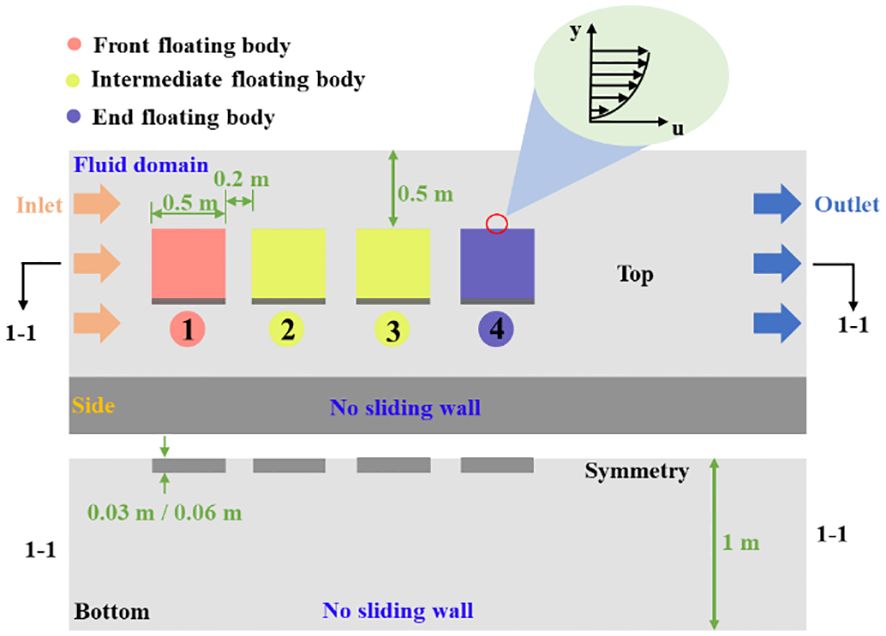
Figure 2 Schematic diagram of floating body modeling.
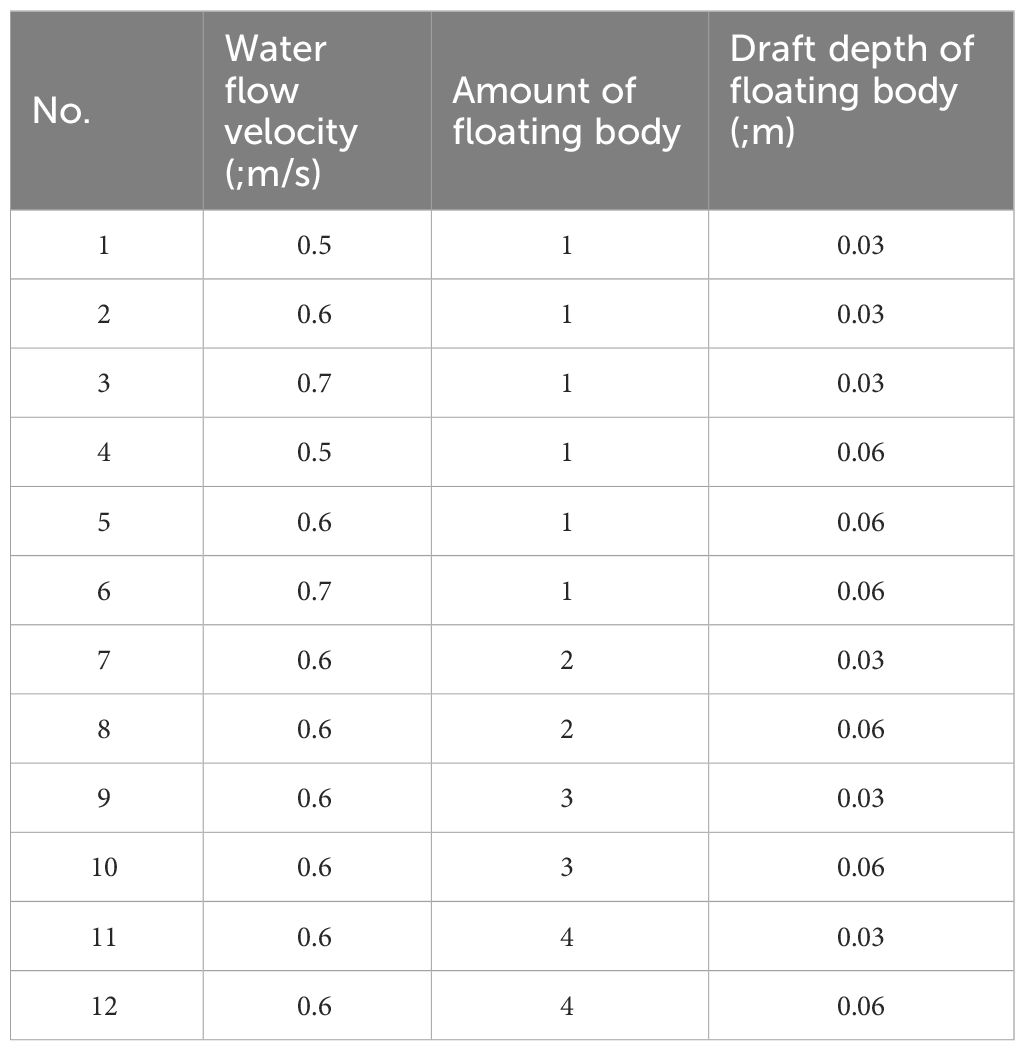
Table 1 Resistance calculation conditions of the floating bodies.
2.3 Mesh generation
A three-dimensional mesh model is established in the paper, and the hexahedral mesh is easy to converge is used in the whole computation domain. The multi-area meshing method is adopted around the floating body in order to avoid the calculation imprecision caused by the excessive aspect ratio of boundary layer. The wall mesh is encrypted by adding inflation layer. The suitable mesh size is found through the grid independence test. The grid height of the first layer is 5×10⁻⁴ m, and the grid extension ratio is 1.05. The total number of grids is 8495360.
2.4 Boundary conditions
The main boundary conditions include velocity inlet, pressure outlet, no-slip wall and slip wall. The left plane of the computational domain is set as the velocity inlet boundary defined by different water velocities (Figure 2). The right plane is treated as the pressure outlet boundary. The experiment is carried out in a water channel. The boundary conditions of the physical model are set to be consistent with the experimental conditions in order to verify the correctness of the numerical simulation method. Therefore, the two sides of the boundary and the bottom are the non-slip boundaries, and the top is the slip wall.
2.5 Numerical method
The calculation method is based on the finite volume method to discretize the control volume equation. The corresponding discrete equations obtained by integrating each control volume are solved to obtain the values of the flow field variables at all control points, which is considered to be easy to parallelize and has high discretization efficiency (Luan et al., 2011). An unsteady pressure-based solver is utilized. PISO algorithm is suitable for unsteady problems and is then used for pressure and velocity coupling (Li et al., 2017). The momentum, turbulent kinetic energy and dissipation rate of turbulent kinetic energy all adopt the second-order upwind discrete scheme (Song et al., 2019). The dimensionless step size is set to 0.0001 s to ensure the calculation accuracy.
2.6 Numerical model validation
The drag test experiments of a single floating body under different water velocities are carried out to verify the correctness of the numerical model. Experiments are conducted in a water channel 50 m long and 1 m wide. Foam panel is used instead of floating bodies, and plastic plates are used to control the spacing between the floating bodies during the experiment. Iron blocks are used as counterweights on the floating bodies, before adjusting the draft depth of the floating bodies by the weight of the iron blocks. The water flow velocity of the water channel was determined by a flowmeter. The floating body resistance in the flow field is measured using a tension sensor. The experimental system can be shown in Figure 3. The main experimental steps are as follows: (1) Adjust the water depth of the water channel to the predetermined height; (2) Calibrate the tension meter and connect the floating body and the tension meter; (3) Open the control system of the sink to determine the flow velocity of water by adjusting the operating frequency of the pump, and record water flow velocity corresponding to different frequencies; (4) Adjust the specified water flow velocity according to the experimental plan, and record the total resistance of the floating body system after the velocity of water remains stable.
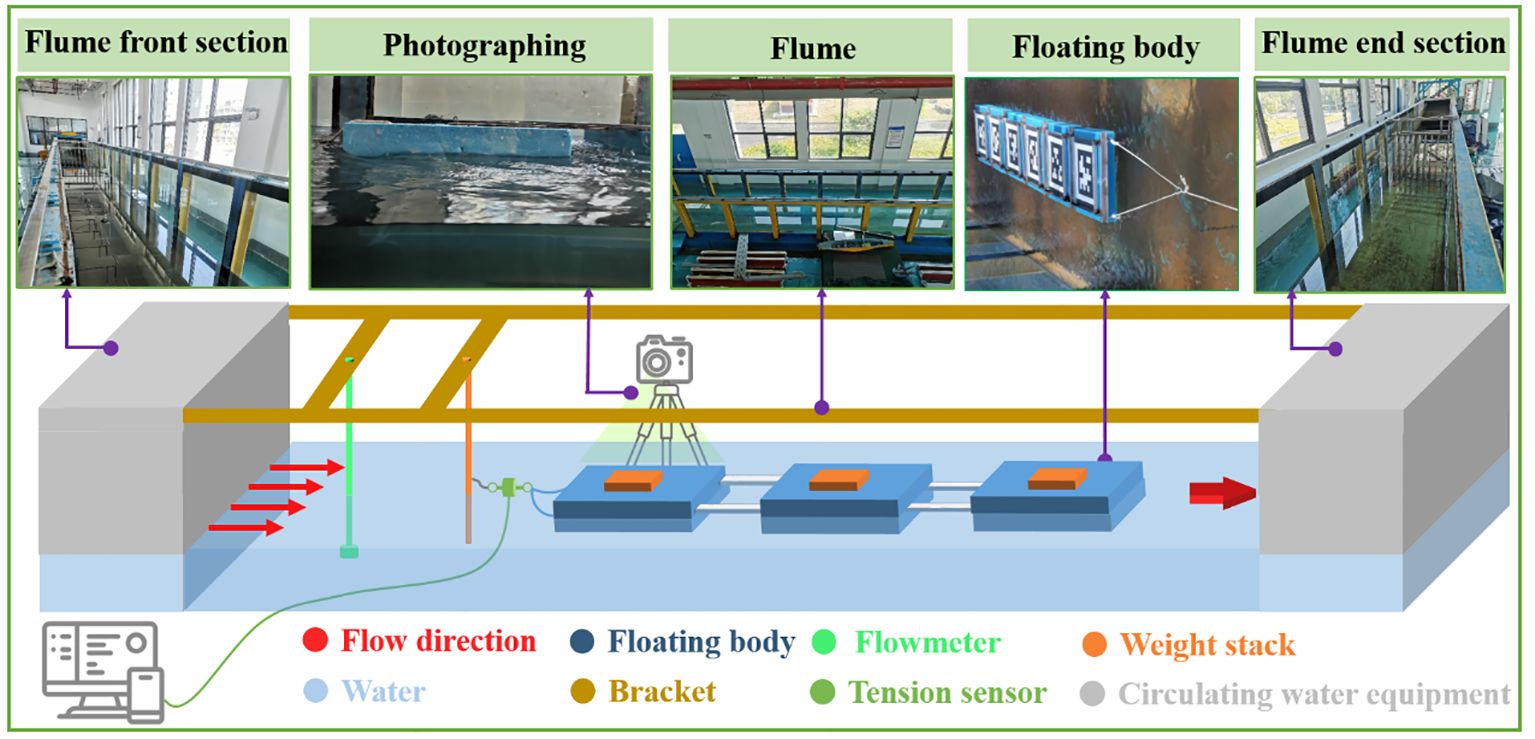
Figure 3 Experiment system for floating body resistance test.
In order to verify the correctness of the simulation results, the resistance data under the condition of a single floating body at a draft depth of 0.03 m are compared, as shown in Figure 4.
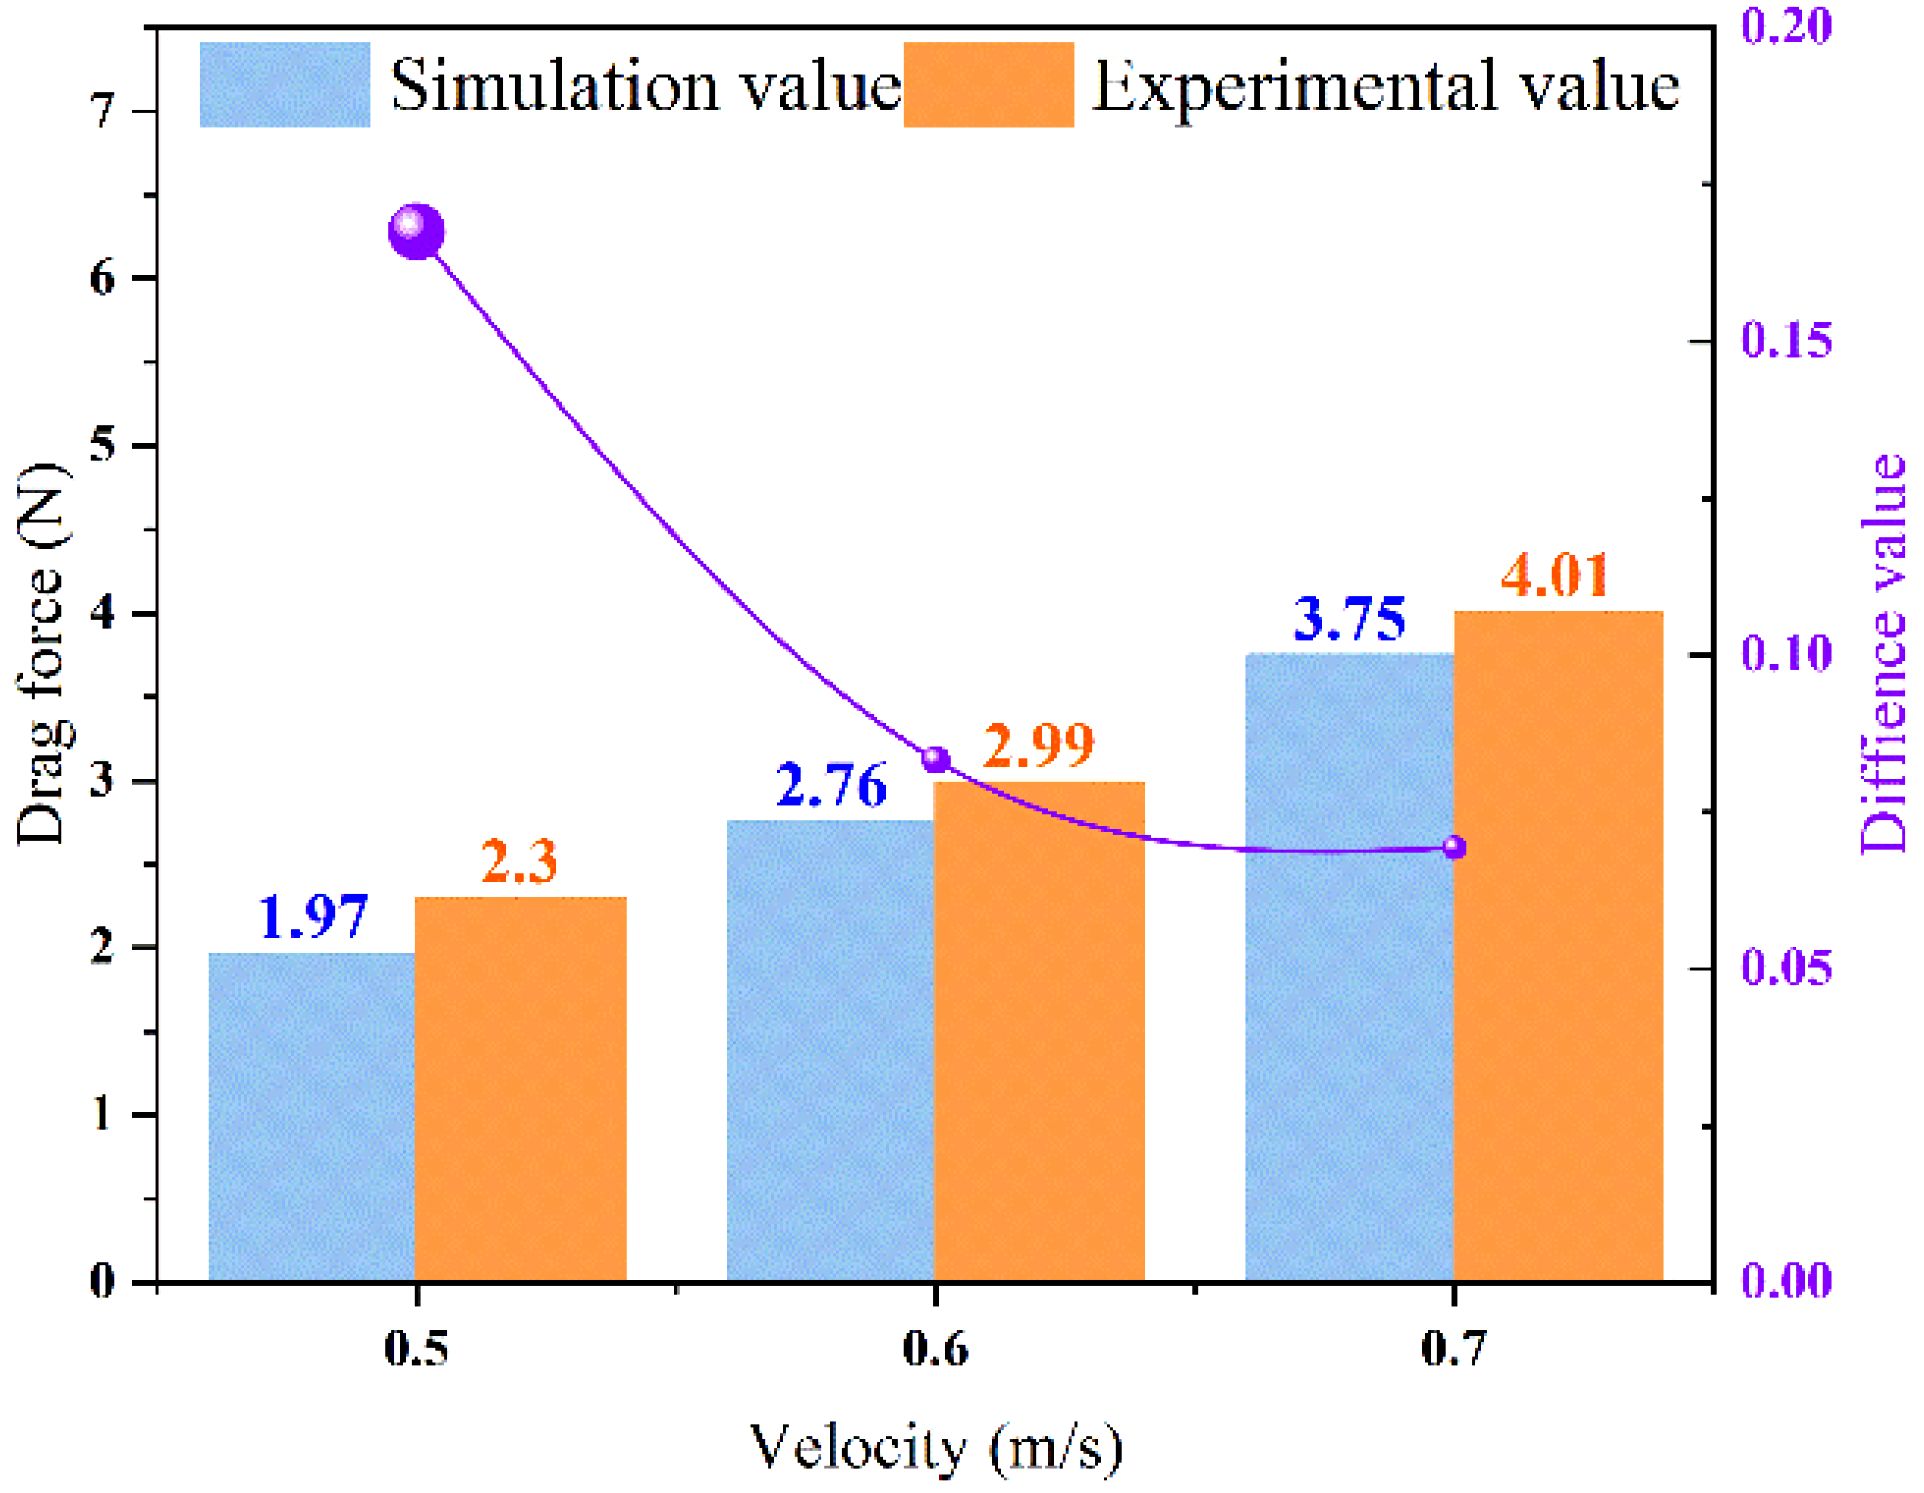
Figure 4 Comparison of experimental and simulated values.
The comparison results indicate that the change law of the simulated value and the experimental value is the same. The drag of floating body shows an increasing trend with the increase of the water flow velocity. Under the condition of low velocity, the error between them is the largest, reaching 16.7%. As the water flow velocity increases, the simulated and experimental values gradually converge and the error decreases. The analysis shows that the horizontal angle between the tension sensor and the floating body is large at a lower water flow velocity, which leads to a larger gravity component of the tension sensor itself.
3 Results and discussion
3.1 Analysis of drag characteristics of single floating body
Froude method considers the resistance encountered by a floating body in calm water as the sum of friction resistance and residual resistance. The residual drag can be further decomposed into viscous pressure resistance and wave resistance The total resistance is expressed as the following Equation (7):
Given the small flow rate in this experiment, the wave drag is negligible. Frictional resistance and the viscous pressure resistance can be contacted through the shape coefficient According to the relationship between the resistance and resistance coefficient, the total resistance can be expressed as the following Equation (8) (Andrea et al., 2020):
The Equation (9) of is as follows:
The total resistance can be expressed as Equation (10) (Zeng et al., 2019):
where, s density of water; s velocity of water; s draft of the floating body; s wide of floating body; s Reynolds number; s depth of water. Clearly, the total resistance is a Reynolds number function according to the above equation. Changes in the flow velocity and floating body’s draft depth will affect the Reynolds number and thus change the frictional resistance.
Due to the influence of flow viscosity, after the water impinges on the incoming surface of the floating body, it will produce circumfluence on both sides and bottom of the floating body. In the whole process, fluid particles will collide and mix, resulting in energy loss, which is manifested in the form of resistance. According to Figures 5A, B, total resistance will increase with the speed of increase in the form of exponential function when the draft depth of the floating body is constant. The increase of floating body draft depth can significantly increase the total resistance of floating body, which will be markedly increased under the condition of high velocity.
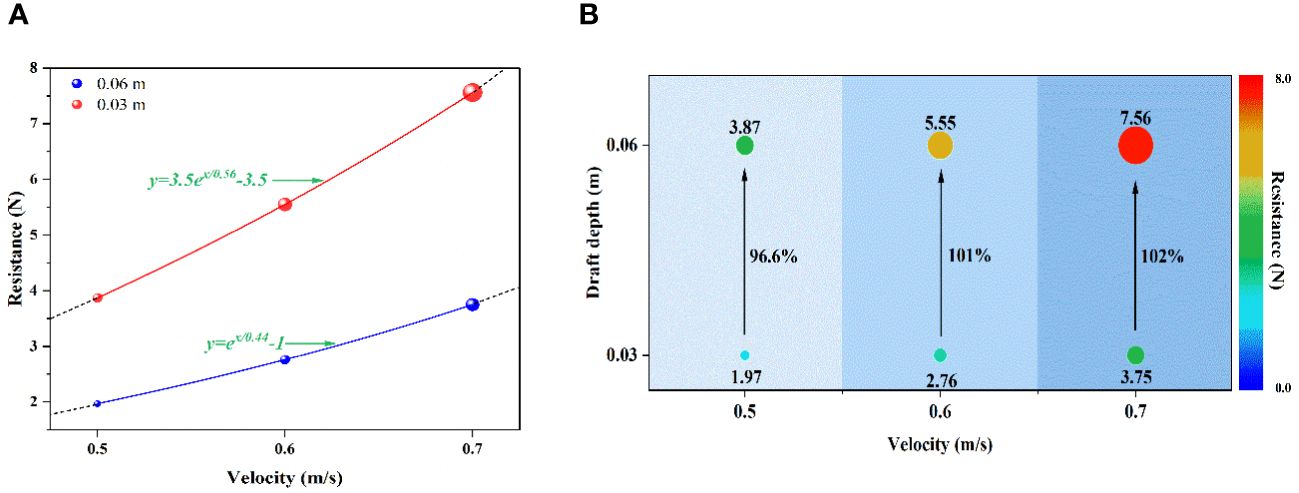
Figure 5 (A) Resistance variation law of the single floating body; (B) Resistance change rate of the single floating body.
3.2 Analysis of pressure, velocity and vorticity of single floating body
Based on Figure 6, a high-pressure area is expected to form near the surface of the floating body due to the impact of water flow. This high-pressure region is expected to be more pronounced when the floating body has a larger draft depth and the water flow velocity is higher. Subsequently, the detour flow around the sides and bottom will be produced, which can result the boundary layer separation that forms the negative pressure zone. The separation of the boundary layer will also lead to the formation of a large area with low pressure in the wake area, so that a huge pressure difference between the front and back of the floating body is formed, which is the main reason for the generation of floating body resistance. According to Figure 6, increasing the draft depth of the floating body expands the pressure difference and causes the negative pressure center of the vortex in the wake to move downstream, resulting in a more intricate pressure field.
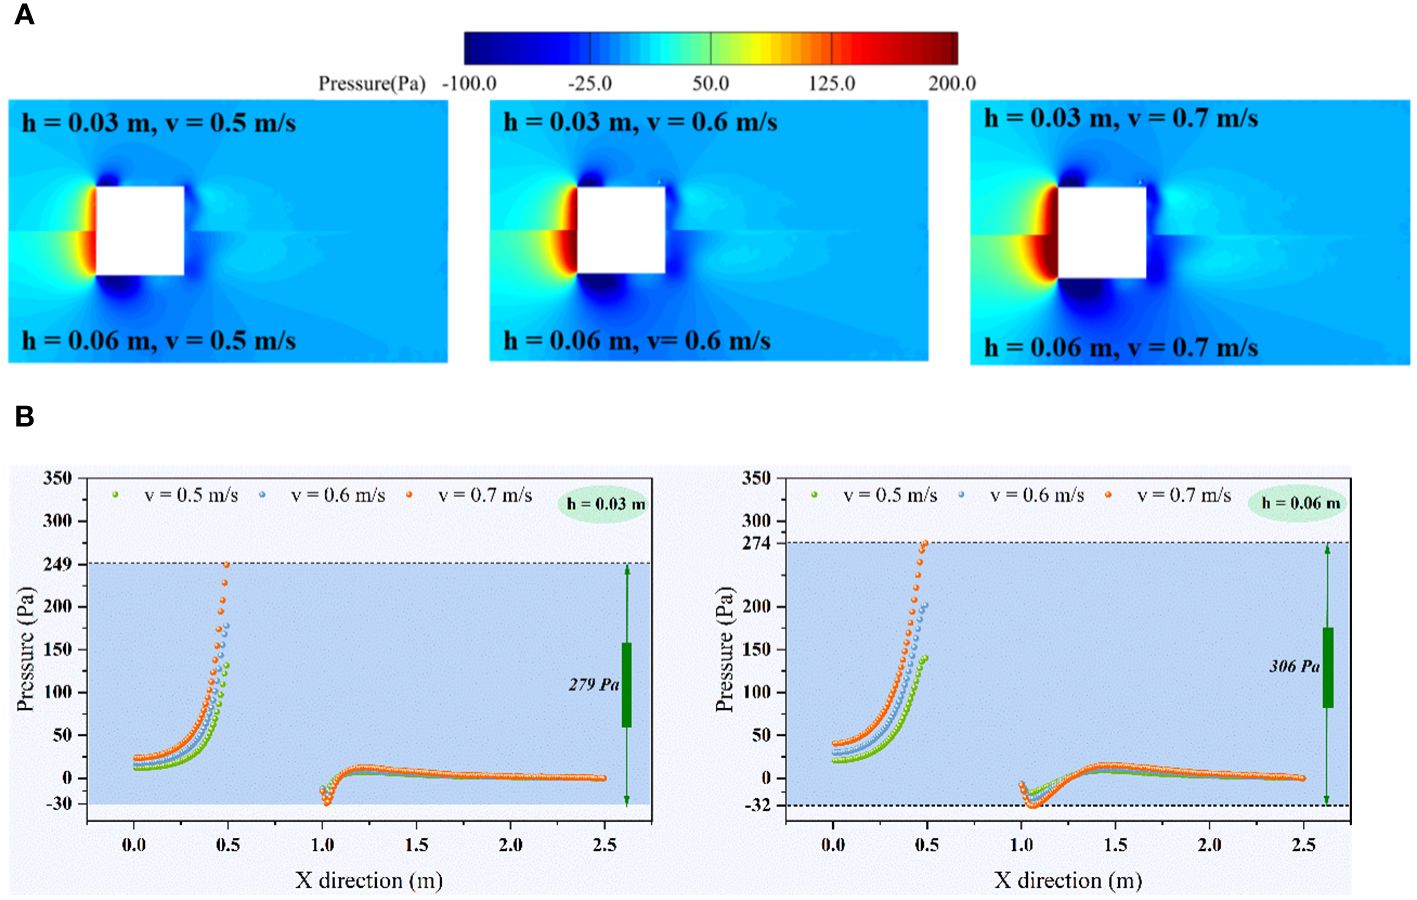
Figure 6 (A) Comparison of pressure cloud image in flow field of single floating body; (B) Pressure comparison of the flow field center line (The centerline depth is 1/2 of the draft depth of the floating body).
Changes in velocity and draught depth can significantly affect the distribution characteristics in the whole flow field (Figure 7). The counter flow is deflected over the surface of the floating body and flow spanwise along both sides of the floating body. At the stage, the increase of draft depth makes more fluid particles participate in the collision, leading to the expansion of the deceleration range. The inverse pressure gradient is generated due to the sharp Angle structure with infinite curvature at the sharp edge of the floating body, leading to boundary layer separation when the fluid flows around the sharp edge. The larger the incoming velocity, the more obvious the variation characteristics of the flow field near the sharp edge. Along the flow direction, the presence of fluid viscous shear stress leads to continuous accumulation of external fluid micelle, thereby increasing the thickness of the boundary layer. There is a positive correlation among the backflow acceleration region, the boundary layer disturbance region and the floating body draft depth. The boundary layer is then reattached to the surface on both sides of the floating body when the fluid flows downstream. Subsequently, the fluid forms a backflow vortex near the backflow surface, and an increase in both the upcoming velocity and draft depth can lead to an expansion of the backflow range in this region.
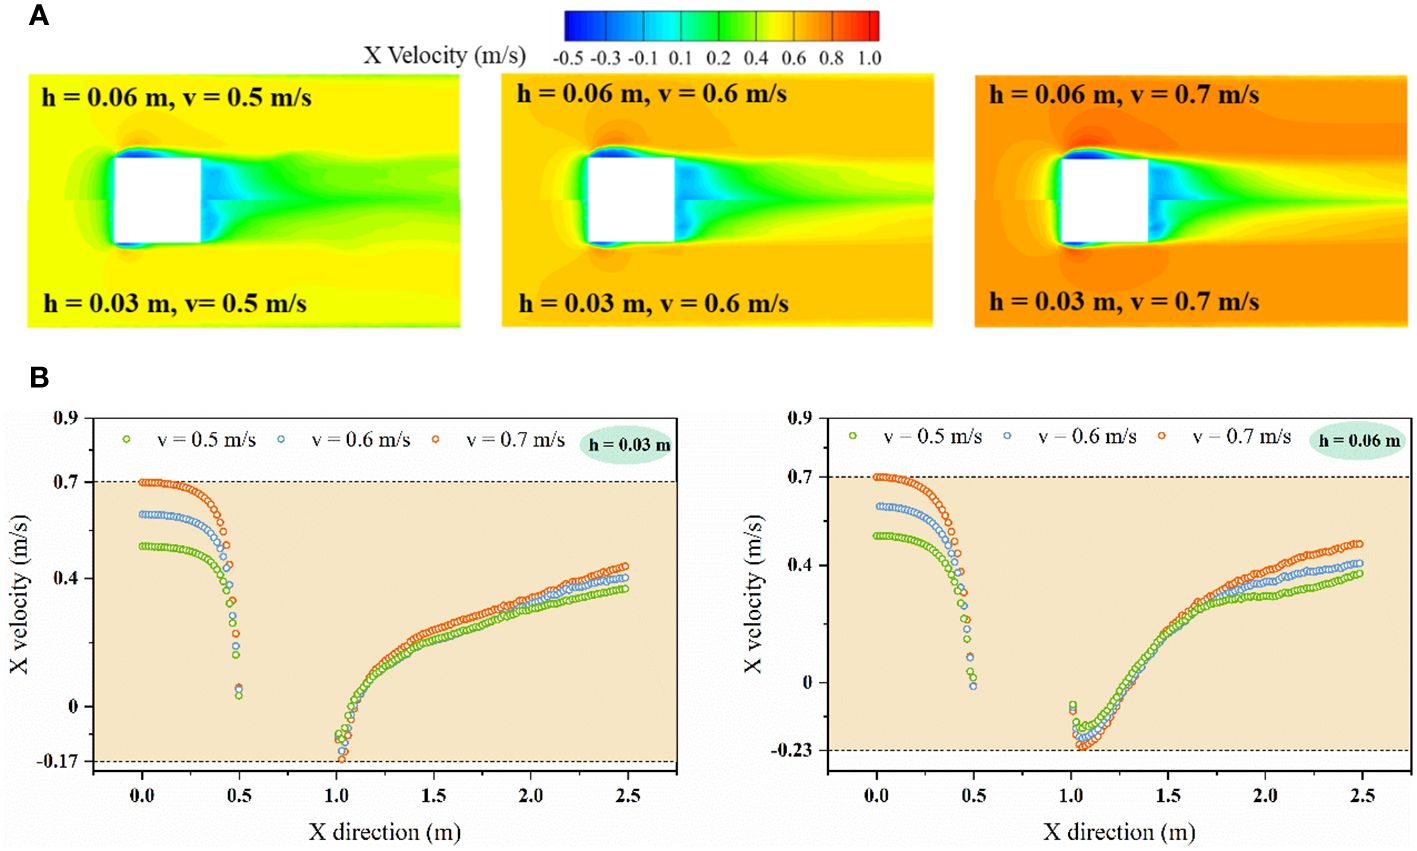
Figure 7 (A) Comparison of velocity cloud image in flow field of single floating body; (B) X velocity comparison of the flow field center line.
A boundary layer is generated on the surface of the blunt body due to the existence of fluid viscosity in the process of flow around the floating body. The existence of the boundary layer is the main reason for such resistance. In this study, the boundary layer separation first occurs at the sharp edge of the incoming flow surface of the floating body. There is an inverse pressure gradient in the separation zone, as the fluid continues to advance, channel recovery and flow velocity decrease occur. The boundary layer reattaches to the wall when the inverse pressure gradient disappears. In the region where the boundary layer separates, a stretched vortex, called a separation bubble, appears near the floating body wall (Toppings and Yarusevych, 2023). The reverse pressure gradient causes the fluid to backflow inside the separation bubble. The shear stress direction displays negative values when the flow velocity is opposite to the direction of the main stream. The position where the wall shear stress is 0 is the position where the boundary layer is reattached. When the boundary layer is reattached to the surface of the floating body, the stress is positive because the direction of the wall velocity is consistent with the main flow (Figure 8A). The peak shear stress in the separation bubble increases significantly with the increase of flow velocity, while the increase of the draft depth of the floating body significantly expands the distribution range of the separation bubble (Figure 8B). As can be seen, flow velocity and draft depth play a major role in controlling the peak stress and the boundary layer reattachment position of the separated bubble, respectively.
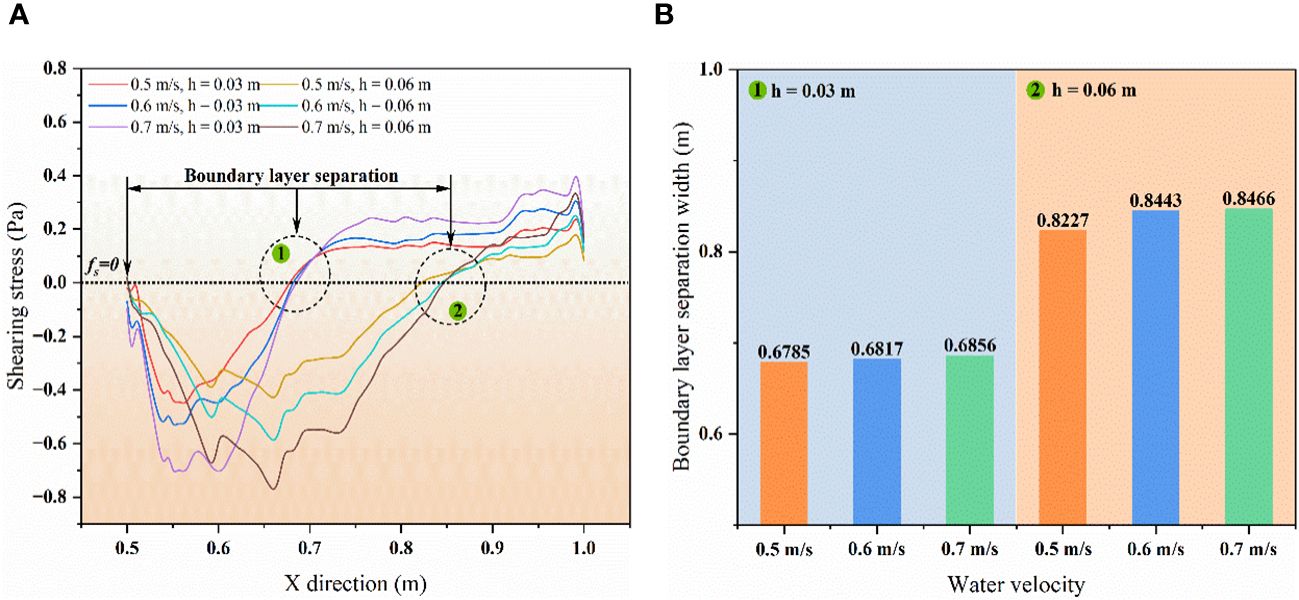
Figure 8 (A) Change rule of surface shear stress of floating body under different draft depths and fluid velocities; (B) Comparison of boundary layer reattachment position.
Vortex can be produced when the water flow around the floating body. The strength of the vortex can be characterized by the vorticity. Figure 9 compares vorticity distribution of the flow field in longitudinal section. The flows near the incoming surface of the floating body and at the bottom of the flow field are irrotational. There are obvious vortex phenomena at the bottom and tail of the floating body. The coverage and intensity of vortex are significantly affected by the draft depth of floating body and water flow velocity. When the flow velocity increases, the vortex at the bottom of the floating body covers area to expand downstream. The vortex system in the wake develops more fully along the flow direction. As the draft depth of the floating body increases, the vortex coverage area extends primarily in the direction of the water depth, causing the vortex center to move away from the bottom of the floating body. At the same time, the tail vortex and the bottom vortex appear to merge and overlap. The swirls in the wake also drift toward deep water, causing the mixing of fluid particle to be less near the tail of the floating body. Larger vorticity leads to greater energy loss due to the mixing and collision of water particles, which in turn results in greater drag.
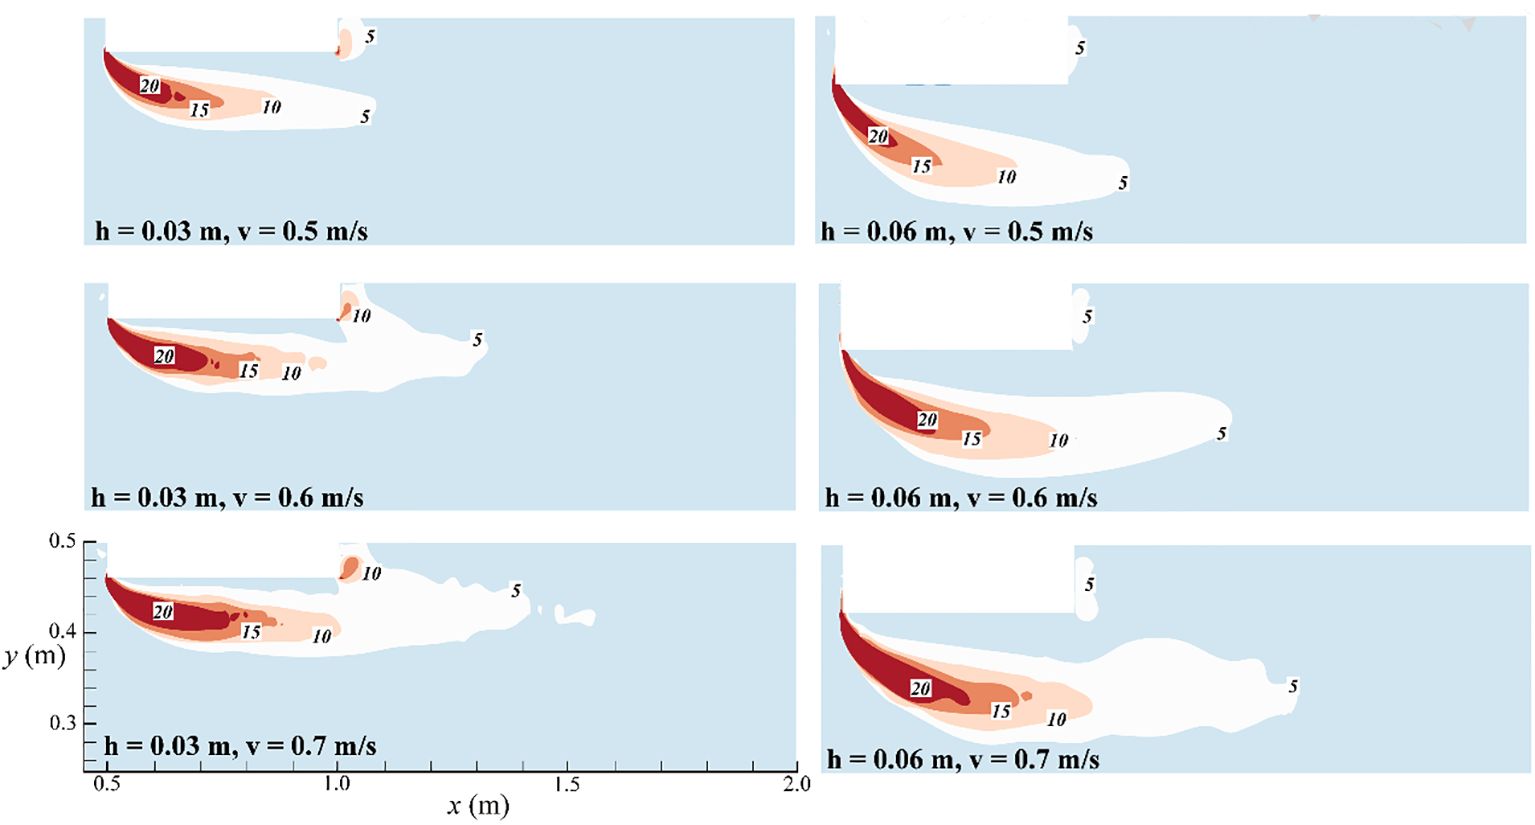
Figure 9 Comparison of vorticity distribution in longitudinal section of floating body.
3.3 Analysis of drag characteristics of tandem floating bodies
The increase in the number of floating bodies alters the dimensional characteristics of the multi-floating body system. This alteration can affect the flow field development process and expand its range. The intensity of energy exchange between water particles to change the total resistance of floating bodies in tandem. As can be seen from Figure 10A, the amount of floating body is positively correlated with the resistance value when the draft of floating body is determined, and the total resistance of floating body is significantly greater than the resistance of single floating body under the same conditions. When the draft of the floating body is 0.03 m, the total resistance of the double floating body is 3.71 N, while the corresponding total resistance of the three floating body and the four floating body is 4.67 N and 5.53 N, respectively. The resistance values increase by 25.9% and 18.4%, respectively, compared with the previous floating body system. Compared with the increase rate of the number of floating bodies, the increase rate of the total floating resistance shows an obvious hysteresis. The reason is that the resistance value of a single floating body in the floating body system is significantly affected. When the draft of the floating body is 0.06 m, the total resistance values of the three types of floating bodies are 7.34 N, 8.88 N and 10.41 N respectively. The adjacent resistance values increase by 21% and 17.2%, respectively. The increase in draft depth will slow down the increase in the total resistance value of the floating body system. The slowing down effect is also obviously reflected in the resistance variation rule of the same number of floating bodies. When the number of floating bodies increases from 2 to 4, the total drag value change for the same number of floating bodies with different draft depths, which are 98%, 90% and 88%, respectively.
The slowing-down effect of the increasing rate of the total resistance of multiple floating body system can be analyzed from Figure 10B. The increase in the number of floating bodies can significantly weaken the resistance value of individual floating bodies in the system due to the fixed distance between floating bodies. The resistance value of the front floating body in the multiple floating body system is about 2.5 N when the draft depth is 0.03 m, which is about 10% lower than that of the single floating body system. The resistance value of the end floating body is much smaller than that of the single floating body system, showing a certain decreasing trend with the increase of the number of floating bodies. The resistance value of the first floating body in the double floating body system is 4.88 N when the draft depth is 0.06 m, which decreases by 13.7% compared with the resistance value of the single floating body system. The resistance value of the front floating body also shows a downward trend with the increase of the number of floating bodies. The drag of the floating body at the tail decreases significantly. The intermediate floating body experiences the least resistance in the entire multi-floating body system. The resistance in the system with multiple floating bodies decreases initially and then increases along the flow direction.
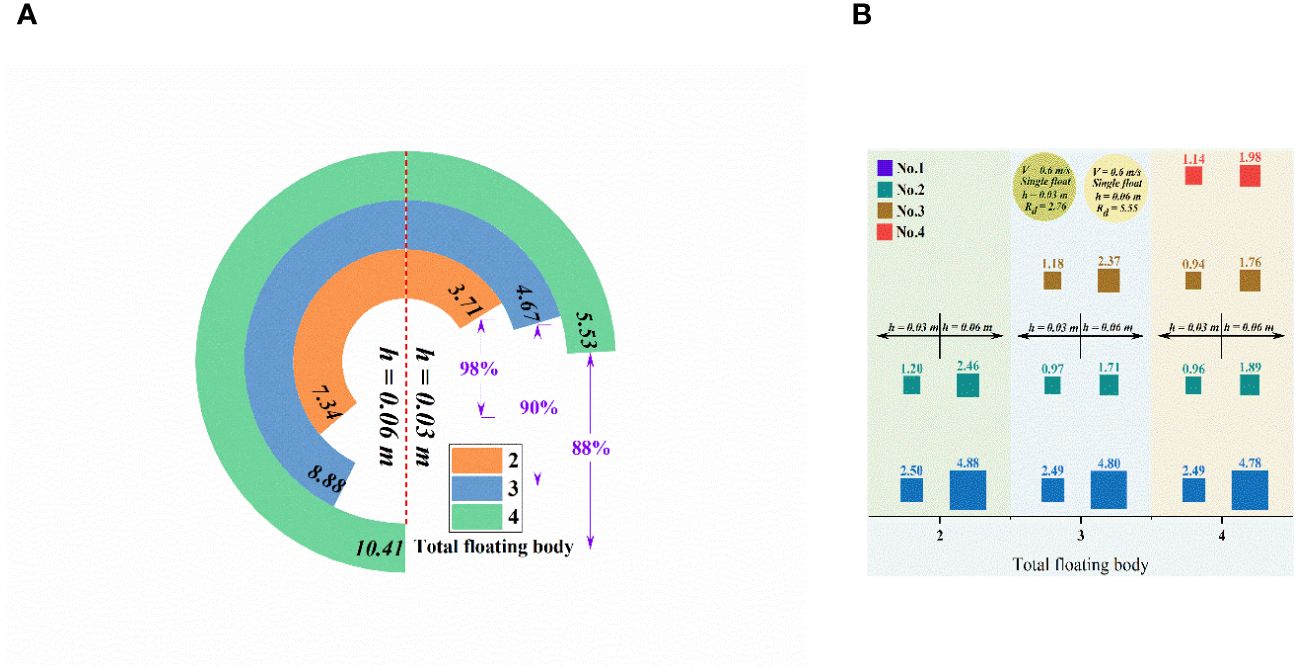
Figure 10 (A) Resistance comparison of three types floating body system; (B) Comparative analysis of floating body resistance at different positions.
3.4 Analysis of pressure, velocity and vorticity of tandem floating body
The resistance of multiple floating body is also closely related to the pressure field (Figures 11A, B). The distribution of pressure field around the multiple floating body has typical regional differences. The pressure field distribution characteristics of the front floating body are similar to those of the single floating body. The wake flow of the front floating body is not developed completely due to the presence of downstream floating body, forming a weak entrainment strength and a small negative pressure area near the backflow surface which can be improved by the increase of floating body draft. Only a small amount of clearance flow strikes the intermediate floating body at a speed much smaller than the main stream due to the small spacing between the floating bodies, resulting in a small pressure value. Along the flow direction, the positive pressure value of the in-flow surface and the negative pressure value of the backflow surface of the intermediate floating body are constantly weakened, so that the shape resistance of the intermediate floating body is much smaller than that of the front floating body. Compared to the pressure field of a single floating body, the pressure field of the end floating body is limited by all the floating bodies in front of it. The complexity of the pressure field structure in the wake flow region of increases with the increase of the number of floating bodies. Meanwhile, the reduced uniformity of pressure field and the decreasing extreme value of negative pressure result in a continuous decrease in the resistance of end floating body. More water particles participate in the mixing and collision with the increase of draft depth, which strengthens the fluctuation range of pressure values near the front floating body and the intermediate floating body, as well as the fluctuation region of backflow surfaces of the end floating body. The spatial position of the floating body makes the distribution characteristics of the pressure field appear more obvious.
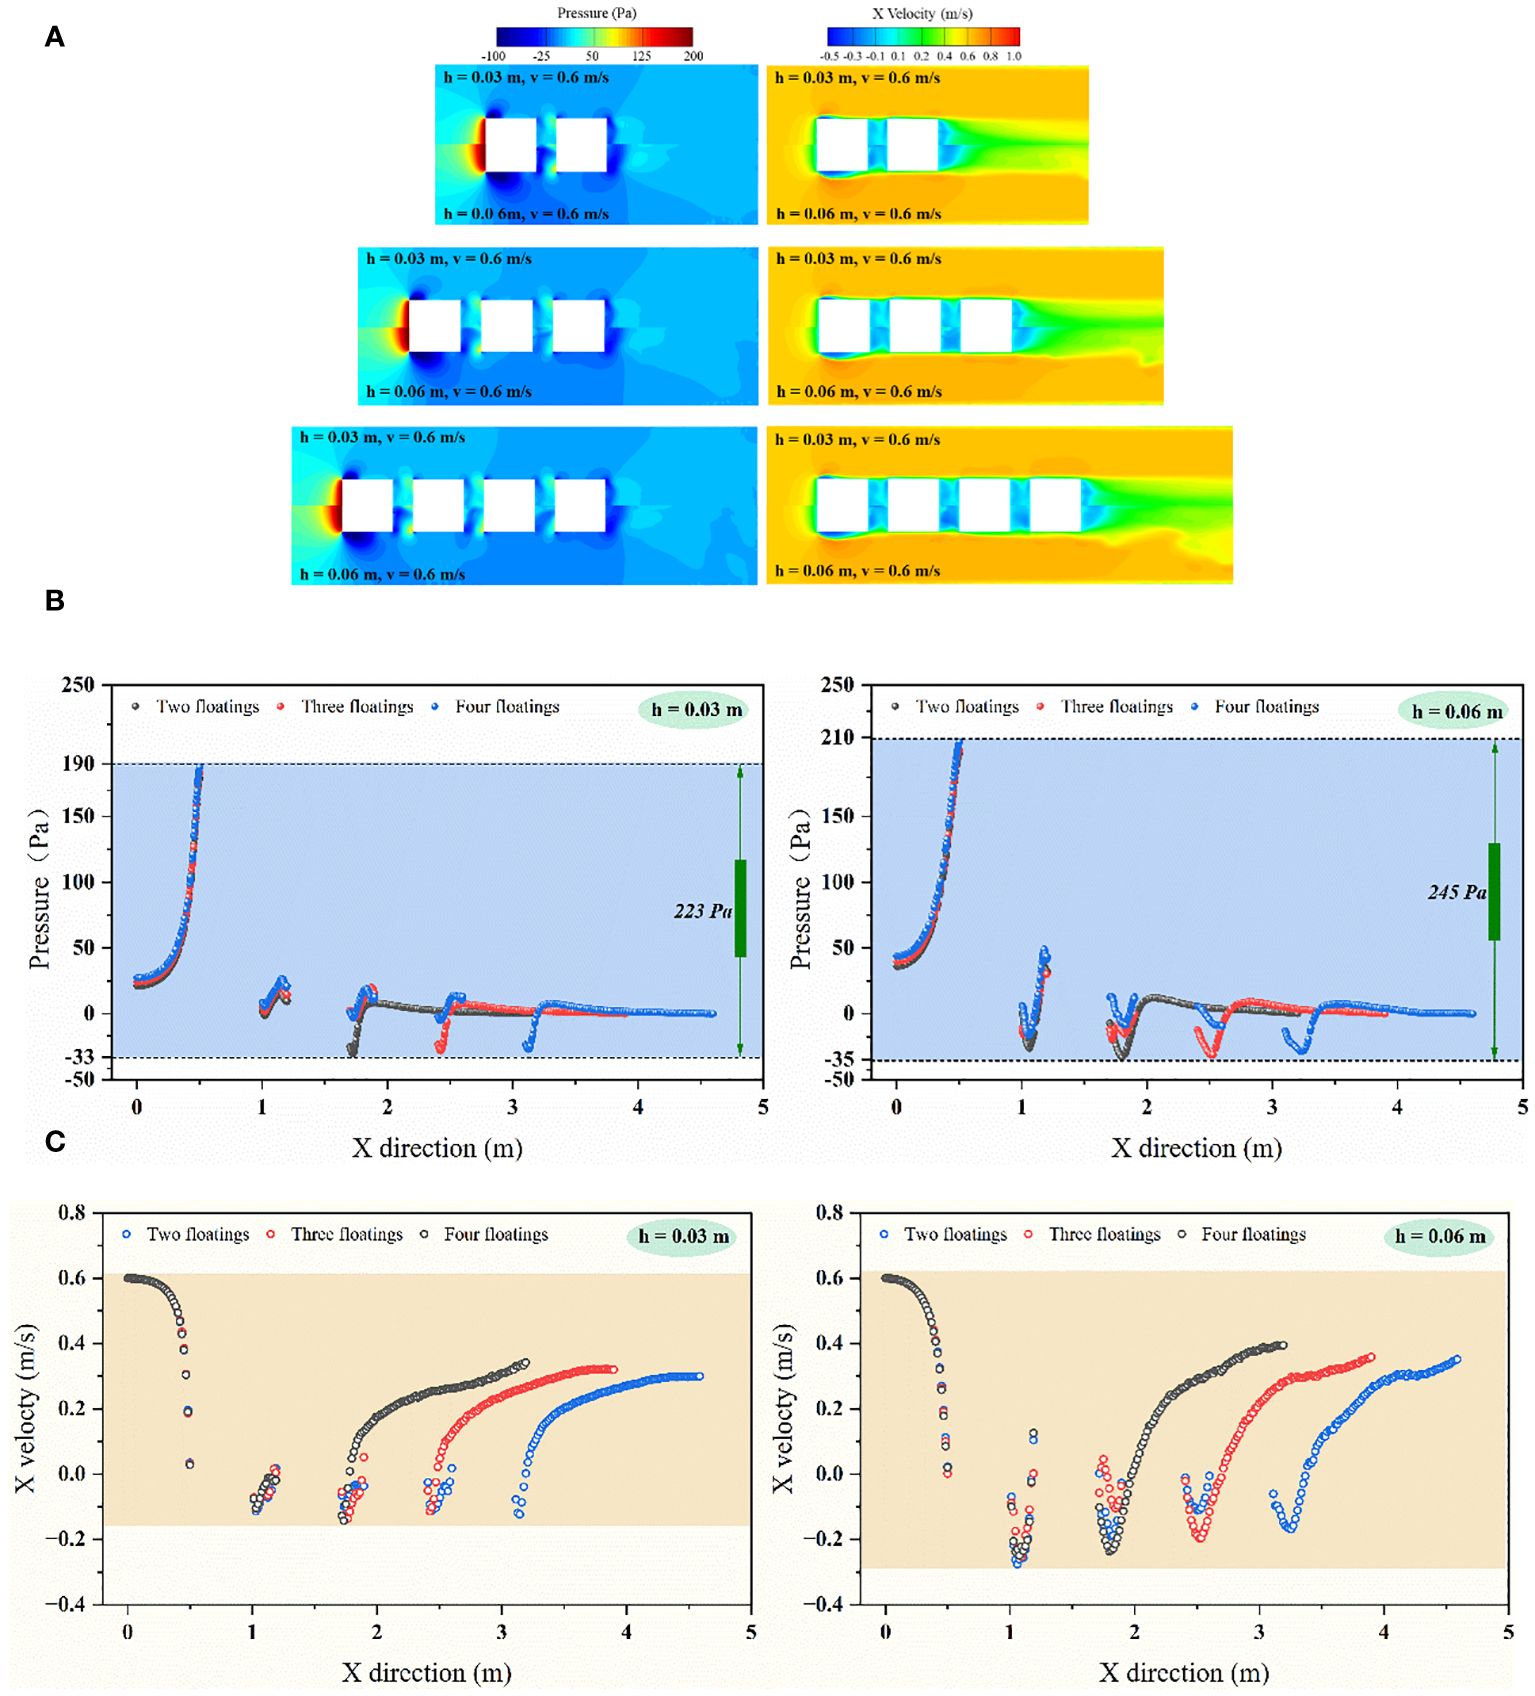
Figure 11 (A) Comparison of velocity field and pressure field of tandem floating body; (B) Pressure comparison of the flow field center line; (C) X velocity comparison of the flow field center line.
When the draft depth of the floating body is different, the velocity distribution near the multiple floating body changes with the number of floating bodies (Figures 11A, C). The velocity distribution near the front and rear surfaces of the bow float is only related to the draft depth. The velocity distribution on the backflow surface of the front floating body is also only related to the draft depth. The opposite flow velocity occurs because of the vortex created in the floating body gap. The maximum velocity in the gap between the floating bodies gradually decreases along the main stream and suddenly increases at the backflow surface of the end floating body. Similarly, the increase of draft depth strengthens the difference of the flow field around the floating body and makes the difference of the flow field between the floating body more obvious. The structure of the flow field of the end floating body is less stable, leading to a significant increase in the range of influence and intensity of fluctuations in the backflow region.
The main vortex tends to develop downstream with the increase of the number of floating bodies when the draft depth of the floating body is 0.03 m, and the connection between the clearance vortex and the main vortex is enhanced (Figure 12). The vortex field near the intermediate floating body weakens obviously due to the shielding effect. However, the vortex fields on both sides of the floating body gap migrate to the free liquid surface and expand to the bottom of the flow respectively. The difference of vorticity field near the ending floating body mainly exists in the incoming surface. The vortex development state of the backflow surface is basically similar. The vorticity distribution near the front floating body has obvious similarity when the draft depth of the floating body is 0.06 m. As the number of floating bodies increases, the vorticity generated near the backflow surface of the front floating body tends to decrease gradually, which also explains why the resistance decreases gradually with the increase of the number of floating bodies. The vortex generated near the intermediate floating body seems more complex, and the vorticity value is at a low level. The vortex near the incoming surface of the end floating body appears to merge, and the influence range of the vortices expands. The vorticity in the wake shows a trend of continuous enhancement. According to the results of comparative analysis, the main vortex gradually expands to the deep water, which weakens the connectivity with the free liquid surface. The vorticity near the intermediate floating body is always at a low level. The strength and spread of the vortex near the end floating body are also increased.
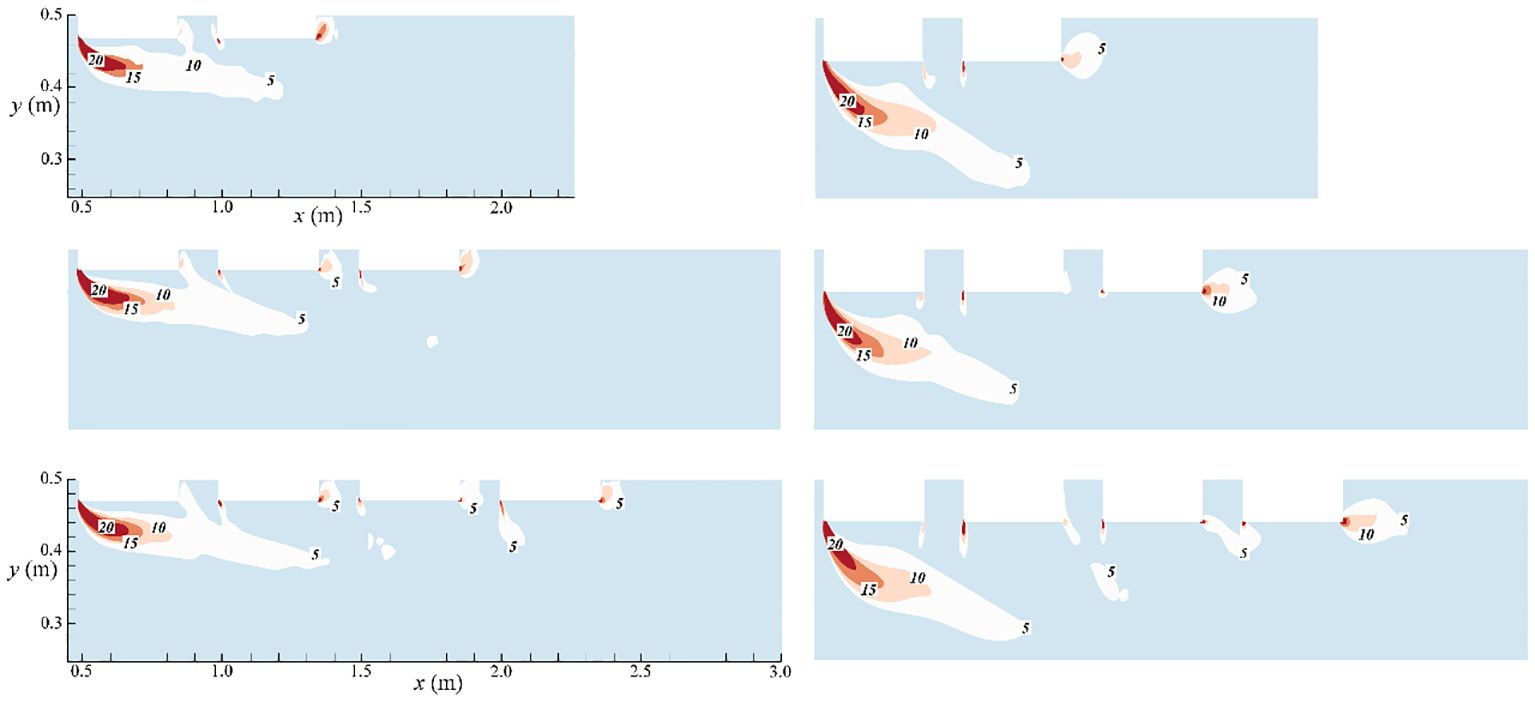
Figure 12 Comparison of vorticity distribution in longitudinal section.
Although the overall structure of floating photovoltaic is diverse, the photovoltaic system needs to rely on the floating structure to be stable (Choi Y. et al., 2016). In the application process of actual floating photovoltaic, the number of tandem floating bodies is huge, resulting in a high level of resistance in the whole floating system is also at a very high level. The resistance of the floating body increases significantly when aquatic organisms attach to the bottom of the floating body to change the draft depth of the floating body according to the research results, which puts forward higher requirements for the anchorage structure of the floating body system. In fact, the attachment of aquatic organisms changes the friction coefficient at the bottom of the floating body, which further increases the resistance of the floating body (Schultz et al., 2011; Schultz, 2004). At the same time, the corrosion of water or the impact of floating garbage such as plastic and wood on the surface structure of the floating body also increases the drag of the floating body (Saha and Miazee, 2017). The research does not consider the above situation in the paper when the influence factors of floating body resistance is studied. So further experimental data are needed to confirm our hypothesis. Although the research content of this paper is insufficient, it can still provide a good idea for the current floating body resistance prediction and stability analysis.
4 Conclusion
By using the method of simulation and experiment, the resistance of single floating body and tandem floating body is studied under different draft depths, velocities and number of floating bodies. The variation characteristics of pressure, velocity and vorticity in the flow field are explained, and the specific conclusions are as follows:
(1) The draft depth of the floating body has a more significant effect on the drag, especially at higher water velocities. The relation between the floating body resistance and the water flow velocity is an exponential function.
(2) When the water flow velocity increases, higher pressure of the incoming surface and lower negative pressure extremum in the wake will be produced with the increase of the draft depth, resulting in a larger enrolling range and reflux speed. The separation bubble generated on the side of the floating body is more sensitive to the depth of draft.
(3) Under the influence of shielding effect, the resistance values are ranked as follows: front floating body > end floating body > intermediate floating body. An increase in the number of floating bodies weakens the drag of individual floating bodies within the system.
(4) The increase of floating bodies number will enhance the influence of draft depth on the complexity in wake, which is mainly manifested as the decrease of reflux speed and the expansion of reflux range. At the same time, the pressure and velocity fluctuations in the floating body gap gradually weaken.
Data availability statement
The raw data supporting the conclusions of this article will be made available by the authors, without undue reservation.
Author contributions
HW: Conceptualization, Methodology, Writing – original draft. XL: Data curation, Software, Visualization, Writing – review & editing. KW: Supervision, Validation, Writing – review & editing.
Funding
The author(s) declare financial support was received for the research, authorship, and/or publication of this article. This research is supported by the National Natural Science Foundation of China (Grant No. 52001196).
Conflict of interest
The authors declare that the research was conducted in the absence of any commercial or financial relationships that could be construed as a potential conflict of interest.
Publisher’s note
All claims expressed in this article are solely those of the authors and do not necessarily represent those of their affiliated organizations, or those of the publisher, the editors and the reviewers. Any product that may be evaluated in this article, or claim that may be made by its manufacturer, is not guaranteed or endorsed by the publisher.
References
Abdalla I. E., Yang Z. (2004). Numerical study of the instability mechanism in transitional separating and reattaching flow. Int. J. Heat Fluid Flow. 25, 593–605. doi: 10.1016/j.ijheatfluidflow.2004.01.004
Andrea F., Nastia D., Ivana M. (2020). An investigation into the effect of hard fouling on the ship resistance using CFD. Appl. ocean Res. 100, 105. doi: 10.1016/j.apor.2020.102205
Bai B., Xiong S., Ma X., Liao X. (2024). Assessment of floating solar photovoltaic potential in China. Renewable Energy. 220, 119572. doi: 10.1016/j.renene.2023.119572
Bukhary S., Ahmad S., Batista J. (2018). Analyzing land and water requirements for solar deployment in the Southwestern United States. Renew. Sustain. Energy Rev. 82, 3288–3305. doi: 10.1016/j.rser.2017.10.016
Choi K., Choi W., Lee H. (2016). Empirical research on the efficiency of floating PV systems. Sci. Adv. Mater. 8 (3), 681–685. doi: 10.1166/sam.2016.2529
Choi Y., Choi W., Lee H. (2016). Design and installation technique of ocean floating photovoltaic systems with advanced materials. Sci. Adv. Mater. 8, 675–680. doi: 10.1166/sam.2016.2528
Deng Y., Wang P., Cao Z., Liu Y. (2020). Interaction between separation bubble and impinging vortices over a finite blunt plate. Int. J. Heat Fluid Flow. 82, 108534. doi: 10.1016/j.ijheatfluidflow.2020.108534
Heinrichs H., Mourao Z., Venghaus S., Konadu D., Gillessen B., Vögele S., et al. (2021). Analyzing the water and land system impacts of Germany’s future energy system. Renew. Sustain. Energy Rev. 150, 111469. doi: 10.1016/j.rser.2021.111469
Hourigan K., Thompson M., Tan B. (2001). Self-sustained oscillations in flows around long blunt plates. J. Fluids Struct. 15, 387–398. doi: 10.1006/jfls.2000.0352
Hu R., Liu Y. (2018). Proper orthogonal decomposition of turbulent flow around a finite blunt plate. J. Vis. 21, 763–777. doi: 10.1007/s12650-018-0496-0
Hudy L., Naguib A., Humphreys W. (2007). Stochastic estimation of a separated-flow field using wall-pressure-array measurements. Phys. Fluids. 19, 024103. doi: 10.1063/1.2472507
Irwin P. (2008). Bluff body aerodynamics in wind engineering. J. Wind Eng. Ind. Aerodyn. 96, 701–712. doi: 10.1016/j.jweia.2007.06.008
Kiya M., Sasaki K. (1985). Structure of large-scale vortices and unsteady reverse flow in the reattaching zone of a turbulent separation bubble. J. Fluid Mechanics. 154, 463–491. doi: 10.1017/S0022112085001628
Lamballais E., Silvestrini J., Laizet S. (2010). Direct numerical simulation of flow separation behind a rounded leading edge: study of curvature effects. Int. J. Heat Fluid Flow. 31, 295–306. doi: 10.1016/j.ijheatfluidflow.2009.12.007
Li X., Zhu H., Chen G., Kang Q., Geng K. (2017). CFD-based comparative analysis for the oil & gas dispersion behavior resulting from the submarine pipeline leakage. Int. J. NAV Arch. OCEAN. 17, 608–614. doi: 10.1016/j.ijnaoe.2018.07.002
Liu Z., Guedes Soares C. (2023). Sensitivity analysis of a numerical model of the dynamics of gravity cages subjected to current and waves. Ocean Eng. 287, 115715. doi: 10.1016/j.oceaneng.2023.115715
Liu Z., Guedes Soares C. (2024). Numerical study of rope materials of the mooring system for gravity cages. Ocean Eng. 298, 117135. doi: 10.1016/j.oceaneng.2024.117135
Luan H., Xu H., Chen L. (2011). Evaluation of the coupling scheme of FVM and LBM for fluid flows around complex geometries. J. Heat Transfer 54, 1975–1985. doi: 10.1016/j.ijheatmasstransfer.2011.01.004
Lyrio L., García I., Ribeiro C., Nascimento C., Rego E., Giarola S., et al. (2020). Modelling the technical potential of bioelectricity production under land use constraints: a multi-region Brazil case study. Renew. Sustain. Energy Rev. 123, 109765. doi: 10.1016/j.rser.2020.109765
Nakamura Y., Ohya Y., Tsuruta H. (1991). Experiments on vortex shedding from flat plates with square leading and trailing edges. J. Fluid Mech. 222, 437–447. doi: 10.1017/S0022112091001167
Ohya Y., Nakamura Y., Ozono S., Tsuruta H., Nakayama R. (2006). A numerical study of vortex shedding from flat plates with square leading and trailing edges. J. Fluid Mechanics. 236, 445–460. doi: 10.1017/S0022112092001472
Saha G., Miazee M. (2017). Numerical and experimental study of resistance, sinkage and trim of a container ship. Proc. Eng. 19, 67–73. doi: 10.1016/j.proeng.2017.08.118
Schultz M. (2004). Frictional resistance of antifouling coating systems. J. Fluids Eng. 126, 1039–1047. doi: 10.1115/1.1845552
Schultz M., Bendick J., Holm E., Hertel W. (2011). Economic impact of biofouling on a naval surface ship. Biofouling 27, 87–98. doi: 10.1080/08927014.2010.542809
Sicot C., Perrin R., Tran T., Borée J. (2012). Wall pressure and conditional flow structures downstream of a reattaching flow region. Int. J. Heat Fluid Flow. 35, 119–129. doi: 10.1016/j.ijheatfluidflow.2012.04.005
Song S., Demirel Y. K., Atlar M. (2019). An investigation into the effect of biofouling on the ship hydrodynamic characteristics using CFD. Ocean. Eng. 175, 122–137. doi: 10.1016/j.oceaneng.2019.01.056
Spencer R., Macknick J., Aznar A., Warren A., Reese M. (2019). Floating photovoltaic systems: assessing the technical potential of photovoltaic systems on man-made water bodies in the continental United States. Environ. Sci. Technol. 53, 1680–1689. doi: 10.1021/acs.est.8b04735
Stefan M., Wolfgang S. (2008). Disturbance evolution in the leading-edge region of a blunt flat plate in supersonic flow. Fluid Dyn. Res. 40, 803. doi: 10.1016/j.fluiddyn.2008.02.003
Tafti D., Vanka S. (1991). A three-dimensional numerical study of flow separation and reattachment on a blunt plate. Phys. Fluids. A3 (12), 2887–2909. doi: 10.1063/1.858208
Taylor Z., Palombi E., Gurka R., Kopp G. (2011). Features of the turbulent flow around symmetric elongated bluff bodies. J. Fluids Struct. 27, 250–265. doi: 10.1016/j.jfluidstructs.2010.10.004
Tenauda C., Podvin B., Fraigneau Y., Daru V. (2016). On wall pressure fluctuations and their coupling with vortex dynamics in a separated–reattached turbulent flow over a blunt flat plate. Int. J. Heat Fluid Flow. 61, 730–748. doi: 10.1016/j.ijheatfluidflow.2016.08.002
Toppings C., Yarusevych S. (2023). Linear stability analysis of a three-dimensional laminar separation bubble on a finite wing. Int. J. Heat Fluid FL. 101, 109141. doi: 10.1016/j.ijheatfluidflow.2023.109141
Yanaoka H., Yoshikawa H., Ota T. (2002). Numerical simulation of laminar flow and heat transfer over a blunt flat plate in square channel. J. Heat Transfer. 124, 8–16. doi: 10.1115/1.1420715
Ye H., Li W., Lin S., Ge Y., Lv Q. (2024). A framework for fault detection method selection of oceanographic multi-layer winch fiber rope arrangement. Measurement. 226, 114168. doi: 10.1016/j.measurement.2024.114168
Zeng Q., Robert H., Cornel T. (2019). On the viscous resistance of ships sailing in shallow water. Ocean. Eng. 190, 106434. doi: 10.1016/j.oceaneng.2019.106434
Zhang Q., Liu Y. (2012). Wall-pressure fluctuations of separated and reattaching flow over blunt plate with chord-to-thickness ratio c/d= 9.0. Exp. Therm Fluid Sci. 42, 125–135. doi: 10.1016/j.expthermflusci.2012.04.019
Zou T., Niu X., Ji K., Chen X., Tao L. (2023). The projection of climate change impact on the fatigue damage of offshore floating photovoltaic structures. Front. Mar. Sci. 10. doi: 10.3389/fmars.2023.1065517
Keywords: floating photovoltaic, aquatic organisms, drag, draft depth, water flow velocity, number of floating body
Citation: Wang H, Liu X and Wang K (2024) Research on floating body resistance characteristics of floating photovoltaic and analysis of influencing factors. Front. Mar. Sci. 11:1387564. doi: 10.3389/fmars.2024.1387564
Received: 18 February 2024; Accepted: 12 March 2024;
Published: 02 April 2024.
Edited by:
He Li, University of Lisbon, PortugalReviewed by:
Jianhua Zhang, Harbin Engineering University, ChinaZhongchi Liu, University of Lisbon, Portugal
Copyright © 2024 Wang, Liu and Wang. This is an open-access article distributed under the terms of the Creative Commons Attribution License (CC BY). The use, distribution or reproduction in other forums is permitted, provided the original author(s) and the copyright owner(s) are credited and that the original publication in this journal is cited, in accordance with accepted academic practice. No use, distribution or reproduction is permitted which does not comply with these terms.
*Correspondence: Xiaolei Liu, 205684@shmtu.edu.cn