Explanations for the positive storm surges on the left side of landfall typhoons in China
 Weiqi Wan
 Xingru Feng
 Baoshu Yin
 Qingrong Liu6
- 1Key Laboratory of Ocean Observation and Forecasting, Key Laboratory of Ocean Circulation and Waves, Institute of Oceanology, Chinese Academy of Sciences, Qingdao, China
- 2University of Chinese Academy of Sciences, Beijing, China
- 3Pilot National Laboratory for Marine Science and Technology, Qingdao, China
- 4Center for Ocean Mega−Science, Chinese Academy of Sciences, Qingdao, China
- 5Chinese Academy of Sciences (CAS) Engineering Laboratory for Marine Ranching, Institute of Oceanology, Chinese Academy of Sciences, Qingdao, China
- 6North Sea Forecasting and Disaster Reduction Center of the Ministry of Natural Resources, Qingdao, China
The coastal regions of Southeast China frequently experience unusual positive storm surges on the left side of landfalling typhoons, a phenomenon historically overlooked and inadequately explained by conventional circular wind field models. In this study, a high resolution, two-dimensional storm surge model based on ADCIRC along with tide gauge data were used to investigate the spatiotemporal distribution of these surges and proposes underlying mechanisms, informed by a comparative analysis of circular and ERA5 reanalysis wind fields during typical typhoon event 9711 Winnie. Analyzing tide gauge data spanning from 1986 to 2016, the study uncovers a distinct pattern of left-side positive storm surges along the southeastern coast, notably on the Fujian coast and within the Taiwan Strait, which are found to be comparable to those on the cyclone’s right side. The research also documents a significant escalation in both the frequency and intensity of these left-side surges over the past three decades. Simulation results highlights the inadequacies of circular wind field models in operational forecasting and emphasizes the necessity of accounting for topographic influences and the structural complexity of wind fields in storm surge predictions. This is particularly pertinent in semi-enclosed seas with intricate hydrodynamics, such as the Taiwan Strait. The insights gleaned from this study are pivotal for enhancing the real-time simulation and prediction of storm surges, which are vital for coastal safety and disaster prevention measures.
Introduction
Storm surges, associated with the formidable power of typhoons, stand as one of the most catastrophic coastal hazards. These surges can precipitate extensive flooding, induce severe erosion, and inflict substantial damage upon coastal infrastructure and delicate ecosystems. The southeastern coast of China, alongside the Taiwan Strait, is characterized by a constricted maritime expanse with complex topographical and hydrodynamic features, rendering it particularly vulnerable to typhoon impacts. China Marine Disaster Bulletin (2022) underscores that typhoon storm surges accounted for a staggering 99% of the economic losses attributed to marine hazards in that year, culminating in an economic toll of 2.38 billion CNY. Research conducted by Feng et al. (2018) corroborates a marked escalation in storm surge and wave heights along the coasts of Zhejiang and Fujian over the past three decades, with a pronounced intensification observed during the typhoon season.
Observations in tide gauge stations along the left side of the typhoon track on the southeast coast of China have indicated significant storm surge during the typhoon landfall (Wang et al., 2020). This phenomenon was further substantiated by Du et al. (2020) through simulations of varying typhoon paths within the Pearl River Estuary. The Typhoon Chanthu of 2010, which made landfall in the northernmost region of Zhejiang Province, instigated storm surge levels exceeding one meter on the left side of its path, affecting multiple locations in Zhejiang and Fujian provinces. This event resulted in direct economic losses of 1.013 billion CNY and 13 million CNY, respectively, surpassing the 5 million CNY losses incurred in Shanghai, situated on the right side of the typhoon’s path, as reported in the China Marine Disaster Bulletin, (2010). In 2013, Typhoon Fitow’s landfall at the juncture of Fujian and Zhejiang provinces inflicted even more severe economic repercussions, predominantly in Fujian province, which lies on the left side of the typhoon’s path, amounting to direct economic losses of 1.154 billion CNY (China Marine Disaster Bulletin, 2013). The absence of precise and timely predictions for storm surges on the left side of typhoon paths could pose a grave threat to coastal safety and engineering projects in these regions. Consequently, the need for accurate and real-time simulation and prediction of storm surges is of paramount importance for the safety and preservation of these vulnerable coastal areas.
In order to achieve an accurate simulation of storm surges, various factors need to be considered, such as the configuration of shoreline and bathymetry, the value of bottom friction coefficient, and most importantly, the precision of typhoon wind field (Zhou et al., 2022). For the numerical simulation and prediction of storm surges, there are many kinds of wind fields that can be used. Some studies have simulated historical storm surge events driven by typhoons along the coast of China using the ERA5 wind field (Hersbach et al., 2020) and validated the results with tide gauge (Dullaart et al., 2020). The results indicate that ERA5 wind field can improve the accuracy of storm surge simulation and prediction. However, ERA5 wind field is a post-processed product and not available in real time and cannot be used for operational storm surge forecasting.
Currently, the circular wind field model is predominantly utilized for operational storm surge forecasting in mainland China (Feng et al., 2016) for the sake of timeliness, and has been extensively applied in operational storm surge forecasts in many other regions, such as the Bay of Bengal (Liu et al., 2023). Typhoon circular wind field is a simplified model that describes the distribution of wind speed and direction around the center of a typhoon and has been applied to many storm surge models in different regions, such as the Gulf of Mexico (Houston et al., 1999), the North Atlantic (Wang et al., 2022), and the South China Sea (Li et al., 2020).
The use of the circular wind field also has some limitations and challenges. One of them is that the traditional circular wind field generally forms a positive surge on the right side of the typhoon path and a negative surge on the left side of the typhoon path in the northern hemisphere (Son et al., 2022), which makes it difficult to capture the storm surge on the left side of the typhoon path before and after landfall. At present, there is still a research gap on the storm surge on the left side of the typhoon landfall along the coast of mainland China, and the possible regions and mechanisms are not clear.
Therefore, this study aims to address these research gaps by conducting a comprehensive analysis of the typhoon storm surges in mainland China to understand the spatiotemporal distribution and severity of the storm surge on the left side of the typhoon path and to briefly analyze its causes. We use the tide gauge data during the typhoon landfall period in the southeast coast of mainland China from 1986 to 2016 to obtain the distribution pattern of the storm surge on the left side of the typhoon path, and compare the typical typhoon processes during the landfall period using the circular wind field model and the reanalysis wind field to analyze the causes of the surge. The paper is structured as follows: Section 2 describes the data and methods used in this study; Section 3 presents the results on the spatiotemporal variability of storm surge on the left side of typhoon path and possible reasons; Section 4 summarizes and discusses the main findings and implications of this study.
Methodology
Datasets
The typhoon best tracks observation datasets were obtained from the China Meteorological Administration (CMA). It contained data for 913 typhoon events with center location (the latitude and longitude), time, center maximum sustained wind speed, and center pressure from 1986 to 2016 at 6-hourly intervals (Lu et al., 2021). In this study, we focused on landfall typhoons with Landfall location and time were obtained from the intersection of typhoon tracks across the coastline, which is the basic time requirement of surge tide data selection.
The storm surge analysis used data from 17 tide gauge stations located on the southern coast of mainland China, which were collected from the National Marine Data and Information Service (NMDIS), as shown in Figure 1. The tide gauge stations contained 3154 storm surge processes in total during 1986 to 2016.
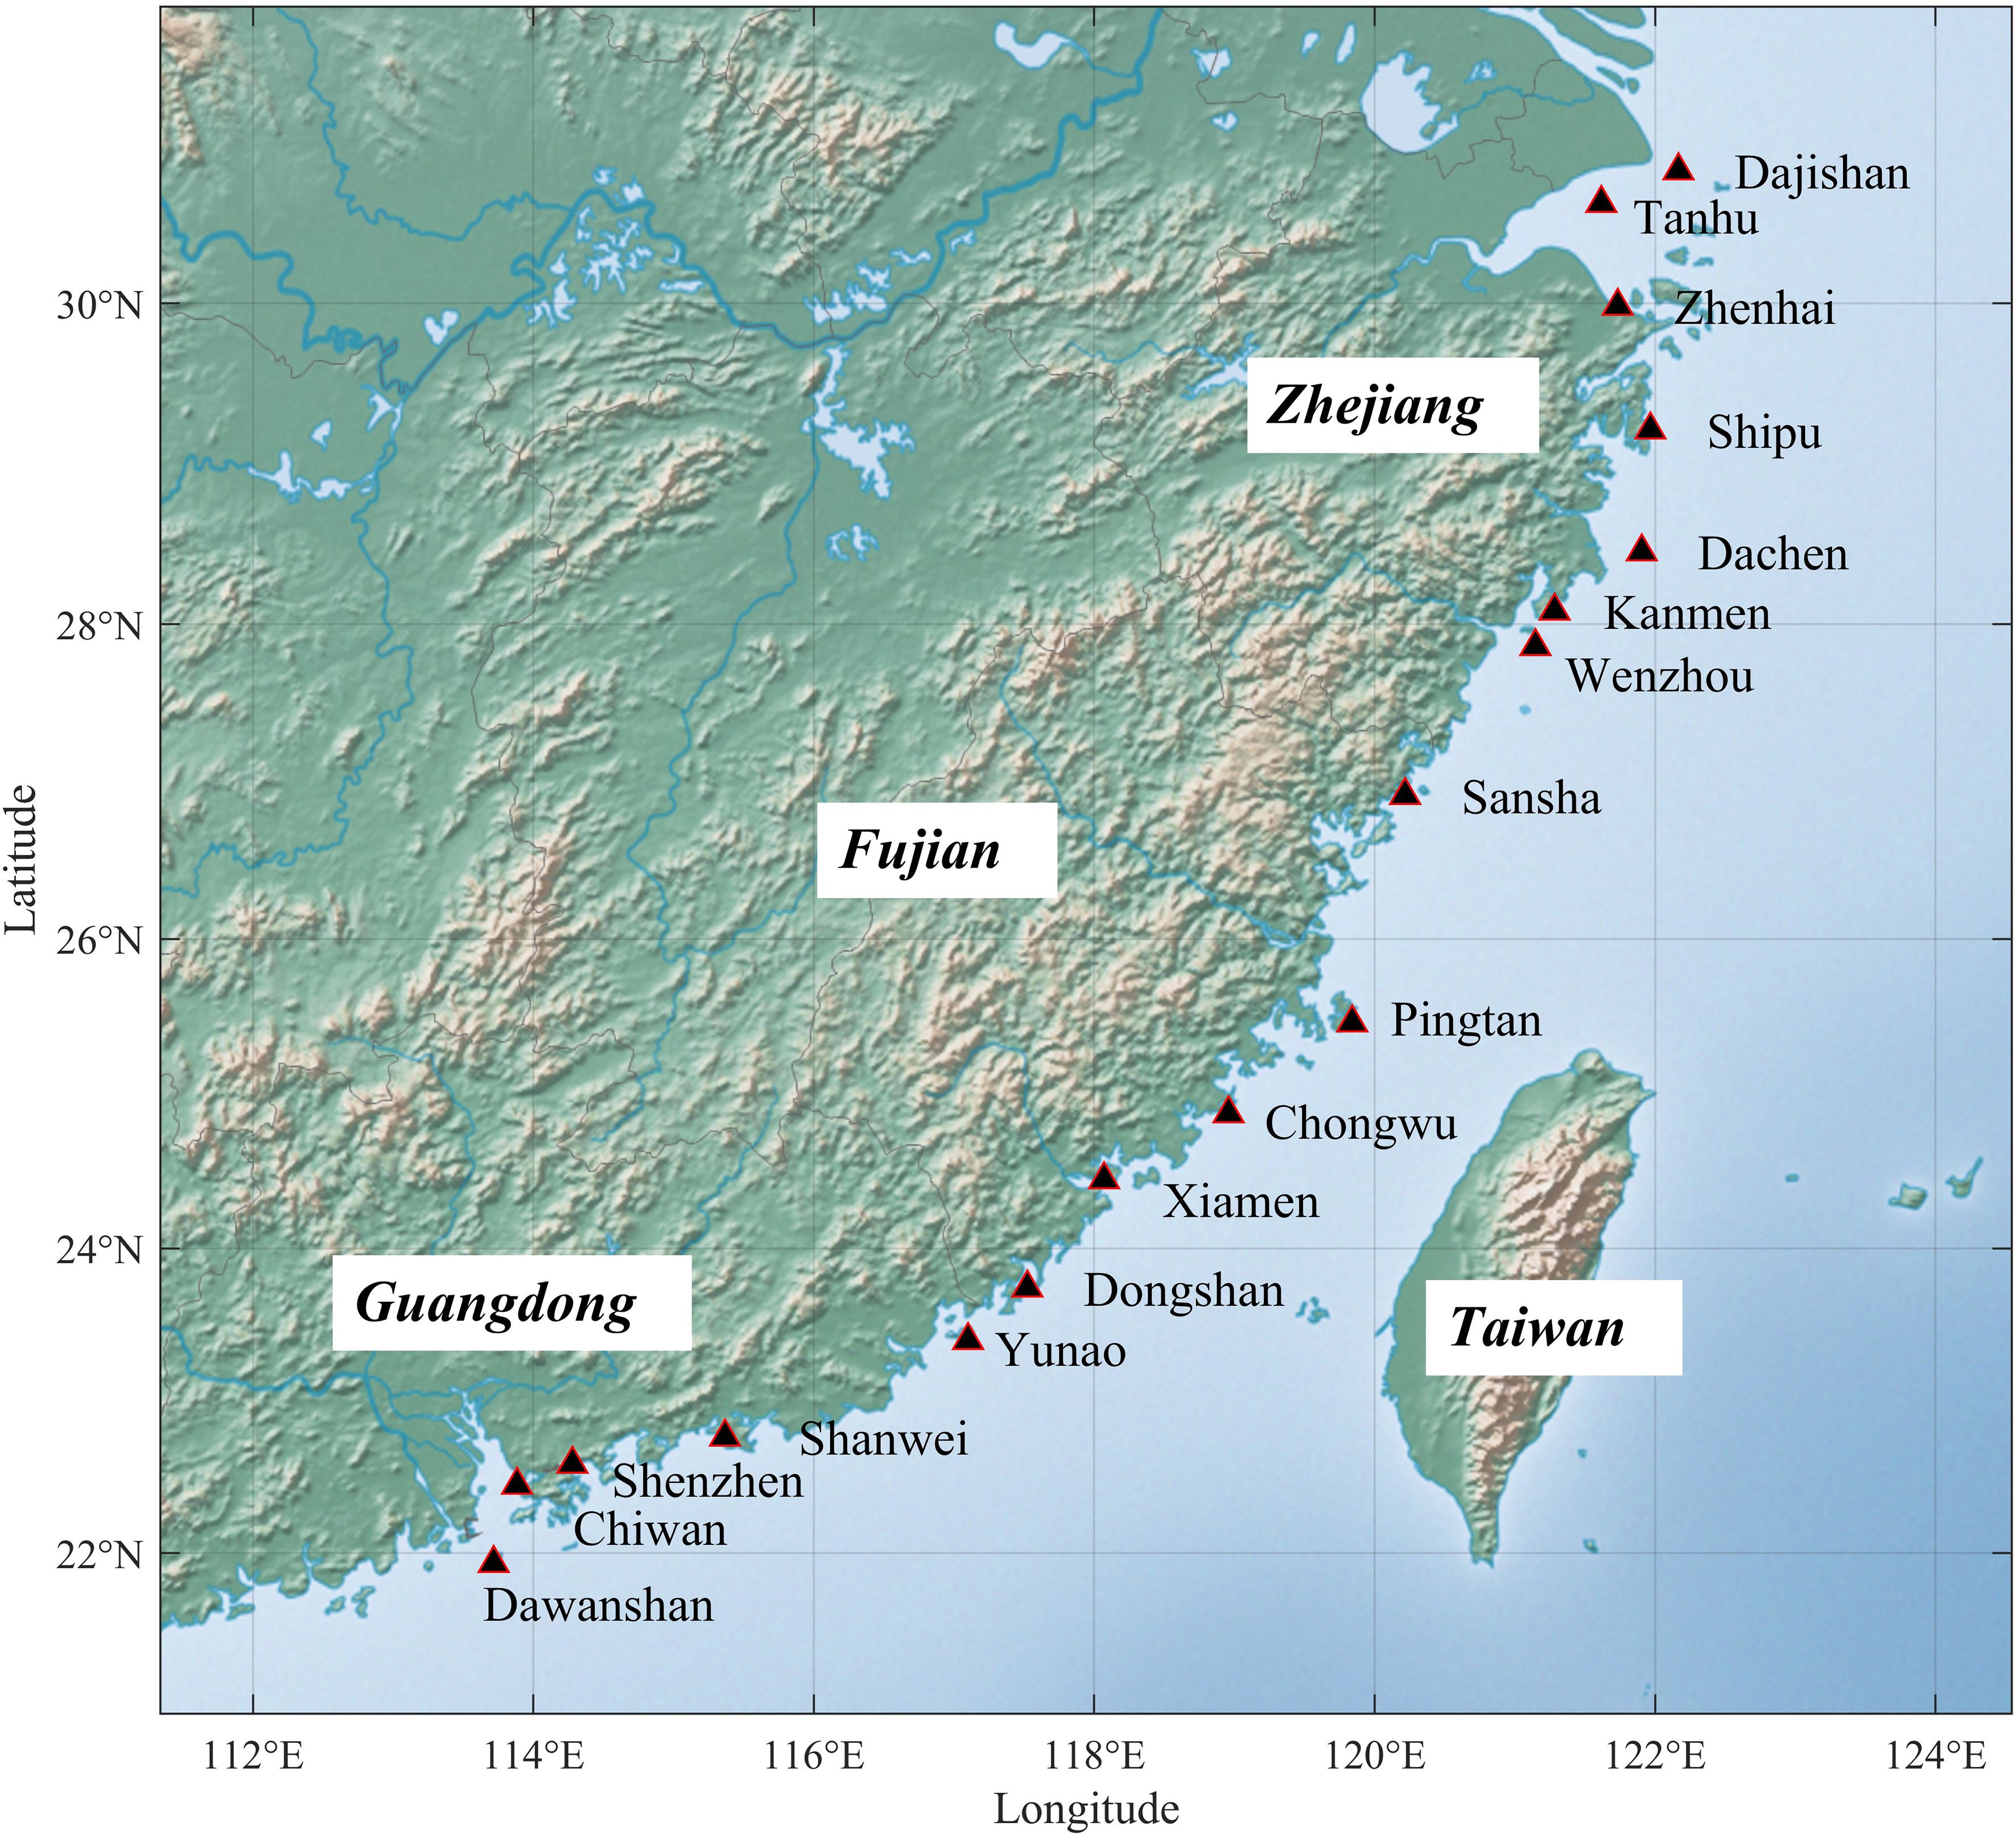
Figure 1 Location of the tide gauge stations used in this study.
Wind field model
The model wind field used in this study is calculated by the circular typhoon model developed by Jelesnianski (1965), which is widely used for storm surge simulation and prediction in the coastal areas of China (Feng et al., 2012; Wang et al., 2019; Tian and Zhang, 2021). This model is a simple and efficient way to represent the wind speed and direction distribution around the center of a typhoon. The calculation formulas are as Equation 1:
where and .
In these equations, (x,y) and (xc,yc) represent the positions of the calculated point and the typhoon center, respectively; θ is the flow angle. In the present study, according to Feng et al. (2012), we set θ = 20° if , and θ = 15° if . (Vox,Voy) is the translation speed of the typhoon in the x and y directions; Vmax is the maximum wind speed of the typhoon; Rmax is the distance from the location where the maximum wind speed occurs to the center of the typhoon; r is the distance from the calculation point to the center of the typhoon; Vst is the wind velocity at the calculation point; i and j represent the unit vectors in the x and y directions, respectively.
We compare the ERA5 wind field with the circular model wind field. The ERA5 reanalysis dataset has a high temporal and spatial resolution (Hersbach et al., 2023), which can effectively capture the wind field structure in the coastline of China during the passage of typhoons. Several studies have evaluated the performance of ERA5 wind field in reproducing the climatology and long-term trend of near-surface wind speed over China and found that it is highly consistent with in situ station observations and satellite-based wind field observations (Liu et al., 2021; Chen et al., 2023). Although some studies have suggested that ERA5 underestimates the outer size of typhoons (Bian et al., 2021) it still depicts the circulation structure and outer core typhoon winds better than other reanalysis datasets (Zarzycki et al., 2021; Zhang and Chan, 2023). In this study, the hourly u and v wind components at 10-m height (0.25° × 0.25°, from 1986 to 2016) provided by ERA5 datasets are used to analyze the typhoon-induced wind fields in the study area. To compare the ERA5 wind field with the circular wind field model, we use the typhoon track information provided by CMA to apply the circular wind field to the same spatial resolution and boundary grid as the ERA5 wind field, and generate the circular wind field model and ERA5 wind field for each landfalling typhoon process before and after 24 hours for subsequent comparison analysis.
Storm surge model
In this study, we use a refined unstructured-grid storm surge model developed by previous work (Feng et al., 2016, 2018) to simulate storm surges. It is based on the ADCIRC model (Luettich et al., 1992), and has a resolution varying from 50km in the open boundary to 100 m in coastal areas, with 274,415 vertices in total. The model domain ranges from 113.2°E to 134°E and from 13.8°N to 31.9°N, covering all tide gauge stations in the study area, as shown in Figure 2.
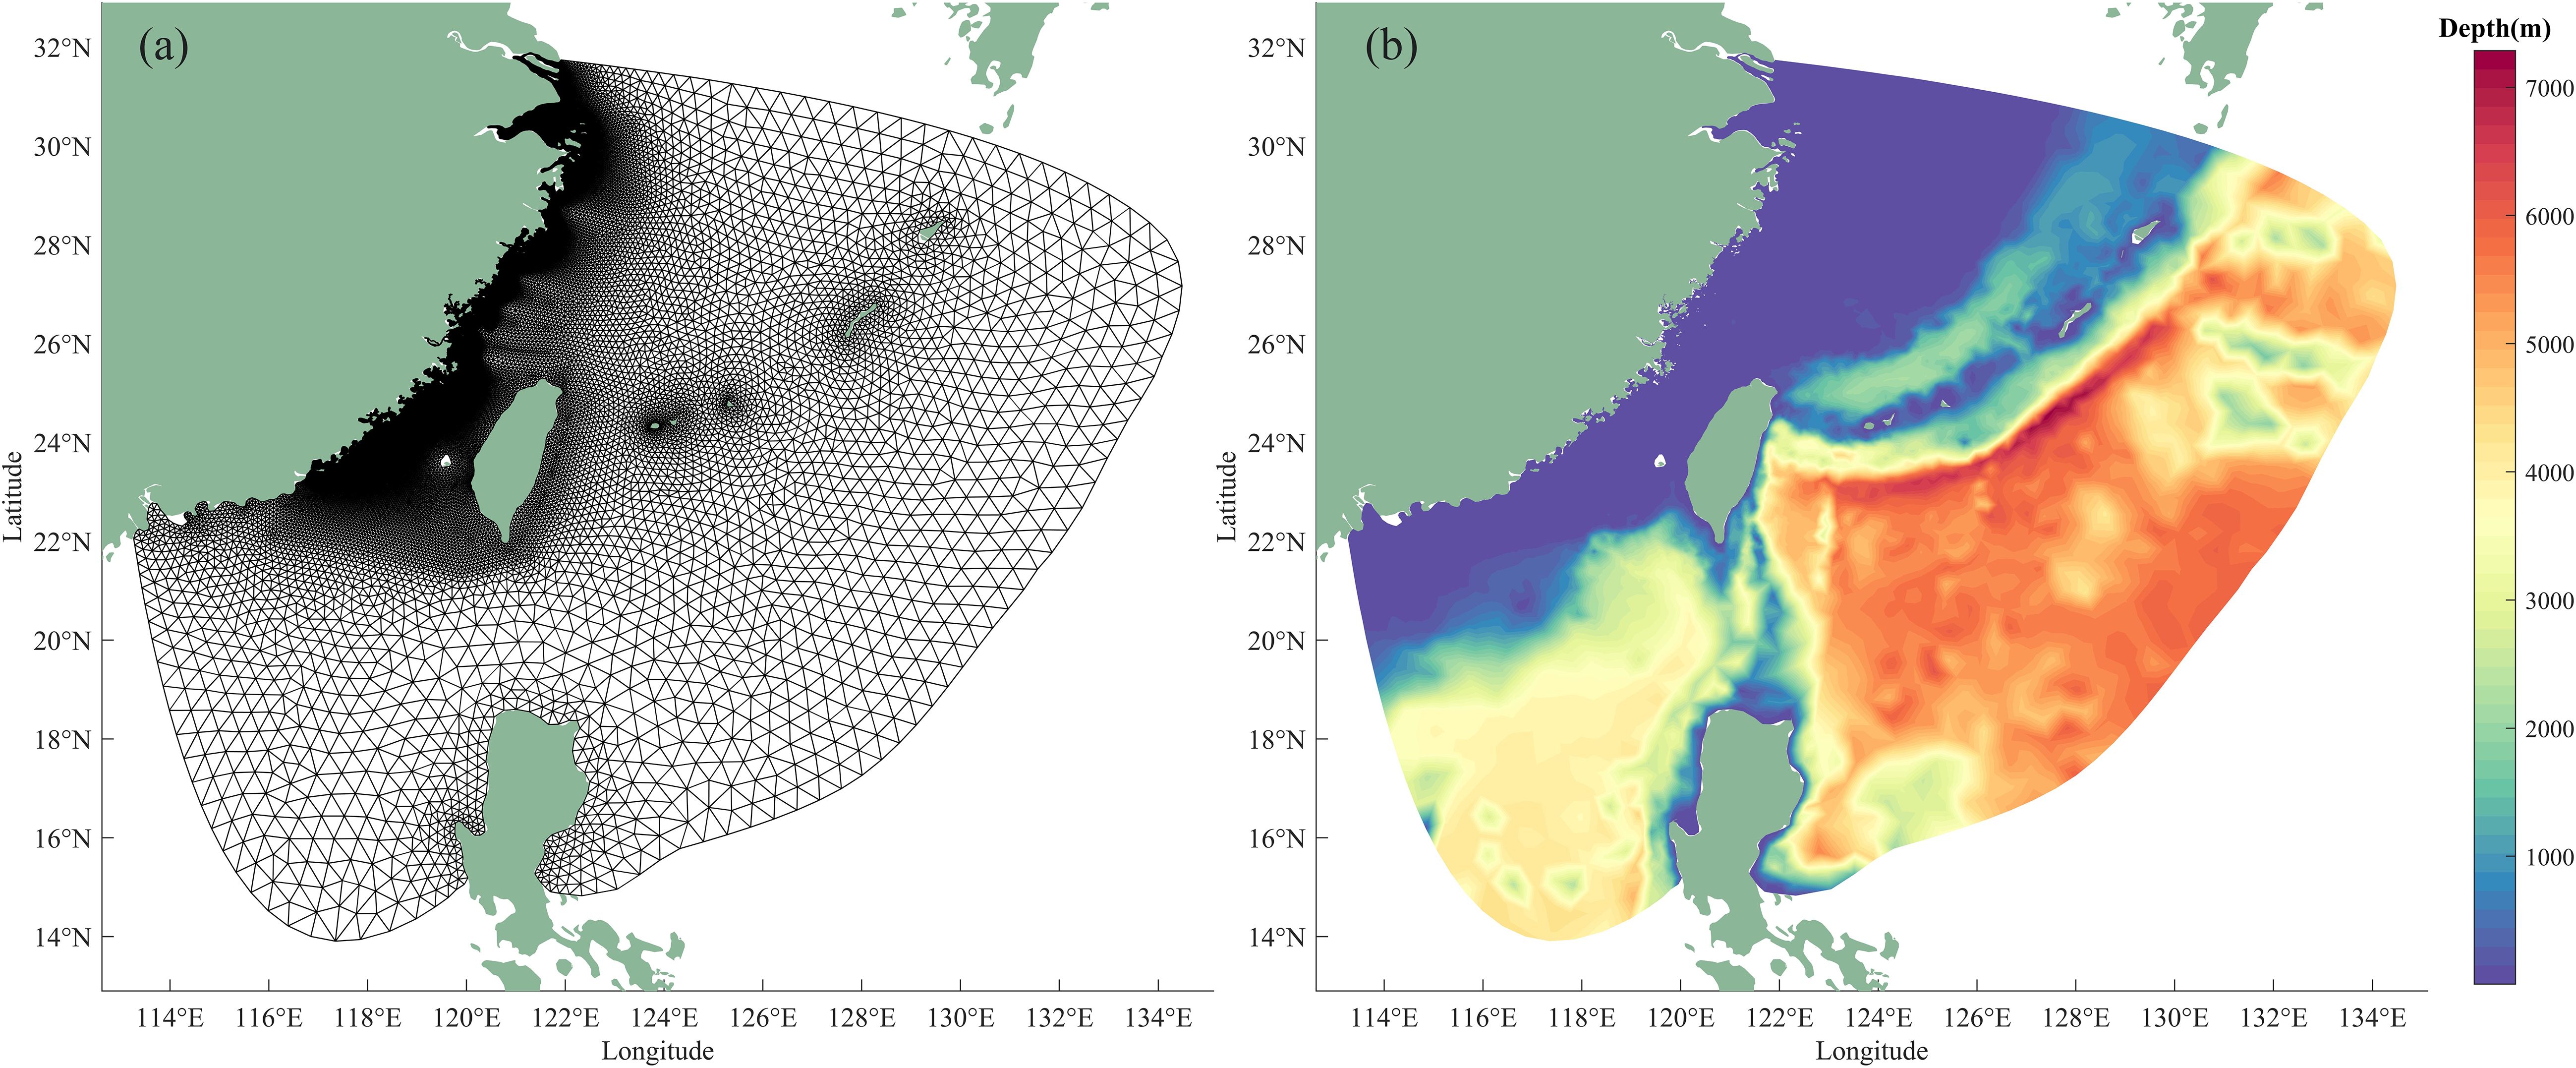
Figure 2 Unstructured grid of the computational domain (A). Bathymetry of the study area (B).
Results
Is storm surge on the left side of landfall typhoons a threat?
In this study, in order to investigate the abnormal storm surge on the left side of the typhoon path, we selected 160 typhoons that made landfall in the study area and had valid tide gauge water level data during the typhoon period. Based on this, we extracted 1779 water level processes corresponding to the typhoon time periods for analysis. During some typhoon processes, the maximum surge occurred at some stations when the typhoon was far away from the station, which was obviously unrelated to the typhoon. To filter out the storm surge under the influence of the typhoon, we defined the storm surge at each station before and after 24 hours of each typhoon landfall in this study as the typhoon storm surge. Following Feng et al. (2021b), we set the storm surge exceeding 50cm as significant surge. Then we performed statistics on the storm surge at the stations on the left and right sides of each landfalling typhoon, as shown in Figure 3.
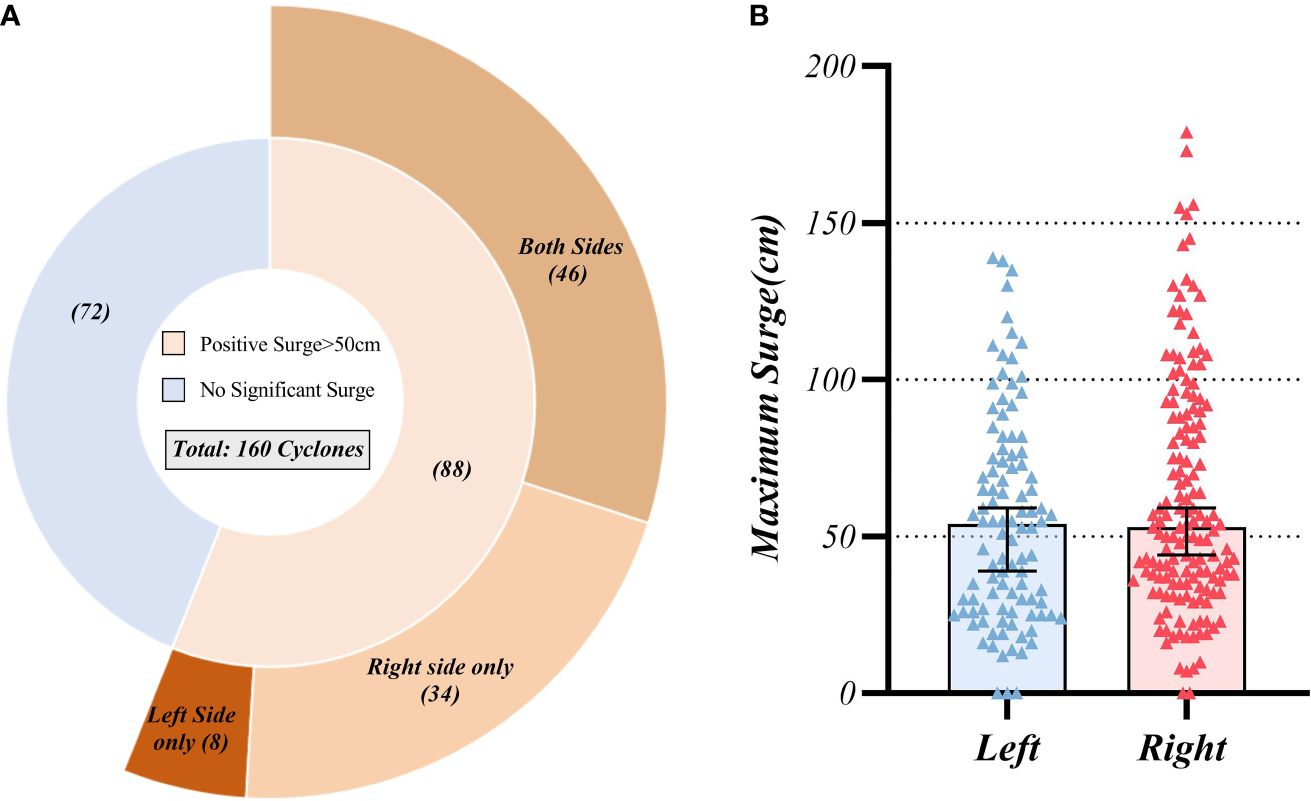
Figure 3 Sunburst chart of typhoon categories for landfalling typhoons with storm surge observation records in the study area during 1986-2016 based on surge levels (A). Comparison of maximum storm surge elevation on the left and right sides of the landfalling typhoon tracks (B). The notches in the boxes indicate the 95% confidence interval for the median.
Figure 3A illustrates that, over the past three decades, 88 landfalling typhoons have induced storm surges exceeding 50 cm at one or more tide gauge stations within the study area, representing 55% of the total events. Conversely, the remaining 45% of typhoons did not produce notable storm surge increases on either side of their paths. Of the typhoons generating significant surges, 54 were associated with surges surpassing 50 cm on the left side of their paths, with 9% of these typhoons exclusively causing significant surges on the left side during landfall. Out of 160 landfalling typhoons, storm surge data was available for 102 events on the left side and for 155 events on the right side of their paths. To analyze the distribution of maximum surges from typhoons impacting the southern mainland China coastline, we computed the peak surge levels at all stations flanking each typhoon’s path, as depicted in Figure 3B. Notably, the maximum surge distributions on both sides of the paths were remarkably similar, with medians marginally above 50 cm. The left-side surges were modestly lower than those on the right, peaking at 1.8 m and 1.39 m, respectively. This finding indicates that the storm surges on the left side of the typhoon paths, before and after making landfall on the southeast coast of mainland China, were generally on par with those on the right side, warranting attention for effective disaster prevention.
Spatial-temporal features of storm surge on the left side of landfall typhoons
The storm surge on the left side of the typhoon path deserves attention in terms of both the event frequency and the overall surge magnitude, and we investigate its spatiotemporal distribution. We separately calculated the annual time series and long-term trends of the extreme surge on the left side of the landfalling typhoons, the number of landfalling typhoons that caused significant surge on the left side, and their proportion among all the landfalling typhoons that affected the study area from 1986 to 2016, as shown in Figure 4.

Figure 4 Annual time series from 1986 to 2016 of: (A) the number of landfall typhoons affecting the study area and causing significant (>50cm) storm surge on the left side of their paths; (B) the total number of landfall typhoons affecting the study area; (C) the proportion of landfall typhoons that caused significant storm surge on the left side of their paths relative to the total number of typhoons; (D) the maximum storm surge height (cm) caused on the left side of the paths by the landfall typhoons affecting the study area. Linear trends and the corresponding 95% confidence intervals are also presented.
Figure 4 reveals distinct long-term trends in the frequency and magnitude of storm surges on the left side of typhoon paths. From 1986 to 2016, there was a significant annual increase of 0.06 in the number of landfalling typhoons causing notable storm surges on the left side, whereas the overall count of landfalling typhoons showed no discernible trend. Figure 4C presents the ratio of the former to the latter, indicating a marked annual rise of 1.15% in the likelihood of significant storm surges on the left side when typhoons made landfall on the southeast coast of mainland China. Post-2005, over 50% of typhoons annually generated storm surges exceeding 50 cm on the left side. Moreover, the severity of these surges has escalated, with an average annual increase of 1.61 cm. Since 2004, at least half of the years recorded maximum storm surges above 1 m. The spatial distribution of storm surges from landfalling typhoons at each tide gauge station within the study area is detailed in Figure 5.
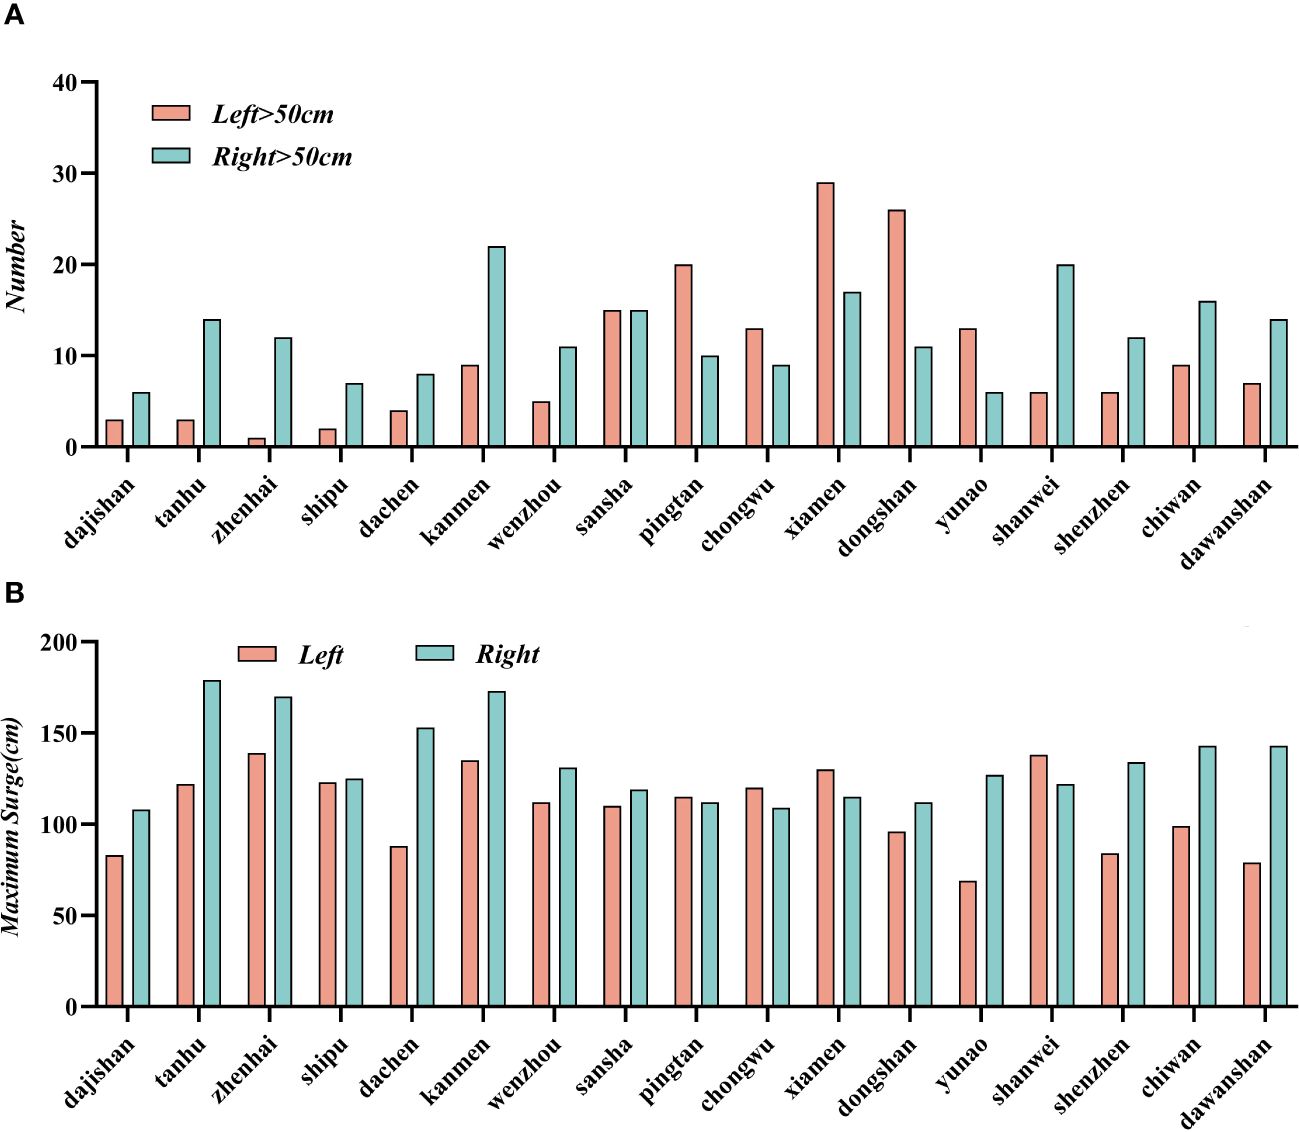
Figure 5 The number of times each tide gauge station experienced a storm surge increase of over 50cm when located on the left (orange) and right (green) sides of the typhoon path (A), and their maximum surge during all storm surges from 1986-2016 at that station (B).
Figure 5 shows the number and maximum of surges exceeding 50cm observed at the tide gauge stations on the left and right sides of the landfalling typhoon path. It can be seen that the distribution of typhoon storm surges has strong regional characteristics. Most of the stations have much more significant storm surge events on the right side of the typhoon path than on the left side, especially the stations in Zhejiang and Guangdong provinces, where the number of storm surge events on the right side is more than twice that on the left side (Figure 5A). However, the situation is reversed for the Fujian coast. The tide gauge stations on the Fujian coast have much more significant storm surge events on the left side of the typhoon path than on the right side. Pingtan, Xiamen and Dongshan stations experienced more than 20 significant storm surges on the left side of the landfalling typhoons during 1986-2016. It is worth noting that the Fujian coast is also the area with the most significant storm surge events, especially Xiamen and Dongshan stations, which experienced more than 40 significant storm surges exceeding 50cm, much higher than the regional average of about 22 significant storm surge processes.
Subsequent analysis of the peak storm surge levels during the same period, as illustrated in Figure 5B, indicates that the distribution of maximum surge levels diverges from surge frequency patterns. The most intense surges predominantly occurred in Zhejiang province, with Tanhu, Zhenhai, and Kanmen stations reporting maximum surges over 150 cm. Conversely, the Fujian coast, despite its high frequency of significant surge events, contributed minimally to the peak surge levels. Historical data from 1986 to 2016 reveal that the extreme storm surges on the right side of the path at Zhejiang and Guangdong stations were substantially larger than those on the left. However, for the Fujian coast’s tide gauge stations, the extreme surges on the left side marginally surpassed those on the right.
To elucidate the factors influencing this distribution, we analyzed the landfall characteristics of typhoons that generated significant left-side storm surges during the study period, as illustrated in Figure 6.
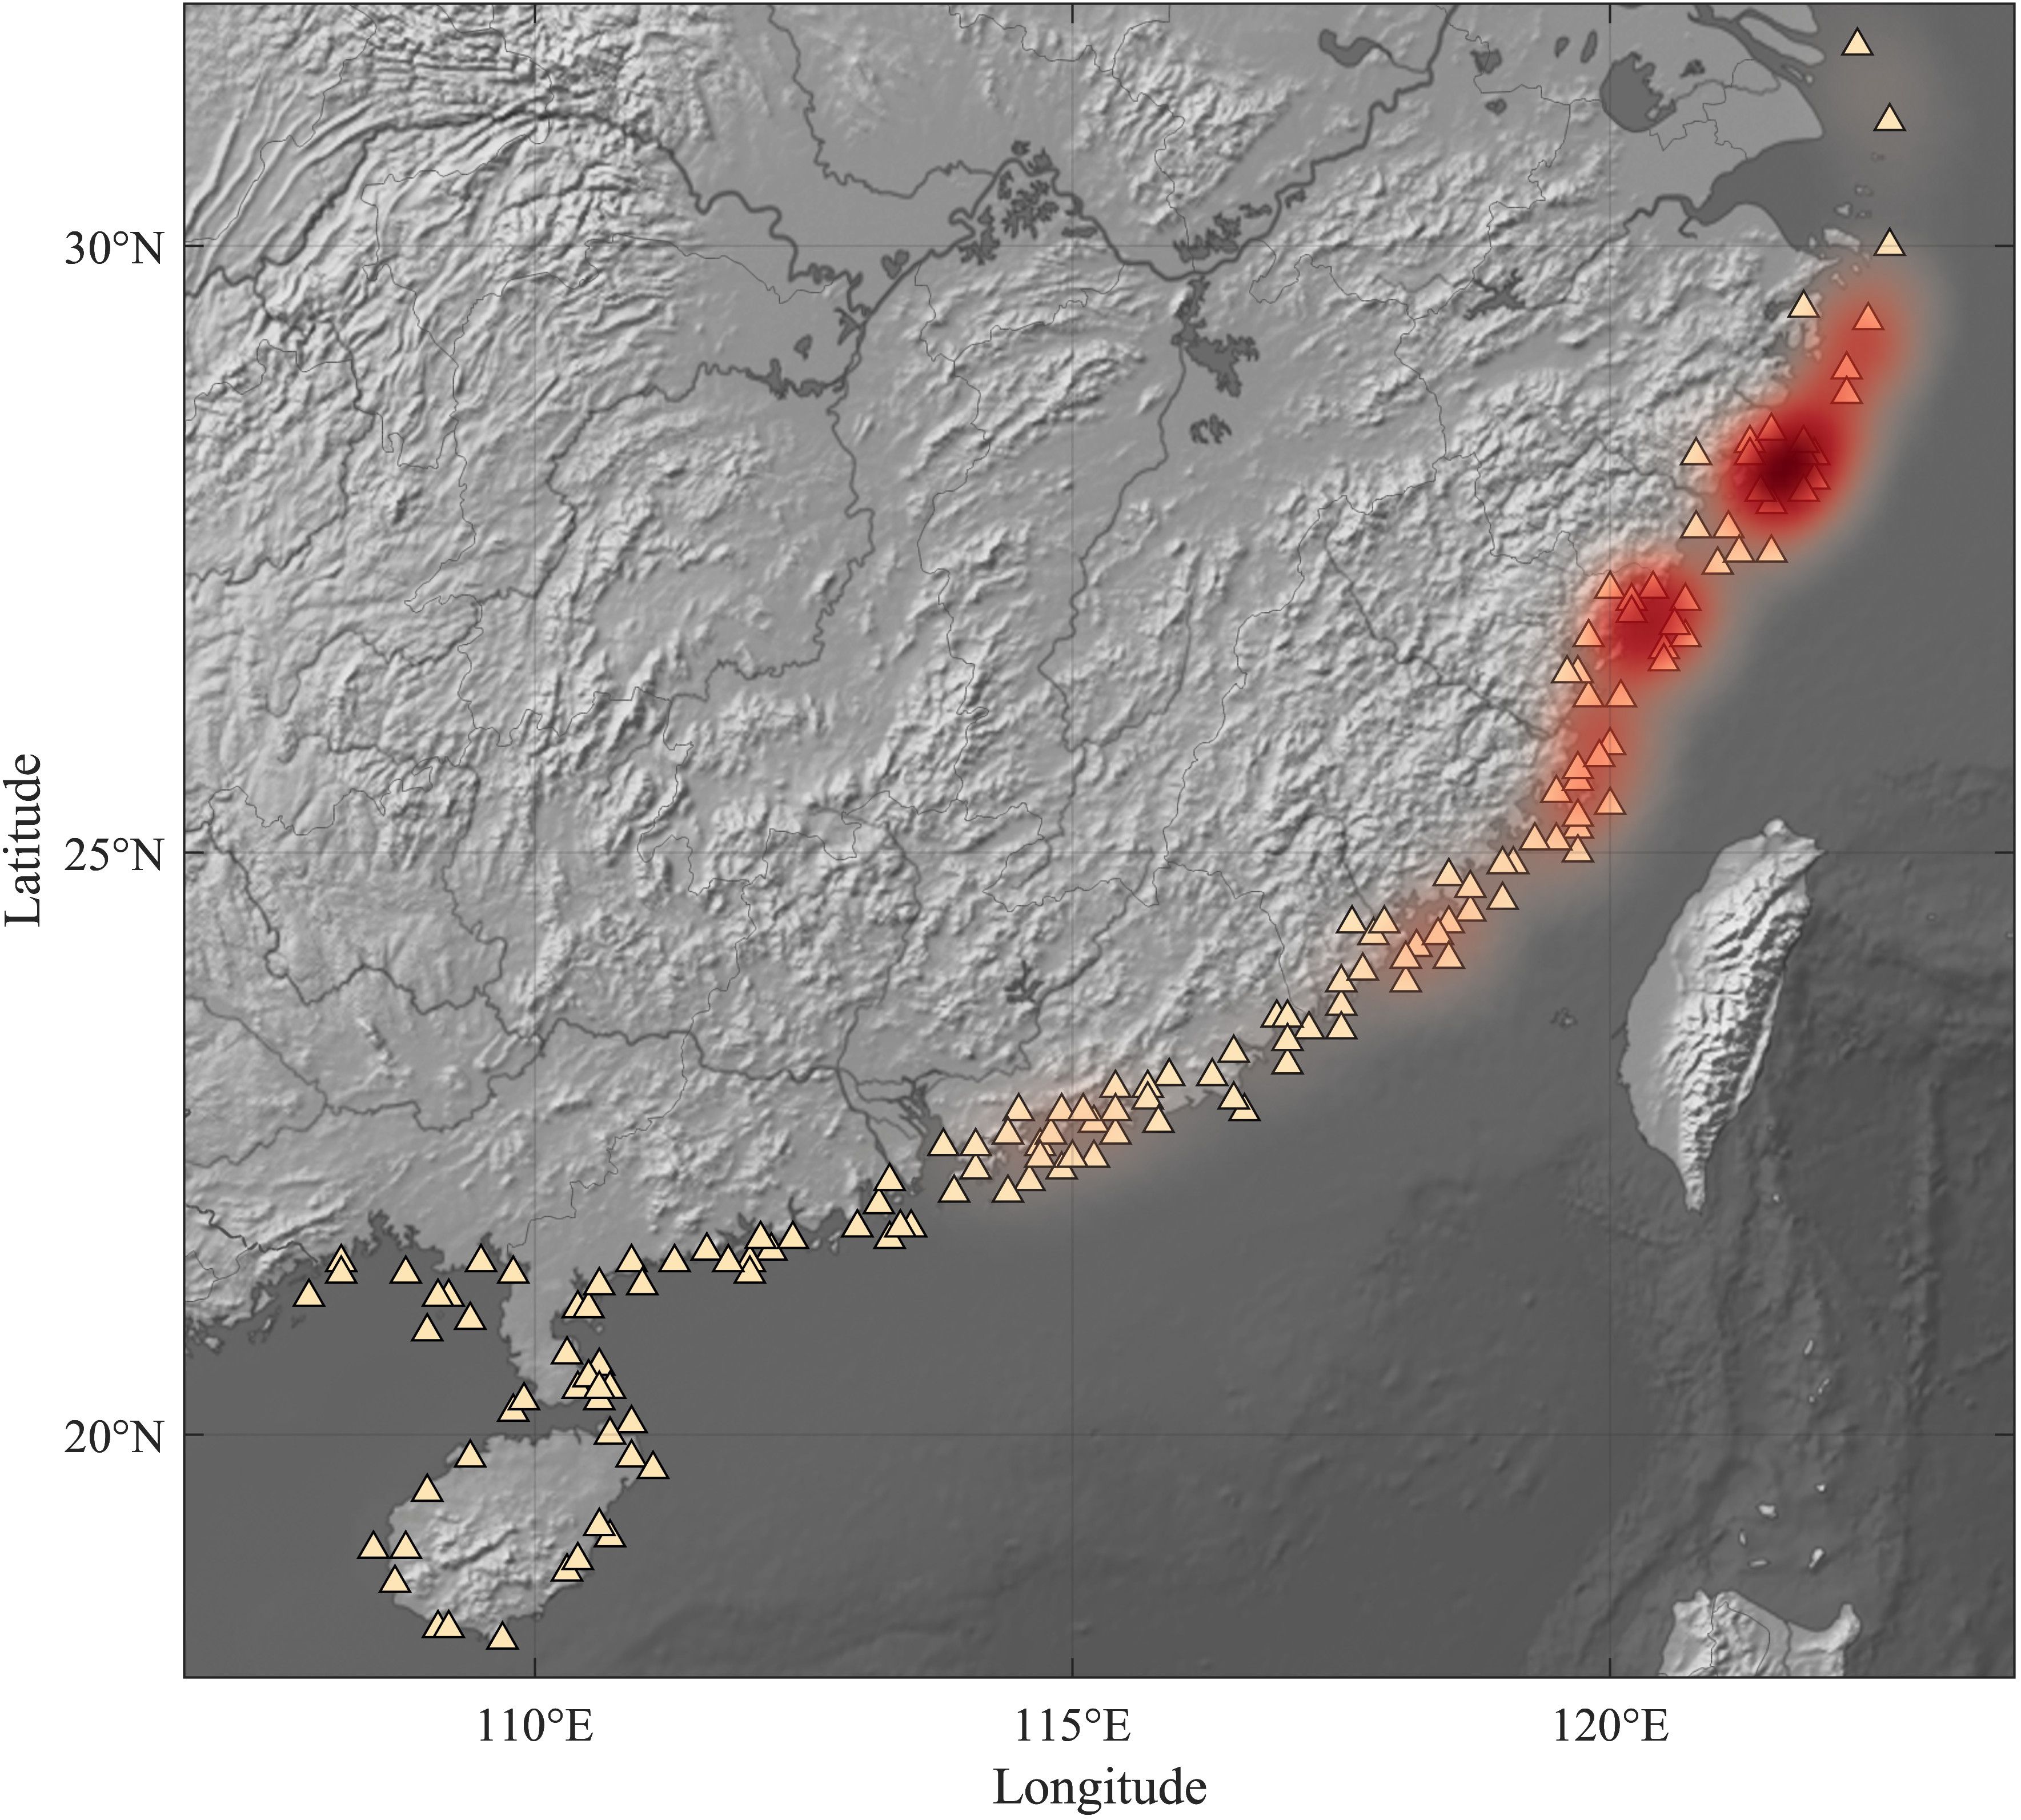
Figure 6 Typhoon landfall location distribution. Red hotspots represent the main area where the typhoon made landfall that caused surge greater than 50cm on the left side of the path.
The data from 1986 to 2016 indicate that the landfall sites of typhoons causing storm surges were fairly distributed across the study area, predominantly along the Guangdong and Fujian coasts. However, the landfalls of typhoons responsible for significant surges exceeding 50 cm on the left side were notably concentrated in the northern region, particularly north of the Taiwan Strait and along the Zhejiang and northern Fujian coasts. Despite Fujian and Guangdong experiencing the highest number of landfalls, they recorded a lower incidence of substantial left-side surges.
Analysis of left-side storm surges on typical typhoon paths
The traditional circular wind field model, known for its efficiency, is extensively utilized for prompt storm surge forecasting along China’s southeast coast. However, its accuracy in simulating surges on the left side of a typhoon’s path pre-landfall and post-landfall remains suboptimal.
Typhoon Winnie in 1997 was considered one of the most devastating natural disasters in China’s history. The typhoon originated from a tropical disturbance in the western Pacific on August 8, 1997, and moved steadily northwestward after formation, gradually intensifying. When it made landfall in Wenling city, Zhejiang province, China, on the evening of August 18, the central pressure was about 960 hPa, and the maximum surface wind speed reached 40 m/s.
Given that Typhoon 9711 Winnie landed in regions vulnerable to left-side storm surges (northern Fujian and coastal Zhejiang Province) and induced surges exceeding 1 meter, this case is selected for an in-depth analysis of surge genesis on the typhoon’s left side and the wind field model’s limitations in this context.
Two numerical simulations were conducted to model the storm surge distribution during Winnie’s impact. The pressure and wind fields used to drive the storm surge model during the two experiments are provided by the ERA5 reanalysis data (marked as Run1) and the Jelesnianski circular typhoon model (marked as Run2) mentioned above respectively. The simulation spanned from 48 hours before to 24 hours after landfall, covering approximately three days from August 16, 1997, 12:00 UTC to August 19, 1997, 12:00 UTC. The time step is set to 5 seconds, and effects of other factors such as astronomical tides were not considered. The model’s predictive efficacy for storm surges is elaborated in (Feng et al., 2016, 2018).
The distribution of storm surge elevation from 18 hours before landfall to landfall period for the two experiments is illustrated in Figure 7.
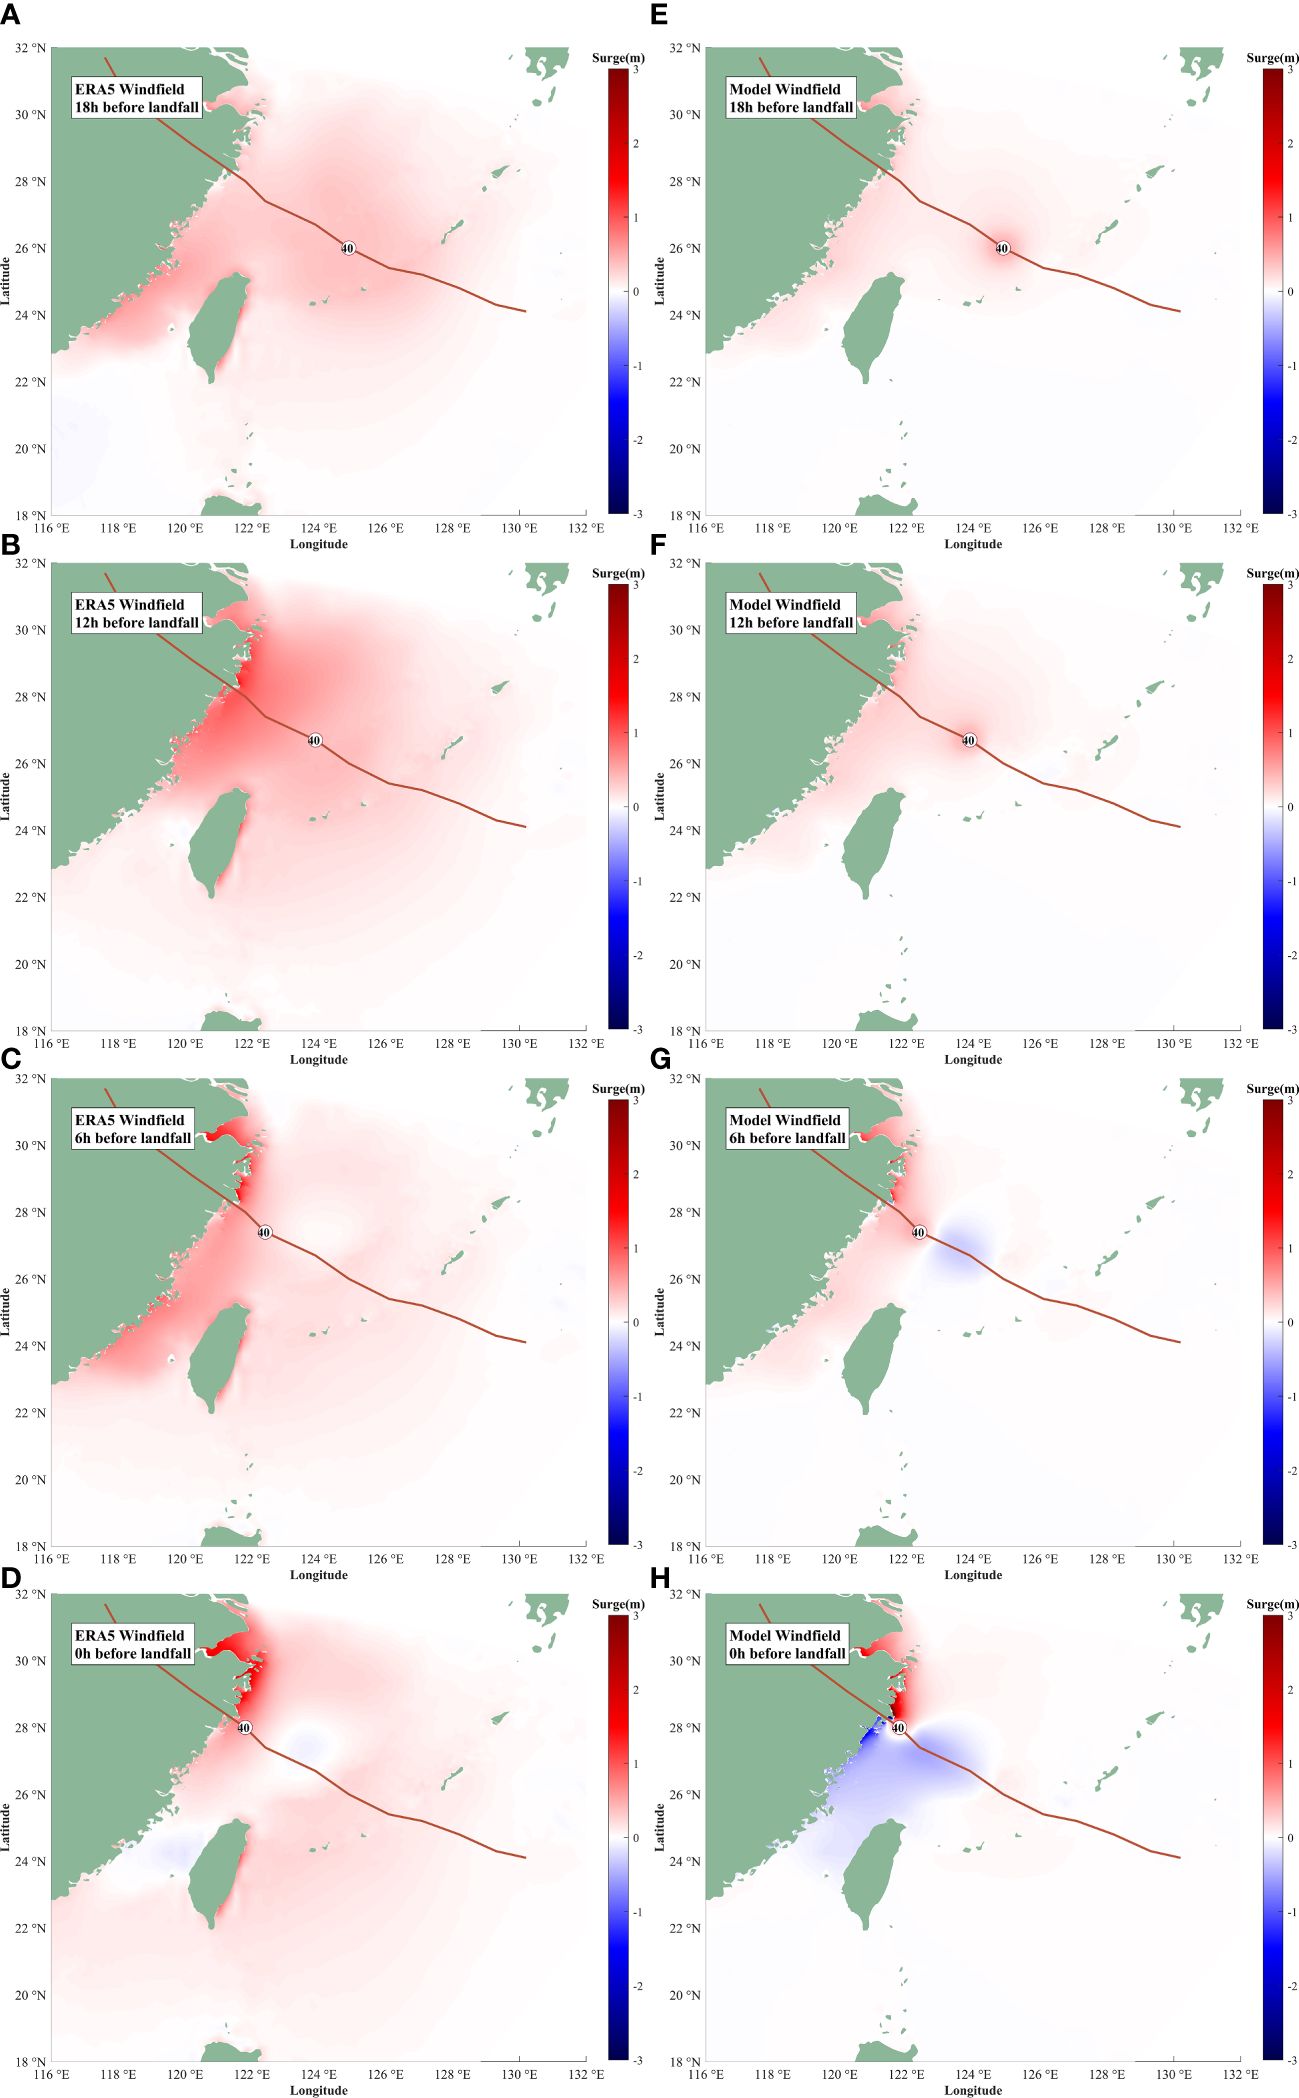
Figure 7 Storm surge distribution for Run1 (A–D) and Run2 (E–H) for Typhoon 9711 (Winnie) at different phases: 18 hours before landfall (A, E), 12 hours before landfall (B, F), 6 hours before landfall (C, G), and landfall phase (D, H). The typhoon track and current position of the typhoon with its maximum sustained wind speed (m/s) are shown.
Figures 7A–D illustrate the storm surge elevation outcomes from Run1, revealing positive surges on both sides of the typhoon’s path when its center was northeast of Taiwan, 18 hours before landfall. Initially, the left side experienced higher surges. As the typhoon progressed northwestward, the right-side surges began to dominate, although significant surges over 0.5 meters persisted in the Taiwan Strait. In the final stages, 6 hours before and during landfall, with the typhoon’s center northwest of Taiwan, the storm surge within the Taiwan Strait diminished significantly in extent and intensity. Nonetheless, the Zhejiang and Fujian coastal regions on the left side continued to register storm surge activity.
Figures 7E–H present the storm surge elevation results for Run2. At 18 and 12 hours before landfall, Run2’s water level distributions on the left side were comparable to those of Run1, with the typhoon center still outside the Taiwan Strait. The primary discrepancies between the runs materialized 6 hours before landfall, marked by a reduction in surge levels within the Taiwan Strait and the emergence of a negative surge in its northeastern sea area. At landfall, substantial surges exceeding 1 meter were noted on the left side of the path.
A comparative analysis of the simulated maximum storm surge at various stations on the left side of the typhoon’s path in Run1 and Run2 against the actual recorded maximum surge at tide gauge stations is detailed in Table 1.

Table 1 Storm surge validation on the left side of typhoon track.
The simulation results, driven by the ERA5 wind field, successfully replicated the storm surge increase at most locations on the left side of the typhoon’s path. The maximum relative bias remained below 30%, and the mean absolute error was recorded at 0.2 meters. Conversely, Run2 exhibited substantial bias across most stations, particularly in contrast to Run1’s outcomes. Notably, Run2 was ineffective in simulating the storm surge phenomenon on the left side.
To investigate the factors influencing the elevated water levels on the left side and the variances between the two wind field simulations, a comparative analysis of the ERA5 and model wind fields was performed 18 hours before the typhoon’s landfall, as depicted in Figures 8A–H respectively.
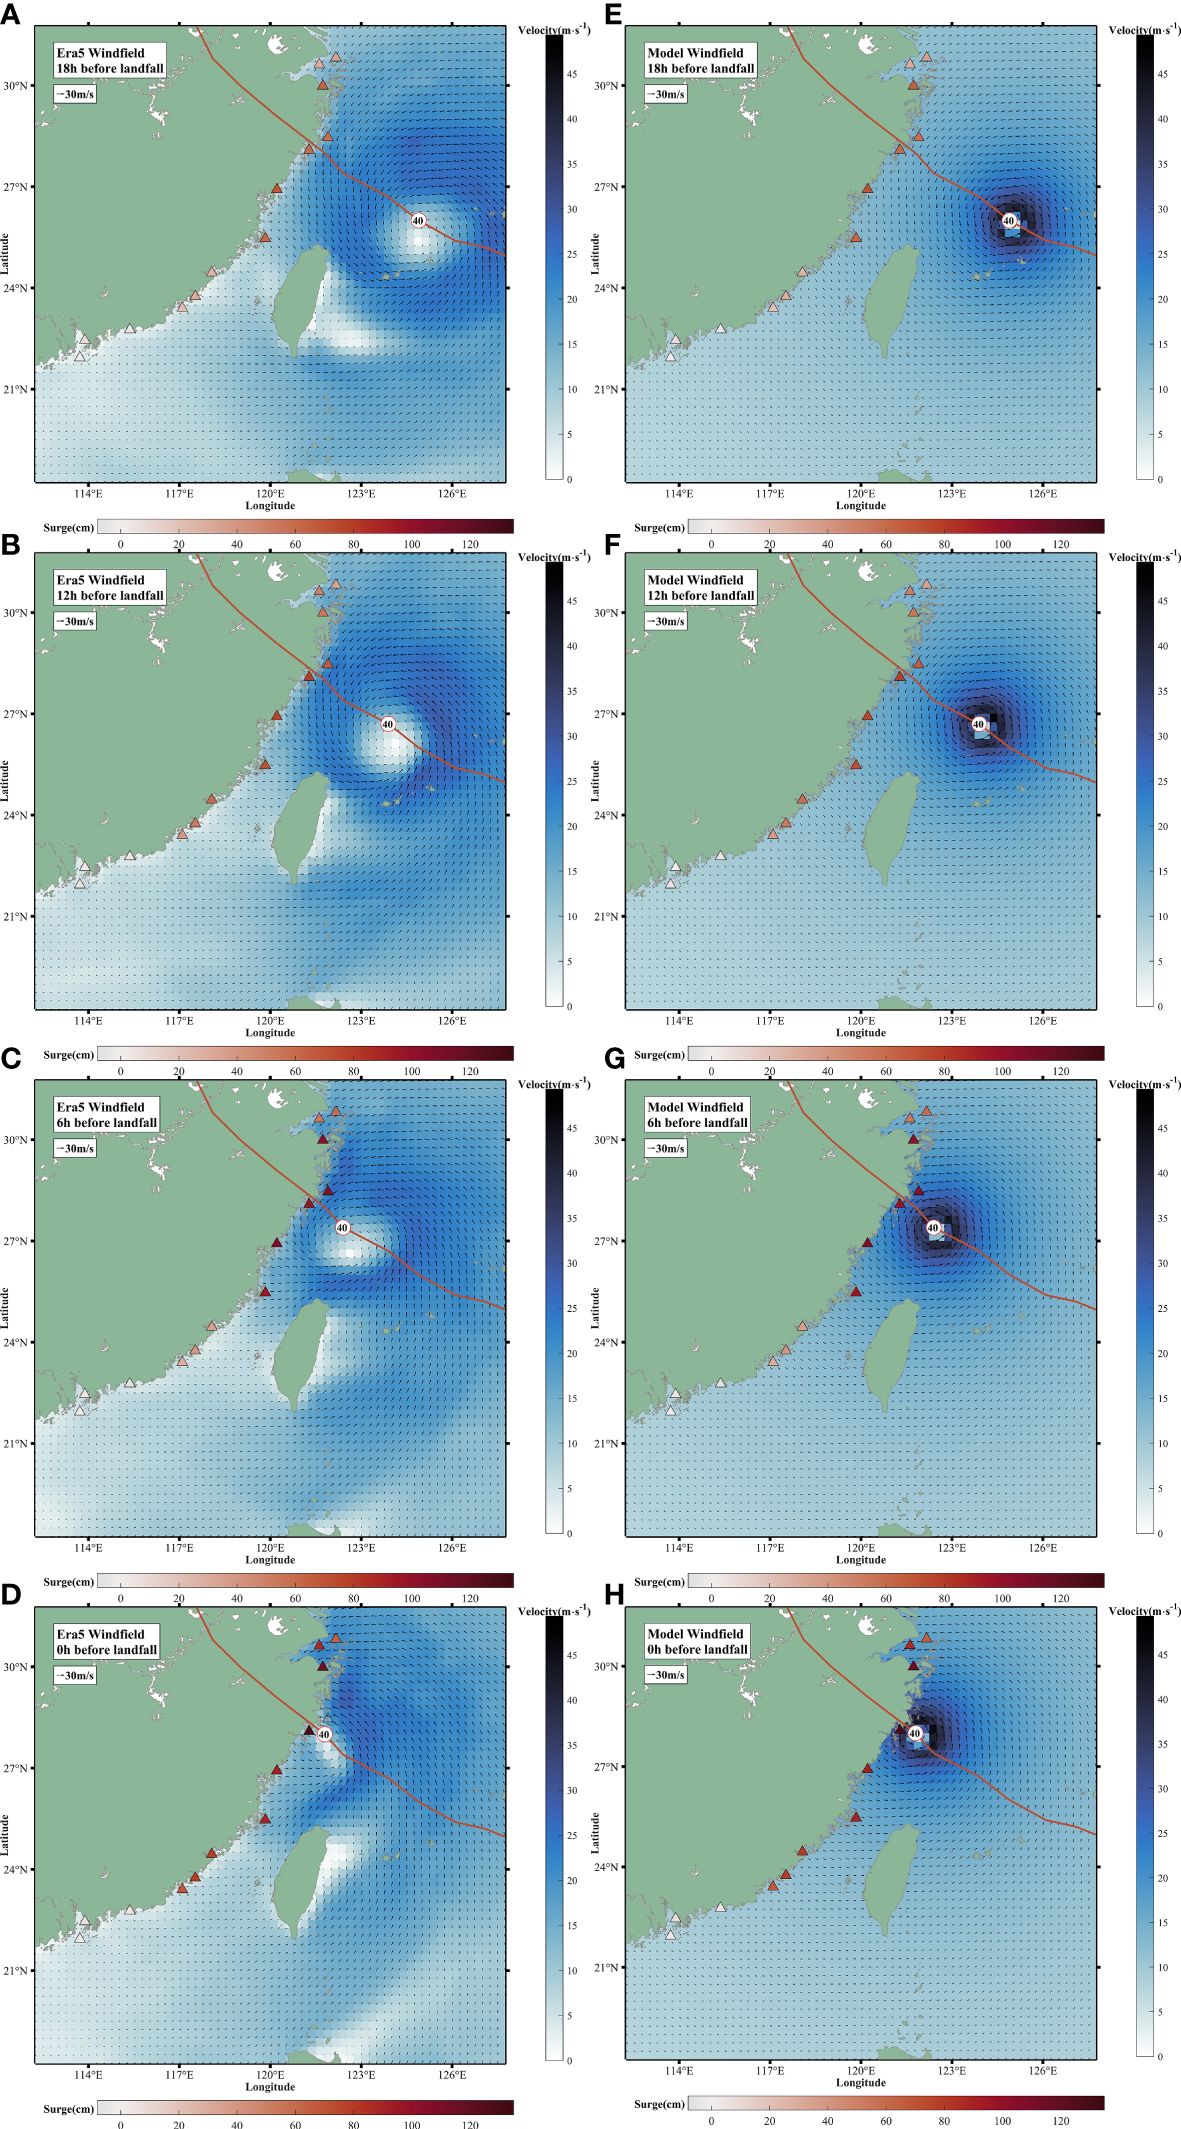
Figure 8 ERA5 wind field (A–D) and circular model wind field (E–H) for Typhoon 9711 (Winnie) at different phases: 18 hours before landfall (A, E), 12 hours before landfall (B, F), 6 hours before landfall (C, G), and landfall phase (D, H). The typhoon track and current position of the typhoon with its maximum sustained wind speed (m/s) are shown. The instantaneous storm surge height at the tide stations with valid water level data during the typhoon are also given.
As can be seen from Figure 8A, 18 hours before Winnie’s landfall, its position was in the northeast of Taiwan Island. The wind direction in the sea area north of Taiwan Island changed counter-clockwise due to the influence of the typhoon, and strong northerly winds appeared along the coast of Zhejiang province, China, while the Taiwan Strait was offshore westerly wind. Since the distance between the typhoon center and the coastline and Taiwan Island was relatively far at this time, its typhoon structure was relatively intact and was not significantly affected by the terrain. The typhoon wind speed in the sea area north of Taiwan Island was not affected. Taiwan Island blocked the offshore westerly wind from a distance, causing the wind speed in the sea areas on both sides of Taiwan Island to decrease sharply. Affected by the northerly wind along the coast of Zhejiang province, the stations on the left side of the typhoon path began to show a surge of more than 50cm. 12 hours before Winnie’s landfall, as the typhoon center moved towards the land, the northerly wind along the coast of Zhejiang province gradually increased, and the storm surge at each station also continued to increase. The wind direction in the Taiwan Strait began to change, gradually turning from westerly to southwesterly, and after the typhoon passed through the north of Taiwan Island 6 hours before landfall, the wind direction in the area became completely southerly, and showed some degree of enhancement, until the typhoon landed on the northern coast of Zhejiang province.
Figure 9 shows the storm surge time series of the tide gauge stations with the maximum surge exceeding 50cm on the left side of the typhoon path 24 hours before and after the landfall of typhoon 9711 Winnie.
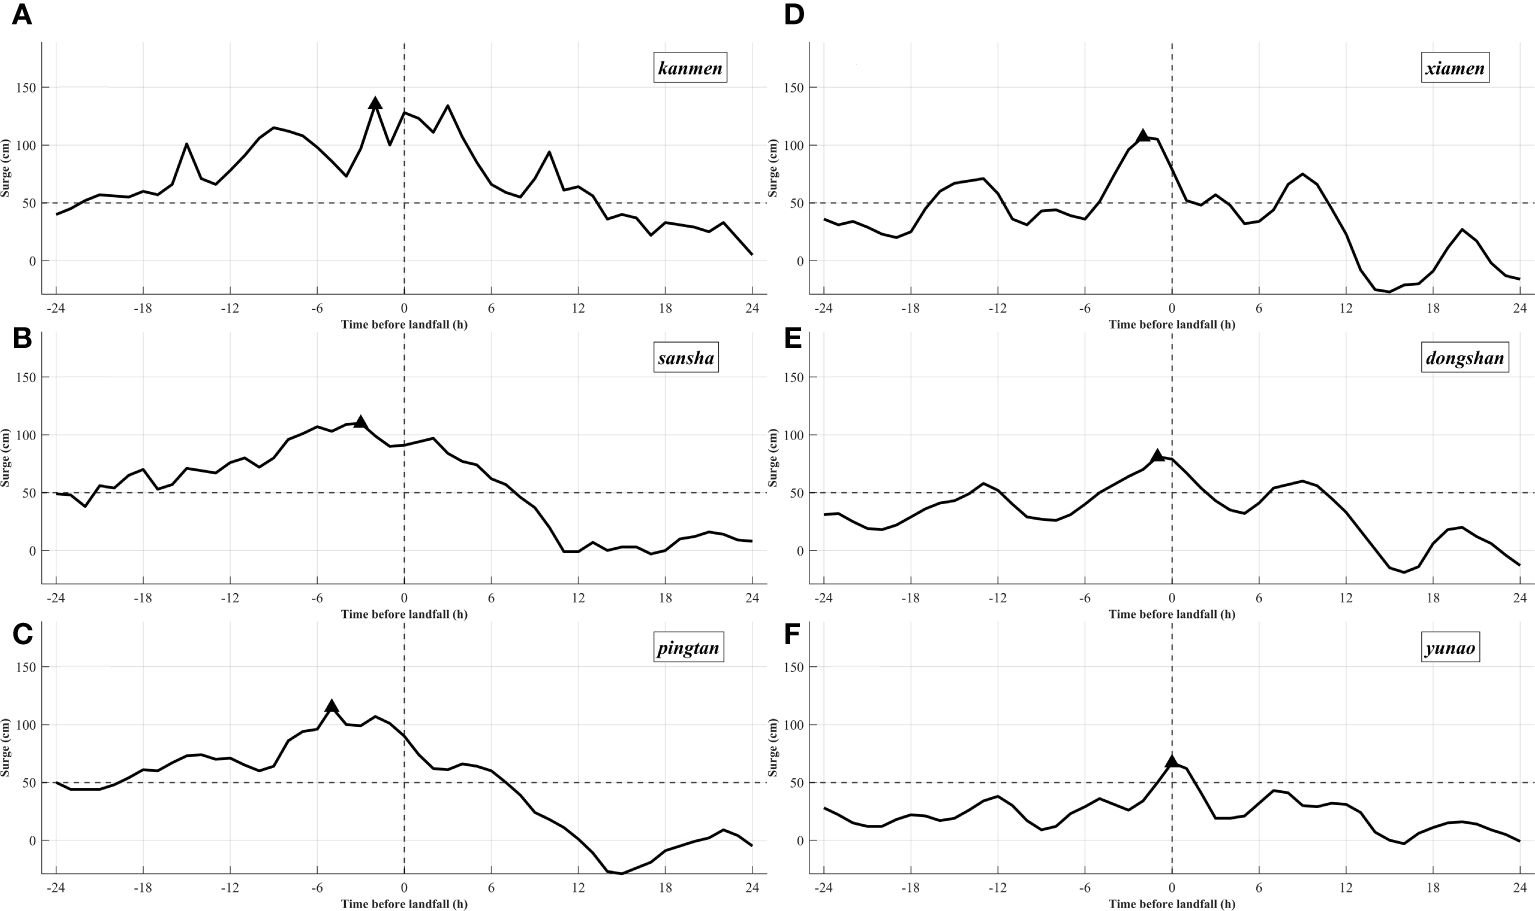
Figure 9 Storm surge time series of tide gauge stations(Kanmen (A), Sansha (B), Pingtan (C), Xiamen (D), Dongshan (E), and Yunao (F)) on the left side of the typhoon track that experienced storm surge exceeding 50 cm during Typhoon 9711 (Winnie). The dashed lines in the x axis and y axis indicate the 50cm surge level and the typhoon landfall time respectively.
From the storm surge time series, it can be seen that Kanmen and Sansha stations were relatively close to the typhoon landfall location, and both had maximum surges exceeding 100cm. The maximum surge on the left side of the typhoon path occurred at Kanmen station, reaching 139cm. Pingtan, Xiamen, Dongshan and Yunao stations were located in the Taiwan Strait, and were far away from the typhoon path, but still had surges exceeding 50cm. The overall surge curves were relatively smooth, and the maximum surge at each station occurred at different times, ranging from 6 hours before to the moment of the typhoon landfall, showing a clear time difference.
Discussion
This research examined the effects of landfalling typhoons on storm surges along China’s southeastern coast, revealing significant surges not only on the right but also on the left side of the typhoon tracks. Spatial analysis indicated that the frequency and peak values of storm surges were notably higher along central Fujian’s coast compared to northern Zhejiang and southern Guangdong. Further investigation into the origins of these left-side surges identified that they predominantly resulted from typhoons making landfall in the northern sector. Remarkably, stations on the Taiwan Strait’s western side, such as Pingtan, Chongwu, and Xiamen, recorded maximum surges on the left side that slightly exceeded those on the right. Xue et al. (2015) studied Typhoon Meranti’s wind field, which traversed Taiwan’s southern region before making landfall in Fujian. They discovered that as the typhoon neared Taiwan’s southern waters, the Central Mountain Range deflected the low-level airflow, transforming the southeast onshore winds into weaker southwest alongshore winds, potentially diminishing the storm surge response from southern tracks.
To ascertain the causes behind the left-side storm surges, a representative typhoon event known for frequent left-side surges in southeastern China was analyzed. The typhoon’s trajectory passed north of Taiwan Island before reaching the coasts of Zhejiang and Fujian provinces.
From the perspective of the arrival time of the maximum storm surge, during the landfall of the two typhoons, the stations in the Taiwan Strait had obvious lag in the arrival time of their maximum storm surge. Figure 7 shows that during Typhoon 9711 Winnie, Pingtan, Xiamen, Dongshan and Yunao stations reached the maximum storm surge 4 hours, 2 hours, 1 hour and at the time of typhoon landfall, respectively. The maximum storm surge of several stations showed a trend of decreasing from north to south in space.
When the typhoon moved in the deep sea area of the Pacific Ocean or the South China Sea, the low pressure of the typhoon and the convergence of the deep sea water caused the abnormal rise of the sea surface, forming a kind of solitary wave that propagated with the typhoon movement (Cai et al., 2012). When the typhoon was outside the Taiwan Strait, the northern part of the Taiwan Strait was mainly northeast wind or north wind, and the wind drove the sea water from the northern part of the strait into the strait. From the water level curve, it can be seen that due to the existence of the narrow channel topography of the Taiwan Strait, there was a significant north-to-south propagation of shelf waves driven by the alongshore wind from the north of the Taiwan Strait. Before the typhoon landfall at 18 hours, when the typhoon had not approached Taiwan Island, there was already a storm surge phenomenon caused by the shelf wave, which was consistent with the study of Slørdal et al. (1994). In the propagation process of the shelf wave, the storm surge water level decreased continuously from Pingtan station in the northern part of the Taiwan Strait to Yunao station. We used the propagation distance between Pingtan station and Yunao station to reach the maximum storm surge before the typhoon landfall and the propagation speed of the shelf wave to estimate the propagation speed of the shelf wave, and found that the propagation speed of the shelf wave was about 90 km/h (Wang et al., 2020). studied the storm surge and wave propagation caused by typical typhoon processes in this region, and found that this kind of shelf wave conformed to the characteristics of Kelvin wave.
We analyzed the similarities and differences between the ERA5 reanalysis wind field and the circular wind field model in the two typical typhoon storm surge processes, to explore the possible defects of the circular wind field model in the storm surge simulation of the left side of the typhoon track in the southeastern coastal region of China.
Under the influence of Typhoon 9711 Winnie, the ERA5 reanalysis wind field and the circular wind field model had some similarity in the wind field structure near the typhoon center, but there were larger differences on both sides of Taiwan Island far from the typhoon center. The circular wind field model did not consider the topographic effect of the Taiwan Mountain Range, so its circulation could cross the mountain range, resulting in west wind in the Taiwan Strait and the east of Taiwan Island. However, the ERA5 reanalysis wind field reflected the blocking effect of the Taiwan Island topography on the atmospheric circulation, which prevented the atmospheric circulation from crossing the Taiwan Mountain Range directly, but forced it to deflect, thus reducing the wind speed in the Taiwan Strait and forming a counter-clockwise wind around the island, enhancing the wind speed on the east side of Taiwan Island. In addition, the maximum wind speed of the ERA5 wind field along the typhoon track decayed more obviously than that of the circular wind field model, and the wind direction in the Taiwan Strait also changed from north wind to south wind as the typhoon center passed through the sea area north of Taiwan Island. Before the typhoon landfall at 6 hours, when the typhoon center moved to the west of Taiwan Island, the circular wind field model still showed offshore west wind on the west side of the Taiwan Strait, while the ERA5 reanalysis wind field showed that due to the blocking of the Taiwan Mountain Range, the offshore west wind could only deflect northward, becoming alongshore south wind with weaker wind speed.
Finally, we analyzed the long-term changes and trends of the typhoons and their storm surge in the southeastern coastal region of China during 1986-2016. The results showed that during this period, the frequency and intensity of the typhoons that caused significant storm surge in the left side of the region had a significant upward trend, which might be related to various factors. On the one hand, climate change increased the average intensity of the typhoons that landed on the mainland of China (Walsh et al., 2015; Feng et al., 2021a). According to statistics, in the past 37 years, the intensity of the typhoons affecting East Asia and Southeast Asia increased by 12-15% (Mei and Xie, 2016), which had an important impact on the magnitude of the storm surge. On the other hand, the average landing position of the typhoons in the western Pacific also shifted northward (Chen et al., 2022), which made more strong typhoons pass through the Taiwan Strait or the sea area north of Taiwan Island, and then land along the coast of northern Fujian province and Zhejiang province, making a significant contribution to the storm surge in the Taiwan Strait. Therefore, the storm surge disaster risk in these areas also increased.
Conclusion
This comprehensive investigation has illuminated the spatiotemporal patterns and causative factors of substantial storm surges on the left side of landfalling cyclones in China. Our analyses demonstrate that these surges are widespread and represent a considerable hazard to coastal regions and infrastructure. Utilizing tide gauge records spanning from 1986 to 2016, we have conducted an in-depth examination, revealing that left-side surges are typically on par with those on the right, thereby contesting established perceptions.
The prevalent circular wind field model, a staple in operational storm surge forecasting, exhibits notable deficiencies, especially in simulating left-side surges. The juxtaposition of this model with the ERA5 wind field underscores the imperative to integrate topographical influences and actual wind data to refine storm surge forecasts.
Observed long-term tendencies suggest an escalation in both the occurrence and severity of significant left-side storm surges, likely linked to climatic variations and a northward migration of typhoon landfalls. These findings highlight an escalating threat of storm surge calamities in the area, necessitating enhanced predictive models and strategies for disaster readiness.
In summation, our research enhances the comprehension of storm surge mechanisms on the left side of landfalling cyclones in mainland China. The results emphasize the profound impacts of these surges, which have traditionally been eclipsed by the focus on right-side surges in the Northern Hemisphere. This necessitates a fundamental shift in the operational forecasting of storm surges within China, advocating for the adoption of high-resolution reanalysis wind fields and the acknowledgment of topographical impacts.
Data availability statement
The original contributions presented in the study are included in the article/supplementary material. Further inquiries can be directed to the corresponding author.
Author contributions
WW: Investigation, Visualization, Writing – original draft, Writing – review & editing. XF: Methodology, Writing – review & editing. BY: Investigation, Supervision, Writing – review & editing. QL: Data curation, Validation, Writing – review & editing.
Funding
The author(s) declare financial support was received for the research, authorship, and/or publication of this article. This work was financially supported by the National Key Research and Development Program of China (Grant Nos. 2023YFC3008200), National Natural Science Foundation of China (Grant No. 42276028), Marine S&T Fund of Shandong Province for Pilot National Laboratory for Marine Science and Technology (Qingdao) (No. 2021QNLM040001-5).
Acknowledgments
This is a short text to acknowledge the contributions of specific colleagues, institutions, or agencies that aided the efforts of the authors.
Conflict of interest
The authors declare that the research was conducted in the absence of any commercial or financial relationships that could be construed as a potential conflict of interest.
The author(s) declared that they were an editorial board member of Frontiers, at the time of submission. This had no impact on the peer review process and the final decision.
Publisher’s note
All claims expressed in this article are solely those of the authors and do not necessarily represent those of their affiliated organizations, or those of the publisher, the editors and the reviewers. Any product that may be evaluated in this article, or claim that may be made by its manufacturer, is not guaranteed or endorsed by the publisher.
References
Bian G.-F., Nie G.-Z., Qiu X. (2021). How well is outer tropical cyclone size represented in the ERA5 reanalysis dataset? Atmospheric Res. 249, 105339. doi: 10.1016/j.atmosres.2020.105339
Cai S., Xie J., He J. (2012). An overview of internal solitary waves in the South China Sea. Surveys Geophysics 33, 927–943. doi: 10.1007/s10712-012-9176-0
Chen F., Li Z., Ding K., Sun Z., Zhou H. (2023). Assessment and integration of ERA5 reanalysis and fujita– takahashi models for storm surge prediction in the east China sea. Appl. Sci. 13, 10658. doi: 10.3390/app131910658
Chen T., Chen S., Zhou M., Tu C., Zhang A., Chen Y., et al. (2022). Northward shift in landfall locations of tropical cyclones over the Western North Pacific during the last four decades. Adv. Atmospheric Sci. 39, 304–319. doi: 10.1007/s00376-021-1077-z
China Marine Disaster Bulletin. (2010). Ministry of natural resources of the people’s Republic of China. Available at: https://www.mnr.gov.cn/sj/sjfw/hy/gbgg/zghyzhgb/.
China Marine Disaster Bulletin. (2013). Ministry of natural resources of the people’s Republic of China. Available at: https://www.mnr.gov.cn/sj/sjfw/hy/gbgg/zghyzhgb/.
China Marine Disaster Bulletin. (2022). Ministry of natural resources of the people’s Republic of China. Available at: https://www.mnr.gov.cn/sj/sjfw/hy/gbgg/zghyzhgb/.
Du M., Hou Y., Hu P., Wang K. (2020). Effects of typhoon paths on storm surge and coastal inundation in the Pearl River Estuary, China. Remote Sens. 12 (11), 1851. doi: 10.3390/rs12111851
Dullaart J. C. M., Muis S., Bloemendaal N., Aerts J. C. J. H. (2020). Advancing global storm surge modelling using the new ERA5 climate reanalysis. Climate Dynamics 54, 1007–1021. doi: 10.1007/s00382-019-05044-0
Feng X., Klingaman N. P., Hodges K. I. (2021a). Poleward migration of western North Pacific tropical cyclones related to changes in cyclone seasonality. Nat. Commun. 12, 6210. doi: 10.1038/s41467-021-26369-7
Feng X., Li M., Li Y., Yu F., Yang D., Gao G., et al. (2021b). Typhoon storm surge in the southeast Chinese mainland modulated by ENSO. Sci. Rep. 11, 10137. doi: 10.1038/s41598-021-89507-7
Feng X., Li M., Yin B., Yang D., Yang H. (2018). Study of storm surge trends in typhoon-prone coastal areas based on observations and surge-wave coupled simulations. Int. J. Appl. Earth Obs. Geoinf. 68, 272–278. doi: 10.1016/j.jag.2018.01.006
Feng X., Yin B., Yang D. (2012). Effect of hurricane paths on storm surge response at Tianjin, China. Estuarine Coast. Shelf Sci. 106, 58–68. doi: 10.1016/j.ecss.2012.04.032
Feng X., Yin B., Yang D. (2016). Development of an unstructured-grid wave-current coupled model and its application. Ocean Model. 104, 213–225. doi: 10.1016/j.ocemod.2016.06.007
Hersbach H., Bell B., Berrisford P., Biavati G., Horányi A., Muñoz Sabater J., et al. (2023). ERA5 hourly data on single levels from 1940 to present (Copernicus Climate Change Service (C3S) Climate Data Store (CDS)). European Centre for Medium-Range Weather Forecasts.
Hersbach H., Bell B., Berrisford P., Hirahara S., Horányi A., Muñoz-Sabater J., et al. (2020). The ERA5 global reanalysis. Q. J. R. Meteorol. Soc. 146, 1999–2049. doi: 10.1002/qj.3803
Houston S. H., Shaffer W. A., Powell M. D., Chen J. (1999). Comparisons of HRD and SLOSH surface wind fields in hurricanes: Implications for storm surge modeling. Weather Forecasting 14, 671–686. doi: 10.1175/1520-0434(1999)014<0671:COHASS>2.0.CO;2
Jelesnianski C. P. (1965). A numerical calculation of storm tides induced by a tropical storm impinging on a continental shelf. Monthly Weather Rev. 93, 343–358. doi: 10.1175/1520-0493(1993)093<0343:ANCOS>2.3.CO;2
Li A., Guan S., Mo D., Hou Y., Hong X., Liu Z. (2020). Modeling wave effects on storm surge from different typhoon intensities and sizes in the South China Sea. Estuarine Coast. Shelf Sci. 235, 106551. doi: 10.1016/j.ecss.2019.106551
Liu H., Dong L., Yan R., Zhang X., Guo C., Liang S., et al. (2021). Evaluation of near-surface wind speed climatology and long-term trend over China’s mainland region based on ERA5 reanalysis. Climatic Environ. Res. (in Chinese). 26, 299–311. doi: 10.3878/j.issn.1006-9585.2021.20101
Liu Q., Li M., Liang S., Liu S., Fu X. (2023). Research on and application of the operational storm surge ensemble forecast model in the Bay of Bengal. Appl. Ocean Res. 130, 103413. doi: 10.1016/j.apor.2022.103413
Lu X., Yu H., Ying M., Zhao B., Zhang S., Lin L., et al. (2021). Western North Pacific tropical cyclone database created by the China Meteorological Administration. Adv. Atmospheric Sci. 38, 690–699. doi: 10.1007/s00376-020-0211-7
Luettich R. A., Westerink J. J., Scheffner N. W. (1992). ADCIRC: an advanced three-dimensional circulation model for shelves, coasts, and estuaries. Report 1, Theory and methodology of ADCIRC-2DD1 and ADCIRC-3DL.
Mei W., Xie S.-P. (2016). Intensification of landfalling typhoons over the northwest Pacific since the late 1970s. Nat. Geosci. 9, 753–757. doi: 10.1038/ngeo2792
Slørdal L. H., Martinsen E. A., Blumberg A. F. (1994). Modeling the response of an idealized coastal ocean to a traveling storm and to flow over bottom topography. J. Phys. Oceanography 24, 1689–1705. doi: 10.1175/1520-0485(1994)024<1689:MTROAI>2.0.CO;2
Son J. H., Kim H., Heo K. Y., Kwon J. I., Jeong S. H., Choi J. Y., et al. (2022). Strategy for the prediction of typhoon wind and storm surge height using the parametric typhoon model: Case study for Hinnamnor in 2022. Atmosphere 14, 82. doi: 10.3390/atmos14010082
Tian Z., Zhang Y. (2021). Numerical estimation of the typhoon-induced wind and wave fields in Taiwan Strait. Ocean Eng. 239, 109803. doi: 10.1016/j.oceaneng.2021.109803
Walsh K. J. E., Camargo S. J., Vecchi G. A., Daloz A. S., Elsner J., Emanuel K., et al. (2015). Hurricanes and climate: the U.S. CLIVAR working group on hurricanes. Bull. Am. Meteorol. Soc. 96, 997–1017. doi: 10.1175/BAMS-D-13-00242.1
Wang K., Hou Y., Li S., Du M., Chen J., Lu J. (2020). A comparative study of storm surge and wave setup in the East China Sea between two severe weather events. Estuarine Coast. Shelf Sci. 235, 106583. doi: 10.1016/j.ecss.2020.106583
Wang S., Lin N., Gori A. (2022). Investigation of tropical cyclone wind models with application to storm tide simulations. J. Geophys. Res.: Atmospheres 127, e2021JD036359. doi: 10.1029/2021JD036359
Wang Y., Liu Y., Mao X., Chi Y., Jiang W. (2019). Long-term variation of storm surge-associated waves in the Bohai Sea. J. Oceanol. Limnol. 37, 1868–1878. doi: 10.1007/s00343-019-8257-z
Xue L., Li Y., Xu Y. L., Wang L. (2015). Effect of Taiwan topography on the rapid intensification of typhoon Meranti, (1010) passing by the Taiwan Strait. Chin. J. Atmos. Sci. (in Chinese). 39, 789–801. doi: 10.3878/j.issn.1006-9895.1409.14204
Zarzycki C. M., Ullrich P. A., Reed K. A. (2021). Metrics for evaluating tropical cyclones in climate data. J. Appl. Meteorol. Climatol. 60, 643–660. doi: 10.1175/JAMC-D-20-0149.1
Zhang K., Chan K. T. F. (2023). An ERA5 global climatology of tropical cyclone size asymmetry. Int. J. Climatol. 43, 950–963. doi: 10.1002/joc.7846
Keywords: ADCIRC, circular wind field, ERA5 reanalysis, Taiwan Strait, left-side storm surge
Citation: Wan W, Feng X, Yin B and Liu Q (2024) Explanations for the positive storm surges on the left side of landfall typhoons in China. Front. Mar. Sci. 11:1401110. doi: 10.3389/fmars.2024.1401110
Received: 14 March 2024; Accepted: 17 May 2024;
Published: 04 June 2024.
Edited by:
Donald B. Olson, University of Miami, United StatesCopyright © 2024 Wan, Feng, Yin and Liu. This is an open-access article distributed under the terms of the Creative Commons Attribution License (CC BY). The use, distribution or reproduction in other forums is permitted, provided the original author(s) and the copyright owner(s) are credited and that the original publication in this journal is cited, in accordance with accepted academic practice. No use, distribution or reproduction is permitted which does not comply with these terms.
*Correspondence: Xingru Feng, fengxingru07@qdio.ac.cn