Study on the fountain effect of the bubble plume formed by submarine gas pipeline leakage
 Hao Wang1 Yunxin Jia1 Xiaolei Liu1
  Jiahao Liu1
  Kan Wang1* Jinnan Jiang1 Hang Xu1 Jiamin Tang1 Chen Sun2
- 1College of Ocean Science and Engineering, Shanghai Maritime University, Shanghai, China
- 2Carbon Neutrality Research Center, State Power Investment Corporation Research Institute, Beijing, China
The leakage from submarine gas pipelines presents a significant threat to marine ecological environments. Bubble plumes can be formed when gas escapes, which can give rise to the distinctive fountain phenomenon by interacting with the water surface. It is imperative to understand the factors that influence the physical dimensions and temporal characteristics of the resulting fountain to elucidate the formation mechanism of this phenomenon. Gas leakage experiments under various conditions are conducted to investigate the dynamic characteristics of the fountain in the study. The findings reveal the following: The initial kinetic energy of the escaping gas varies significantly under different leakage scenarios, resulting in the positive correlation between the maximum fountain height and width, as well as the leakage pressure and diameter of the leakage hole. Then, the analysis of dimensional indicates that the dynamic equilibrium of the bubbles is intricately tied to both the Froude number (Fr) and Reynolds number (Re). Notably, the effect of leakage pressure on Fr and Re follows similar patterns. However, the trends of Fr and Re values across varying leak hole diameters are opposite. At last, the frequency analysis of the time series data related to the fountain height demonstrates that higher leakage pressure and larger leak hole diameters result in an increase in both the main frequency and bandwidth. The research results offer valuable insights for evaluating the impact of gas leakage intensity on the marine environment by analyzing the size parameters of fountain.
1 Introduction
Currently, the soaring demand for fossil fuels driven by societal progress has exacerbated environmental pollution (Khan et al., 2022). Consequently, there has been a growing emphasis on the development of clean energy sources (Wang et al., 2024a). Major energy consumers, including China, have undertaken efforts to phase out polluting fossil fuels like coal by increasing the proportion of cleaner fossil energy alternatives, particularly natural gas, in their energy mixes (Rui et al., 2017 and Wang et al., 2024b). There exist vast amounts of marine resources along the coast of China (Liu and Soares, 2022 and Liu et al., 2023;), especially with a vast amount of conventional or unconventional resources such as deep-sea natural gas or combustible ice hidden under the seabed. Subsea gas pipelines play a pivotal role in the exploitation of offshore oil and gas resources. However, pipeline leaks, perforations, and ruptures, which can lead to natural gas leakage, are potential risks influenced by several factors, including human intervention, corrosion, environmental stressors, and engineering quality (Najjar, 2013) (Figure 1).

Figure 1 Leakage factors of submarine gas pipeline.
Natural gas leakage into the ocean and atmosphere causes substantial environmental harm (Jia et al., 2022). Such leaks not only have the potential to trigger jet fires and vapor cloud explosions but also can result in asphyxiation and possible mass fatalities among marine fauna and avian species. Raw natural gas comprises constituents including hydrogen sulfide and light hydrocarbons, the release of which can severely contaminate marine waters. The pollution not only imperils marine organisms but also poses an indirect hazard to humans due to the accumulation of toxins within the food chain (Reddy et al., 2011).
The gas leakage from the undersea gas pipeline can form bubbles plume that create the fountain effect on the water surface (Sausa et al., 2023; Wise and Hunt, 2023). The physical characteristics of the fountain are related to the release and diffusion of the bubble plume in the water (Cardoso and Cartwright, 2024). To analyze the physical characteristics of the fountain formed by the bubble plume on the water surface, the researchers mainly use integral model and computational fluid dynamics (Johansen, 2000; Benham, 2023; Garvey and Fowler, 2024). The integral model describes the radial velocity distribution of the plume in accordance with the Gaussian distribution, indicating that the fountain shape is inverted conical (Nazir et al., 2008 and Afenyo et al., 2017). Then, a series of models are derived to describe the characteristics of the fountain. Johansen (2003) suggested that the gas might be dissolved in seawater after combining with seawater, and then affect the development of physical size of the fountain. Zheng et al. (2003) proposed a model to simulate deep-water oil and gas accidental leakage, which analyzed the effect of the non-ideal behavior of bubble plumes on the size of the fountain. Yapa et al. (2012) analyzed the effect of unsteady three-dimensional changes of water flow and density stratification on the flow of bubbles in water, and found that environmental conditions, gas type, and medium mixing ratio could significantly affect the fountain phenomenon. The integral model can predict the physical parameters of springing under certain specific conditions. However, the semi-empirical formulas based on integral models can only predict the average geometric characteristics of the stable state fountain, neglecting the transient characteristics of the bubble plume influence on the fountain phenomenon (Wu et al., 2017).
The CFD method uses the volume fraction method to simulate the interaction process between bubbles and water in the Euler reference frame to further study the change of fountain on the water surface (Zhang et al., 2024). Zhu et al. (2014) used FLUENT software to simulate the effects of the density of the leakage medium, leakage rate, leakage quantity and water flow velocity on the fountain. Li et al. (2017) used computational fluid dynamics to simulate the whole process of gas release from the sea floor to the sea surface diffusion, which was used to analyzed the change law of the size characteristics of the fountain. Cloete et al. (2009) simulated the behavior of gas plume caused by natural gas pipeline rupture based on the coupled volume of fluid (VOF) and discrete phase model (DPM), showing the morphology of fountain under different conditions. Olsen and Skjetne (2016a) proposed an Euler-Lagrange model, whose parameters included buoyancy, turbulence, gas expansion and solubility. It was found that the influence of gas solubility on the height and width of the fountain was very significant. Li and Wang (2023) found that ocean currents and waves affected the formation process of fountain by changing the diffusion law of bubbles in water. The effects of flow velocity and porosity on the size of spring were studied based on the Euler-Euler model. Adegboye et al. (2021) proposed a new CFD method to simulate the interaction between bubbles and water based on the flow mechanism of gas-liquid two-phase flow caused by the leakage of natural pipeline under the sea, which was used to analysis the change law of fountain. Premathilake et al. (2016) simulated the effects of water depth, gas leakage rate and initial bubble distribution on the width and height of fountain. CFD numerical simulations offer a distinct advantage in predicting fountain patterns. However, its shortcomings are also quite apparent. On one hand, the precise calculation results often demand substantial computing resources, which make it difficult to achieve; on the other hand, the use of incorrect solvers can lead to inaccurate predictions, affecting the assessment of gas leak intensity. It is highly necessary to study the formation of bubble plume fountains based on experimental methods, which can be used to validate other approaches. Additionally, the existing research has shown that the interaction process between leaking gas and water is dynamic and complex. Bubble coalescence and fragmentation occur simultaneously, resulting in the formation of distinct pulsating bubble plumes. The results in the pronounced pulsation phenomenon within the fountain, potentially compromising the stability of the entire pipeline. The instability characteristics can be observed in the temporal variation of the height and width of fountain. Presently, there is a notable lack of research examining the pulsation characteristics of the fountain.
The force state of the bubble during the ascending process of bubble plume after gas leakage occurs is analyzed in the study. The movement mechanism of the bubble is delved leveraging the preceding analysis. Subsequently, the gas leakage experiment is conducted using the custom-built experimental platform. The experiment varies leakage pressures and leak hole diameters to provide the comprehensive understanding. The impact of Fr number and Re number on the height and diameter of the fountain is thoroughly researched. Lastly, the frequency spectrum of the fountain height is investigated by considering the pulsation characteristics of the bubble plume. The insights gained from the research can be instrumental in predicting the severity of gas leakage and assessing the potential impact on marine life and the environment.
2 Bubble movement mechanism analysis
The investigation of the fountain characteristics necessitates the thorough analysis of the movement and forces acting on the bubble plume within water. The escaping gas jets into the water and rapidly expands in the upper space due to the high pressure within the pipeline during the leakage events. The bubble plume field can be systematically categorized into three distinct regions (Figure 2A): (1) Jet flow region; (2) Plume development area; (3) Surface flow area (Olsen et al., 2017). The initial kinetic energy of the leaking gas dominates the movement of bubble in the jet flow region. The surrounding water is entrained into the bubble plume in the plume development zone, which leads to the gradual increase in the radius of the bubble plume. As the initial kinetic energy of the leak is dissipated through entrainment, buoyancy becomes the primary force driving the gas towards the water surface. Concurrently, the bubble plume obtains radial velocity due to the retardation and shearing effects of the overlying water, resulting in the outward diffusion of air mass and the formation of the wider plume. It will expand further as the plume height increases (Li, 2019). The interaction between gas and water surface will be occur when the gas reaches the water surface, creating the fountain effect that further enlarges the bubble plume (Li et al., 2019). The interaction action also triggers radial flow in the near-surface seawater, forming the surface flow area. The bubble volume gradually increases due to decreasing ambient pressure during the rise process of the bubble (Yapa et al., 2010).
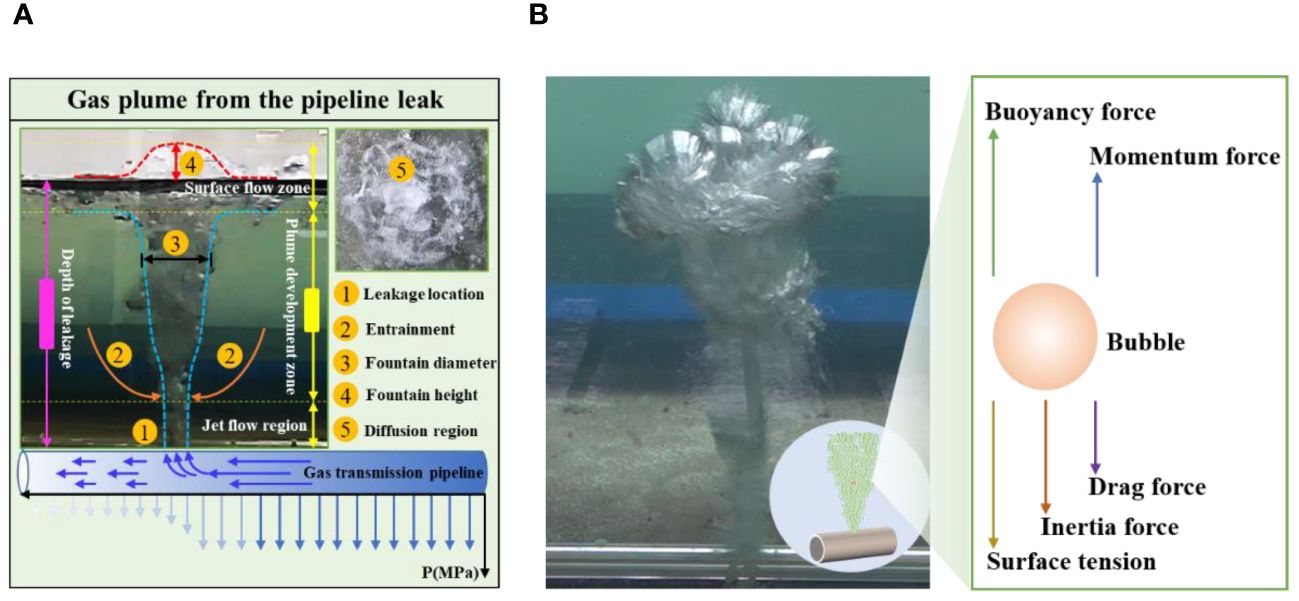
Figure 2 (A) Morphological characteristics of bubble plume in the water; (B) Force analysis of bubble.
The bubble is in the state of equilibrium during its formation. The forces include: buoyancy force Fb, gas momentum force Fm, surface tension Fσ, drag force Fd and inertial force Fi (Socolofsky et al., 2008) (Figure 2B). The direction of buoyancy is always vertical upward. The effective buoyancy Fb acting on the bubble is expressed as the following Equation 1:
where, ρg is the gas phase density, kg/m3; ρl is the liquid phase density, kg/m3; db is the bubble diameter, m. The gas will jet into the water at a certain speed and generate an inertial driving effect on the formed bubbles due to the leakage pressure difference inside and outside the leak hole. The expression of Fm is expressed as the following Equation 2 (Wang, 2020):
where, dk is leakage hole diameter, m; qv is gas leakage quantity, m3/s; When the bubble moves in the water, the bubble will also be subjected to pressure differential resistance due to the non-uniform surface pressure of the bubble. The expression is as the following Equation 3:
where, ud is bubble rising velocity, m/s; CD is the motion resistance coefficient of the bubble, being related to the Reynolds number Re. The surface of the bubble is subjected to the tension by the attraction of the internal molecules. The expression is as the following Equation 4:
where, σ is the interfacial tension coefficient, N/m; The gas is shot into the water by the leakage port of the pipeline, it will produce inertial force on the gas itself due to its own inertia. The specific expression is as the following Equation 5:
where, Vd is the volume, m3; α is the virtual mass force coefficient. The bubbles reach equilibrium under these forces is expressed as the following Equation 6:
Equation 6 is the dynamic balance equation in the bubble rising process, which is mainly related to the leakage volume and the diameter of the leakage hole. The relationship between leakage volume and leakage pressure is expressed as the following Equation 7:
where, cg is orifice flow coefficient; k is isentropic index of the leaking gas; M is molar mass of the gas, g/mol; R is constant number of gas, J/(kmol·K); T is temperature at the leak point, K. It can be known that the force state of bubbles is mainly related to the diameter of the leak hole and the leak pressure according to formulas (6) and (7). The force state of the bubbles determines the movement form of the bubble plume when gas escapes at high velocity through the orifice during the leakage event. The interactions between gas and water will be enhanced as the leakage pressure and the diameter of leakage hole increase, which can affect the expansion and entrainment of the bubbles. The residual momentum of the bubble plume changes significantly when gas reaches the water surface, leading to changes in the morphological characteristics of the fountain. Therefore, it is very necessary to conduct gas leakage experiments under different leak pressures and leakage hole diameters to study the fountain characteristics of the bubble plume.
3 Experimental equipment and methods
The experiment is conducted to study gas leakage in the controlled environment consisting of a water tank with dimensions of 50m in length and 1m in width, filled with water to the depth of 0.5m. The tank walls are constructed from tempered glass for ease of visual recording. A 1m long, 0.05m diameter stainless steel pipe, drilled with simulated gas leakage holes of varying diameters (5mm, 6mm, 7mm, 8mm, 9mm, and 10mm), which can be as the gas delivery system. The high-pressure gas, sourced from an air compressor capable of generating pressures between 0-800kPa, is utilized for the leakage experiment. Specific pressure settings of 100kPa, 200kPa, and 300kPa are selected for the study. A pressure-reducing valve is incorporated to ensure precise control over the gas leakage pressure. The setup allows for the simulation of diverse underwater gas leakage scenarios by varying both the leakage pressure and the size of the leakage holes. The entire experimental process is documented using two high-speed cameras. One camera, positioned alongside the tank, is used to capture the evolving morphologies of the gas jets. The other camera, mounted on the crossbar at the tank’s top, is used to assess the impact of the fountain on the water surface. To guarantee detailed recordings of the formation, development, and diffusion of the gas jets, the cameras are set to capture images at the rate of 200 frames per second. The experimental configuration is illustrated in Figure 3. The captured images are analyzed using ImageJ after the completion of the tests. The analysis enables the determination of the fountain height and width at each timestamp associated with every frame. Subsequently, the average height and width of the fountain under each set of experimental conditions are computed by averaging the collected data.
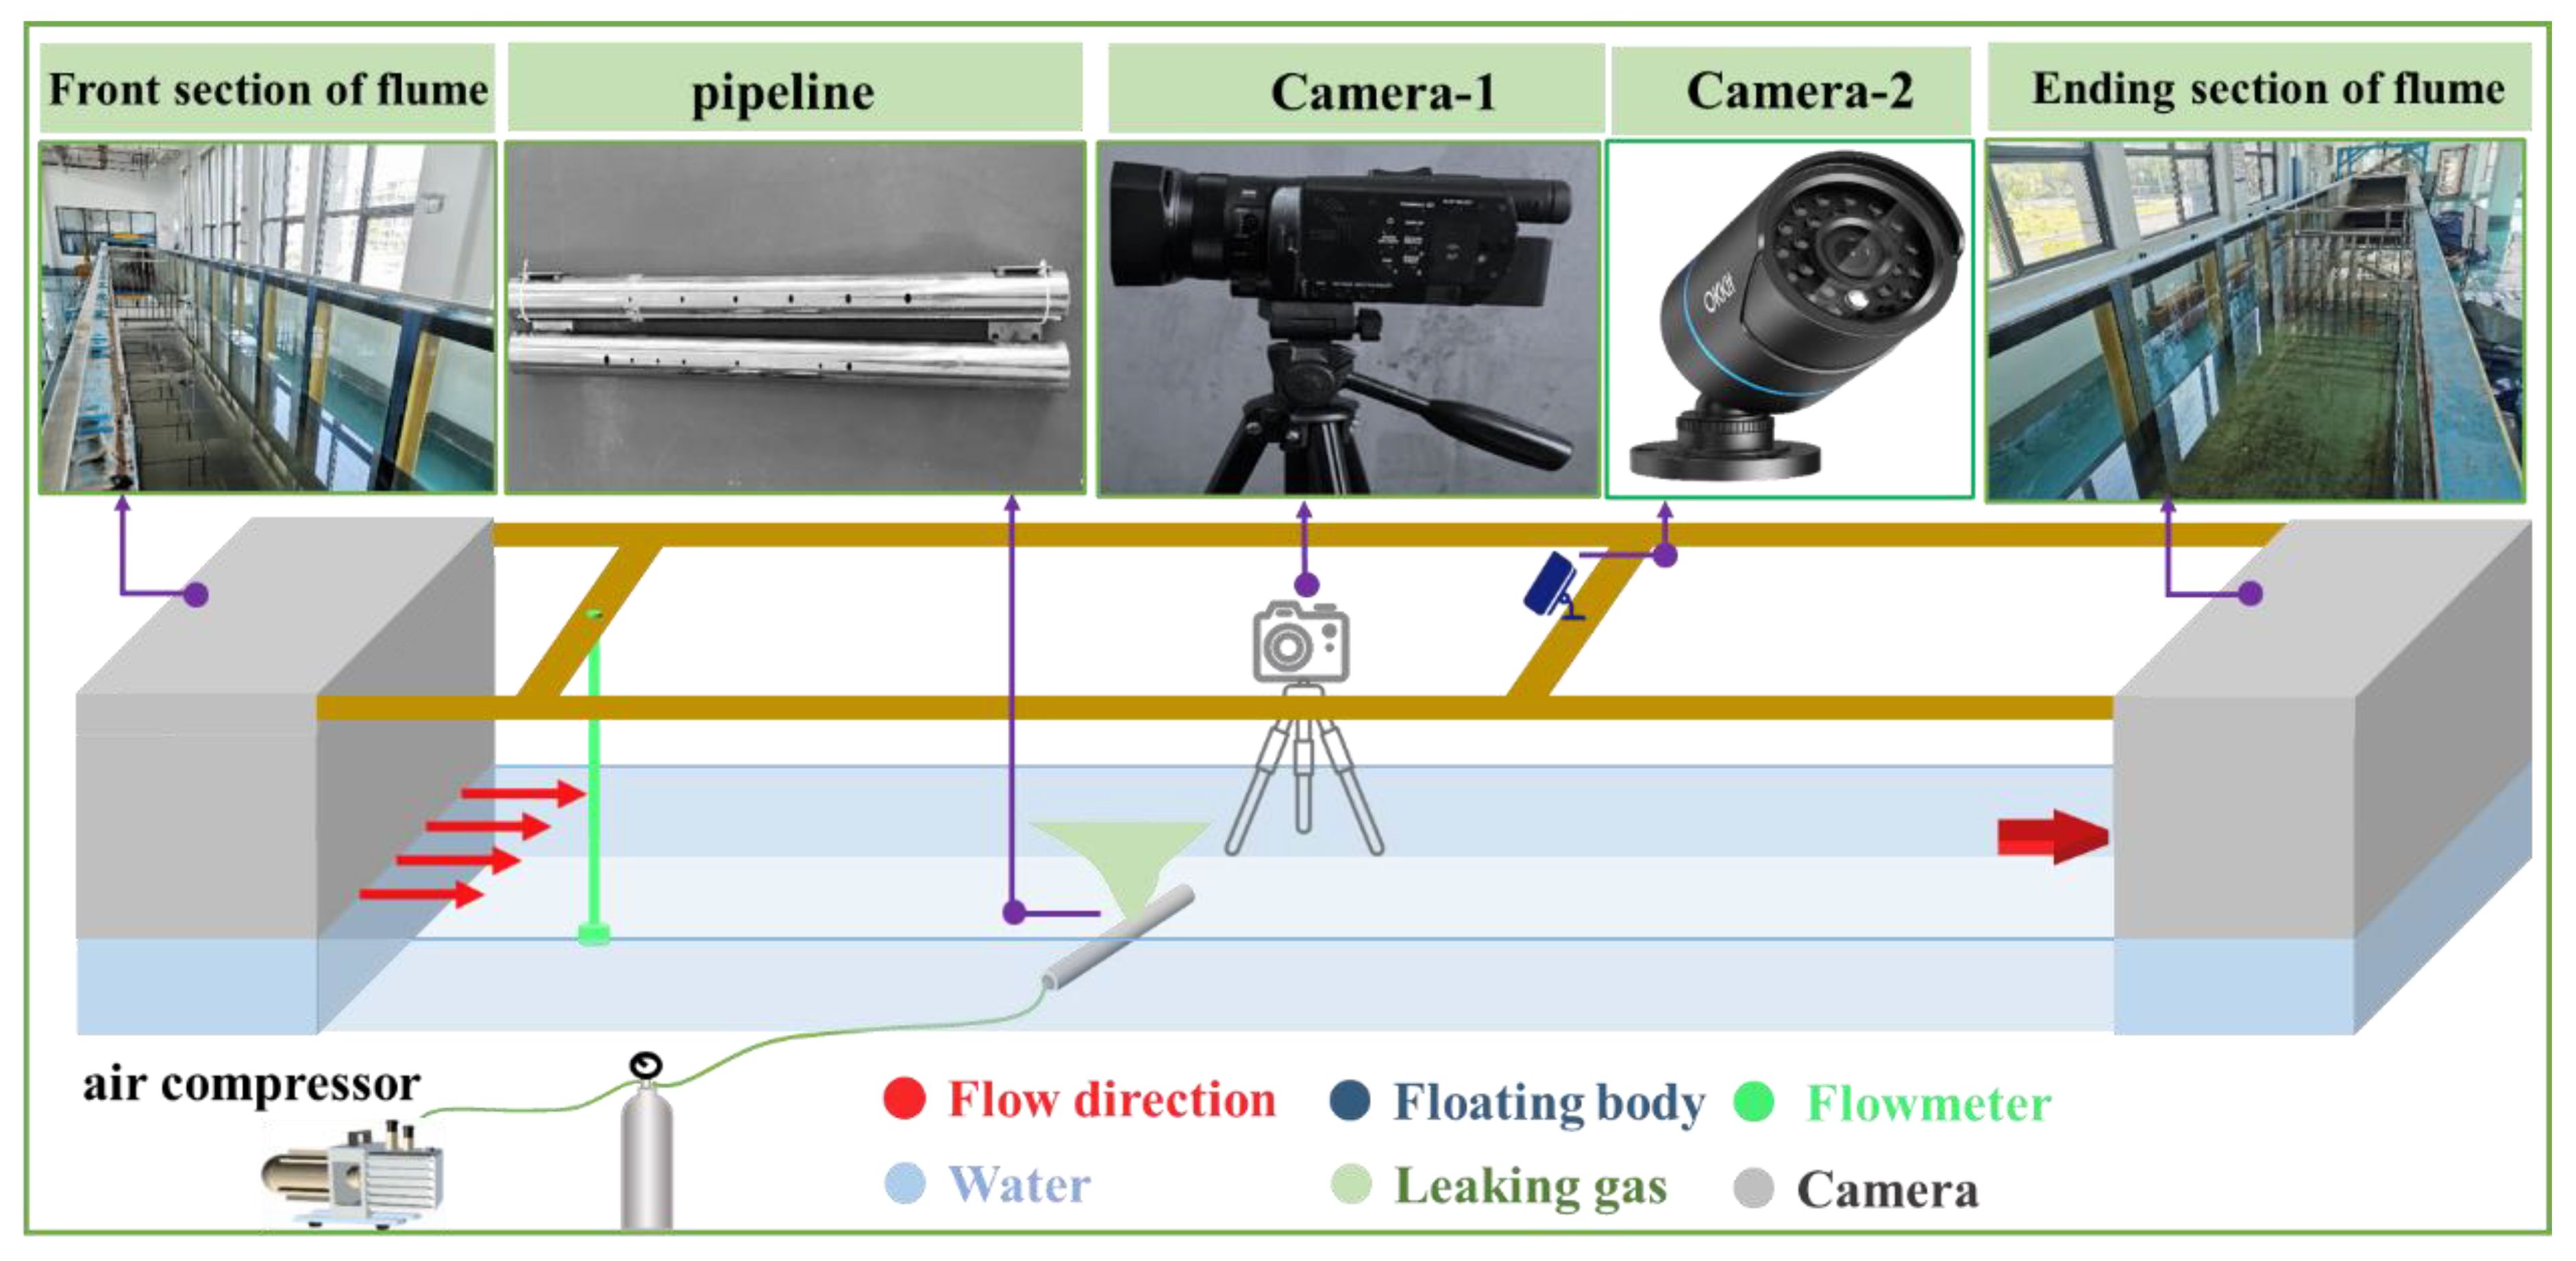
Figure 3 Schematic diagram of experimental equipment.
4 Analysis of experimental results
4.1 Maximum fountain height analysis
The bubble plume can carry a quantity of water out to form fountain when it reaches to the water surface. The peak height of the fountain, defined as the vertical displacement from the water surface to the apex of fountain when the leakage plume breaches the surface, which is a pivotal parameter in characterizing the shape of plume (Li et al., 2018). Moreover, it indicates the excess dynamic pressure conveyed by the plume mixture, which can be used to reflect the impact of plume on floating structures. As Figure 4 illustrates, the fountain height varies considerably under different pressure conditions. The height of fountain increases linearly as the diameter of the leakage hole increases with the constant leakage pressure. Conversely, the fountain height rises as the leakage pressure rises with the fixed diameter of the leakage hole. The data results reveal that an increase in pressure amplifies the growth trend of the fountain height. Notably, the influence of pressure on the fountain height is particularly significant when the diameter of the leak hole is large. For instance, the height of the fountain associated with the maximum leakage hole diameter increases by 266% compared to that of the minimum leak hole at the pressure of 100 kPa. Similarly, the corresponding increase is 386% at 300 kPa. Furthermore, the fountain height increases by 33.3% and 68.7% under the three tested pressure conditions, respectively when the diameter of the leakage hole is fixed at 10 mm. This is attributed to the fact that an increase in leakage pressure leads to an enhancement in both leakage velocity and volume, resulting in the higher initial kinetic energy of the leaking gas. The interaction between the bubble and the surrounding water becomes increasingly intense as the bubble ascends through the water, leading to the greater degree of entrainment. Although the bubble encounters more resistance and consumes more energy, it is worth noting that the residual energy remains significant when it reaches the water surface. The residual energy enables the bubbles to carry a larger volume of water to the surface, resulting in the higher flux. Gas continues to carry water upward until it reaches the highest point, and then backflow. The combined influence of both the leakage pressure and the diameter of the leakage hole on the fountain phenomenon is profound. Specifically, it significantly enhances the height of the fountain when both these factors are at high values. Therefore, it can be deduced that the magnitude of change in the fountain size during the leakage of large holes will be substantial.
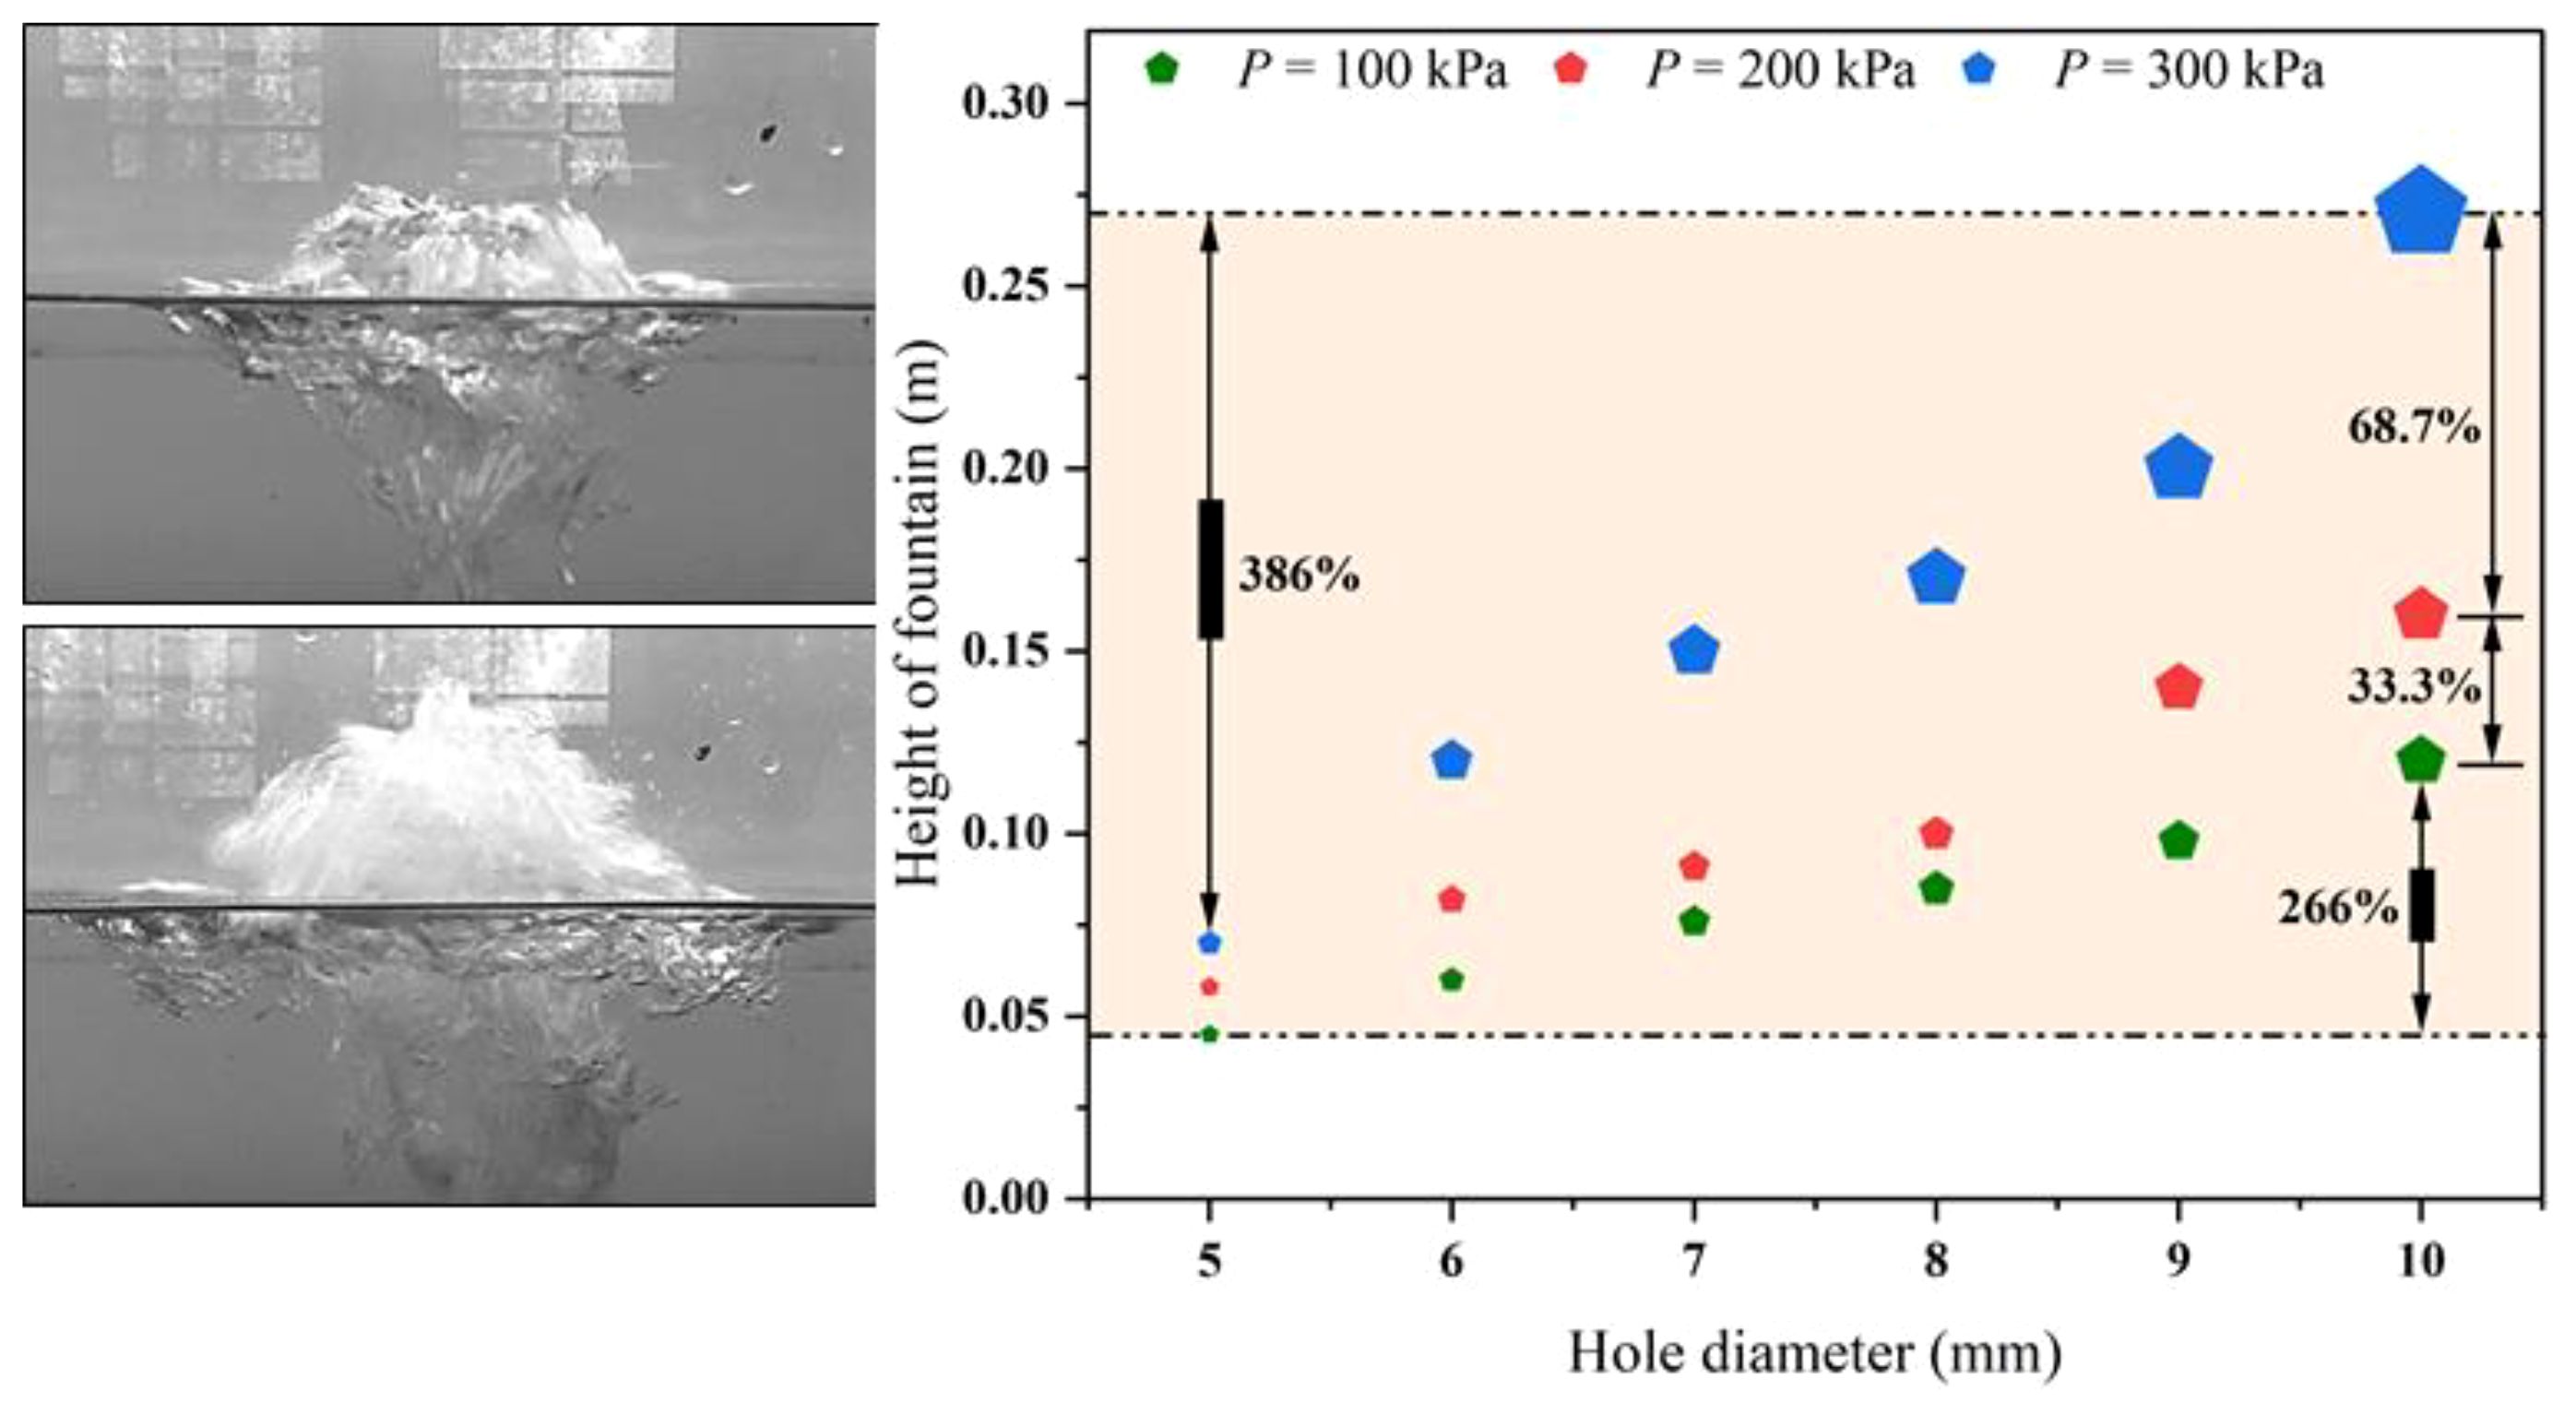
Figure 4 Comparison of the fountain height under different conditions.
4.2 Maximum fountain width analysis
High-pressure gas enters the seawater with significant initial kinetic energy after the submarine natural gas pipeline leakage occurs. The fountain effect can be generated when gas interacts with the surrounding seawater, which can impact floating structures proximate to the water surface (Liu et al., 2020). The diffused gas masses significantly reduce the density of the seawater in the interaction zone, decreasing the buoyancy provided to floating objects (Cao, 2020). Consequently, it is imperative to investigate the maximum plume width attained when the gas plume reaches the water surface to effectively comprehend the diffusion behavior of the leaking gas near the surface. The findings reveal that the maximum fountain width exhibits notable differences corresponding to various leakage parameters. As depicted in Figure 5, the influence of leakage gas pressure and leakage hole diameter on the maximum fountain width mirrors their impact on the fountain’s height. The maximum plume width increases proportionally with the enlargement of both the leakage aperture and pressure. For instance, the fountain height corresponding to the largest leakage hole rises by 262% compared to that of the smallest when the pressure is maintained at 100 kPa. Similarly, the increase is even more pronounced at 300 kPa, reaching 314%. Furthermore, the corresponding fountain height increases by 36.3% and 46.7% respectively under three distinct pressure conditions when the diameter of the leakage hole is 10mm. The higher the pressure, the greater the influence on the maximum fountain width, particularly when the leakage hole diameter is enlarged. It is attributable to the fact that both an increase in leakage pressure and hole diameter result in the higher number and energy of bubbles within the water. The inertial force, surface tension, and resistance in the vertical direction undergo an increase during the high-speed upward motion of the bubble, which can enhance the degree of deformation within the bubble. The augmented deformation fosters improve the interaction between bubbles and promotes the entrainment of water. The transverse diffusion range of the bubble and the turbulent disturbance to the water attain their peak values when the bubble plume approaches the free liquid surface, ultimately leading to an augmentation in the maximum diameter of the fountain.
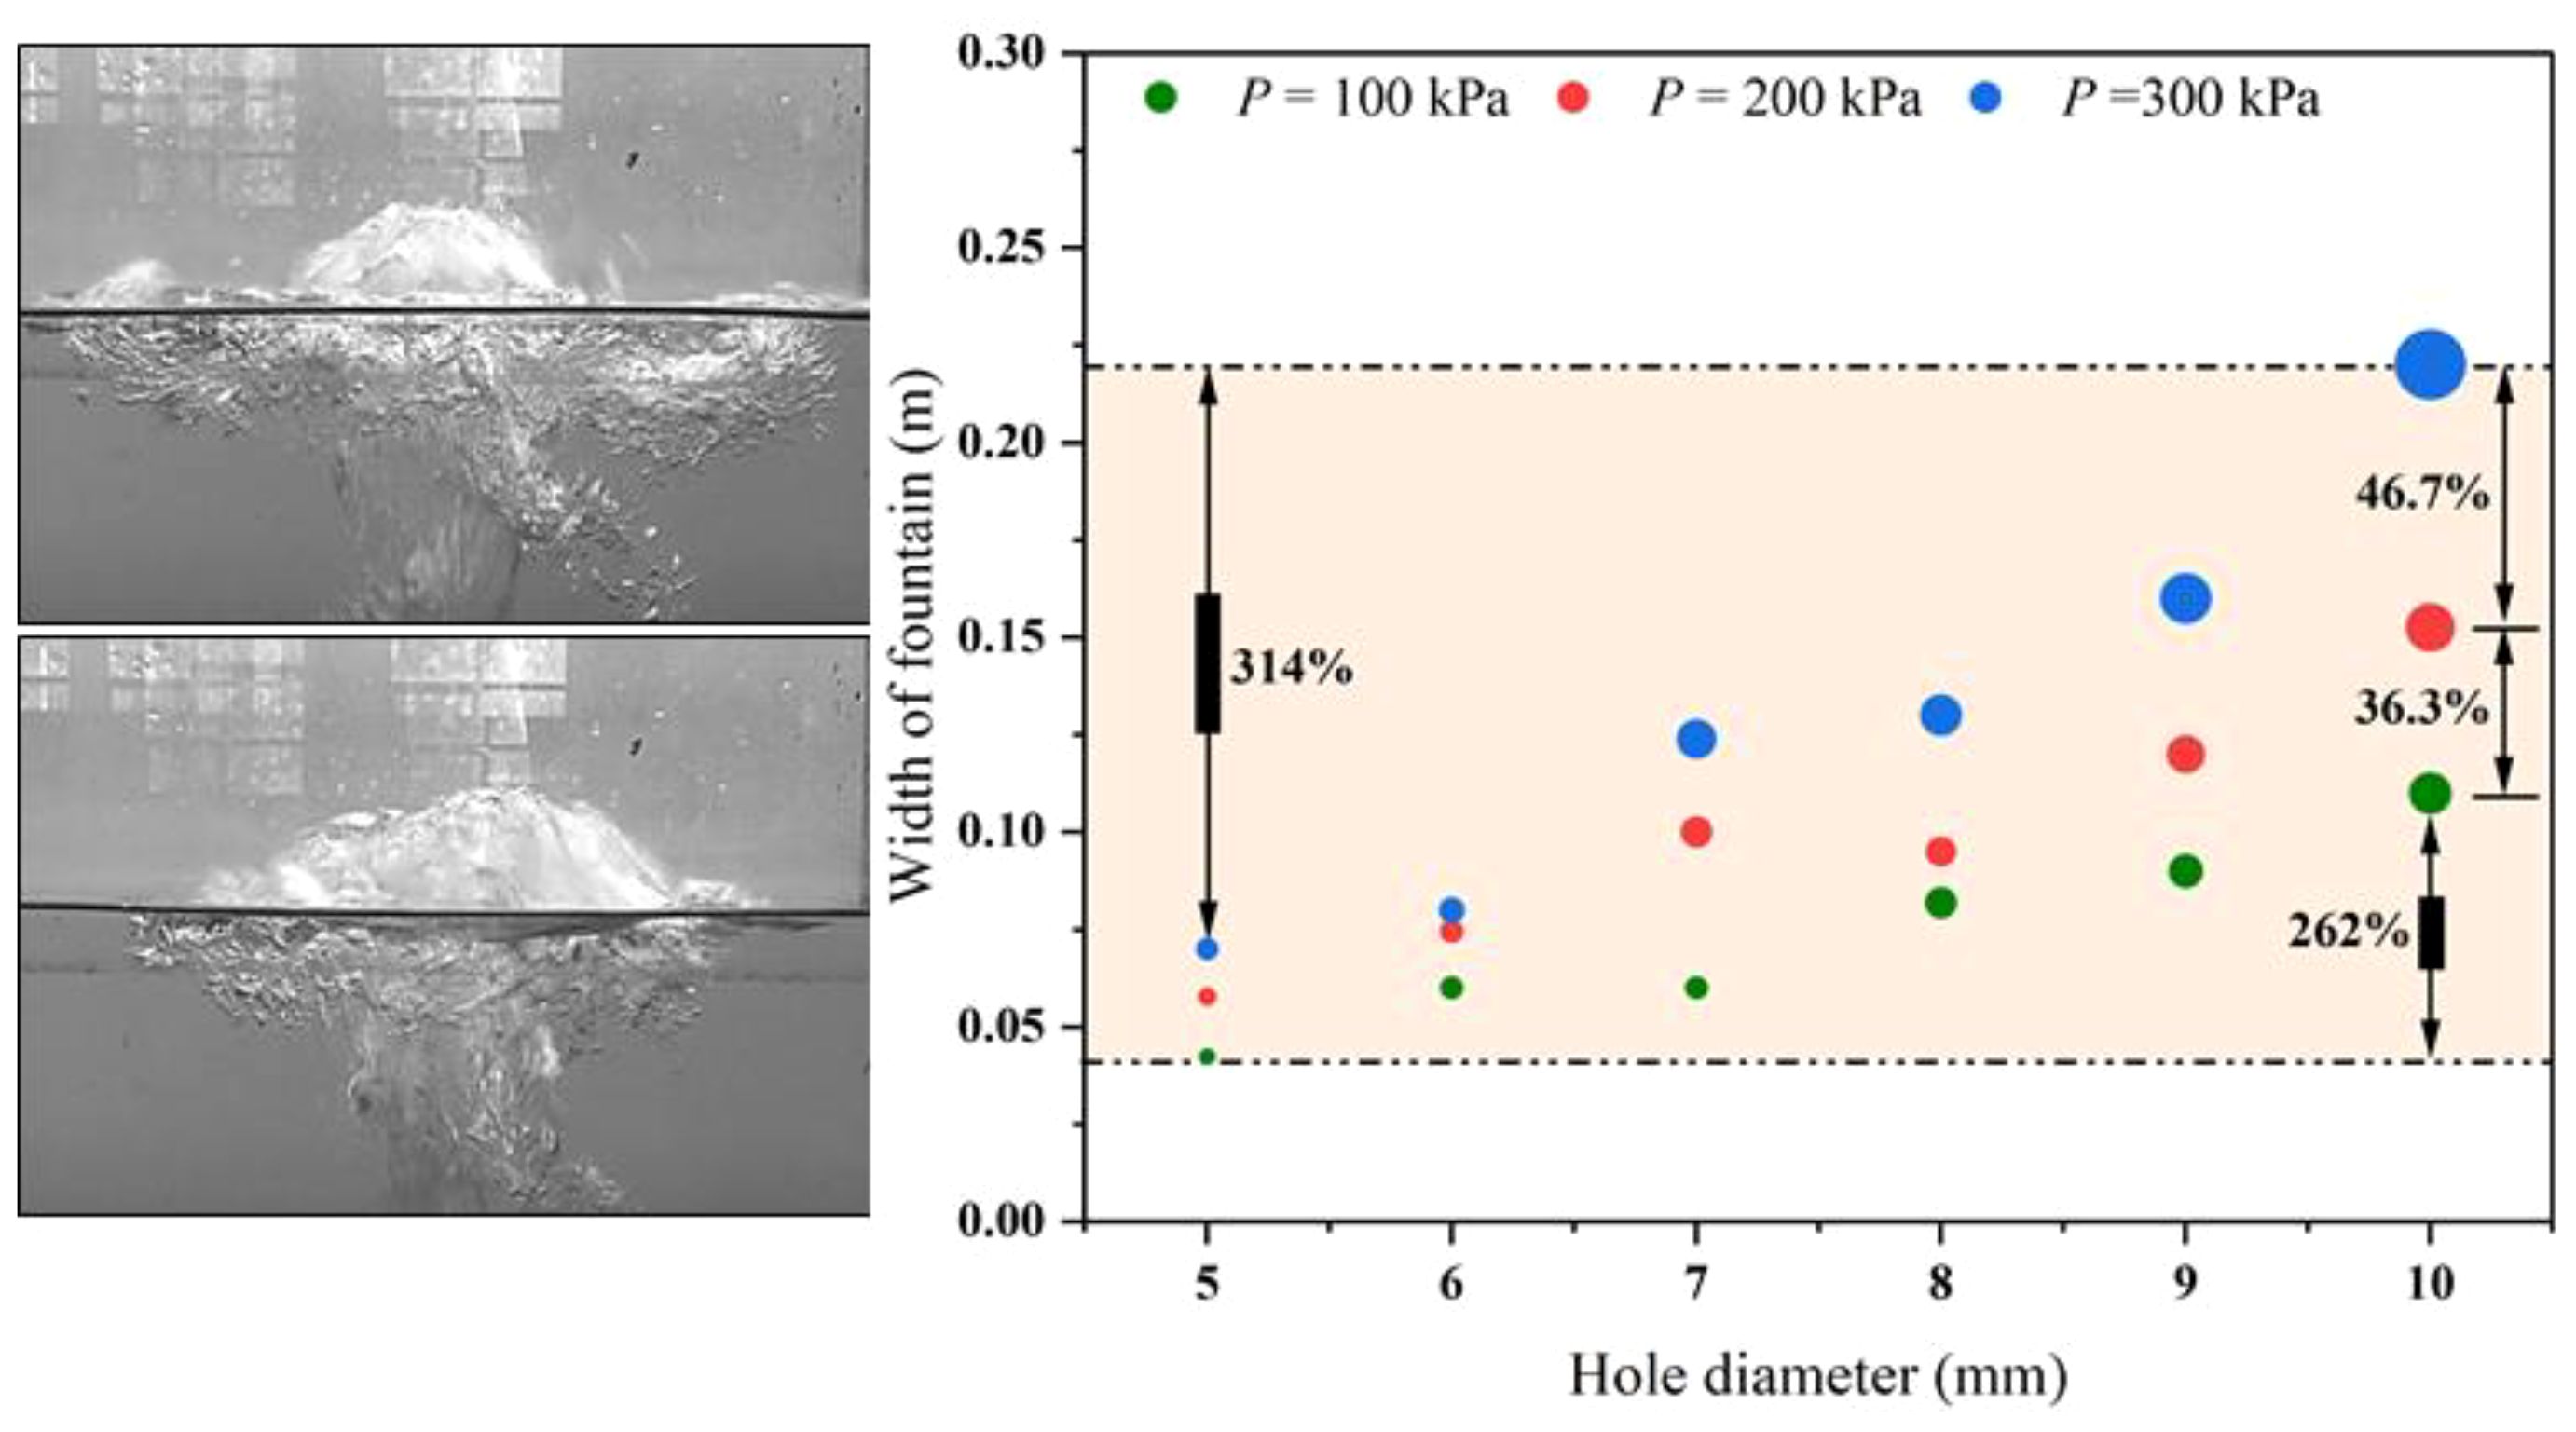
Figure 5 Comparison of the fountain width under different conditions.
4.3 Effect of flow parameters on fountain size
Dimensional analysis can be used to study the comprehensive influence of various physical quantities on the bubble plume. The force characteristics of the bubble plume during the process of rising are related to gas velocity v, leakage pressure P, dynamic viscosity μ, leakage hole diameter d, water density ρl and gravity acceleration g. Dimensional analysis method is used to analyze the force, as the following Equation 8:
The six variables in the above Equation 8 have only three fundamental dimensions. So, three independent dimensionless dimensions can be obtained. Gas velocity v, water density ρl and leakage hole diameter d can be selected as basic dimensions. Three π terms are obtained by dimensional analysis with the π theorem, as shown in Equation 9:
Equation 9 shows that the force of the bubble plume during the rising in the water is related to Froude number Fr and Reynolds number Re (Burridge et al., 2015).
To further investigate the relationship between the Froude number (Fr) and the morphological evolution of the bubble plume, the Froude numbers corresponding to different leakage parameters are compared (Table 1). As illustrated in Figure 6, the height of the fountain decreases with an increase in the Fr value when the leakage pressure remains constant, exhibiting an approximately hyperbolic variation rule. An increase in leakage pressure enables more gas to enter the water body with higher initial kinetic energy, resulting in an increase in both the fountain height and the corresponding Fr value. Keeping the leakage hole diameter constant, the Fr value escalates with the rising fountain height. It is noteworthy that the growth rate of the Fr value is notably higher for small leakage holes compared to larger ones as the leakage pressure increases. The bubble plume in the water can be attributed to either low leakage pressure and small leakage holes or high leakage pressure and large leak holes when the Fr value is equivalent. The Fr value can be calculated by monitoring the height of the fountain, which is convenient to determine the dynamic characteristics of the bubble plume when dealing with gas leakage events.
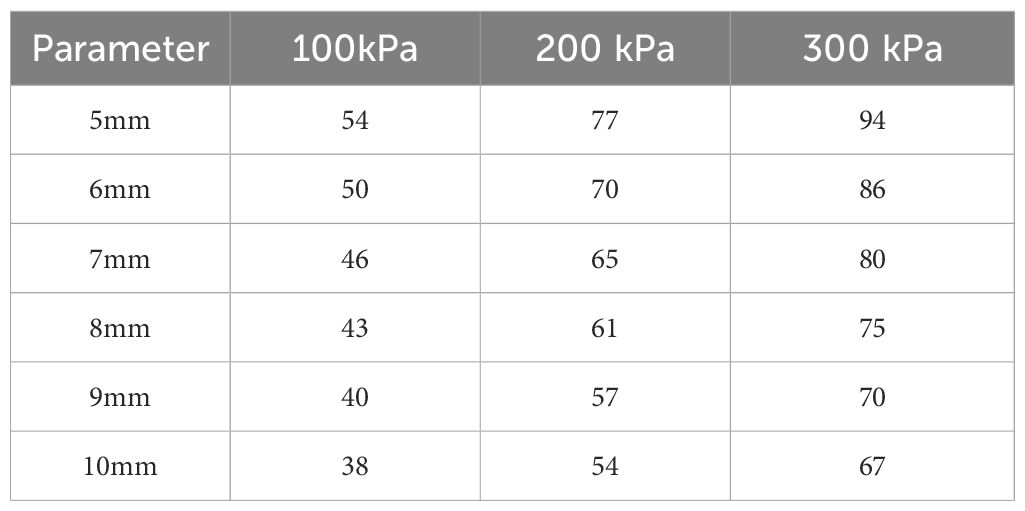
Table 1 Fr value under different leakage pressure and leakage hole diameter.
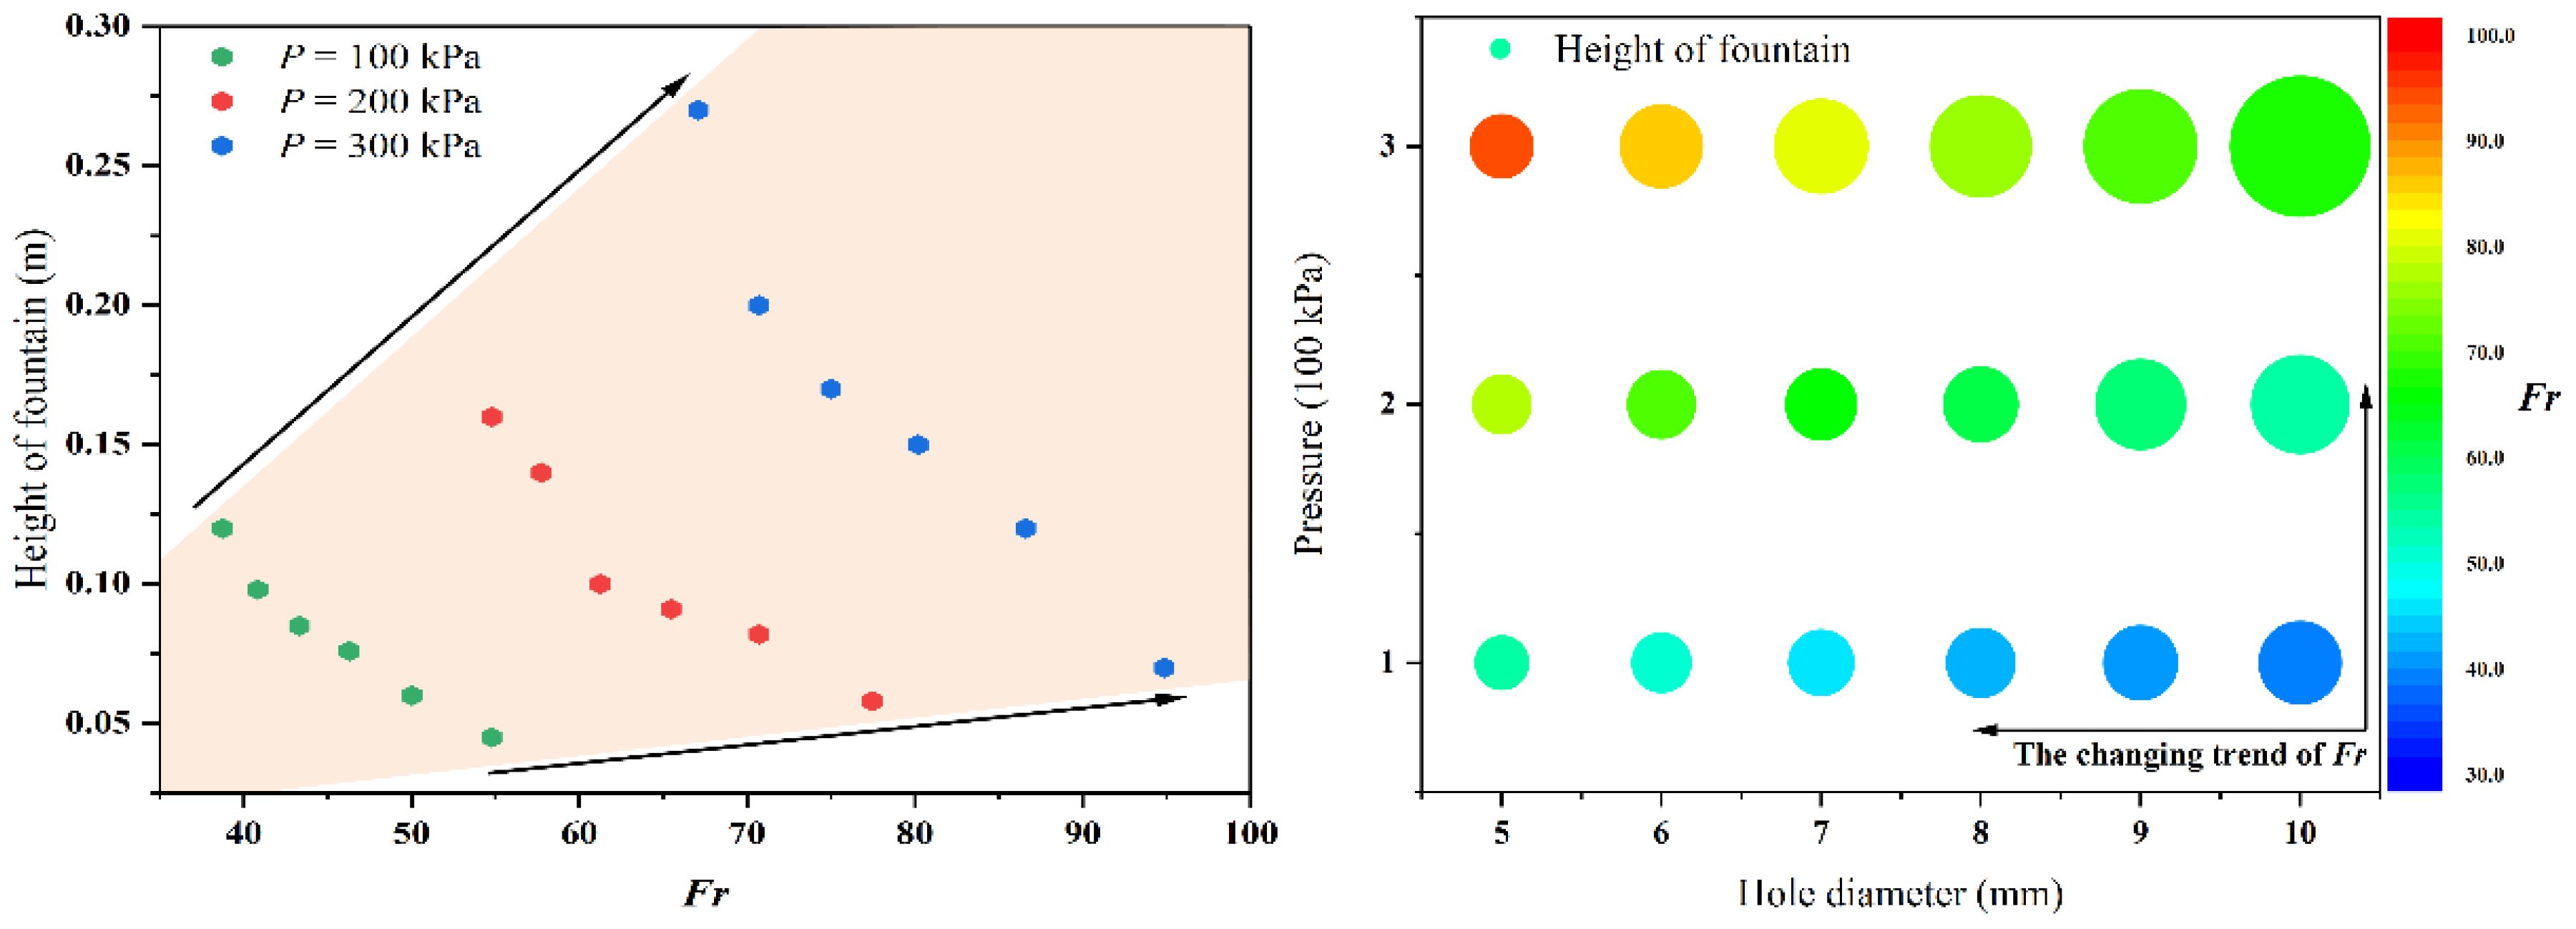
Figure 6 The relationship between fountain height and Fr under different conditions.
The Reynolds number (Re) is intricately linked to the motion state and inherent properties of the fluid, highlighting the preeminent roles played by inertial and viscous forces in fluid flow. As evident from Figure 7, the height of the fountain increases with an elevation in the Re value under constant pressure conditions, exhibiting an approximate linear correlation (Table 2). An increase in pressure elevates the initial Re value for the given leakage hole size, leading to corresponding variations in the height of fountain. Notably, the relationship between the Re value and the fountain height becomes more pronounced when the diameter of the leakage hole is larger. Both leakage pressure and leakage hole diameter exhibit synchronous trends with the variation in Re value. The combination of high leak pressure and small leak hole results in the same Re. Conversely, the combination of low leak pressure and large leak hole can also obtain the same Re value. Therefore, manipulating the Re value represents an effective strategy for controlling the leakage volume during gas leakage accidents under conditions where the diameter of the leakage hole is known.

Figure 7 The relationship between fountain height and Re value under different conditions.
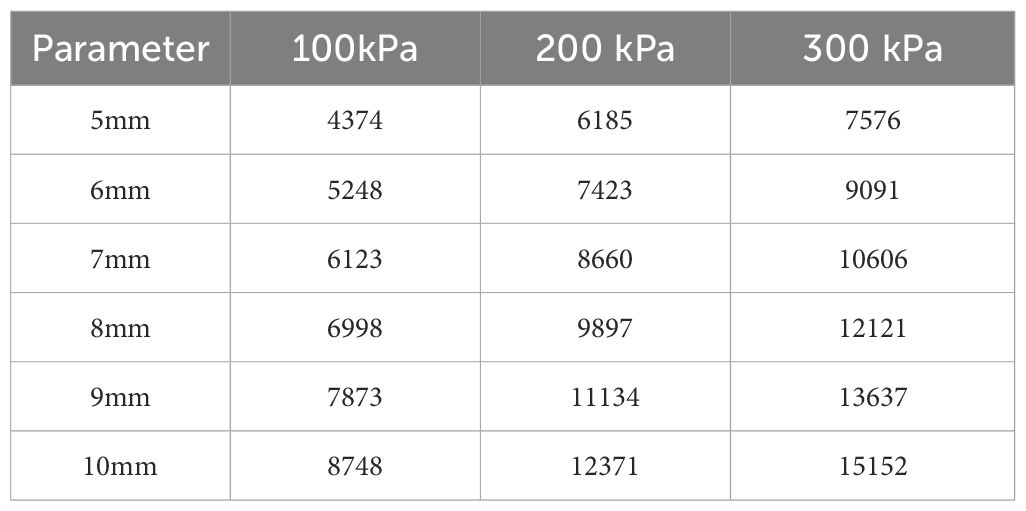
Table 2 Re value under different leakage pressure and leakage hole diameter.
5 Discussion
A copious quantity of individual bubbles rapidly erupts in a short time under the influence of the initial momentum after the gas leakage occurs, forming turbulent mass of gas. Water can be entrained by gas, which promotes the robust momentum exchange at the gas-liquid interface and augments the volume of the air mass (Geng et al., 2021). Additionally, the ascending bubble plume exhibits intermittent swelling phenomena during its rise. The energy of the bubble plume is continuously consumed during its ascent due to shearing. Subsequently, the bubbles exhibit convective diffusion characteristics under the action of buoyancy. Differences in bubble size can affect buoyancy, which can lead to differences in speed. Bubble-to-bubble collisions further exacerbate these velocity differences (Cao, 2020). Moreover, the random turbulent pulsations, wake inductions, shear flow fields, and other factors contribute to bubble collisions. The collisions lead to coalescence and fragmentation, causing periodic pulsations in the bubble plume. The dynamic interaction contributes to the instability between the bubble plume and the water surface (Figure 8). Consequently, the fountain’s size exhibits random characteristics (Olsen and Skjetne, 2016b). As depicted in Figure 9A, the fountain height varies between 0.127 m and 0.141 m during a specific monitoring period. Spectral analysis can reveal the pulsation patterns of the fountain height (Juliá et al., 2007). The frequency characteristics of its dynamic distribution is extracted by applying the fast Fourier transform to the fountain height data. As shown in the Figure 9B, the frequency characteristics of the fountain height are obvious during the monitoring time window, reflecting the turbulent pulsation characteristics of the bubble plume.
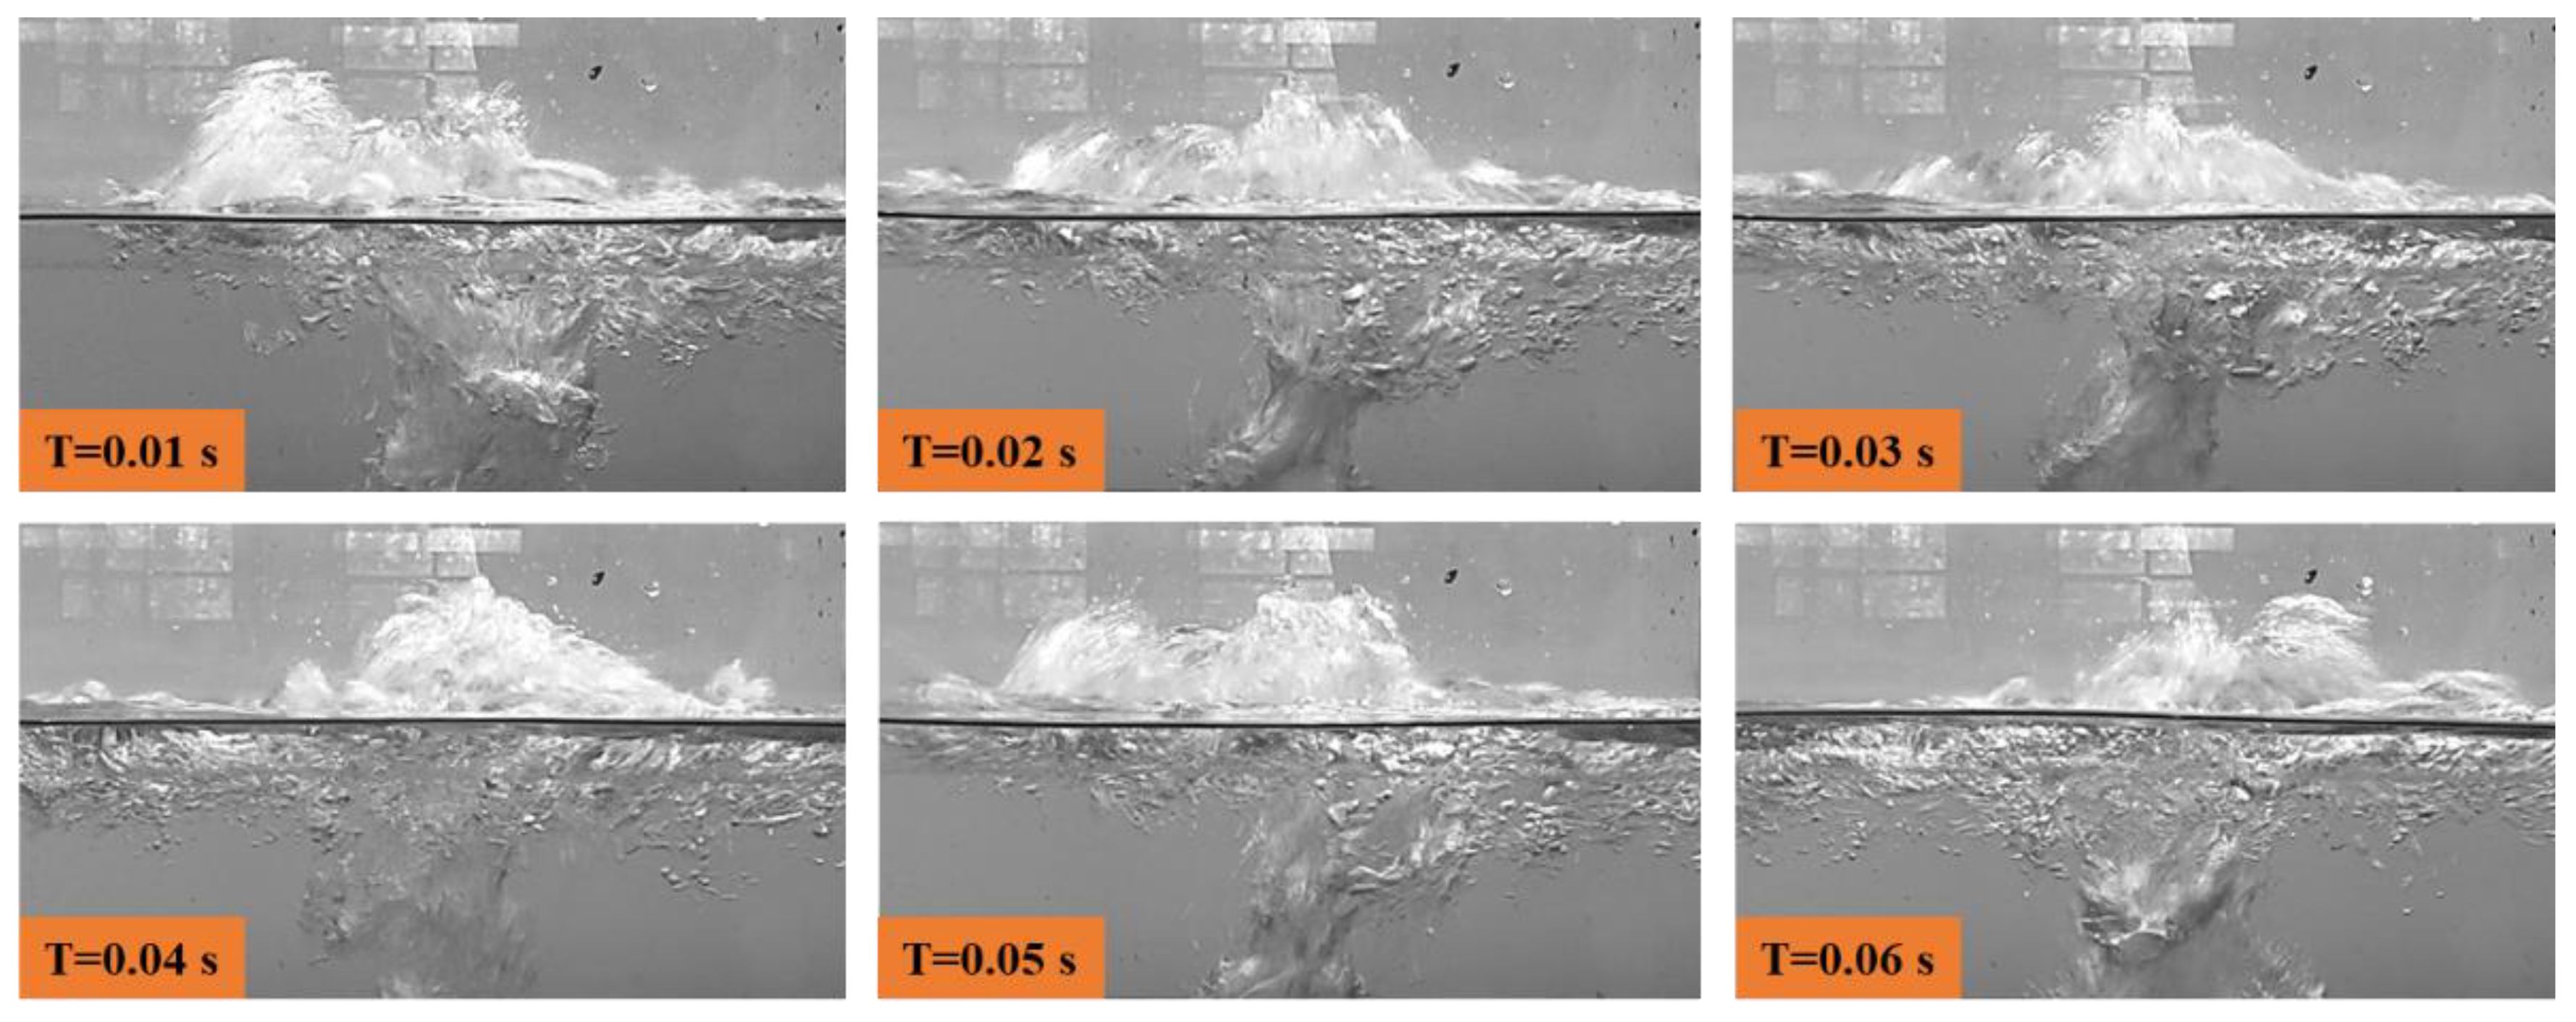
Figure 8 Photos of dynamic changes in the height of the fountain.
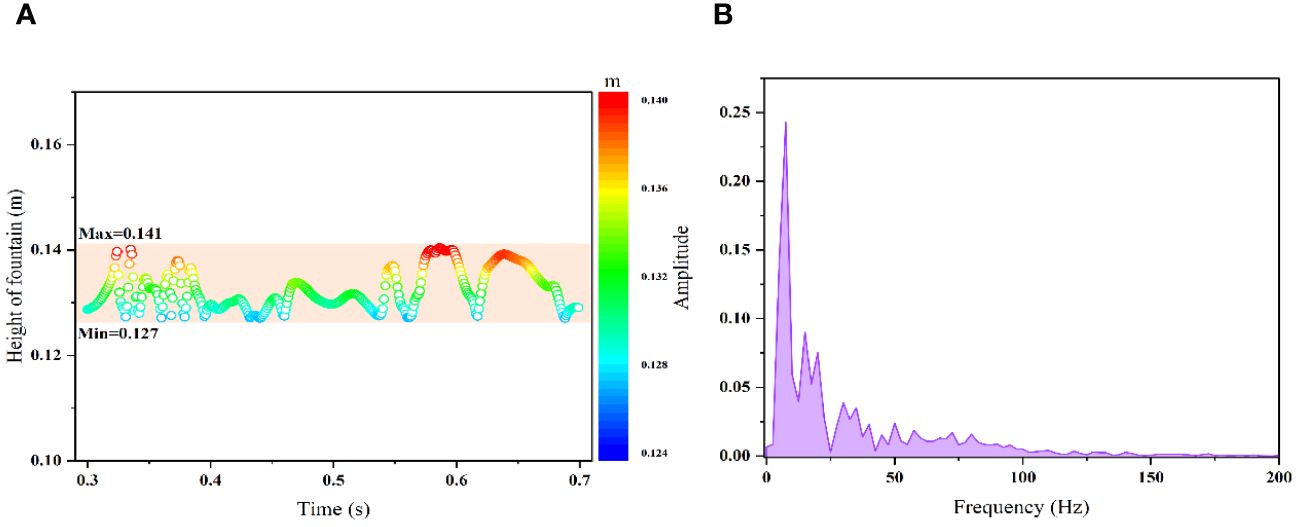
Figure 9 (A) Random fluctuation characteristics of fountain height; (B) Frequency distribution of fountain height time series data.
It is evident that the main frequency exhibits an upward trend with increasing leakage pressure. Figure 10 illustrates that the corresponding main frequencies for the three leakage pressures are 31.5 Hz, 52.5 Hz, and 79.5 Hz, respectively. Notably, the leakage pressure has more profound impact on the variation characteristics of the secondary main frequency compared to the primary main frequency. Additionally, the bandwidth of the frequency gradually widens as the leakage pressure increases. The presence of high-frequency data in the spectrum indicates sharp fluctuations in the shape of fountain, whereas low-frequency data suggests the stable and smaller fountain form.
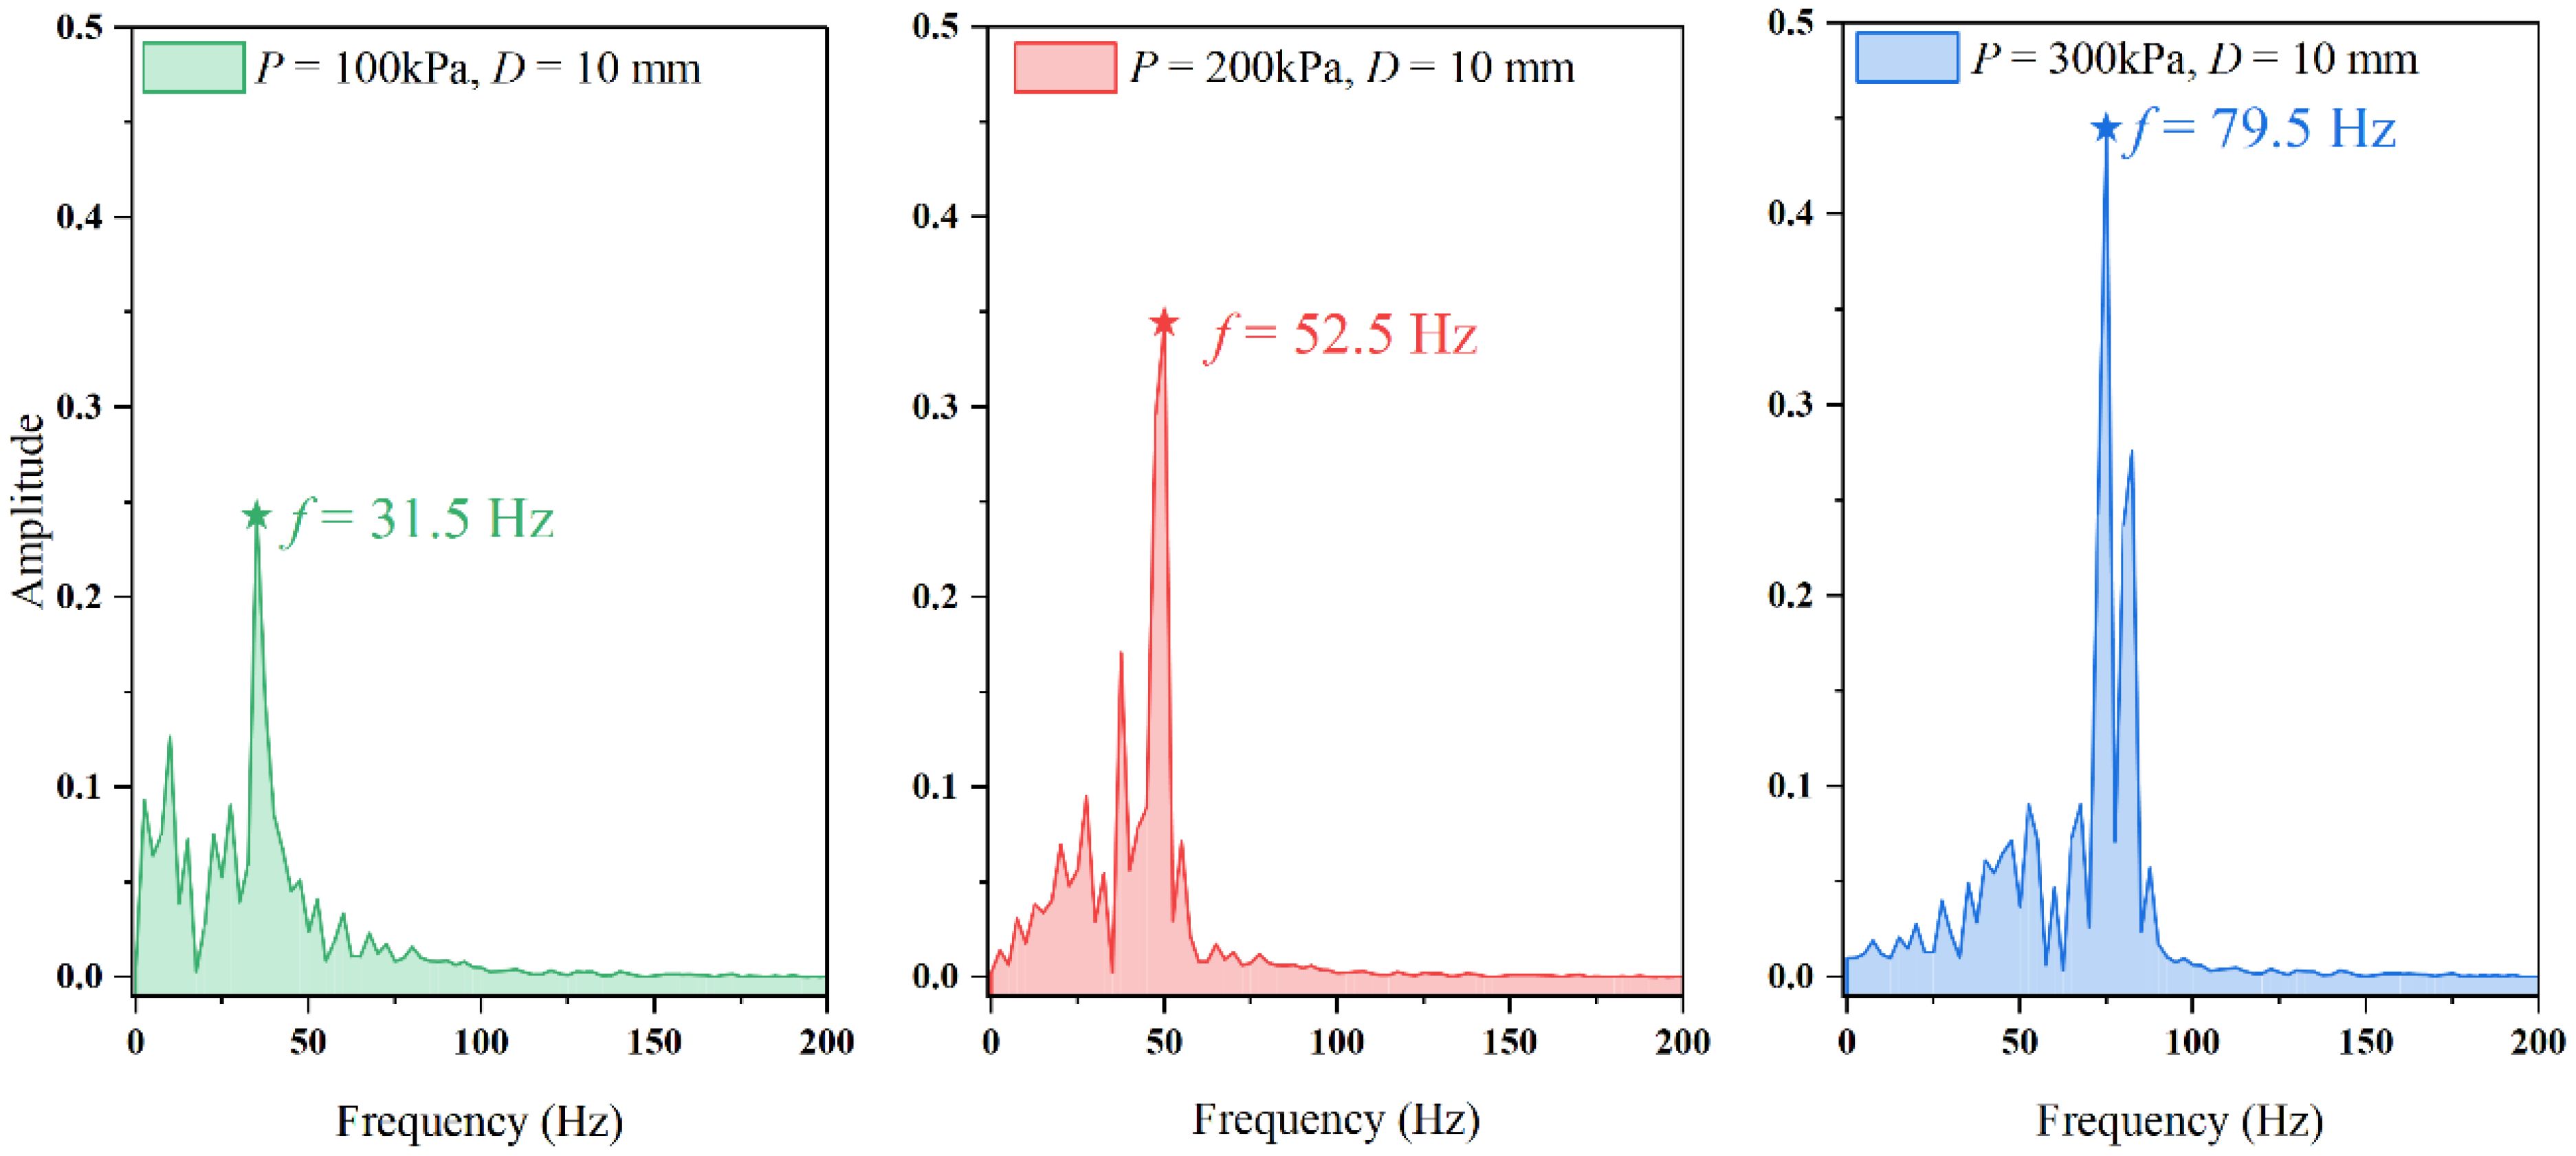
Figure 10 The main frequency of the fountain height is compared under different pressure conditions when the leakage hole diameter is 10mm.
Figure 11 demonstrates the correlation between the leakage hole diameter and the main frequency after considering various leakage pressure conditions. The decrease in both leakage pressure and leakage hole diameter leads to the notable reduction in the main frequency. The growth rate of the main frequency is significantly enhanced as the leakage hole diameter and leakage pressure increase. An increase in leakage pressure results in the higher initial kinetic energy of the bubble plume, which can intensify the coalescence and fragmentation of bubbles during their breakthrough of water resistance. The pulsation characteristics vary significantly among bubbles of different sizes when the bubbles reach the water surface, leading to more intense fluctuations in both the frequency and amplitude of the fountain height. The buoyancy of the bubble decreases rapidly when the bubble reaches the water surface. The disruption of the equilibrium between the buoyancy and the drag force creates the transient combined external force. The bubble carries the water upward until it ruptures under the influence of the combined external force, ultimately leading to the descent of water from the peak of fountain. The bubble size distribution within the bubble plume is broadened under conditions of high leakage hole diameter and leakage pressure, which enhances the initial kinetic energy and external force exerted by the bubble when it erupts from the free liquid surface. Consequently, the dynamic behavior of bubbles in the fountain becomes more intricate, further amplifying the variability in the fountain’s height.
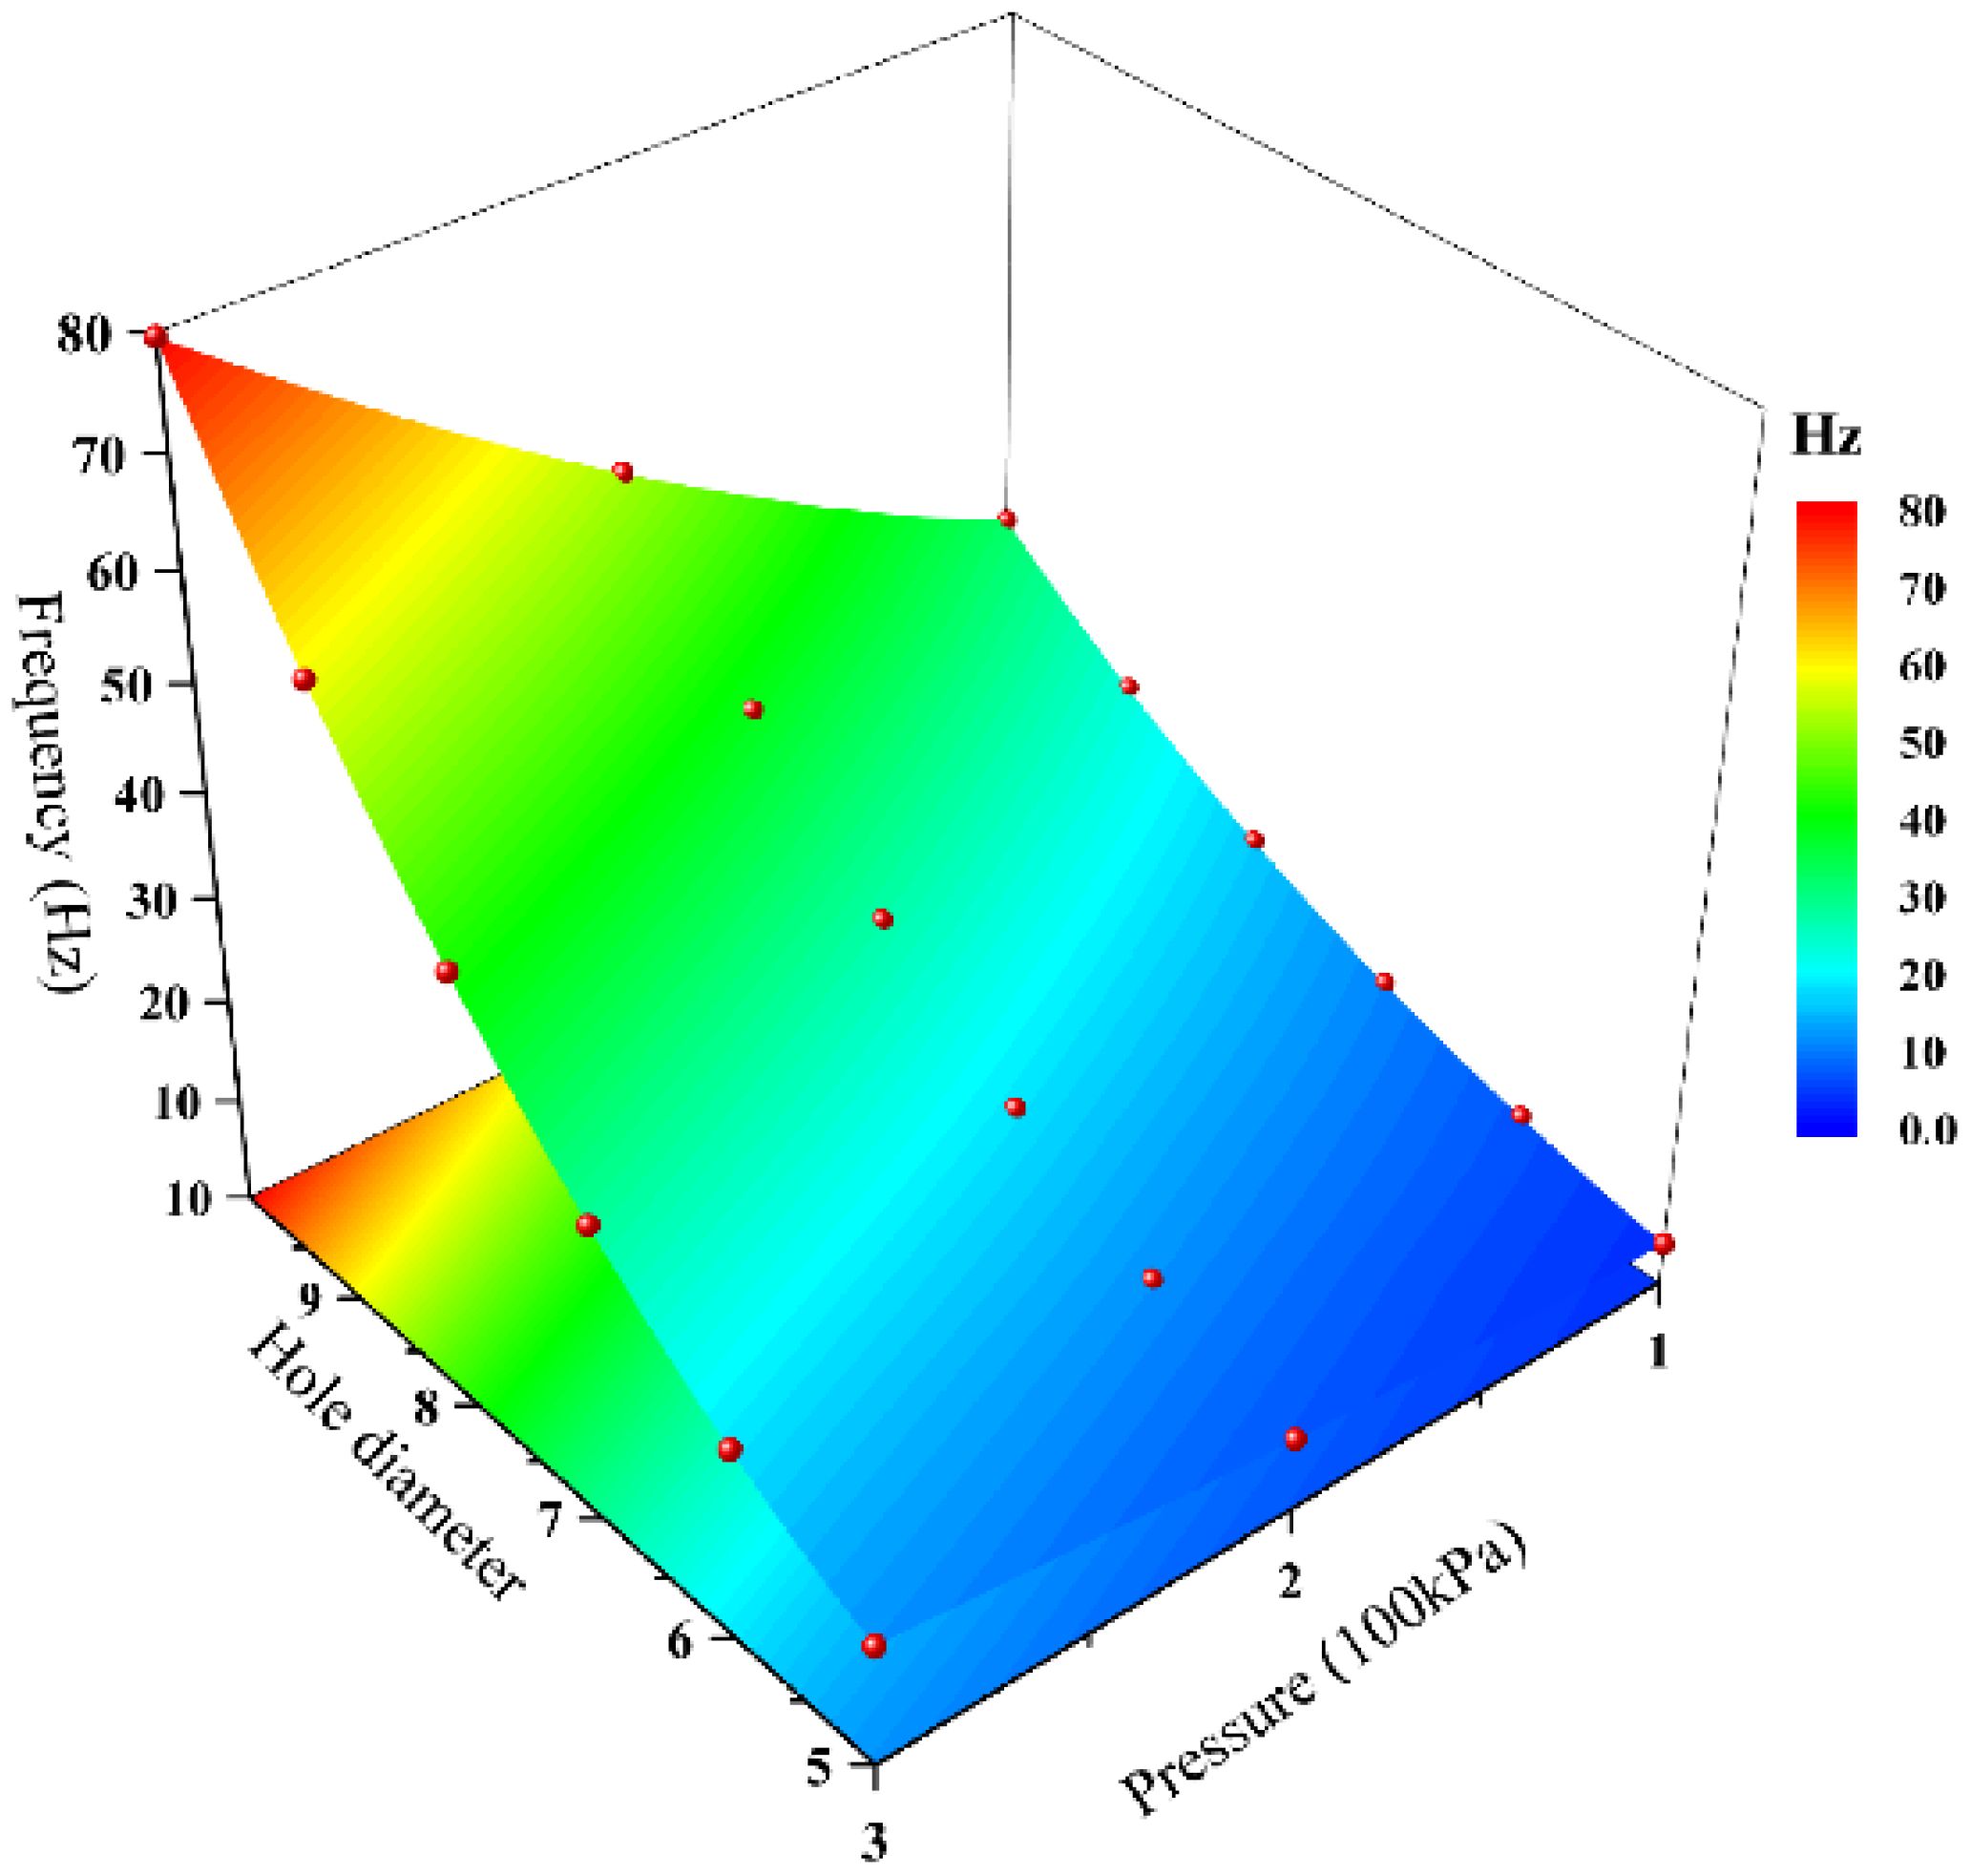
Figure 11 Surface fitting relationship between leakage pressure, leakage hole diameter and main frequency.
Specifically, the high-speed camera with the sampling frequency of 200 Hz is used to capture the entire process of underwater gas leakage in this study. Then, the frequency domain characteristics of the fountain phenomenon are analyzed. Currently, there are still some shortcomings in the research combining the geometric dimensions of fountain with frequency. It is not possible to fully determine the approximate range of the sampling frequency at the initial stage of the research, which represents the limitation of the experiment (Juliá et al., 2007; Deng et al., 2010 and Dai et al., 2006). Fortunately, the literature survey revealed that the vibration frequency of bubbles in water is less than 200 Hz, significantly lower than the noise frequency generated by the bubbles, which can be as the reference for the experimental design. However, the conclusion may not fully substantiate the frequency-related findings of the study, and further in-depth research is needed in this area. Meanwhile, the impact of water flow velocity on the characteristics of bubble plumes is indeed a significant issue that cannot be overlooked (Zhang and Zhu, 2014). Numerous studies have shown that the transport characteristics of bubble plumes in the flowing environment differ significantly from those in the static environment. The experiments on underwater pipeline gas leakage under conditions of zero water flow velocity in the shallow sea environment in the study. Future research will focus on the influence of current velocity on the fountain phenomenon.
6 Conclusion
The experiments are conducted under varying leakage hole sizes and leakage pressures to investigate the fountain phenomenon resulting from the leakage of submarine natural gas transmission pipelines. The correlation between the height and width of the fountain and key flow parameters is analyzed. Subsequently, the spectral characteristics of the fountain physical parameters are delved. The specific research findings are outlined as follows:
(1) The maximum height and width of the fountain exhibit the rising trend as the leakage pressure and diameter of the leakage hole increase. The combined effect of high leakage pressure and leakage hole diameter significantly enhances the height and diameter of the fountain. Consequently, it can be deduced that the change in fountain size during the leakage of large holes will be more pronounced.
(2) Dimensional analysis reveals that the force state of the bubble is influenced by the Froude number (Fr) and Reynolds number (Re). Both Fr and Re values increase with an increase in leakage pressure. The leakage hole diameter exhibits the negative correlation with Fr and the positive correlation with Re. Therefore, it is crucial for understanding the morphological development of the fountain in the event of gas leakage by monitoring and controlling the Fr and Re values of the leakage hole
(3) An increase in both leakage pressure and the diameter of the leakage hole results in an elevation of the main frequency. The influence of leakage pressure on the secondary main frequency is more prominent compared to the primary main frequency when the diameter of the leakage hole is significant. The outcomes of the frequency analysis offer a novel approach to inferring the state of submarine gas leakage through the examination of temporal changes in the heigh of fountain.
One of the most visible indicators of the interaction between the bubble plume and the water surface is the fountain phenomenon after the gas leakage occurs. In general, the variation patterns of the fountain physical characteristics are briefly analyzed, ignoring the frequency fluctuation characteristic of the fountain size. The frequency characteristics of the fountain is attempted to analysis in this study. However, the influence of current on the fountain remains unexplored and serves as a topic for future research.
Data availability statement
The original contributions presented in the study are included in the article/supplementary material. Further inquiries can be directed to the corresponding author.
Author contributions
HW: Writing – original draft, Methodology, Conceptualization. YJ: Writing – review & editing, Visualization, Software, Data curation. XL: Writing – review & editing, Validation, Supervision. JL: Writing – review & editing, Supervision, Conceptualization. KW: Writing – review & editing, Validation, Methodology, Funding acquisition, Conceptualization. JJ: Writing – review & editing, Resources, Data curation. HX: Writing – review & editing, Resources, Data curation. JT: Writing – review & editing, Resources, Data curation. CS: Writing – review & editing, Funding acquisition.
Funding
The author(s) declare financial support was received for the research, authorship, and/or publication of this article. This research is supported by the National Natural Science Foundation of China (Grant No. 52001196); and Research and development of key technologies for transmission and application of medium and low pressure H2 and HCNG pipeline (Grant No. 2021ZD0038).
Conflict of interest
The authors declare that the research was conducted in the absence of any commercial or financial relationships that could be construed as a potential conflict of interest.
Publisher’s note
All claims expressed in this article are solely those of the authors and do not necessarily represent those of their affiliated organizations, or those of the publisher, the editors and the reviewers. Any product that may be evaluated in this article, or claim that may be made by its manufacturer, is not guaranteed or endorsed by the publisher.
References
Adegboye M., Karnik A., Fung W. (2021). Numerical study of pipeline leak detection for gas-liquid stratified flow. J. Nat. Gas Sci. Eng. 94, 104054. doi: 10.1016/j.jngse.2021.104054
Afenyo M., Khan F., Veitch B., Yang M. (2017). A probabilistic ecological risk model for Arctic marine oil spills. J. Environ. Chem. Eng. 5, 1494–1503. doi: 10.1016/j.jece.2017.02.021
Benham G. (2023). The near-field shape and stability of a porous plume. J. Fluid Mech. 955, A13. doi: 10.1017/jfm.2022.1068
Burridge C., Mistry A., Hunt G. (2015). The effect of source Reynolds number on the rise height of a fountain. Phys. Fluids. 27, 047101. doi: 10.1063/1.4914470
Cao Z. (2020). Study on leakage diffusion mechanism of subsea gas pipeline (China: China University of Petroleum (East China). doi: 10.27644/d.cnki.gsydu.2020.000677
Cardoso S., Cartwright J. (2024). Bubble plumes in nature. Annu. Rev. Fluid Mech. 56, 295–317. doi: 10.1146/annurev-fluid-120720-011833
Cloete S., Olsen J., Skjetne P. (2009). CFD modeling of plume and free surface behavior resulting from a sub-sea gas release. Appl. Ocean Res. 31, 220–225. doi: 10.1016/j.apor.2009.09.005
Dai Z., Wang B., Qi L., Shi H. (2006). Experimental study on hydrodynamic behaviors of high-speed gas jets in still water. Acta Mechanica Sinica. 22, 443–448. doi: 10.1007/s10409-006-0029-2
Deng W., Cheng W., Cheng W., Wu X. (2010). Studies on the unstable law of bubble plume based on spectral analysis method of anomaly. J. Northwest Univ. 40, 1101–1105. doi: 10.16152/j.cnki.xdxbzr.2010.06.025
Garvey R., Fowler A. (2024). On the mathematical theory of plumes. Geophys Astro Fluid. 117, 79–106. doi: 10.1080/03091929.2023.2187054
Geng Z., Li X., Chen G., Zhu H., Jiang S. (2021). Experimental and numerical study on gas release and dispersion from underwater soil. Process Saf. Environ. Prot. 149, 11–21. doi: 10.1016/j.psep.2020.09.065
Jia M., Li F., Zhang Y., Wu M., Li Y., Feng S., et al. (2022). The Nord Stream pipeline gas leaks released approximately 220,000 tonnes of methane into the atmosphere. Environ. Sci. Ecotechnology. 12, 100210. doi: 10.1016/j.ese.2022.100210
Johansen Ø. (2000). Deep blow–a lagrangian plume model for deep water blowouts. Spill Sci. Technol. Bull. 6, 103–111. doi: 10.1016/S1353-2561(00)00042-6
Johansen Ø. (2003). Development and verification of deep-water blowout models. Mar. pollut. Bull. 47, 360–368. doi: 10.1016/S0025-326X(03)00202-9
Juliá J., Hernández L., Chiva S., Vela A. (2007). Hydrodynamic characterization of a needle sparger rectangular bubble column: homogeneous flow, static bubble plume and oscillating bubble plume. Chem. Eng. Sci. 62, 6361–6377. doi: 10.1016/j.ces.2007.07.055
Khan I., Zakari A., Zhang J., Dagar V., Singh S. (2022). A study of trilemma energy balance, clean energy transitions, and economic expansion in the midst of environmental sustainability: New insights from three trilemma leadership. Energy. 248, 123619. doi: 10.1016/j.energy.2022.123619
Li X. (2019). Research on risk evolution mechanism, prevention and control methodology for subsea oil & gas pipelines leak (China: China University of Petroleum (East China). doi: 10.27644/d.cnki.gsydu.2019.000022
Li X., Chen G., Khan F. (2019). Analysis of underwater gas release and dispersion behavior to assess subsea safety risk. J. Hazard Mater 367, 676–685. doi: 10.1016/j.jhazmat.2019.01.015
Li X., Chen G., Zhang R., Zhu H., Fu J. (2018). Simulation and assessment of underwater gas release and dispersion from subsea gas pipelines leak. Process Saf. Environ. Prot. 119, 46–57. doi: 10.1016/j.psep.2018.07.015
Li X., Wang J. (2023). Modelling underwater dispersion of gas released from seabed soil considering current and wave. Process Saf. Environ. 171, 260–271. doi: 10.1016/j.psep.2023.01.030
Li X., Zhu H., Chen G., Kang G., Geng K. (2017). CFD-based comparative analysis for the oil & gas dispersion behavior resulting from the submarine pipeline leakage. J. Saf. Environ. 17, 608–614. doi: 10.1016/j.ijnaoe.2018.07.002
Liu C., Liao Y., Wang S., Li Y. (2020). Quantifying leakage and dispersion behaviors for sub-sea natural gas pipelines. OCEAN Eng. 216, 108107. doi: 10.1016/j.oceaneng.2020.108107
Liu Z., Soares G. (2022). Experimental study of the behaviour of a circular gravity cage in linear waves. Aquacultural Engineering. 99, 102291. doi: 10.1016/j.aquaeng.2022.102291
Liu Z., Xu H., Soares G. (2023). Experimental study on the mooring forces and motions of a fish cage under regular waves. Ocean Engineering. 280, 114612. doi: 10.1016/j.oceaneng.2023.114612
Najjar Y. (2013). Hydrogen safety: The road toward green technology. Int. J. Hydrogen Energ. 38, 10716–110728. doi: 10.1016/j.ijhydene.2013.05.126
Nazir N., Khan F., Amyotte P., Sadiq R. (2008). Subsea release of oil from a riser: an ecological risk assessment. Risk Anal. Int. J. 28, 1173–1196. doi: 10.1111/j.1539-6924.2008.01136.x
Olsen J., Skjetne P. (2016a). Modelling of underwater bubble plumes and gas dissolution with an Eulerian-Lagrangian CFD model. Appl. Ocean Res. 59, 193–200. doi: 10.1016/j.apor.2016.06.001
Olsen J., Skjetne P. (2016b). Current understanding of subsea gas release: A review. Can. J. Chem. Eng. 94, 209–219. doi: 10.1002/cjce.22345
Olsen J., Skjetne P., Johansen S. (2017). VLES turbulence model for an Eulerian–Lagrangian modeling concept for bubble plumes. Appl. Math. Model. 44, 61–71. doi: 10.1016/j.apm.2017.01.031
Premathilake L., Yapa P., Nissanka I., Kumarage P. (2016). Impact on water surface due to deepwater gas blowouts. Mar. pollut. Bull. 112, 365–374. doi: 10.1016/j.marpolbul.2016.07.038
Reddy C., Arey J., Seewald J., Sylva P., Lemkau K. (2011). Composition and fate of gas and oil released to the water column during the Deepwater Horizon oil spill. PNAS. 109, 20229. doi: 10.1073/pnas.1101242108/-/DCSupplemental
Rui Z., Han G., Zhang H., Wang S., Pu H., Ling K. (2017). A new model to evaluate two leak points in a gas pipeline. J. Natural Gas Sci. Eng. 46, 491–497. doi: 10.1016/j.jngse.2017.08.025
Sausa A., Li S., Kaye N., Flynn M. (2023). The coalescence of adjacent turbulent plumes in a stratifed and unstratifed environment. Environ. Fluid Mech. 11, 32–38. doi: 10.1007/s10652-023-09952-y
Socolofsky S., Bhaumik T., Seol D. (2008). Double-plume integral models for near-field mixing in multiphase plumes. J. Hydraul Eng. 134, 772–783. doi: 10.1061/(ASCE)0733-9429(2008)134:6(772)
Wang H., Liu X., Wang K. (2024a). Research on floating body resistance characteristics of floating photovoltaic and analysis of influencing factors. Front. Mar. Sci. 11. doi: 10.3389/fmars.2024.1387564
Wang K., Ming Y., Liu X., Wang H., He Y. (2024b). Effect of lateral airflow on initial HSI and flame behavior of marine fuel in a ship engine room: Experiment and analysis. J. Mar. Sci. Eng. 12, 5. doi: 10.3390/jmse12010005
Wang S. (2020). Research on leakage and diffusion characteristics of underwater natural gas pipelines (China: China University of Petroleum (East China). doi: 10.27644/d.cnki.gsydu.2020.001760
Wise N., Hunt G. (2023). General solutions of the plume equations: towards synthetic plumes and fountains. Fluid Mech. 973, R2. doi: 10.1017/jfm.2023.784
Wu K., Cunningham S., Sivandran S., Green J. (2017). Modelling subsea gas releases and resulting gas plumes using computational fluid dynamics. J. Loss Prev. Process Ind. 49, 411–417. doi: 10.1016/j.jlp.2017.08.008
Yapa P., Dasanayaka L., Bandara U., Nakata K. (2010). A model to simulate the transport and fate of gas and hydrates released in deepwater. J. Hydraul. Res. 48, 559–572. doi: 10.1080/00221686.2010.507010
Yapa P., Wimalaratne M., Dissanayake A., DeGraff J. (2012). How does oil and gas behave when released in deepwater? J. Hydro-Environ. Res. 6, 275–285. doi: 10.1016/j.jher.2012.05.002
Zhang J., Hong K., Yuan Y. P., Lin Y. T., Han D. (2024). The role of quantified parameters on river plume structure: numerical simulation. J. Mar. Sci. Eng. 12, 321. doi: 10.3390/jmse12020321
Zhang W., Zhu D. (2014). Trajectories of air-water bubbly jets in crossflows. J. Hydraulic Eng. 140, 06014011. doi: 10.1061/(ASCE)HY.1943-7900.0000886
Zheng L., Yapa P., Chen F. (2003). A model for simulating deepwater oil and gas blowouts-part I: theory and model formulation. J. Hydraul. Res. 41, 339–351. doi: 10.1080/00221680309499980
Keywords: gas leakage, fountain effect, leakage pressure, leakage hole diameter, frequency
Citation: Wang H, Jia Y, Liu X, Liu J, Wang K, Jiang J, Xu H, Tang J and Sun C (2024) Study on the fountain effect of the bubble plume formed by submarine gas pipeline leakage. Front. Mar. Sci. 11:1402784. doi: 10.3389/fmars.2024.1402784
Received: 18 March 2024; Accepted: 21 May 2024;
Published: 06 June 2024.
Edited by:
He Li, University of Lisbon, PortugalReviewed by:
Sheng Xu, Jiangsu University of Science and Technology, ChinaZhongchi Liu, University of Lisbon, Portugal
Lin Wang, Southwest Petroleum University, China
Copyright © 2024 Wang, Jia, Liu, Liu, Wang, Jiang, Xu, Tang and Sun. This is an open-access article distributed under the terms of the Creative Commons Attribution License (CC BY). The use, distribution or reproduction in other forums is permitted, provided the original author(s) and the copyright owner(s) are credited and that the original publication in this journal is cited, in accordance with accepted academic practice. No use, distribution or reproduction is permitted which does not comply with these terms.
*Correspondence: Kan Wang, wangk@shmtu.edu.cn