 Burton Shank1*
 Alicia S. Miller1
 Laura Solinger1
 Michael J. Asaro1
 Douglas Sigourney2
 Alessandra Huamani2
 Marisa L. Trego3
 Crystal Franco3
 Jason J. Roberts4
 Jeffrey D. Walker5André L. Price1Mareike D. Duffing Romero6Colleen Coogan3Jennifer Goebel3Timothy V. N. Cole1
 Sean A. Hayes1
- 1Northeast Fisheries Science Center (NOAA), Wood Hole, MA, United States
- 2Azura Consulting LLC, Garland, TX, United States
- 3Greater Atlantic Regional Fisheries Office (NOAA), Protected Species Division, Gloucester, MA, United States
- 4Marine Geospatial Ecology Laboratory, Nicholas School of the Environment, Duke University, Durham, NC, United States
- 5Walker Environmental Research, LLC, Brunswick, ME, United States
- 6Institute of Marine Sciences-Okeanos, University of the Azores, Horta, Portugal
Entanglement is one of the primary anthropogenic threats to the North Atlantic right whale (Eubalaena glacialis; right whale) whose habitat overlaps fixed-gear fishing grounds in the Northwest Atlantic with entanglements representing around half of the mortality and serious injury incidents. Right whale mortality has reached levels that require intervention under the Marine Mammal Protection Act, creating the need for a tool that can compare the relative benefits of risk reduction management measures under consideration. To address this need, National Marine Fisheries Service developed a Decision Support Tool (DST) which has undergone continued development since 2019 and is introduced here as the Woods Hole Analysis of Line Entanglement (WHALE) DST. This tool calculates relative risk as the product of (1) the density of endlines associated with fixed-gear fishing at a given location and month, (2) the entanglement severity that endlines pose based on the specific configuration of the gear, and (3) the estimated density of right whales at the given location and month. The model is novel in its capacity to quantify reductions in entanglement risk by simultaneously assessing a variety of overlapping management actions such as time/area closures, weakening of rope, and other adaptations of gear configurations that reduce endlines or make them less dangerous. We demonstrate the functionality of the WHALE DST by applying management actions implemented in 2021. While originally developed for right whale conservation, the WHALE DST is adaptable for evaluating spatiotemporal entanglement risk reduction for other protected species management and marine spatial planning activities.
1 Introduction
Decision support tools (DSTs) exist across many disciplines, but are increasingly developed to assist the decision-making process in resource management and environmental risk mitigation, often in a participatory approach where both science and stakeholder input are informative (Gee et al., 2019; Wong-Parodi et al., 2020). Resource management decisions generally account for both the sustainability of natural resources and potential economic impact to industries within dynamic ecosystems, requiring a combination of best available science and stakeholder first-hand knowledge. Decision contexts may be complex, often spanning large geographic areas with variable environments, industry practices, and management strategies. DSTs excel in their ability to explore scenarios, promoting dialogue among stakeholders and resource managers across all stages of the decision-making process. Information sharing and engagement across disciplines is critical to the development of a successful DST that broadly considers the values of ecosystem services and bridges the gap between science and policy in aiding the decision-making process (Grêt-Regamey et al., 2017; Jagannathan et al., 2023).
Some DSTs have been developed to inform marine spatial planning (MSP) efforts such as siting of future marine protected areas (Portman, 2007, Stortini et al., 2015) and offshore aquaculture (Bricker et al., 2016; Gangnery et al., 2021), while other tools have focused on existing industries and their interactions with protected species (Verutes et al., 2020; Derville et al., 2023; Hatch et al., 2023). Tools built for siting MSP projects are constructed to estimate the current density and distribution of resources under consideration to minimize potential impacts. Alternatively, tools built to guide decisions to mitigate impacts of existing industries are frequently tasked with estimating current interaction rates, modelling the potential for actions to reduce those rates, and evaluating the success of those actions. Both processes rely heavily on stakeholder engagement and multi-disciplinary cooperation to estimate the current activities of affected industries and status of natural resources and to inform the viable actions that industries can take to reduce interaction.
Over the last decade, DSTs were introduced to address accelerated entanglement rates of large whales in fixed-gear commercial fisheries on the Atlantic and Pacific coasts of the United States of America (hereafter, USA; Feist et al., 2021; Lebon and Kelly, 2019; Miller et al., 2024). Fixed-gear fisheries are passive in nature, with nets and traps (or “pots”) set or anchored to the ocean floor with endlines extending to the surface where floating buoys are attached (Figure 1). Because these endlines are present throughout the water column and must be strong enough to haul gear from potentially great depths, they pose a risk of serious injury to animals that become entangled in them (How et al., 2021; Johnson et al., 2005; Knowlton et al., 2012).
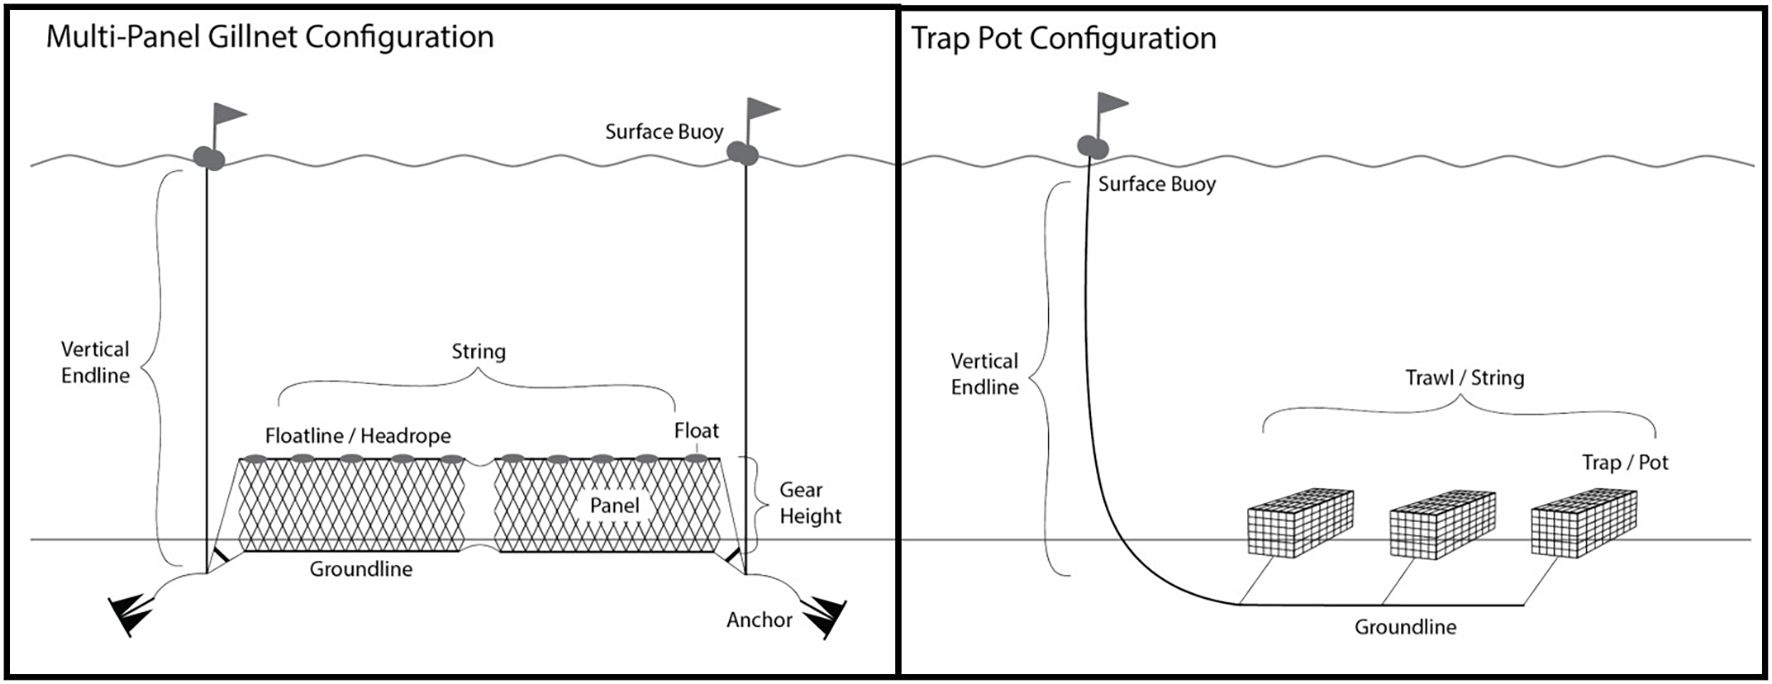
Figure 1. Example illustrations of gillnet (left) and trap (right) configurations. The gillnet illustration shows an anchored gillnet with two panels and two endlines. In the trap illustration, the gear configuration would be described as three traps per trawl associated with a single endline. Modified with permission from Miller et al. (2025).
The North Atlantic right whale (Eubalaena glacialis; hereafter right whale) is a baleen whale that is currently listed as Critically Endangered on the IUCN Red List (Cooke, 2020). Right whales are a coastal species that primarily forage in waters of the northwest Atlantic with some portion of the population migrating south to the waters off of the southeastern USA in the winter months for calving. Their habitat use closely overlaps with a variety of human activities in the USA and Canada (Pace et al., 2021; Pennisi, 2017) making them susceptible to a number of anthropogenic impacts. Entanglement has been identified as a major contributor to mortality and serious injury (Knowlton et al., 2016; Moore et al., 2021) and has also been linked to decreased body condition, ultimately resulting in decreased female fecundity (Reed et al., 2024). Recent population models have shown a rapid decline from around 480 to 372 individuals between 2010 and 2023 with anthropogenic mortality rates significantly higher than allowed by the Marine Mammal Protection Act (MMPA, 1972; Pace et al., 2017). This decline is attributed to the combination of increased adult mortality, largely attributed to fishing gear entanglement and vessel strike, and decreased calving rates, with fewer than 70 reproductively active females remaining, creating a need to implement additional protections for right whales (Linden, 2024).
Similar to many bycatch mitigation issues, efforts to reduce right whale entanglement face complex biological, technical, and socioeconomic challenges. Changes in distributions of both large whales and fixed-gear fisheries are often attributed largely to environmental variables, but fisheries are also sensitive to economics and policies (Riekkola et al., 2024), potentially driving the increased overlap between whales and gear and subsequently the incidence of entanglements. Mitigation hierarchies have been used for bycatch reduction (Gilman et al., 2022; Squires et al., 2021) and provide useful strategies for comparing approaches to reduce entanglement risk of right whales. Management actions that avoid and reduce entanglement risk are of primary importance. Avoidance is generally achieved by removing the spatiotemporal overlap of fixed-gear fisheries and whales through actions like time-area closures that restrict fishing activity when whales are present. When employing avoidance measures is prohibitive, gear modifications provide an alternative method of reducing entanglement risk through weakening of ropes, combining gear to reduce endlines (“trawling up”), and incorporating newer technologies that provide on-demand buoy deployment in place of the standard vertical endline (Borggaard et al., 2017; Matzen et al., 2025).
Given the variety of options to mitigate entanglement and the disparate socioeconomic and ecological implications of those actions, there is an increasing need for stakeholders and management agencies to work together to develop these strategies and measure their efficacy (Stephenson et al., 2016; Verschuur et al., 2025). The Atlantic Large Whale Take Reduction Team (hereafter Take Reduction Team or TRT) fills this role for right whale conservation. The TRT was formed in 1996 as required by the 1994 amendments to the MMPA (Bache, 2001) and is made up of fishers, fishing industry representatives, environmental group representatives, scientists, and state and federal resource managers. The TRT provides recommendations to the National Marine Fisheries Service (NMFS) to reduce the risk of entanglements through the Atlantic Large Whale Take Reduction Plan in a forum that promotes open group discussion and engagement across interests for policy development on critical conservation issues (Borggaard et al., 2017). This engagement often provides opportunities for sharing insights, local knowledge, diverse experiences, and unique perspectives among stakeholders (Nyumba et al., 2018).
The TRT and rule-making process identified the need for an objective, quantitative tool to support informed decision making and assess entanglement risk over time. In response, the National Marine Fisheries Service developed a DST in 2019 to help the TRT evaluate and compare the relative level of entanglement risk reduction achieved by alternative suites of management measures. The approach in building this tool was to: 1) identify key risk components, 2) collect relevant data from direct sources or literature, and 3) combine these into a quantitative tool for assessing and visualizing risk, as well as evaluating changes in response to management actions. Stakeholder involvement during development was essential to ensure accuracy and promote buy-in. Initially focused on the American lobster (Homarus americanus) and Jonah crab (Cancer borealis) fisheries in New England, the DST has expanded to include all commercial fixed-gear fisheries on the USA east coast, additional large whale species, and the ability to model a broader range of fishery management actions. Here, we detail the capacities of the Woods Hole Analysis of Line Entanglement Decision Support Tool (WHALE DST) and demonstrate its use for evaluating entanglement risk reduction from complex, temporally- and spatially-explicit, fishery-specific management actions.
2 Methods
2.1 Model overview
The WHALE DST operates as a deterministic series of calculations that translates the spatiotemporal overlap of whales and fishing gear, with consideration of gear configurations, to estimates of the relative distributions of entanglement risk and assesses potential risk mitigation from various management actions. The tool has a modular structure that incorporates inputs constructed outside of the model itself and specified when the model run is initiated. The model primarily estimates entanglement risk in space and time as the product of three key inputs: fishing gear density, associated gear threat, and whale density. The model is demonstrated here with input layers and parameters that incorporate density, distribution, and configuration for all fixed-gear fisheries on the US East Coast and right whale density and distribution for this region (Table 1). The model is coded in the R programming language (R Core Team, 2024).
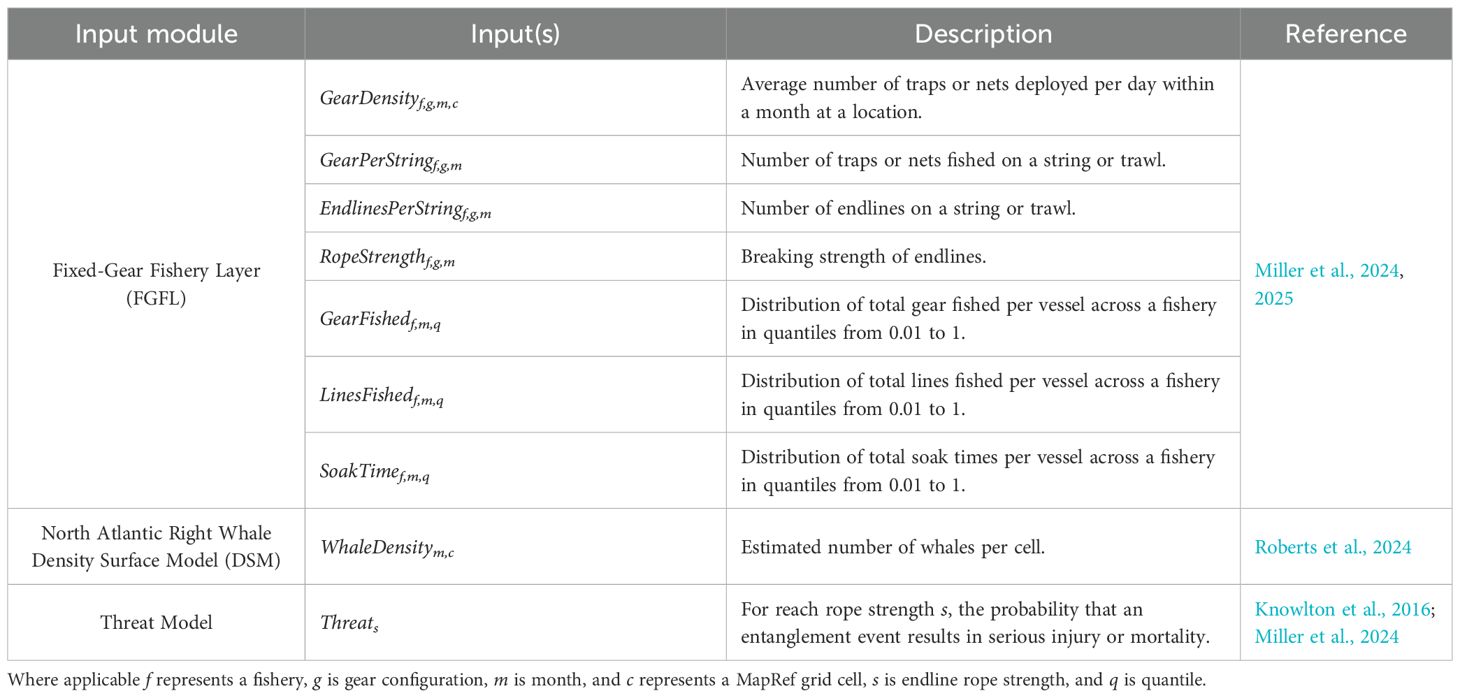
Table 1. Inputs used in the WHALE DST to estimate entanglement risk of North Atlantic right whales.
The Fixed-Gear Fishery Layer (FGFL; Miller et al., 2025) was developed as an input for the WHALE DST and provides a comprehensive metric of fixed-gear fishing effort for all trap and gillnet fisheries from Maine to Florida. This input is largely developed from vessel trip reports, vessel monitoring system data, observer data, and interviews with industry members and state resource managers. Gear is allocated spatially by month from the most recent years of data (currently 2010 - 2021, depending on fishery and data availability) and grouped by gear type (e.g. trap, gillnet), method (e.g. sink gillnet, drift gillnet), configuration (e.g. mesh size, string length), and target species (e.g. New England groundfish, American lobster, whelk). The identification and delineation of the various fisheries along the coast was critical to ensure that gear modification management scenarios within the WHALE DST were simulated and applied appropriately to the designated fisheries and allowed stakeholders to examine how management actions impact individual fisheries.
Estimates of monthly whale density and distribution were adapted from a density surface model (DSM) developed and provided by the Marine Geospatial Ecology Lab at Duke University (Roberts et al., 2016). The right whale DSM (Version 12; released February 12, 2022) incorporated systematic shipboard and aerial survey sightings data from August 1999 through September 2020, and utilized oceanographic and habitat variables to project monthly whale habitat density at a 5 km2 resolution over different time periods (Roberts et al., 2024). Model outputs were transferred to the resolution of the WHALE DST using a raster overlay.
Endline strengths and gear configurations vary by location, depth, and fishery type. Incorporating these configurations, including endline diameter and strength, into the WHALE DST allows for the disparate threat that each configuration poses to be evaluated alongside the co-occurrence of gear and whales for a total relative risk value. Knowlton et al. (2016) reported that larger whale species, including right whales, are less likely to be observed entangled in weaker ropes than smaller whales, indicating an increase in entanglement severity and decrease in gear shedding with increased line strength. Building on this, we developed an empirical Threat Model, which relies on rope strengths of endlines as a proxy for entanglement risk and severity based on the discrepancy between the empirical distribution of line strengths observed on severely entangled whales and the theoretical distribution of endline strengths whales are expected to encounter in their habitats, based on modeled co-occurrence in the WHALE DST (Miller et al., 2024).
2.2 Model domain
To cast all inputs onto a single spatial scale, we use a one arc-minute reference grid (hereafter MapRef), generally constrained by the extent of the USA Exclusive Economic Zone, the extent of the Roberts et al. (2016) model, and depths between 0 and 2,000 meters, totaling 148,988 grid cells (hereafter cells; Figure 2). All inputs were cast to this resolution for consistency, recognizing that the underlying data often have a different native resolution (Miller et al., 2025). Where inputs had a coarser native resolution than the model, inputs were down-scaled using raster-overlay based on the centroids of model cells. Where inputs had a finer native resolution, we calculated the mean value of inputs within model cells. Additional spatial attributes were included in the MapRef grid to assist with subsetting the model and incorporating management actions. These attributes include cell area, bathymetry, distance from shore, Statistical Reporting Areas (SRA), Lobster Management Areas (LMAs), state and federal water jurisdictions (inside and outside of three miles from shore, respectively), and other fishery management boundaries. These attributes allow the model define and constrain the spatial extent of proposed management actions and the potential relocation of fishing gear. Bathymetry was determined by overlaying the USA Coastal Relief Model as available in 2021 from the NOAA National Center for Environmental Information (NGDC, 1999a, 1999b, 2001). Records in the FGFL and whale DSM inputs were assigned to a spatial key that referenced corresponding cells in MapRef, creating a flexible input format that allowed for multiple fisheries to operate in the same location.
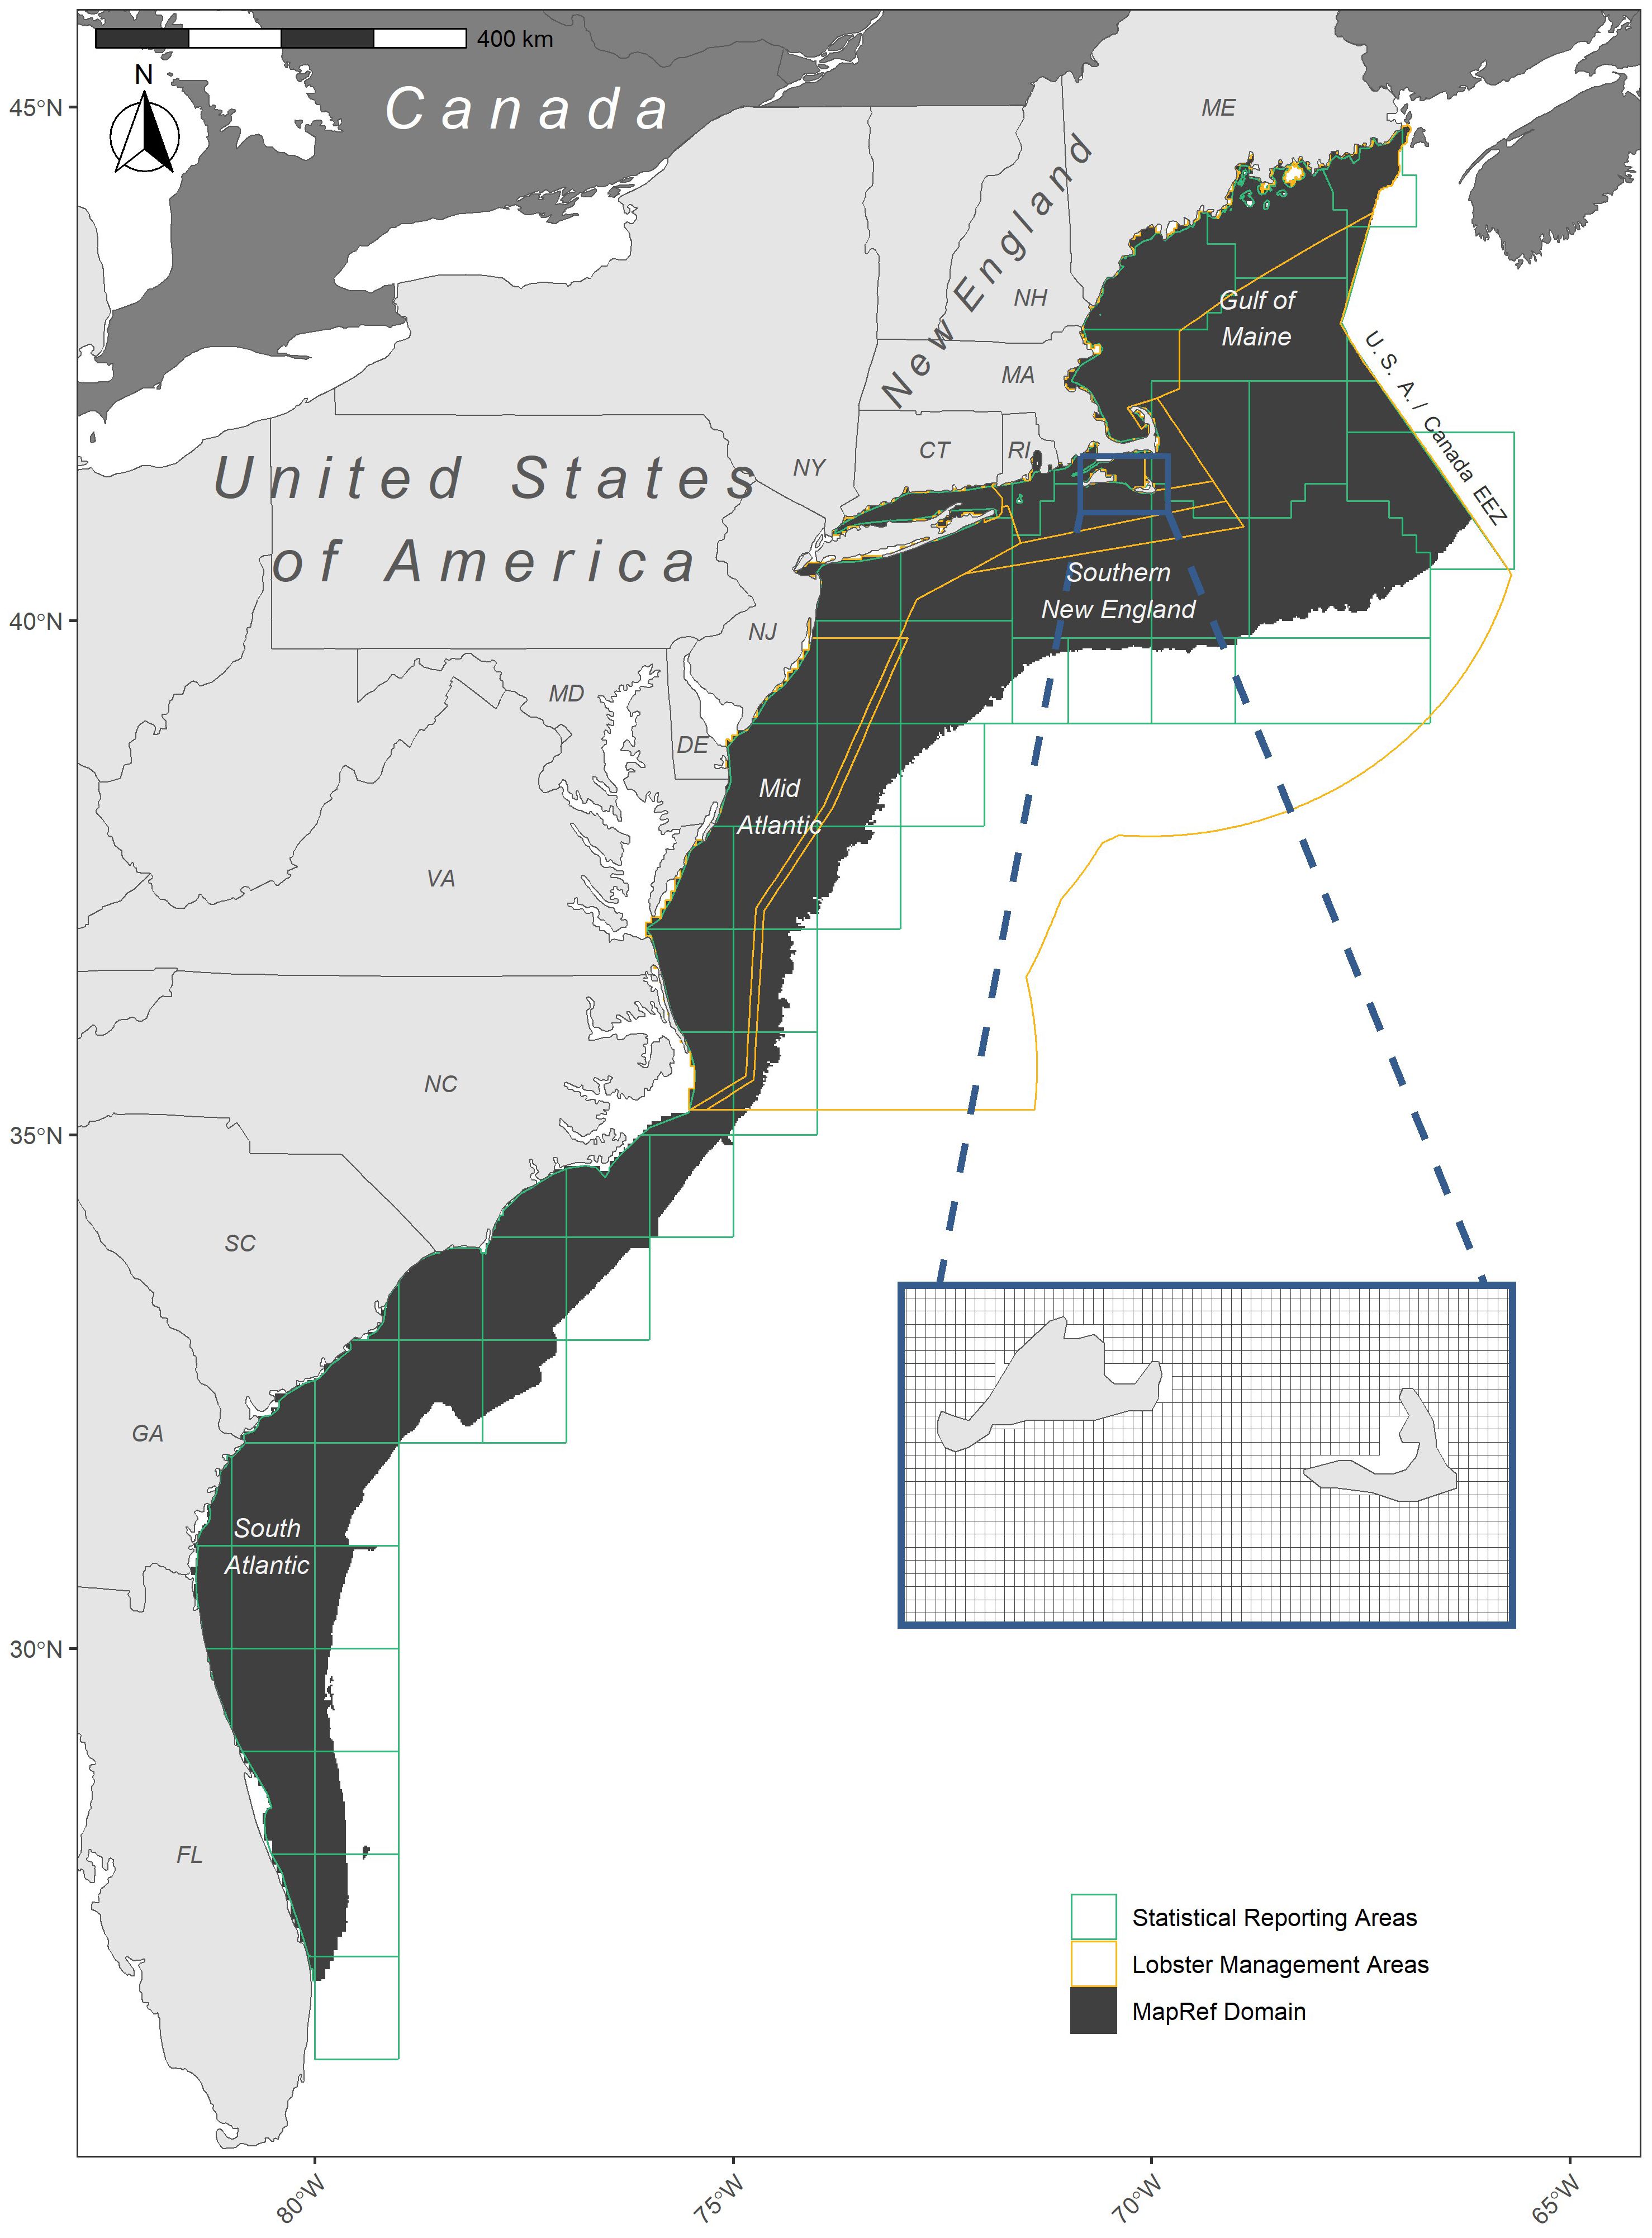
Figure 2. Domain and reference grid (MapRef) used to align all inputs for the DST. Each grid cell has attributes with information on location, depth, distance from shore, and relevant management jurisdiction identifiers (e.g. Statistical Reporting Areas, Lobster Management Areas). The blue rectangle map inset shows the 1 nm2 resolution of the grid cells within MapRef. Maine (ME), Florida (FL) and the New England region are labelled on the map.
2.3 Model structure and function
The WHALE DST is structured in stages to sequentially convert the gear density in the FGFL to other gear configuration metrics that relate to the ultimate calculation of risk (Figure 3). Briefly, the number of strings of gear at a location is calculated from the amount of gear (traps or net panels) divided by the number of units of gear in a string:
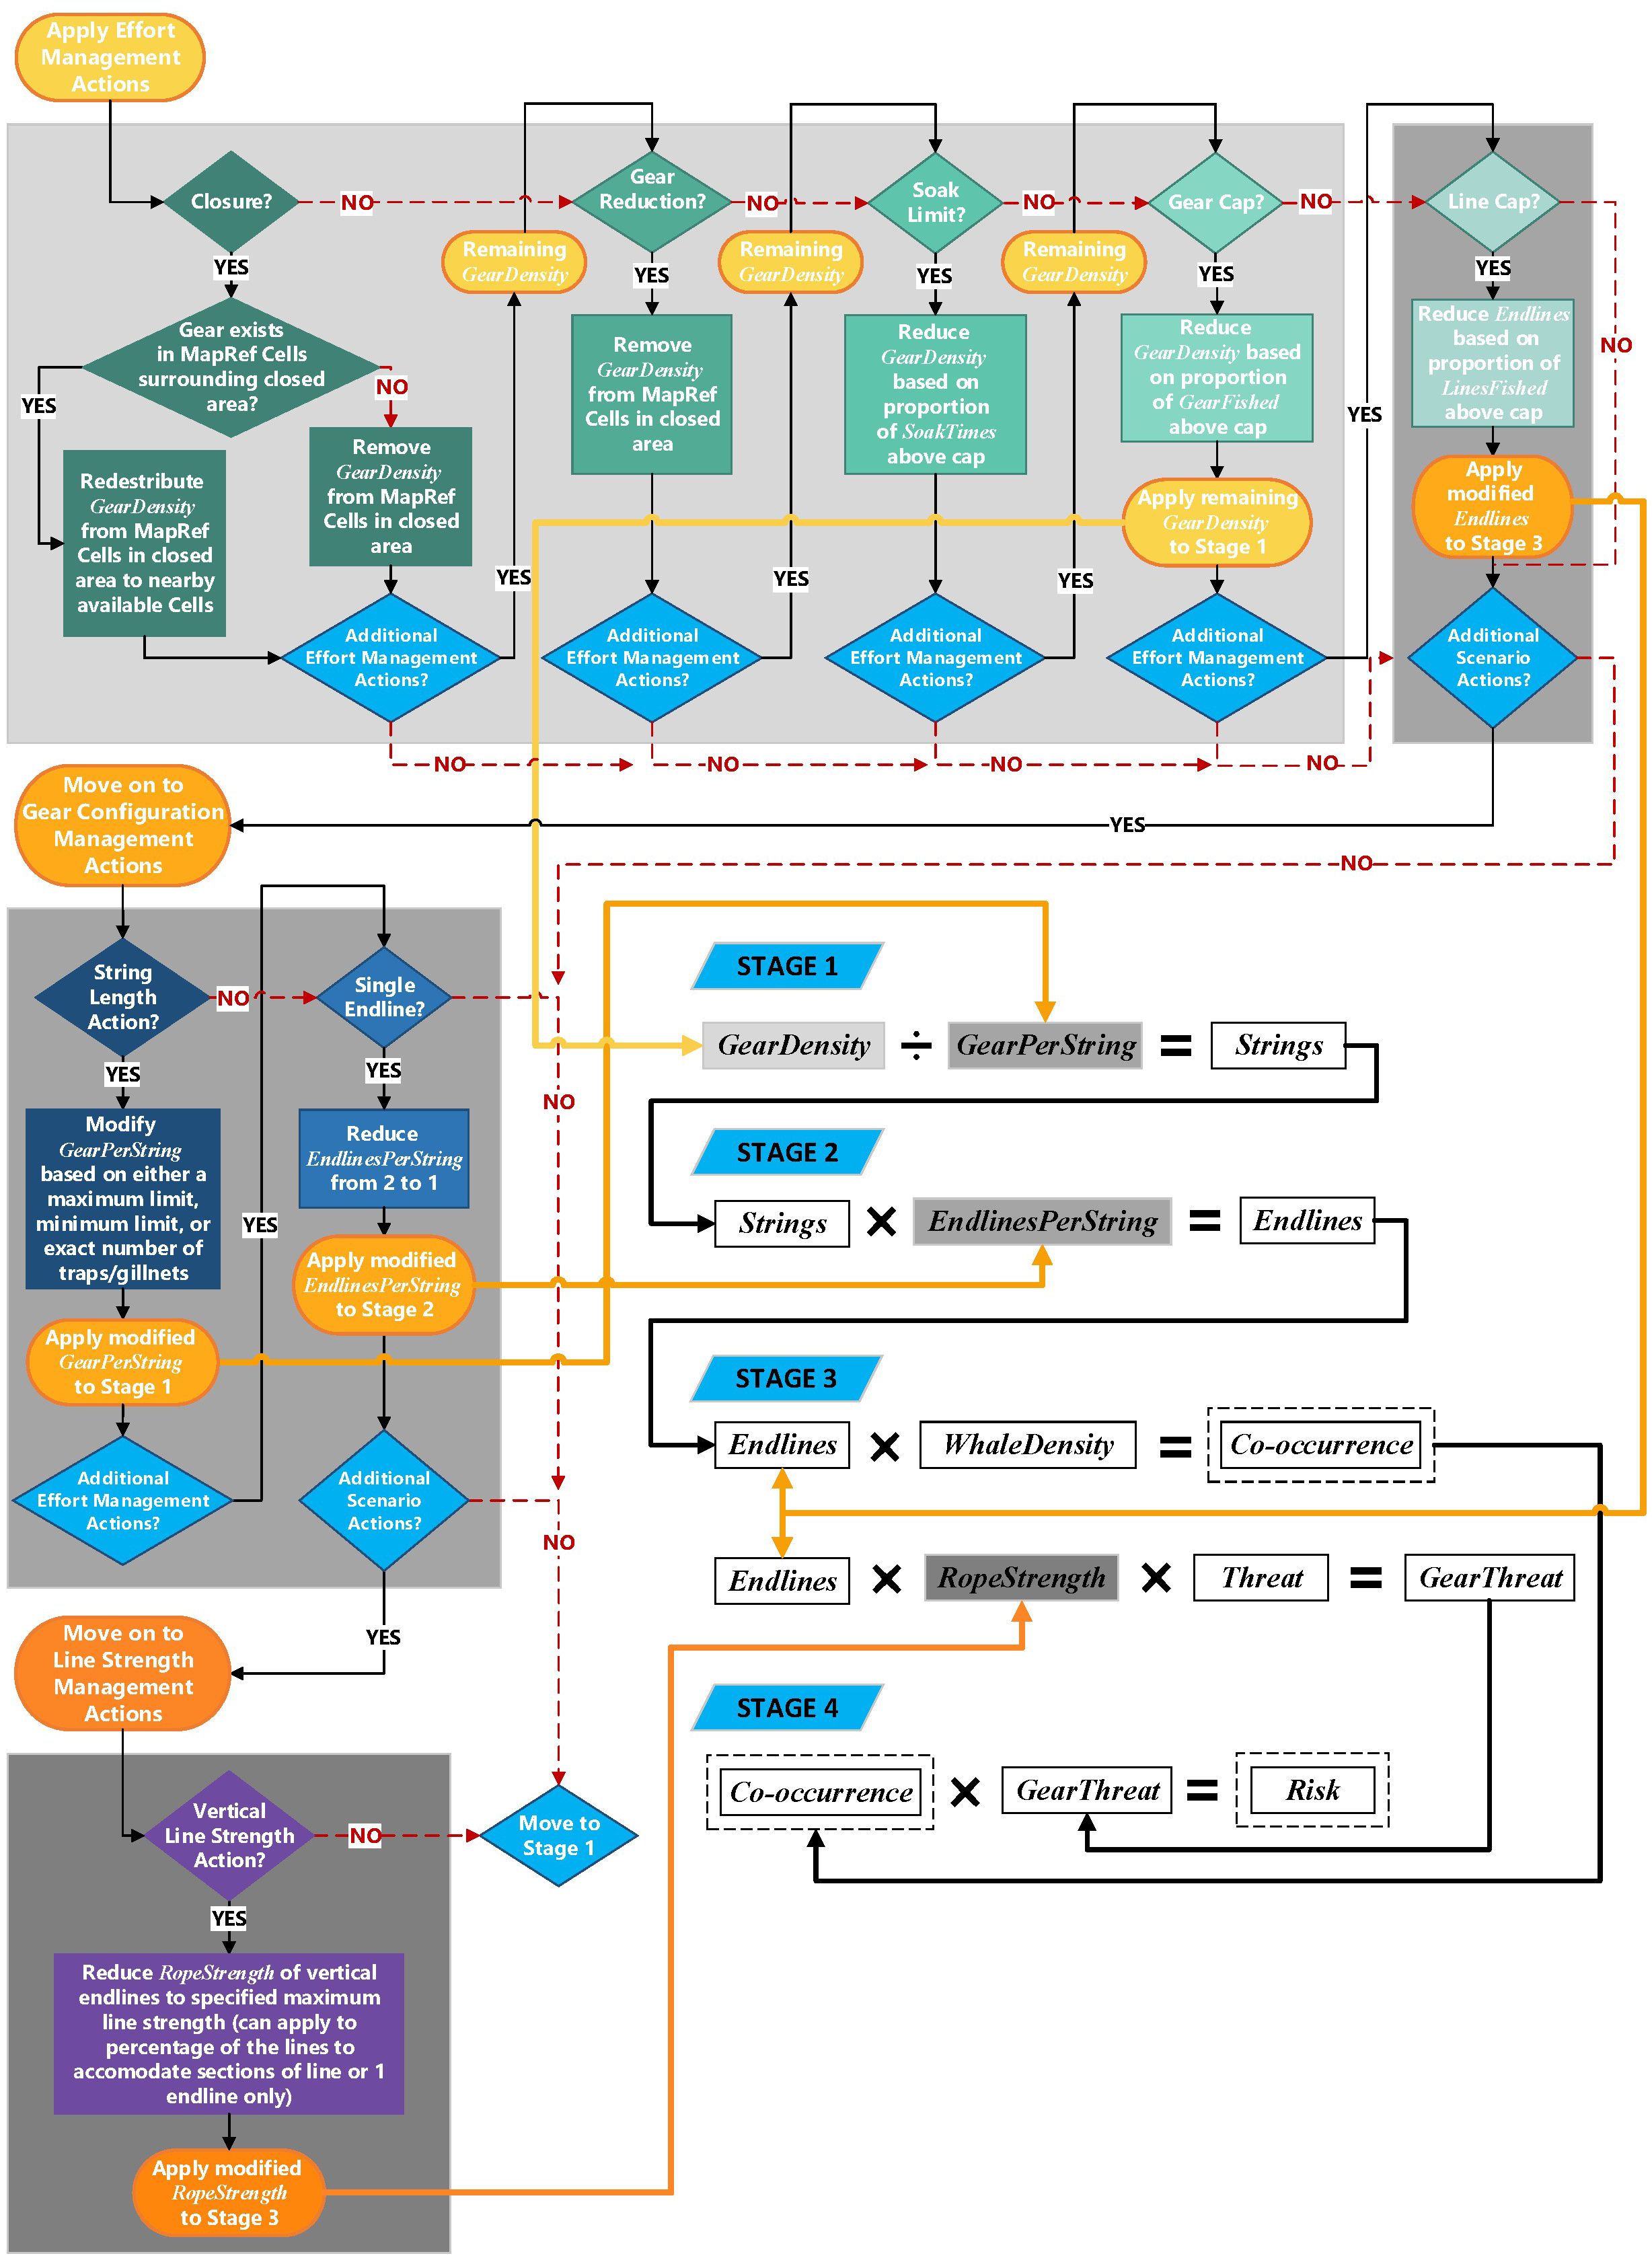
Figure 3. Flow diagram of the WHALE DST calculation of Co-occurrence and Risk for an individual fishery (f), gear configuration (g), month (m) and MapRef grid cell (c). If no Scenario Actions are selected, the model proceeds through each of the stages in the bottom right with the fishery inputs (GearDensityf,g,m,c, GearPerStringf,g,m,c, EndlinesPerStringf,g,m,c, RopeStrengthf,g,m) unchanged. If Scenario Actions are modeled, the fishery inputs are modified accordingly before proceeding through the model stages.
Where is the number of strings of gear present for a given fishery f, with gear configuration g, in month m and cell c, is the number of units of gear present from the respective fishery and represents the number of gear units in a string (net panels in a string or traps in a trawl).
The total number of Endlinesf,g,m,c is calculated as the number of GearStringsf,g,m,c multiplied by EndlinesPerStringf,g,m,c, where endlines are generally attached either to both or only one end of the string. Co-occurrence of endlines with whales is then calculated as:
where Co-occurrencef,g,m,c is associated with each fishery, gear configuration, month, and cell and for the month and cell.
The conditions under which a whale encountering an endline results in a serious entanglement are a complex interaction of multiple physical, environmental, and behavioral factors and, unfortunately, very little data exists on the specific circumstances that lead to serious entanglements (Henry et al., 2022). Currently, the gear threat model is based on reported rope diameters, the relationship between rope diameters and breaking strengths and a statistical model relating rope breaking strength to the relative probability of observation in entanglement mortalities (Miller et al., 2024). We constructed a Generalized Linear Model (GLM) to characterize the distribution of breaking strengths associated with ropes of different diameters with data collected from entanglements by Knowlton et al. (2016) and gear testing trials performed by Maine Department of Marine Resources (DMR). We then used co-occurrence models from the DST to characterize the expected frequency of rope strengths encountered by both right and humpback whales and fit a logistic regression of the relative frequency of observed breaking strengths of ropes recovered from fatal entanglements to the expected frequencies to characterize how stronger ropes were over-represented in serious entanglements for both species. Thus, the resulting model is scaled to a range of zero to one with zero representing no threat and one representing maximum threat.
In the DST, rope strengths associated with endlines are modeled as a binned distribution of strengths and the threat score associated with a rope is the sum of the product of the threat score for each strength bin and the proportion of ropes that exhibit that breaking strength as:
where is the threat associated with a rope of breaking strength s, assessed over strengths from 0 to 11,000lbs in 100-pound intervals. is the threat associated with endlines of a given fishery and gear configuration and p(s) is the proportion of ropes with strength s for that fishery and gear configuration.
The risk of entanglement is then modeled as the product of the co-occurrence of whales with endlines and the threat associated with the endlines under the conditions present.
These calculations, without modification of fisheries by management scenarios, represent the calculation of estimated ‘baseline’ (e.g. current or existing) co-occurrence and risk scores. When management measures or “Scenario Actions” are modeled, the WHALE DST carries out this process in two parallel instances. The first establishes the baseline status, unchanged by proposed management actions as above. The second instance modifies the location, density and configuration of gear according to the requested Scenario Actions, and assesses the updated risk score relative to the baseline (Figure 3).
2.4 Scenario actions
The WHALE DST currently models eight types of Scenario Actions that alter the density, distribution, and configuration of fixed-gear (Table 2; Figure 3). These actions are broken down into three categories of management strategies: Effort Management, Gear Configuration Management, and Line Strength Management. Scenario Actions for Effort Management modify the FGFL by explicitly restricting gear from an area (e.g. time/area closures) or by imposing limits on each vessel within a fishery for the amount of gear, number of endlines, or duration of time that gear can be fished (e.g. Effort Caps). Alternatively, Gear Configuration Management actions modify the FGFL by imposing requirements on the number of traps per trawl or nets per string and the number of endlines that can be fished on a trawl or string. These actions assume that the total amount of gear fished is unchanged, but the configuration of gear is modified, changing the number of associated trawls or strings and endlines. Finally, Line Strength Management actions impose a cap on the strength of endlines that can be fished. The calculations of individual Scenario Actions are described below. Further details and supporting code can be found in Miller et al. (2024) and Appendix B.
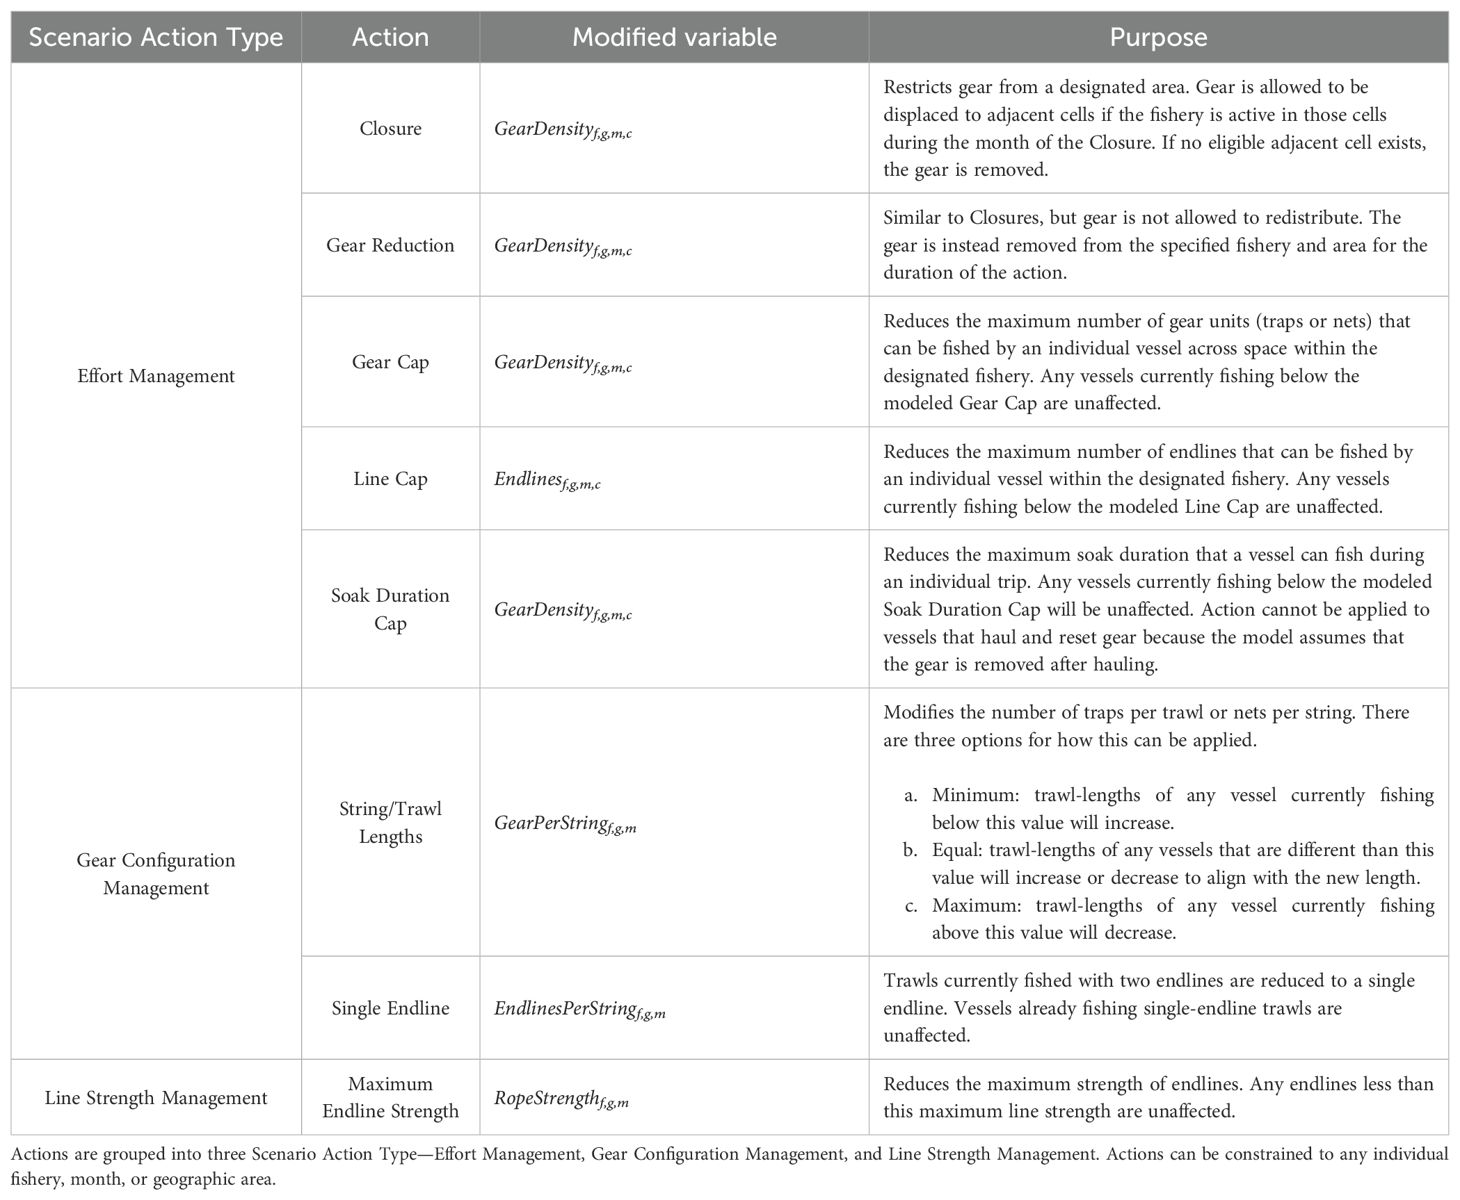
Table 2. Scenario actions available to simulate management actions in the WHALE DST.
For an individual model run, one or more Scenario Actions can be modeled. The extent of the model domain and the list of Scenario Actions can be constrained by space, time, and fishery to provide added functionality and to address the various needs of the user. Spatial constraints on the extent of the model run or Scenario Actions are applied through the MapRef object and, thus, can be specified by any combination of state or federal waters, LMA, SRA, distances from shore, depth ranges, or within the extent of user-specified polygons. Scenario Actions can be temporally constrained at a monthly resolution, including a portion of a month, mimicking a partial month application. Constraints on affected fisheries can also be specified to apply Scenario Actions to only an individual fishery (e.g. blue crab fishery in Florida state waters) or fishery type (e.g. gillnet, other trap). Multiple constraints can be applied to individual measures and measures can be combined to construct more complex management scenarios. This is especially useful for subsetting spatial areas. For example, combining distance from shore or depth gradients within a region, state, or management area can offer a more practical or precise application of a management scenario.
2.4.1 Effort management
Closures and Gear Reductions are related as two potential fishing behavioral responses to the implementation of a seasonal restricted area. Fishers will either remove their gear from the water (modeled as a Gear Reduction) or relocate their fishing gear outside of the restricted area to continue fishing (modeled as a Closure). In a Gear Reduction scenario, a specified portion of the fishing gear is removed from the water, consequently reducing the number of endlines (Figure 3). In a Closure scenario, where gear is expected to be displaced, fishing gear is redistributed outside the boundaries of the restricted area, but the amount of gear is unchanged so long as there are cells outside of the closure that are available for redistribution for that fishery.
The redistribution of displaced gear follows a simple and generalizable Benefit: Cost algorithm that balances the presumed quality of adjacent fishing habitat with the distance from the restricted area. For adjacent cells to qualify for redistribution of gear, the same fishery must be active in the cell during the time of the Closure, and the cell must be unaffected by other modeled Closures. By requiring that the fishery is active in an adjacent cell for redistribution of effort, the WHALE DST can prevent distribution of effort into cells that are not permitted for that fishery due to regulations or other conflicts. If multiple adjacent cells qualify for redistribution of gear from a Closure, placement is proportional to the density of gear from the affected fishery currently fishing in that cell and month, assuming cells with higher gear density are more suitable because of depth, bottom-type, density of target species, etc. If the fishery is not active in any cells outside of the restricted area, gear cannot be redistributed and is instead removed from the fishery. At this time, the model does not place any limits on the amount of gear that can be fished in a cell, so crowding of gear is not accounted for in this calculation.
The Cost of moving gear from a cell subject to a Closure Scenario Action to any adjacent cell is calculated as a function of the distance between cells as:
Where CostOfMovementc1,c2 is the relative “cost” of moving gear from cell c1 inside the Closure to cell c2 outside the Closure Distancec1,c2 is the distance between cells. The Relocation Cost Exponent (RCE) is a user-specified input that can be used to skew the cost values to influence the redistribution patterns. An RCE greater than one makes it disproportionately expensive to move gear longer distances, effectively causing relocated gear to accumulate around the periphery of a Closure. An RCE less than one makes it less expensive to move gear longer distances such that an RCE of zero would distribute displaced effort directly proportional to the distribution of all gear outside the Closure independent of distance from the Closure.
This Benefit: Cost ratio is then used as a proxy for the appropriateness of moving gear to a given location outside of the closure and the total amount of gear redistributed to a cell is calculated as:
Where GearRedistributedc1,c2 is the amount of gear in cell c1 moved to cell c2, GearDensityc1 is the amount of gear in cell c1 to be moved outside the Closure. Benefit: Costc1,c2 represents the tradeoff for moving gear from cell c1 to cell c2 and n is the number of adjacent cells where gear may be moved to.
Effort Management actions can also involve removing fishing effort by limiting the total amount of gear allowed to fishers. Within the FGFL, the total number of gear, endlines, or duration of fishing soak times by trip, across space, for each fishery is characterized as a distribution of quantiles at unit intervals (GearFishedf,m,q, LinesFishedf,m,q, SoakFishedf,m,q; Table 1). This allows for the calculation of effort (gear) or endline reduction associated with imposing Gear, Line or Soak Duration Caps (Table 2). The reduction in effort is calculated by truncating the quantiles to the assigned threshold and summing across quantiles, then dividing this by the sum across the original quantiles and applying this correction to the original effort level. For example, the WHALE DST models a Gear Cap scenario based on the following equation
where is the density of gear for fishery f in month m, in cell c after applying the Gear Cap Scenario Action, is the baseline density at f, m, c before applying the Gear Cap, is the number of gear fished in quantile q, truncated according to the Scenario Action, and is the number of gear fished in quantile q, without truncation.
2.4.2 Gear configuration management
String or Trawl Length Scenario Actions typically represent a means to reduce endlines in the water by consolidating traps or gillnet panels into fewer trawls or strings with a concordant reduction in endlines, though it is possible to shorten string lengths and increase endlines accordingly. This action assumes that fishers are already fishing all the gear they are permitted or do not otherwise respond by simply fishing more gear. Where gear associated with a fishery is fished in strings shorter than the specified minimum, gear is redistributed across strings such that all strings are the minimum length, decreasing the total number of strings and associated endlines. Similarly, Single Endline Actions specify the threshold in string length below which strings are required to have only one endline rather than two.
2.4.3 Line strength management
In Maximum Vertical Line Strength scenarios, the distribution of rope strengths is truncated to a specified maximum strength smax such that
Output from WHALE DST reports the modified FGFL along with the unaltered DSM and Gear Threat Model to provide an estimate of the change in risk associated with the evaluated Scenario Actions. In addition to relative risk, change in gillnet or trap gear density, endline density, trawl/string density, endline strength, and other metrics of gear configuration are reported in WHALE DST outputs such that spatial and temporal patterns in risk can be traced back to proximal drivers.
2.5 Demonstration of scenario actions
We demonstrate how the WHALE DST can be used to estimate the current or “baseline” spatiotemporal risk landscape and present a case study in quantifying risk reduction through Scenario Actions. The baseline shows the estimated annual gear quantity, number of endlines, relative co-occurrence, and relative risk for the three primary fishery subgroups (Lobster and Jonah Crab Trap/Pot, Other Trap/Pot, and Gillnet) in state and federal waters. For an example set of Scenario Actions, we present the suite of measures implemented under the 2021 modification to the Atlantic Large Whale Take Reduction Plan (86 FR 51970; September 17, 2021) to reduce right whale entanglement risk from the Northeast lobster and Jonah crab fisheries. The 2021 final rule included a variety of management requirements modeled as 37 individual Scenario Actions (Table 3) across all three categories of Action Types (Table 2) throughout the Northeast Trap/Pot Management Region (Figure 2). This rule was the first regulatory amendment that was informed in part by the WHALE DST through an iterative process developed across multiple TRT meetings and stakeholder engagements (Figure 4). Endlines were the only source of risk assessed for the lobster and Jonah crab fisheries and the goal of these measures was to reduce the quantity of endlines and decrease their overall breaking strength, particularly in places and at times where they were most likely to be encountered by right whales. For model runs that combine multiple management actions, it can be informative to run actions or sets of actions separately to understand how individual actions contribute to the combined results. For this example, we examine a separate model run for all Effort Management actions together, all Gear Configuration Management actions together, and all Line Strength actions together. Changes in risk and co-occurrence units from applied Scenario Actions are relative to the baseline FGFL and are therefore expressed in terms of percent reduction. Positive values indicate that the evaluated action(s) reduced risk or co-occurrence by a percent of the baseline total, while negative values indicate an increase in risk or co-occurrence. Maps from model outputs are presented at a lower resolution (10 nm2 [34 km2]) to maintain confidentiality.
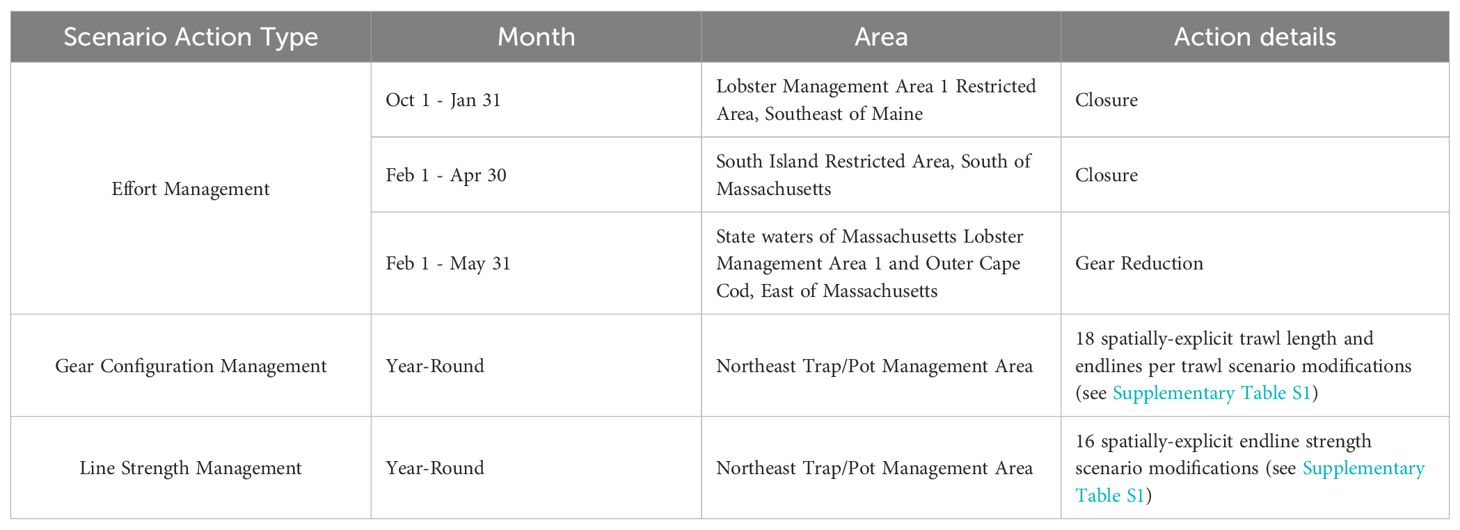
Table 3. Summary of the 2021 Amendment to the Take Reduction Plan. Spatial extent of Effort Management areas are mapped on Figure 7.
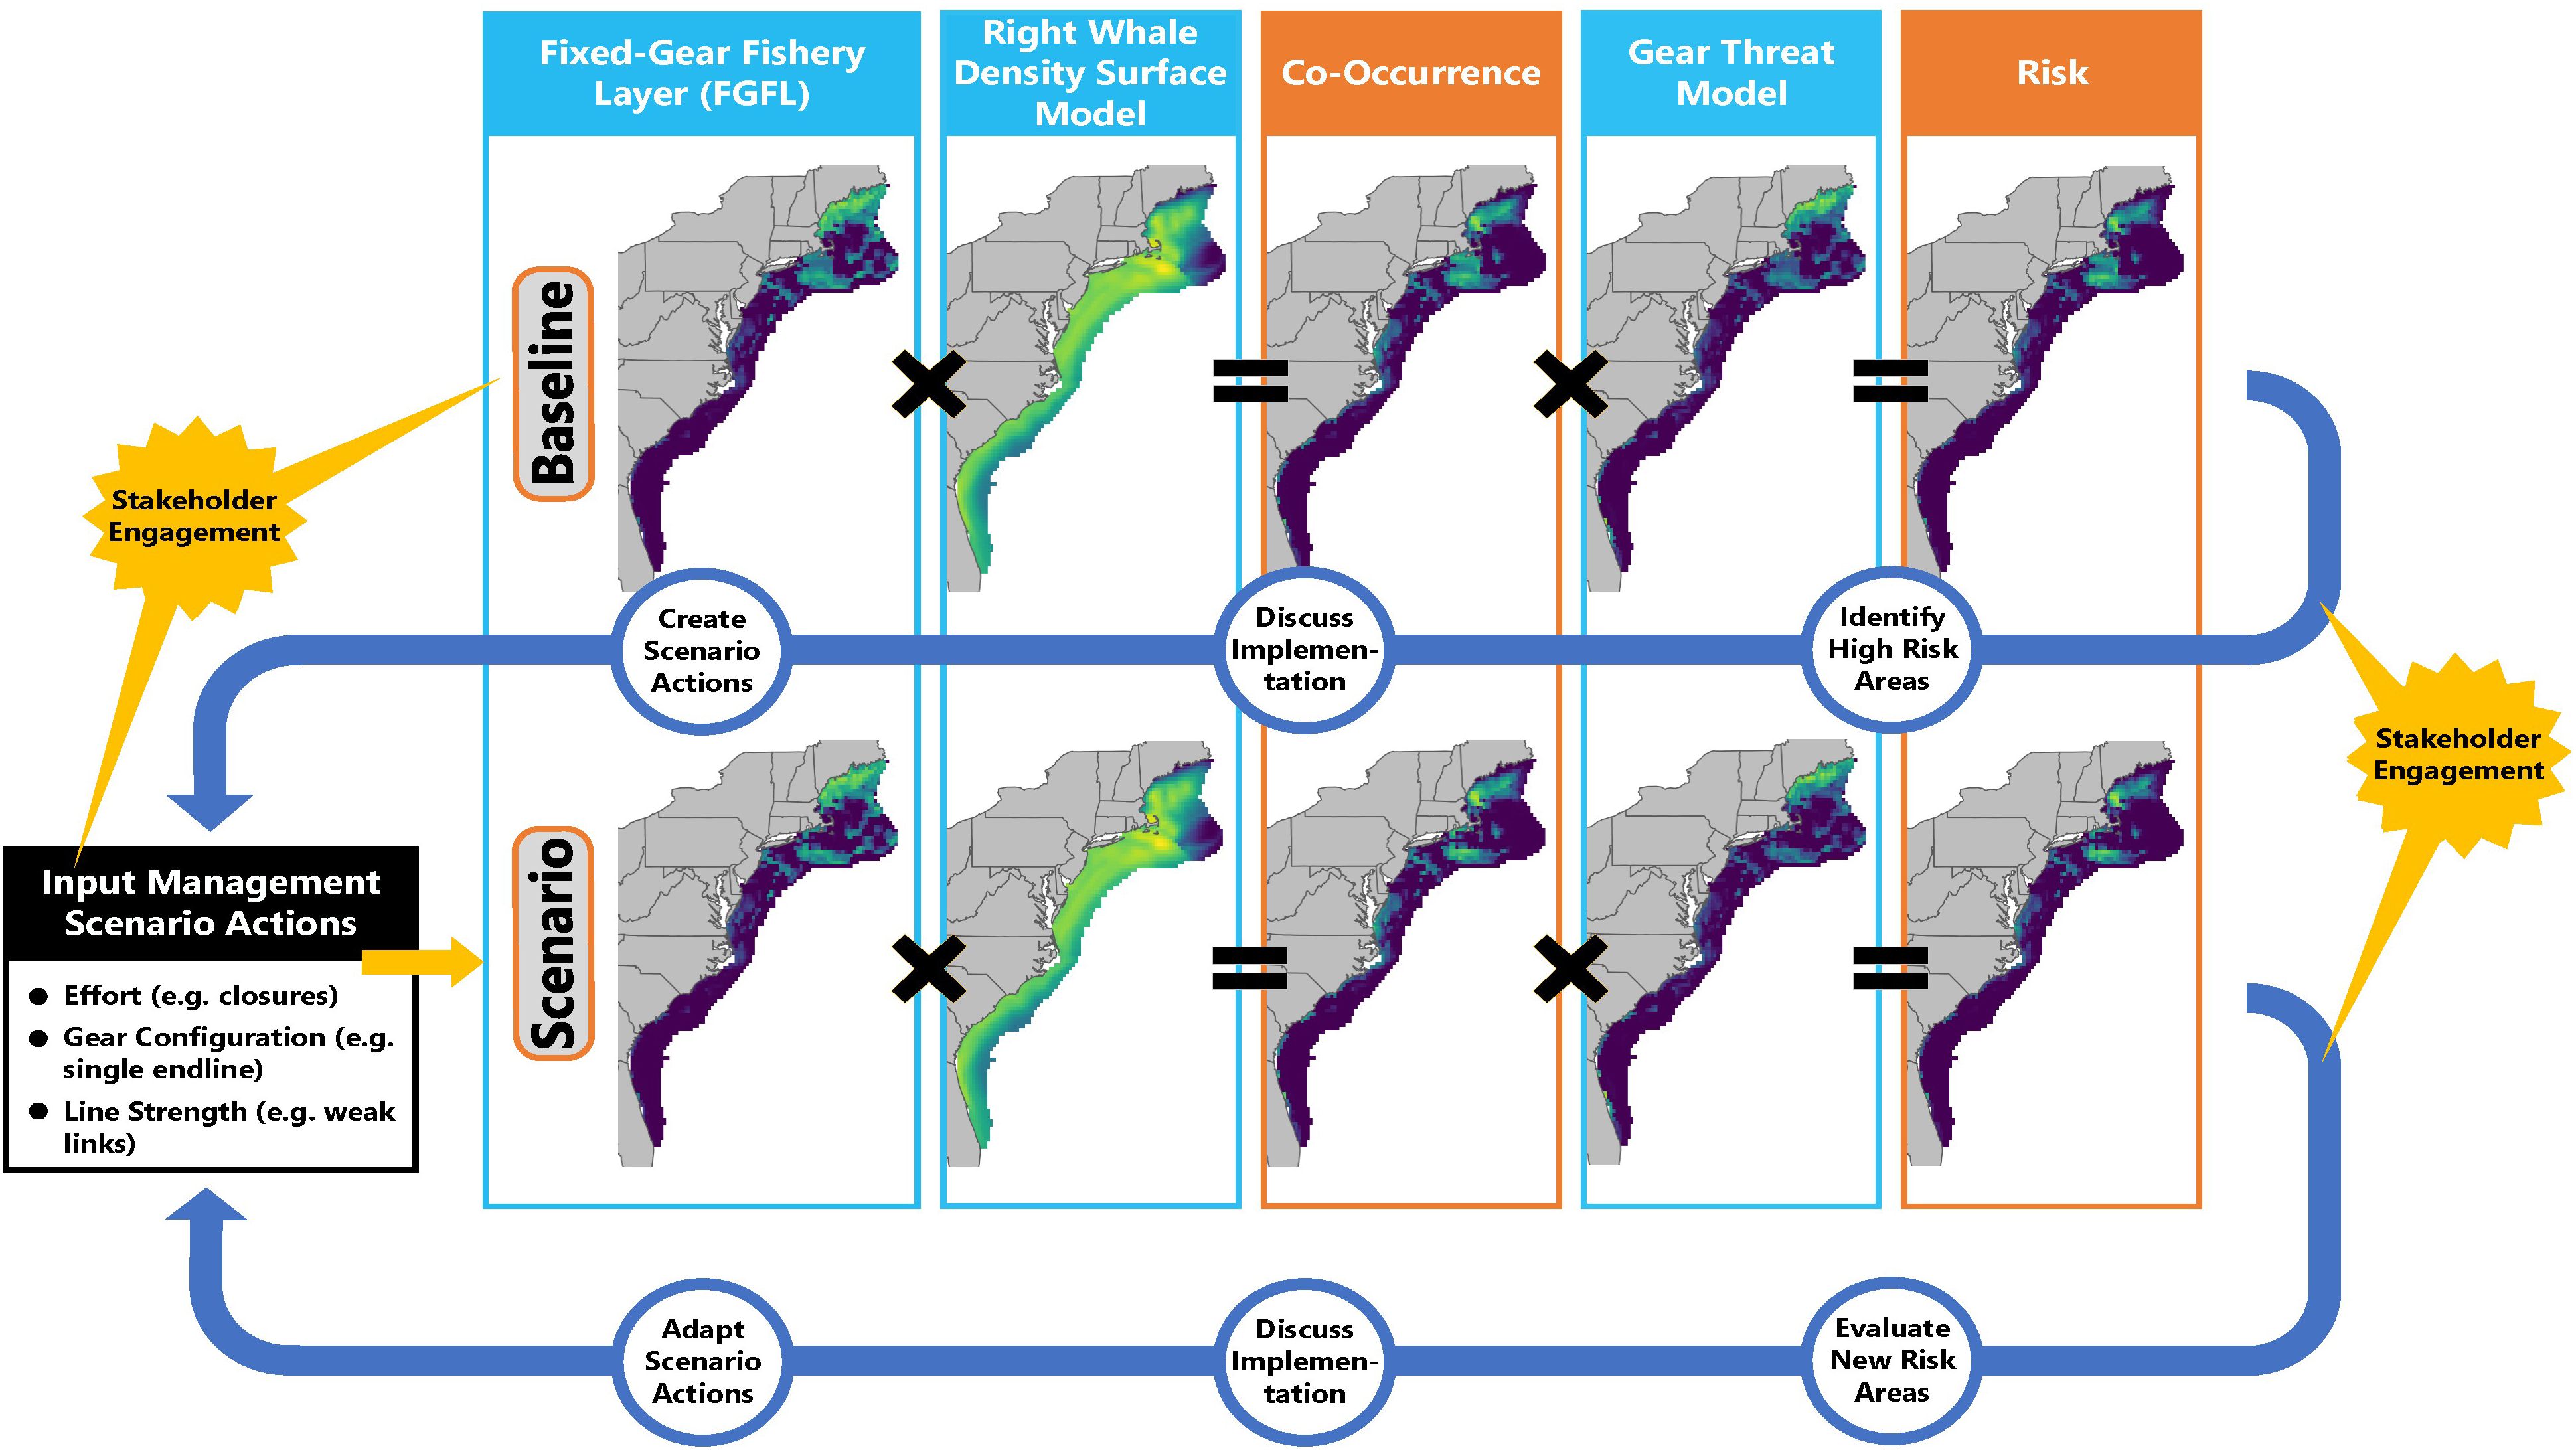
Figure 4. The WHALE DST was designed as a tool to explore management scenarios that encourage open discussion from stakeholders across many disciplines. This schema describes the process in which it can be used in forums like TRT meetings. An initial baseline model run is carried out, calculated as the product of submodels (see Table 1), to determine the level of co-occurrence and risk that currently exists, which serves as a starting point from which to compare candidate management Scenario Actions. One or more management Scenario Actions (black box) are then defined, triggering modifications to the FGFL as a scenario run. Stakeholder engagement and discussion is useful in many parts of the process including development of the FGFL and Scenario Actions as well as in discussions of implementation. Many iterations of the process may occur as these discussions lead to refinements of Scenario Actions.
3 Results
3.1 Baseline risk
The WHALE DST estimated that entanglement risk to right whales posed by fixed-gear fisheries was highest in the Gulf of Maine and Southern New England (Figure 5). Individual model runs by fishery groups indicated that the lobster fishery within state waters represented the highest number of traps and endlines (Figure 6). However, co-occurrence for the lobster fishery in federal waters was higher than the state waters fishery (56% and 39% of the coastwide co-occurrence, respectively) due to greater overlap with right whale habitat. The discrepancy in relative entanglement risk between the lobster fisheries operating in federal and state waters was even greater (64% and 31% of the coastwide relative risk, respectively) due to the use of stronger ropes to haul heavier gear in federal waters. Other trap and gillnet fisheries accounted for approximately 5% of the coastwide risk (2.7% and 2.3%, respectively).
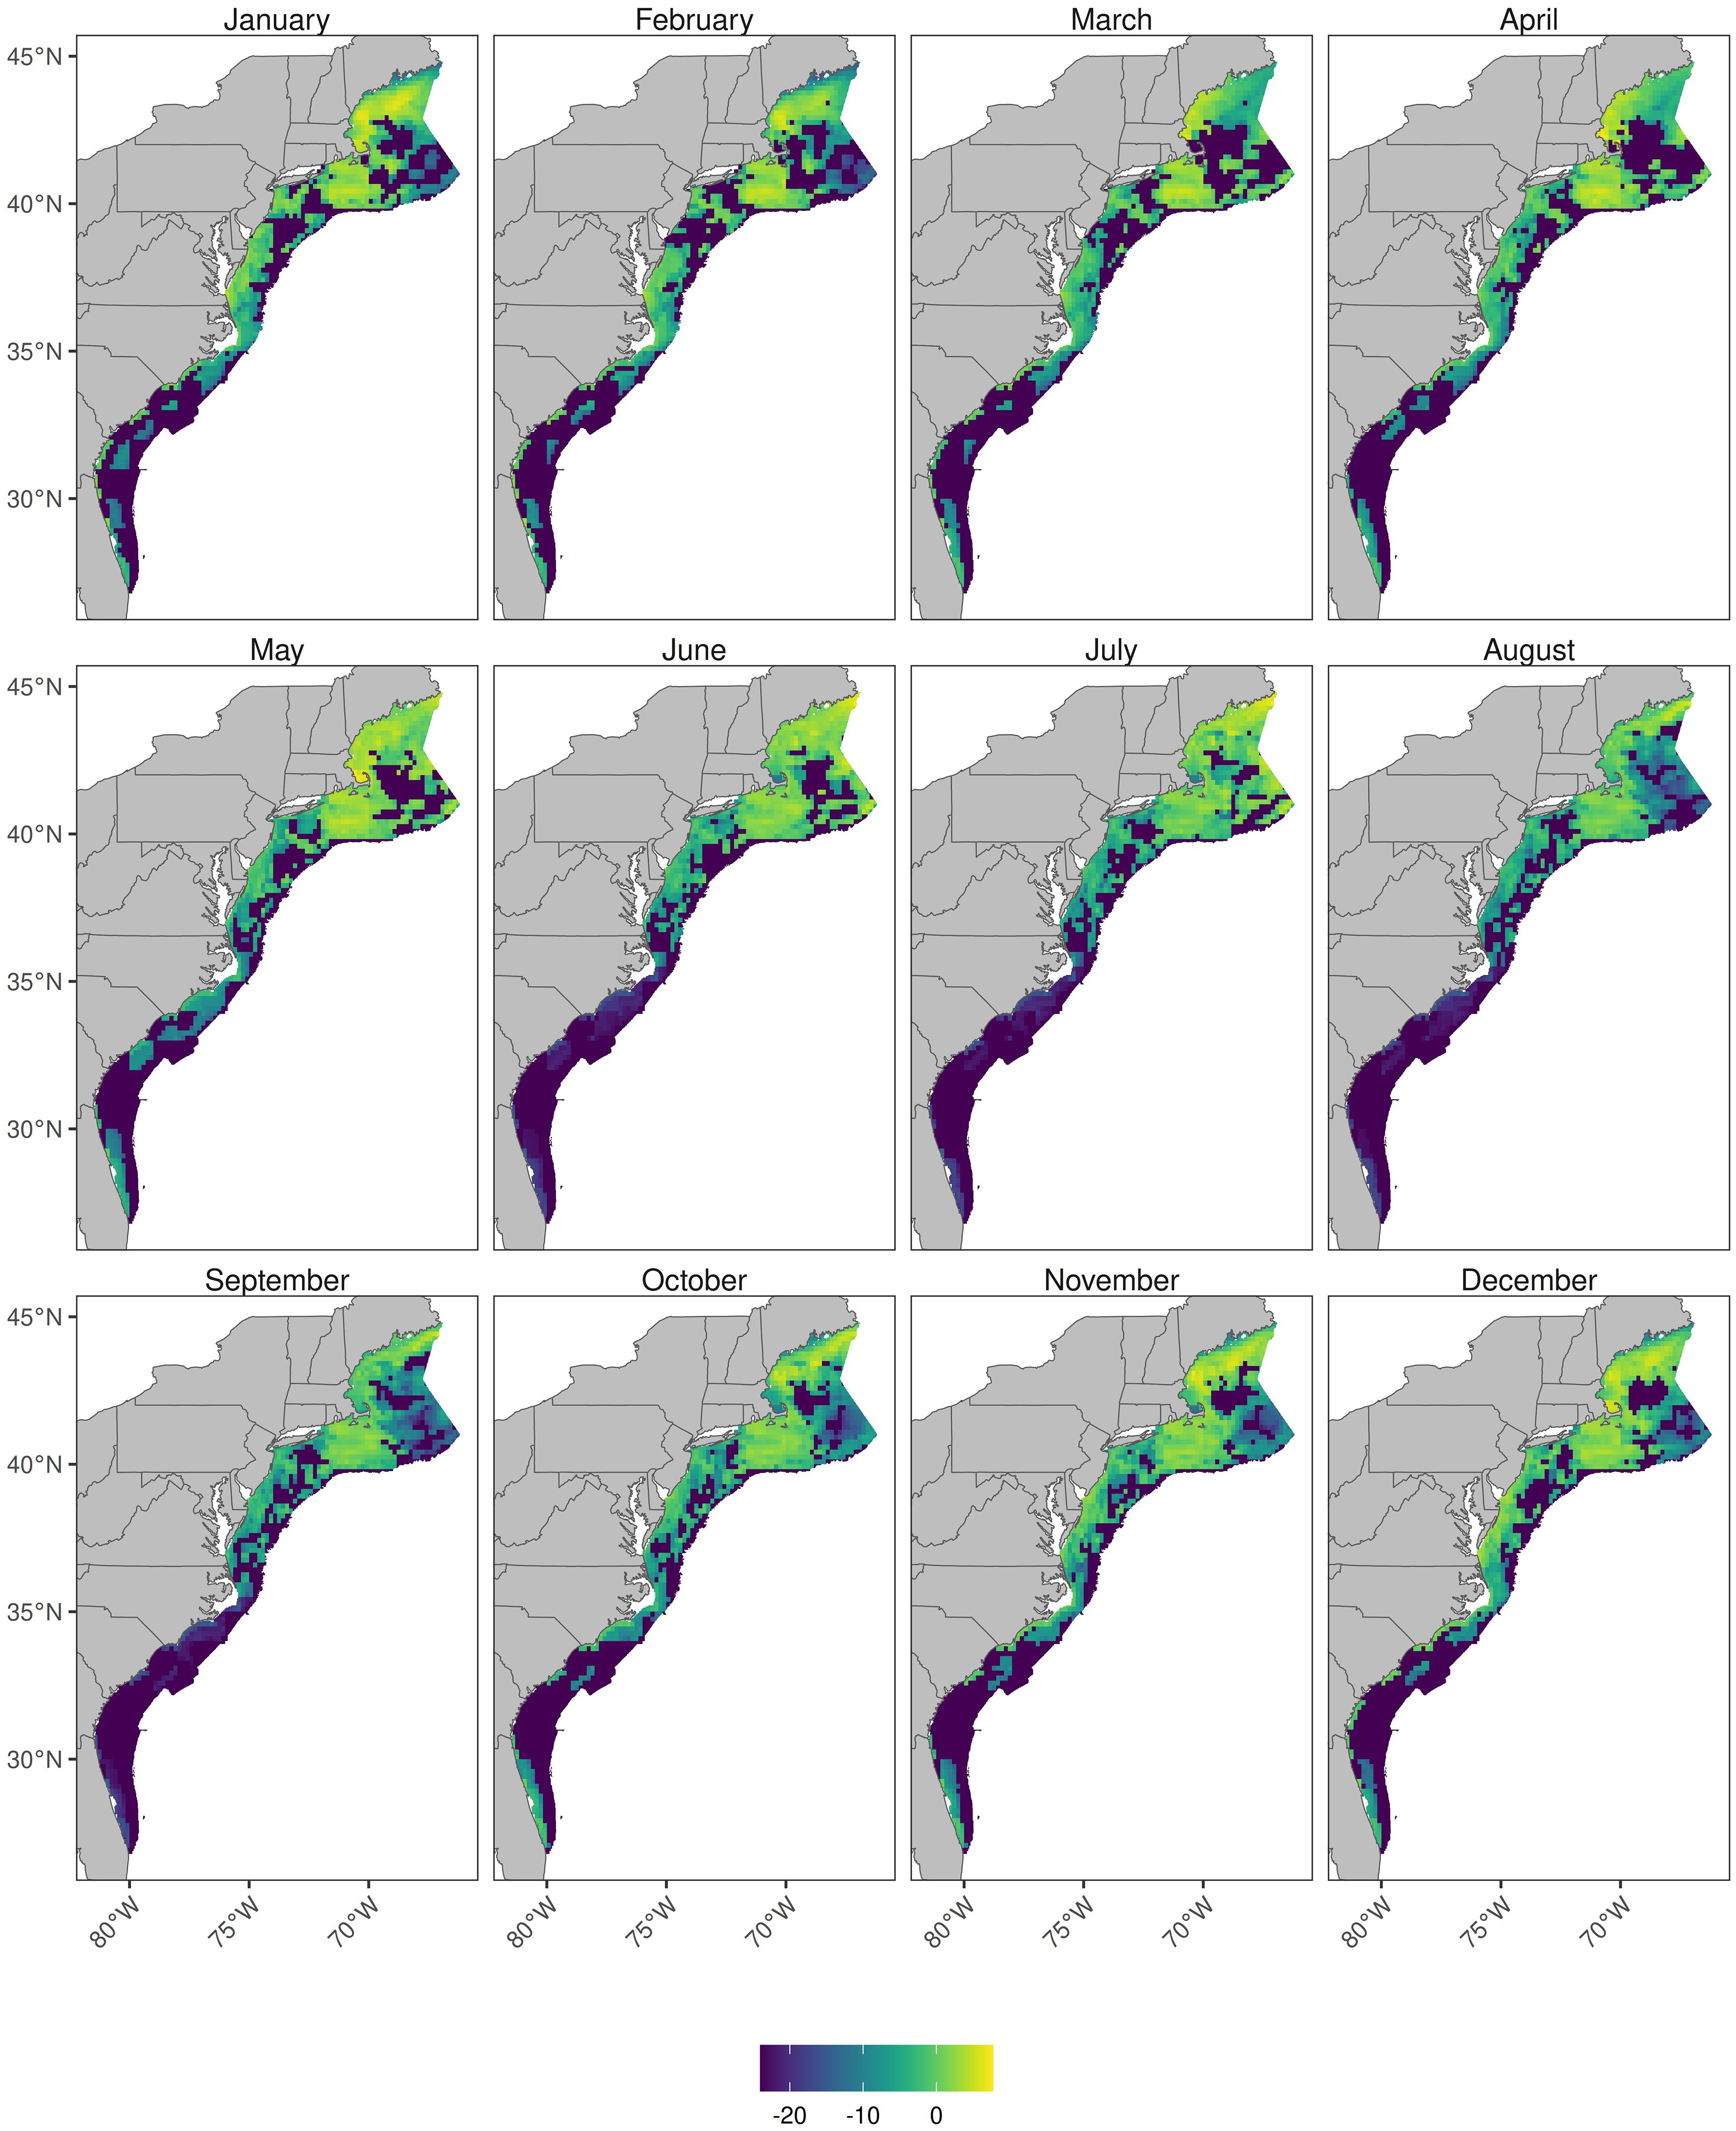
Figure 5. Monthly, log-scaled, baseline risk estimates for the USA east coast. Baseline refers to the risk pre-2021 modification to the Take Reduction Plan. Risk values are aggregated into 10nm2 for confidentiality with dark purple identifying low risk and yellow identifying high risk areas.
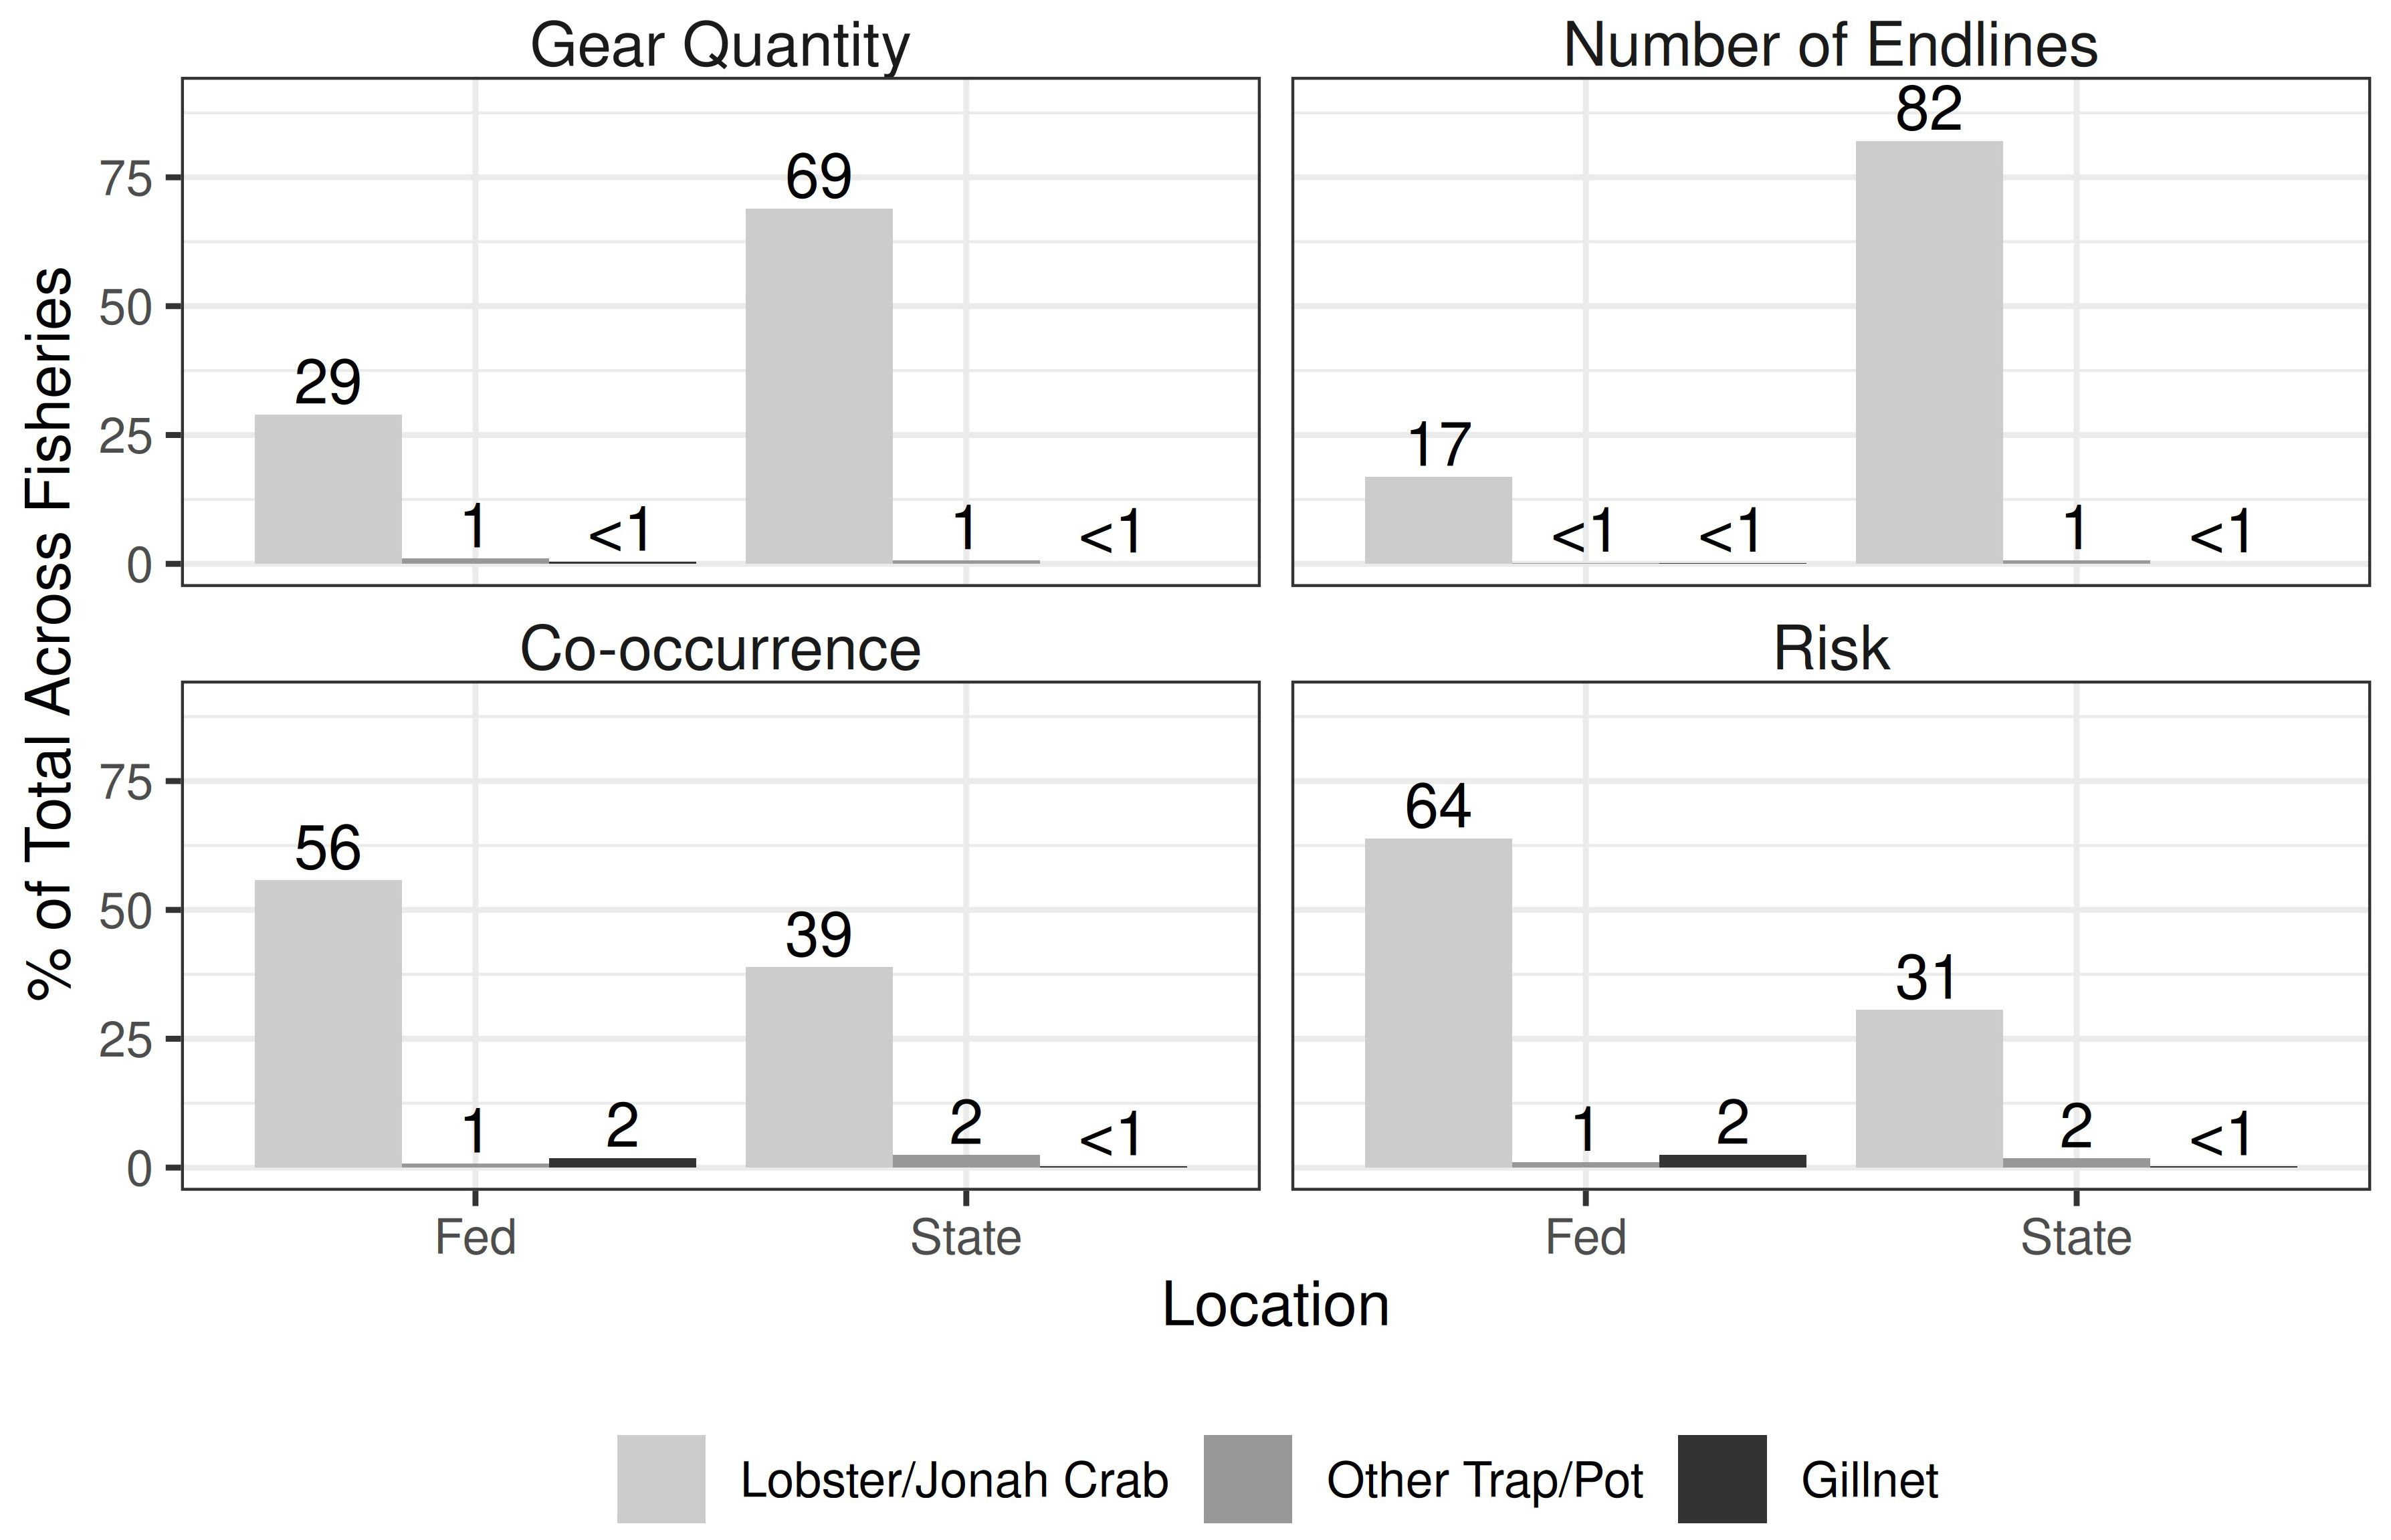
Figure 6. Baseline amount of gear (i.e. traps and nets), number of endlines, co-occurrence, and risk by fishery (lobster and Jonah crab, other trap/pot, and gillnet) for fisheries operating in state and federal waters shown as percent of total coastwide gear, endlines, co-occurrence, and risk.
3.2 Scenario action demonstration
In aggregate, the 2021 management actions were estimated to reduce coastwide gear quantity by 0.9%, the number of endlines by 8.8%, and mean endline strength by 12%, resulting in a 42.9% reduction in co-occurrence and a 47.5% reduction in risk (Table 4). The reduction in co-occurrence and risk was accomplished by removing less than 1% of fishing gear from the water, either by redistributing gear away from whale habitat or re-configuring gear to have fewer or weaker endlines.
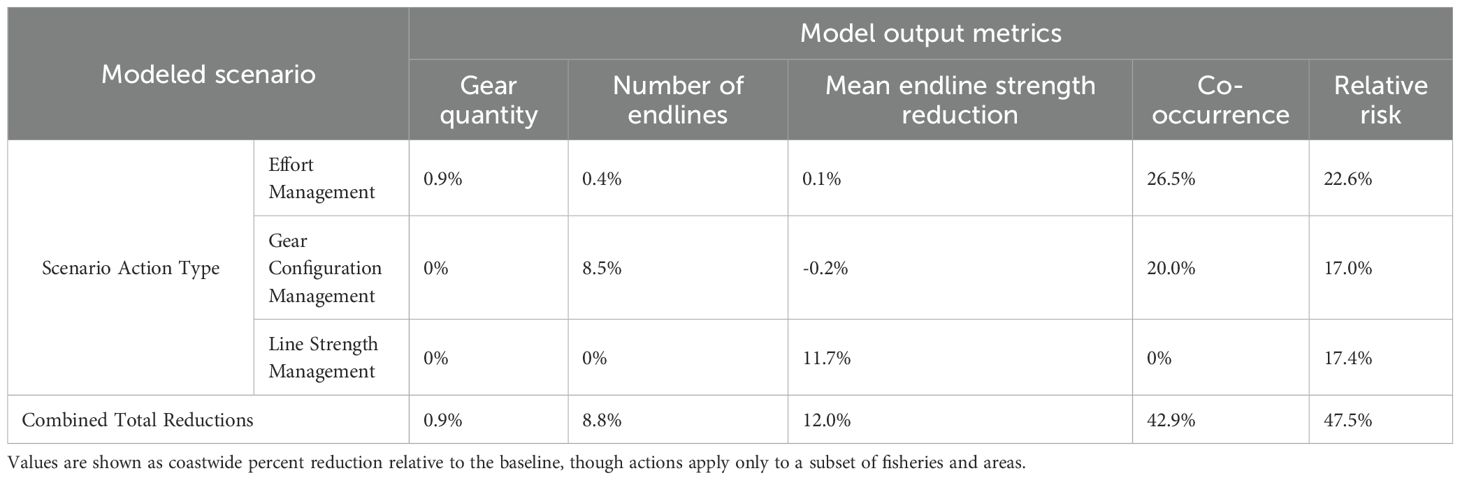
Table 4. Results of applying the 2021 Amendment actions, broken down by scenario action type as well as the combined results of these actions.
Individually, the Effort Management actions were estimated to reduce gear quantity by 0.9%, and number of endlines by 0.4%. Most of this gear and endline reduction was attributed to the Massachusetts Restricted Area, which was treated as a Gear Reduction because much of the gear historically fished in this area cannot be redistributed to adjacent areas. For the LMA 1 Restricted Area and South Island Restricted Area Closures, most of the gear and endlines were preserved in the fishery via redistribution to adjacent cells. The model predicted that gear affected by the LMA 1 Restricted Area would redistribute inshore and south, while the gear displaced by the South Island Restricted Area would shift to the east and west of the Closure (Figure 7). Effort Management actions also affected mean endline strength, which decreased by 0.1% because the model, by default, assumes that redistributed gear conforms to the gear configurations common to the new location. In this case, one can infer that some of the redistributed gear is reconfigured into shorter trawls with lower-strength endlines. Ultimately, the Effort Management actions reduced co-occurrence by 26.5% and relative risk by 22.6%.
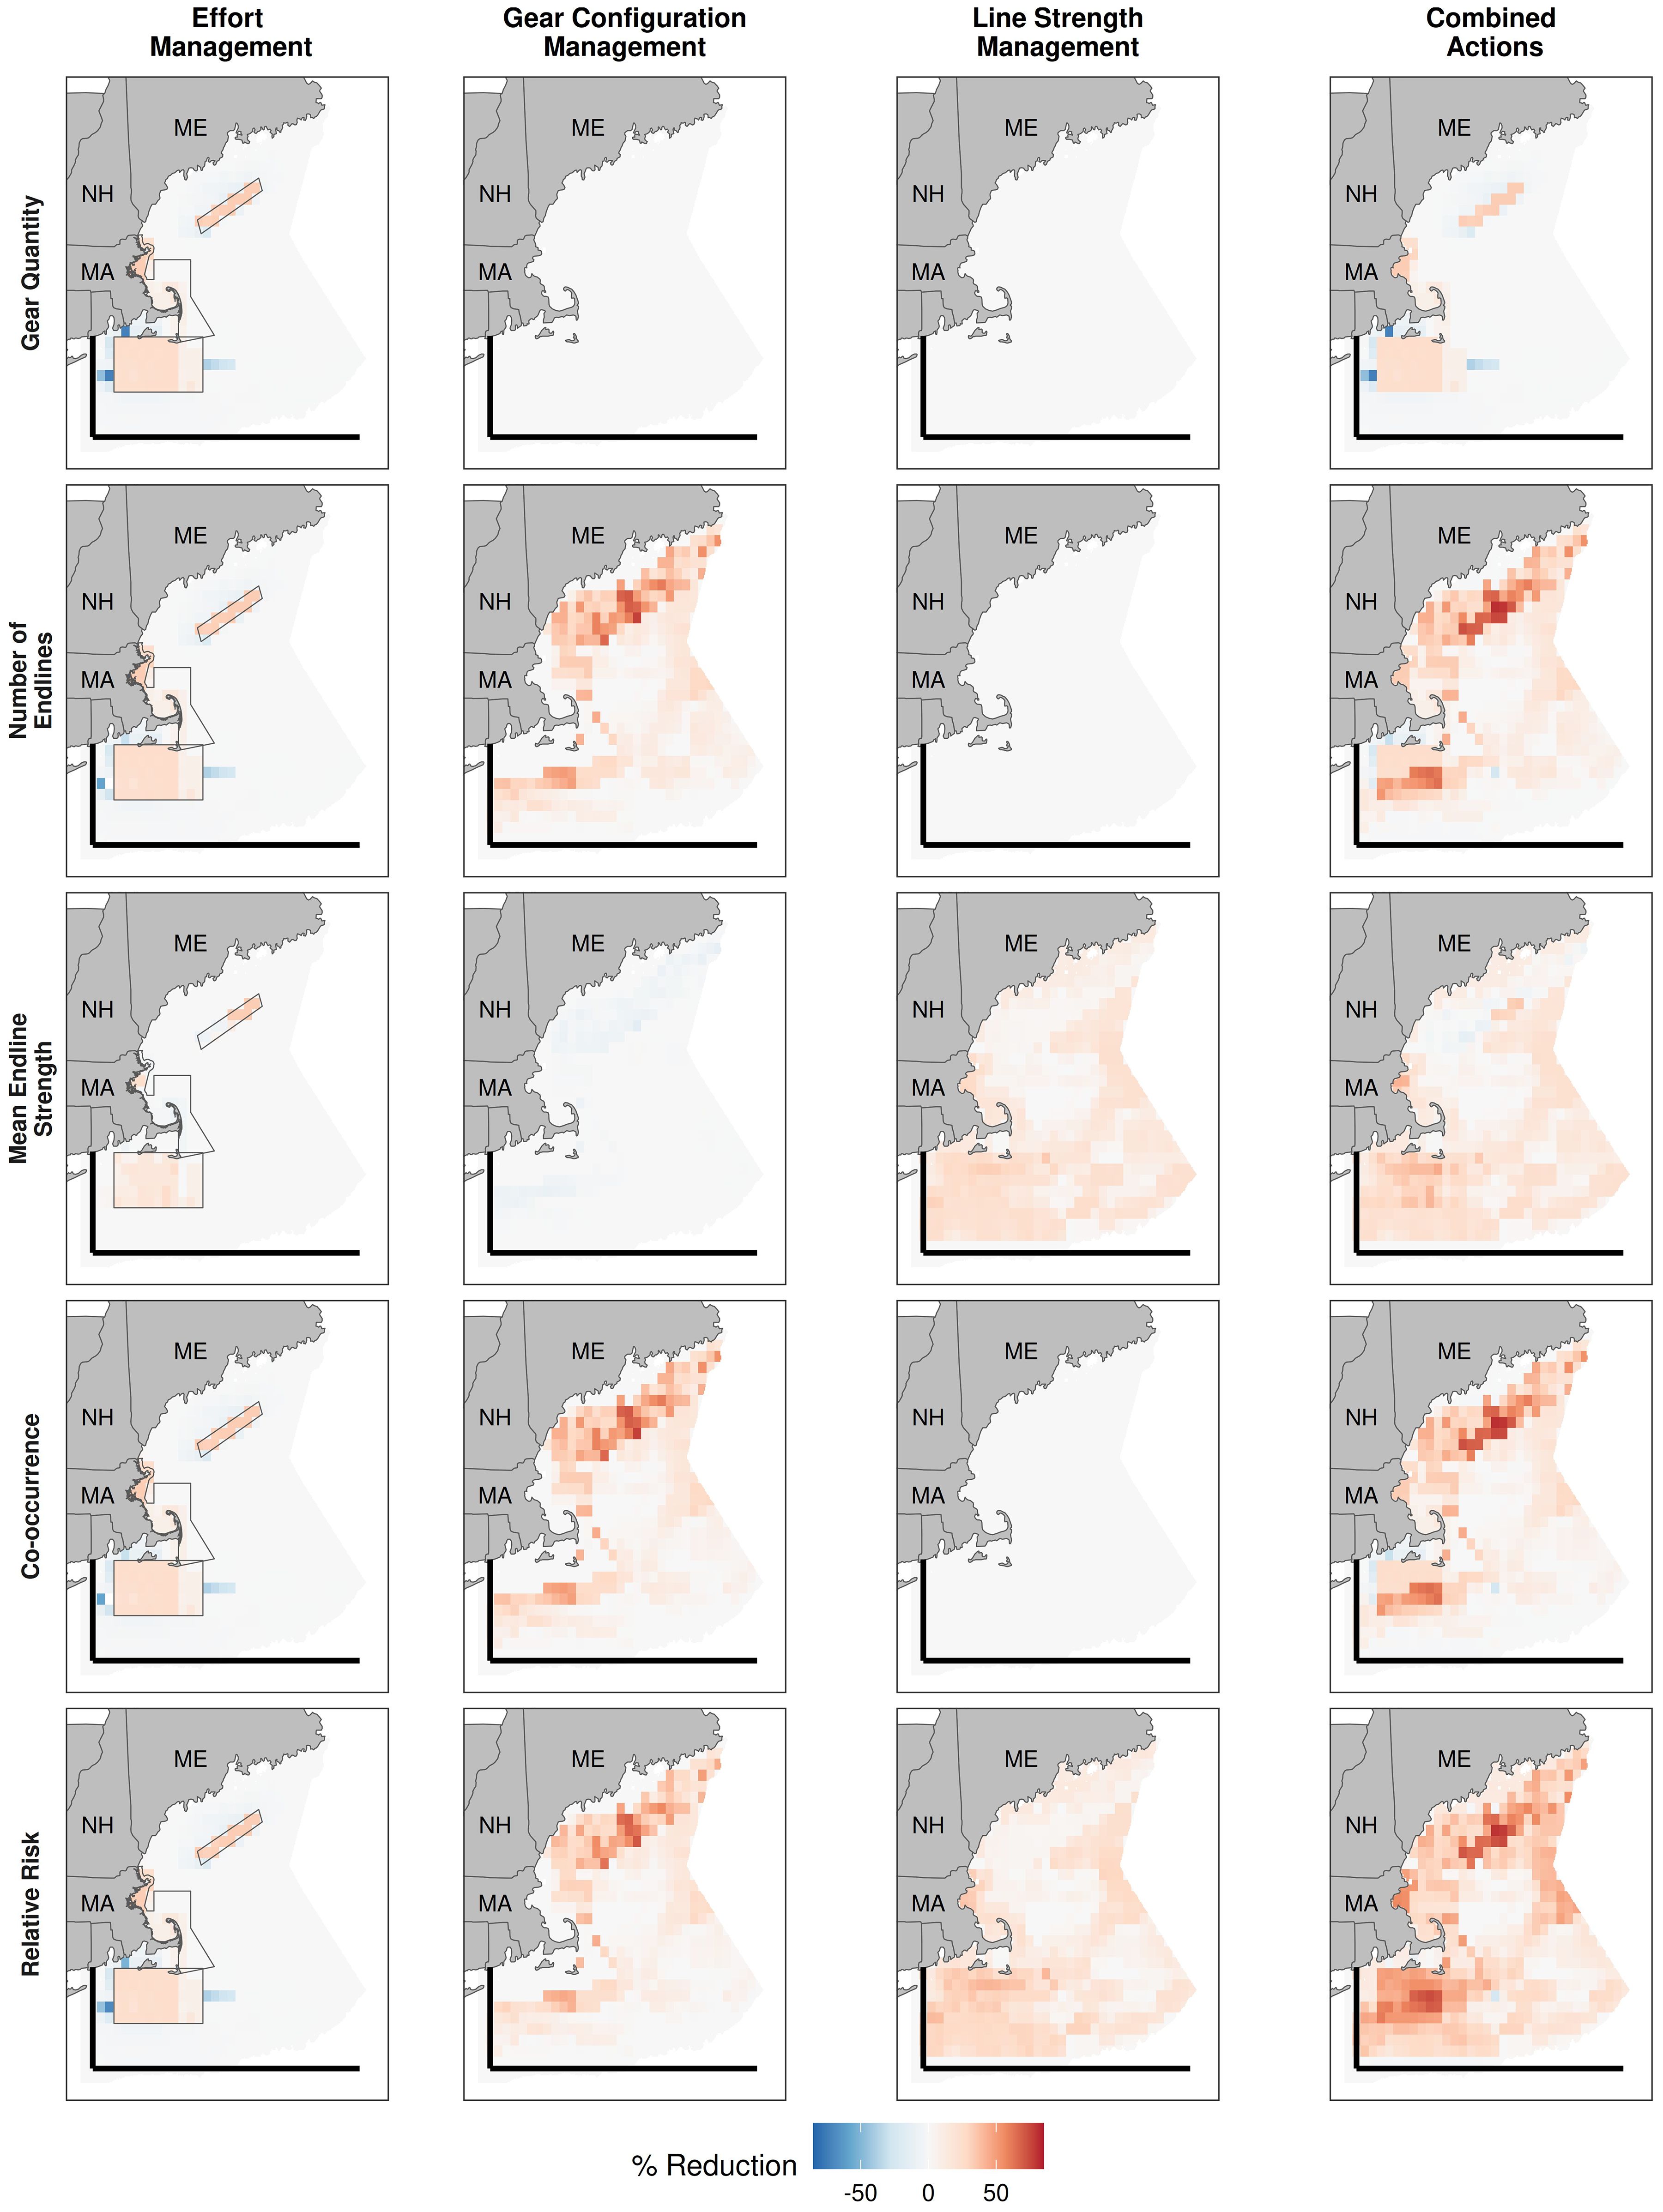
Figure 7. Changes in gear quantity, number of endlines, mean endline strength, co-occurrence, and relative risk, summed across months, estimated from management actions from the 2021 Amendment to the Take Reduction Plan, grouped by Scenario Action Type (Effort Management, Gear Configuration Management, and Line Strength Management). The thick black lines indicate the southern and western boundary within which all 2021 management actions were enforced, primarily affecting waters off Maine (ME), New Hampshire (NH), Massachusetts (MA), and Rhode Island. Restricted area boundaries are present on maps where Effort Management actions were implemented. Note that values are shown as percent reduction from the baseline with red values indicating reductions in the metric (e.g. lower quantity of gear than the baseline), and blue values indicating increases in the metric (e.g. higher quantity of gear than the baseline).
Gear Configuration Management actions reduced endline density by 8.5% by configuring traps into fewer trawl with more traps per trawl resulting in no associated reduction in gear quantity. Longer trawls, by default in the DST, were expected to be associated with stronger endlines, resulting in an estimated 0.2% increase in coastwide mean rope strength. Because the Gear Configuration Management actions were principally focused on areas with higher whale densities, the 8.5% reduction in endlines resulted in a 20% reduction in co-occurrence and a 17% reduction in relative risk.
Endline Strength Management actions have no effect on quantities of gear or endlines and therefore, don’t affect co-occurrence with whales. However, the model estimated an 11.7% reduction in mean endline strength, reducing entanglement risk by 17.4%.
When combined into a single scenario, multiple actions that overlap in time and space can alter the value of individual actions by affecting calculations downstream in the model (Figure 3). For example, an endline that is removed by a closure will not produce further benefits by weakening the endline through another action. This is particularly evident in the co-occurrence and relative risk calculations in Table 4. Combined, the Effort and Gear Configuration Management actions result in a 42.9% reduction in co-occurrence but, individually, sum to 46.5%. Similarly, total risk reduction with the actions combined comes to 47.5% while the actions, individually, sum to 57%. This accounting for overlap in proposed actions is one of the benefits of a DST of this sort, where overlaps and interactions of multiple management actions can become difficult to track without an integrated model.
4 Discussion
A common application of decision support tools is to help find solutions to problems while minimizing negative impacts. From its inception, a goal of the WHALE DST has been to decrease whale entanglement risk while maximally allowing fixed-gear fisheries to continue operating. The 2021 management actions assembled by the TRT provide a successful demonstration of how the tool meets this goal in practice. For the seasonal closure actions, the difference in magnitude between the amount of gear affected and the resulting risk reduction suggests that the closures were appropriately placed in areas of high whale density such that minimal gear was removed from active fishing and the remaining affected gear was redistributed to locations with lower whale densities, marginally increasing co-occurrence and risk adjacent to the closures. This resulted in a significant reduction in entanglement risk while impacting a comparatively small portion of the coast-wide fisheries. The remaining measures, changing gear configurations and endline strengths resulted in considerable risk reductions without directly affecting when, where or how much gear was fished but still may have affected fishing operations. Some industry members expressed concerns that the Gear Configuration and Line Strength measures would decrease the efficiency of fishing operations by requiring trawl lengths that were not optimal for fished habitats, thereby slowing fishing operations, as well as creating safety hazards by requiring vessels to fish longer strings of gear with weaker ropes. Impacts to operational efficiency are still under study. However, stock assessment models do not detect significant declines in exploitation (Atlantic States Marine Fisheries Commission, 2025), indicating that the harvest rates of the fisheries subject to these actions since 2021 were not substantially constrained.
With the ability to model complex management scenarios that overlap in space and time, the WHALE DST offers an innovative approach to compare management measures in collaboration with multiple stakeholders as a core component of multi-party, stakeholder-based conservation. Development of the DST stemmed from the difficulty in comparing alternative packages of management measures during TRT deliberations without the ability to estimate their relative benefit to right whale conservation. These packages frequently consisted of dozens of diverse, spatially- and temporally-explicit management measures, making it difficult to estimate and compare the aggregate risk reduction in an open discussion setting. This DST provides stakeholders and resource managers with a method to quantify these measures for comparison and discussion while providing spatial maps to understand where risk is predicted to remain after a scenario is implemented, particularly as the complexity of scenarios increases. Stakeholders and managers may go through many adjustments to their list of Scenario Actions and interpreting results often requires careful discussion. For example, an area of low gear density but high whale density may represent a risk similar to an area with high gear density but low whale density. However, actions to reduce this risk have different potential to impact industry and may be handled accordingly. In the former case, it may be preferable to enact measures that remove the gear, fully protecting an aggregation site, while in the latter case it may be preferable to modify the gear, realizing some conservation benefit and allowing continued fishing in place. Where there was debate or disagreement over the tool’s valuation of an action, the capacity to trace model results back through component inputs to actual data and identify the components that were driving model results was critically important for building confidence in the model and identifying biases that could be corrected or accounted for accordingly. Further, when used in live meetings like the TRT, the relative effectiveness of various actions could quickly be informally assigned to low-, medium-, or high-impact options and minor changes to such actions were unlikely to change this valuation.
The general method of modeling the spatial and temporal co-occurrence of a protected species and a source of anthropogenic mortality is common for examining current risks and project outcomes from future management actions. Farmer et al. (2016) used co-occurrence models to project management alternatives for black sea bass (Centropristis striata) to reduce entanglement risk for North Atlantic right whales off the southeastern USA. Cole and Brillant (2025) performed a retrospective analysis of the outcomes of seasonal closures of the southern Gulf of St. Lawrence snow crab (Chionoectes opilio) fishery for mitigating North Atlantic right whale entanglements in Canada. Feist et al. (2021) and Riekkola et al. (2023) provides a similar analysis on the effects of environmental variability and effort reduction, respectively, on whale entanglement risk from the Dungeness crab (Metacarcinus magister) fishery on the USA West Coast. Finally, Blondin et al. (2025) developed a model for assessing risk of ship strike for right whales on the USA east coast, both to define the existing landscape of mortality risk and the potential for mitigating mortality through decreasing vessel speeds. Here, we’ve used this DST to describe baseline entanglement risks and project the impact of management measures but we also anticipate using this tool in the future for retrospective analysis on the effects of management measures, market disruptions, and shifting species distributions on entanglement risk.
The development of this DST as part of a multidisciplinary and multi-interest forum has fostered communication among stakeholders beyond the state and regional level, an indirect benefit of DSTs that is often overlooked (Gee et al., 2019). The integration of critical stakeholder knowledge is an important area for future improvement within MSP (Pinarbaşi et al., 2017), and the WHALE DST incorporates this by design (Figure 4). The process in which NMFS convenes a multi-stakeholder TRT to inform decision making has provided a forum for learning and open conversation that extends beyond management decisions. The open process is important for improving learning opportunities, exchanging perspectives, and trust-building, particularly for commercial fishers who are most directly affected and have typically shown more skepticism of MSP (Ciolek et al., 2018).
While the current version of the DST has been useful for comparing the estimated change in entanglement risk reduction coincident with alternative management actions, quantifying uncertainty in risk estimates is a challenge for this model, which should be considered in setting expectations when the model is used to inform management. A difficulty associated with quantifying uncertainty is that the estimate of uncertainty is dependent on the question being posed and a variety of questions may be posed to a decision tool of this sort. In general, most questions posed to this model fall into one of two cases: (1) Where is risk currently occurring? and (2) How would future risk be affected by management measures?
In the first case, examining where and when entanglement risk is currently occurring, the goal is to understand what factors are contributing to entanglement risk and where risk is likely to occur in the future. Quantifying uncertainty in this case primarily involves understanding how accurately the distribution of fishing effort and whales can be modeled in space and time given available data and how fishing effort and whale distributions vary across years. Here, it is important to recognize that, because this DST is intended to encompass all entanglement risk for fishing gear on the USA East Coast, the risk estimate for a place and time is only relative to other estimates in space and time and uncertainty at any place and time cascades into uncertainty in all other places and times. For example, a revision to the model inputs that increases fishing effort or whale density at one place results in decreasing the relative risk at all other places. Given the heterogeneity of fisheries included in this model with associated varying rates of reporting, spatial resolution of fishing effort, and available information on fishing gear configurations, simply quantifying uncertainty in where fishing is occurring and how gear is fished would entail a full simulation study. Similarly, estimating uncertainty in whale distributions in space and time is a multifaceted challenge (Miller et al., 2022), given the diversity of data informing the whale DSM, the complexities of distance sampling and density surface modeling, and the availability of environmental predictor variables to include in the models (Roberts et al., 2024). Thus, quantification of uncertainty in baseline risk will be a significant undertaking involving multiple studies.
The second case, asking how risk could be reduced by management measures, is useful for understanding risk mitigation and potentially informing future regulatory actions but entails an added level of complexity. As the DST is currently used, the future risk map is assumed to be the same as the most recent risk map, based on the most current data and methods available. However, both trends and fluctuations in environmental conditions affect the distributions of whales and species targeted by fisheries, both of which actively adapt to changing conditions, and other external factors influence the distribution of fishing effort of different fleets. Thus, there is the complication of projecting risk into an uncertain future.
Additionally, uncertainty around the impact of management measures involves estimating implementation error or uncertainty in how fishermen may react, individually and collectively, to new regulations that affect their fishing options (Wilen et al., 2002; Salas and Gaertner, 2004; Abbott and Haynie, 2012). This uncertainty is currently not captured in the WHALE DST, which assumes simple responses to modeled management actions, without accounting for complex, emergent, or varying behaviors that fishers may exhibit in reality. For example, fishers who are seasonally excluded from a closed area may opt for moving gear the minimal distance that allows continued fishing, moving further from the area to seek better habitat, or ceasing fishing if they are unable to move their gear to a viable alternate location or have alternate opportunities for income. Assessing implementation error for other types of management actions are similarly complex. A portion of implementation error and uncertainty can be offset through consultation with the fishing industry, where participants and experts can provide perspectives on how fishers are most probable to respond and mirroring this behavior in the model. It would be beneficial to better incorporate behavioral models of fishers into the decision tool to quantify implementation error, but we recognize that accurately predicting these outcomes will always be complex.
Work is currently underway to better understand and address sources of uncertainty in the WHALE DST. Miller et al. (2025) provided an example of how the risk associated with a fishery is sensitive to the available spatial resolution of fishing effort data. Miller et al. (2022) developed methods for building alternate whale distribution inputs based on parameter uncertainty in density surface models and Solinger et al. (In Prep) is using these inputs to examine how uncertainty in the whale distribution model contributes to uncertainty in risk reduction around spatial closures. Finally, the next version of the WHALE DST and associated inputs will provide separate fishery and whale inputs for each of the recent years, allowing for exploration of past interannual variability and trends in entanglement risk, which may help inform how risk varies around some mean level across individual years.
Similar to addressing uncertainty, validation of risk assessment tools is important for scientific rigor and effective management and can be considered from the perspectives of accuracy and utility. Here, accuracy concerns if the tool correctly identifies the sources of entanglement risk and if the tool correctly captures how entanglement risk changes in response to new regulations. For the North Atlantic right whale, validating the sources of entanglement risk are challenging due to the low frequency at which entanglements are observed. Only about 36% of right whale mortalities are observed and, while a large proportion of those are attributed to entanglement, gear retrieved from these entanglements can very rarely be traced back to the fishery or location where the entanglement occurred (Pace et al., 2021; Saez et al., 2021). Thus, we may expect that data for validating the capacity of the DST to identify the source of entanglements will continue to be sparse for the foreseeable future. However, the suite of measures implemented in 2021 do provide an opportunity to validate how well the DST can project changes in risk due to new management measures. As the next version of this model will capture the risk landscape annually over more than the past decade, estimates of entanglement risk before and after implementation of these measures, accounting for underlying temporal trends, have the potential to examine how well the model captures the effects of the new measures and compare this to the effect that the model projected ahead of implementation.
The formal process of constructing a risk assessment model can aid in identifying important knowledge gaps. In the case of assessing whale entanglement risk, the development of this DST highlighted the need to understand what factors lead to serious entanglements once whales are in proximity to endlines. The current threat model in the WHALE DST attributes threat to endlines based only on line breaking strength, not because this is the only important factor that determines entanglement threat but because there was evidence that line strength was a contributing factor to entanglement severity and data were available on line strengths used by the fishing industry. We expect that there are other factors that contribute to threat including the tension on the lines, how heavily the lines are anchored by the gear, and spatial variations in whale characteristics (e.g. age, sex, health) and whale behavior (e.g. surface feeding, diving, transiting). However, these are not currently included in the model because there is either a lack of knowledge of how these factors contribute to entanglement risk or a lack of data to allow modeling the spatial and temporal variations in these factors. Additionally, the WHALE DST includes a module not presented in this study that incorporates the potential for whales to become entangled in the gear and lines along the bottom in addition to the vertical endlines. This module is an area of active development and introduces additional sources of uncertainty, including water depth, location, and area occupied in the water column by fishing gear, and the vertical distribution of whales coincident at the location of that gear. Identification of such model assumptions and knowledge gaps, combined with pressure to continue improving these models, can be valuable for directing resources towards targeted research.
Many multi-criteria decision analysis tools compare alternatives through scoring or ranking. Our quantification of risk as a relative metric allows a dynamic use of the tool with the flexibility of altering the spatial extent of scenario runs and applicable fisheries while maintaining a singular unit structure that allows comparison and ranking across alternatives. Having a singular unit of relative risk to compare the contribution of modeled Effort Modifications and Line Strength Modifications, for example, allows for a direct comparison that would otherwise be difficult given that the effect of the former is to make entanglements less probable and the latter is to make entanglements less lethal. However, giving dissimilar measures comparable outcomes potentially fails to account for how these measures achieve the outcome, in this case the benefits of entanglement prevention over severity mitigation.
The capacity for DSTs to evaluate and quantify anthropogenic impacts across spatial and temporal scales, as well as their generalizability, accessibility, and scalability makes them useful for Marine Spatial Planning and Ecosystem Based Management (Bagstad et al., 2013). A model’s modular nature can allow for other sources of risk and species habitat models to be used as inputs, making it flexible to many applications. Within our team, we have found applications of this model for assessing impacts to other protected and endangered species, spatial conflicts with mobile gear fisheries, and direct and indirect impacts of offshore wind energy and aquaculture development as well as contributing inputs to other models (Pirotta et al. In Press). One could anticipate such tools contributing to other anthropogenic impact models including benthic habitat impacts (Smeltz et al., 2019; Poulton et al., 2023; Zaleski et al., 2024), and fisheries management (Poulton et al., 2023) and it is useful to consider how these modular model components could be standardized for interoperability.
The WHALE DST continues the advancement of models and decision tools developed to describe current ocean use and simulate how modifying those activities in time, space, and nature can potentially mitigate protected species interactions. While the spatially explicit nature of the WHALE DST is one of its greatest strengths, it goes beyond describing spatial and temporal overlap, expanding into the methods of ocean uses to examine how a variety of actions and modifications to those methods may contribute to sustainability targets. Using this tool to evaluate how management actions, both individually and in tandem, contribute toward right whale entanglement risk reduction demonstrates the flexibility of the tool and how it can provide context to stakeholders and decision-makers as they evaluate both fishery impacts and contribution to sustainability targets.
Data availability statement
The data analyzed in this study is subject to the following licenses/restrictions: Confidential fishing activity data submitted to the US federal government (NMFS). Requests to access these datasets should be directed to bm1mcy5nYXIuZ2FyZm9Abm9hYS5nb3Y=.
Author contributions
BS: Conceptualization, Data curation, Formal Analysis, Investigation, Methodology, Software, Writing – original draft, Writing – review & editing. AM: Conceptualization, Formal Analysis, Investigation, Methodology, Software, Visualization, Writing – original draft, Writing – review & editing. LS: Conceptualization, Formal Analysis, Investigation, Methodology, Software, Visualization, Writing – original draft, Writing – review & editing. MA: Conceptualization, Funding acquisition, Investigation, Project administration, Supervision, Writing – original draft, Writing – review & editing. DS: Formal Analysis, Investigation, Methodology, Software, Writing – review & editing. AH: Formal Analysis, Investigation, Methodology, Software, Visualization, Writing – review & editing. MT: Conceptualization, Formal Analysis, Investigation, Methodology, Writing – review & editing. CF: Investigation, Writing – review & editing. JR: Conceptualization, Formal Analysis, Methodology, Software, Writing – review & editing. JW: Methodology, Software, Writing – review & editing. AP: Formal Analysis, Investigation, Methodology, Software, Writing – review & editing. MD: Formal Analysis, Investigation, Methodology, Software, Writing – review & editing. CC: Conceptualization, Investigation, Methodology, Project administration, Supervision, Writing – review & editing. JG: Investigation, Supervision, Writing – review & editing. TC: Data curation, Investigation, Validation, Writing – review & editing. SH: Conceptualization, Investigation, Funding aquisition, Project administration, Supervision, Writing - review & editing.
Funding
The author(s) declare that no financial support was received for the research, and/or publication of this article.
Conflict of interest
Authors DS and AH were employed by Azura Consulting LLC. Author JW was employed by Walker Environmental Research, LLC.
The remaining authors declare that the research was conducted in the absence of any commercial or financial relationships that could be construed as a potential conflict of interest.
Generative AI statement
The author(s) declare that no Generative AI was used in the creation of this manuscript.
Any alternative text (alt text) provided alongside figures in this article has been generated by Frontiers with the support of artificial intelligence and reasonable efforts have been made to ensure accuracy, including review by the authors wherever possible. If you identify any issues, please contact us.
Publisher’s note
All claims expressed in this article are solely those of the authors and do not necessarily represent those of their affiliated organizations, or those of the publisher, the editors and the reviewers. Any product that may be evaluated in this article, or claim that may be made by its manufacturer, is not guaranteed or endorsed by the publisher.
Supplementary material
The Supplementary Material for this article can be found online at: https://www.frontiersin.org/articles/10.3389/fmars.2025.1549345/full#supplementary-material
References
Abbott J. K. and Haynie A. C. (2012). What are we protecting? Fisher behavior and the unintended consequences of spatial closures as a fishery management tool. Ecol. Appl. 22, 762–777. doi: 10.1890/11-1319.1
Atlantic States Marine Fisheries Commission (2025). American Lobster Benchmark Stock Assessment and Peer Review Report (Arlington, VA, USA: Atlantic States Marine Fisheries Commission), 601.
Bache S. J. (2001). A primer on take reduction planning under the Marine Mammal Protection Act. Ocean Coast. Manage. 44, 221–239. doi: 10.1016/S0964-5691(01)00047-3
Bagstad K. J., Semmens D. J., Waage S., and Winthrop R. (2013). A comparative assessment of decision-support tools for ecosystem services quantification and valuation. Ecosys. Serv. 5, 427.e23–e39. doi: 10.1016/j.ecoser.2013.07.004
Blondin H., Garrison L. P., Adams J. D., Roberts J. J., Good C. P., Gahm M. P., et al. (2025). Vessel strike encounter risk model informs mortality risk for endangered North Atlantic right whales along the United States east coast. Sci. Rep. 15, 736. doi: 10.1038/s41598-024-84886-z
Borggaard D. L., Gouveia D. M., Colligan M. A., Merrick R., Swails K. S., Asaro M. J., et al. (2017). Managing USA Atlantic large whale entanglements: four guiding principles. Mar. Policy 84, 202–212. doi: 10.1016/j.marpol.2017.06.027
Bricker S. B., Getchis T. L., Chadwick C. B., Rose C. M., and Rose J. M. (2016). Integration of ecosystem-based models into an existing interactive web-based tool for improved aquaculture decision-making. Aquaculture 453, 135–146. doi: 10.1016/j.aquaculture.2015.11.036
Ciolek D., Matczak M., Piwowarczyk J., Rakowski M., Szefler K., and Zaucha J. (2018). The perspective of Polish fishermen on maritime spatial planning. Ocean Coast. Manage. 166, 113–124. doi: 10.1016/j.ocecoaman.2018.07.001
Cole A. and Brillant S. (2025). Quantifying entanglement risk reduction to North Atlantic right whales from time-area closures in the southern Gulf of St. Lawrence snow crab fisheries. Endangered Species Res. 57, 143–159. doi: 10.3354/esr01412
Cooke J. G. (2020). Eubalaena glacialis. IUCN Red List Threatened Species, T41712A178589687. doi: 10.2305/IUCN.UK.2020-2.RLTS.T41712A178589687.en
Derville S., Buell T. V., Corbett K. C., Hayslip C., and Torres L. G. (2023). Exposure of whales to entanglement risk in Dungeness crab fishing gear in Oregon, USA, reveals distinctive spatio-temporal and climatic patterns. Biol. Conserv. 281, 109989. doi: 10.1016/j.biocon.2023.109989
Farmer N. A., Gowan T. A., Powell J. R., and Zoodsma B. J. (2016). Evaluation of alternatives to winter closure of black sea bass pot gear: projected impacts on catch and risk of entanglement with North Atlantic right whales Eubalaena glacialis. Mar. Coast. Fisheries 8, 202–221. doi: 10.1080/19425120.2016.1146181
Feist B. E., Samhouri J. F., Forney K. A., and Saez L. E. (2021). Footprints of fixed-gear fisheries in relation to rising whale entanglements on the USA west coast. Fisheries Manage. Ecol. 28, 283–294. doi: 10.1111/fme.12478
Gangnery A., Bacher C., Boyd A., Liu H., You J., and Strand Ø. (2021). Web-based public decision support tool for integrated planning and management in aquaculture. Ocean Coast. Manage. 203, 105447. doi: 10.1016/j.ocecoaman.2020.105447
Gee K., Blazauskas N., Dahl K., Goke C., Hassler B., Kannen A., et al. (2019). Can tools contribute to integration in MSP? A comparative review of selected tools and approaches. Ocean Coast. Manage. 179, 104834. doi: 10.1016/j.ocecoaman.2019.104834
Gilman E., Hall M., Booth H., Gupta T., Chaloupka M., Fennell H., et al. (2022). A decision support tool for integrated fisheries bycatch management. Rev. Fish Biol. Fisheries 32, 441–472. doi: 10.1007/s11160-021-09693-5
Grêt-Regamey A., Sirén E., Brunner S. H., and Weibel B. (2017). Review of decision support tools to operationalize the ecosystem services concept. Ecosyst. Serv. 26, 306–315. doi: 10.1016/j.ecoser.2016.10.012
Hatch J. M., Murray K. T., Patel S., Smolowitz R., and Haas H. L. (2023). Evaluating simple measures of spatial-temporal overlap as a proxy for encounter risk between a protected species and commercial fishery. Front. Conserv. Sci. 4, 1118418. doi: 10.3389/fcosc.2023.1118418
Henry A. G., Garron M., Morin D., Smith A., Reid A., Ledwell W., et al. (2022). Serious Injury and Mortality Determinations for Baleen Whale Stocks along the Gulf of Mexico, United States East Coast, and Atlantic Canadian Provinces 2015-2019. NOAA Tech Memo. NMFS-NE-280. (Woods Hole, MA, USA: NOAA NEFSC) 61.
How J. R., De La Mare W. K., Coughran D. K., Double M. C., and De Lestang S. (2021). Gear modifications reduced humpback whale entanglements in a commercial rock lobster fishery. Mar. Mammal Sci. 37, 782–806. doi: 10.1111/mms.12774
Jagannathan K., Emmanuel G., Arnott J., Mach K. J., Bamzai-Dodson A., Goodrich K., et al. (2023). A research agenda for the science of actionable knowledge: drawing from a review of the most misguided to the most enlightened claims in the science-policy interface literature. Environ. Sci. Pol. 144, 174–186. doi: 10.1016/j.envsci.2023.03.004
Johnson A., Salvador G., Kenney J., Robbins J., Kraus S., Kraus S., et al. (2005). Fishing gear involved in entanglements of right and humpback whales. Mar. Mammal Sci. 21, 635–645. doi: 10.1111/j.1748-7692.2005.tb01256.x
Knowlton A. R., Hamilton P. K., Marx M. K., Pettis H. M., and Kraus S. D. (2012). Monitoring North Atlantic right whale Eubalaena glacialis entanglement rates: A 30 year retrospective. Mar. Ecol. Prog. Ser. 466, 293–302. doi: 10.3354/meps09923
Knowlton A. R., Robbins J., Landry S., McKenna H. A., Kraus S. D., and Werner T. B. (2016). Effects of fishing rope strength on the severity of large whale entanglements. Conserv. Biol. 30, 10. doi: 10.1111/cobi.12590
Lebon K. M. and Kelly R. P. (2019). Evaluating alternatives to reduce whale entanglements in commercial Dungeness Crab fishing gear. Global Ecol. Conserv. 18, e00608. doi: 10.1016/j.gecco.2019.e00608
Linden D. W. (2024). Population size estimation of North Atlantic right whales from 1990-2023. NOAA technical memorandum NMFS NE. (Woods Hole, MA, USA: NOAA NEFSC) doi: 10.25923/bjn8-kx95
Marine Mammal Protection Act of 1972, as amended (MMPA) (1972). 16 USAC. 1361 et seq (Washington, D.C., USA: United States Congress).
Matzen E. A., Fuller E. A., Asmutis-Silvia R., Milliken H., Amico M. L., Galvez B. A., et al. (2025). Working with Northeastern United States lobster harvesters to develop acoustic trap retrieval in place of buoys and persistent vertical lines to reduce whale entanglements. ICES J. Mar. Sci. 82, fsaf015. doi: 10.1093/icesjms/fsaf015
Miller A. S., Solinger L., Shank B., Huamani A., Asaro M. J., Duffing-Romero M. D., et al. (2024). A decision support tool to assess risk of entanglement mortality to large whales from commercial fixed-gear fisheries in the Northwest Atlantic. NOAA technical memorandum NMFS NE (Woods Hole, MA, USA: NOAA NEFSC); 312. doi: 10.25923/m4zy-f952
Miller A. S., Solinger L., Shank B., Huamani A., Asaro M. J., and Sigourney D. (2025). Gearing up: Methods for quantifying gear density for fixed-gear commercial fisheries in the USA Atlantic. Can. J. Fish. Aquat. Sci. 82, 1–15. doi: 10.1139/cjfas-2024-0123
Miller D. L., Becker E. A., Forney K. A., Roberts J. J., Cañadas A., and Schick R. S. (2022). Estimating uncertainty in density surface models. PeerJ 10, e13950. doi: 10.7717/peerj.13950
Moore M. J., Rowles T. K., Fauquier D. A., Baker J. D., Biedron I., Durban J. W., et al. (2021). REVIEW Assessing North Atlantic right whale health: Threats, and development of tools critical for conservation of the species. Dis. Aquat. Organisms 143, 205–226. doi: 10.3354/dao03578
National Geophysical Data Center (1999a). USA Coastal Relief Model - Northeast Atlantic (Boulder, CO, USA: National Geophysical Data Center, NOAA). doi: 10.7289/V5MS3QNZ477
National Geophysical Data Center (1999b). USA Coastal Relief Model - Southeast Atlantic (Boulder, CO, USA: National Geophysical Data Center, NOAA). doi: 10.7289/V53R0QR5479
National Geophysical Data Center (2001). USA Coastal Relief Model - Florida and East Gulf of Mexico (Boulder, CO, USA: National Geophysical Data Center, NOAA). doi: 10.7289/V5W66HPP
Nyumba T. O., Wilson K., Derrick C. J., and Mukherjee N. (2018). The use of focus group discussion methodology: Insights from two decades of application in conservation. Methods Ecol. Evol. 9, 20–32. doi: 10.1111/2041-210X.12860
Pace R. M. III, Corkeron P. J., and Kraus S. D. (2017). State–space mark–recapture estimates reveal a recent decline in abundance of North Atlantic right whales. Ecol. Evol. 7, 8730–8741. doi: 10.1002/ece3.3406
Pace R. M. III, Williams R., Kraus S. D., Knowlton A. R., and Pettis H. M. (2021). Cryptic mortality of North Atlantic right whales. Conserv. Sci. Pract. 3, e346. doi: 10.1111/csp2.346
Pennisi E. (2017). North Atlantic right whale faces extinction. Science 358, 703–704. doi: 10.1126/science.358.6364.703
Pinarbaşi K., Galparsoro I., Borja A., Stelzenmuller V., Ehler C. N., and Gimpel A. (2017). Decision support tools in marine spatial planning: Present applications, gaps and future perspectives. Mar. Policy 83, 83–91. doi: 10.1016/j.marpol.2017.05.031
Pirotta E., Tyack P., Adams J., Asaro M., Bouchet P., Crocker D., et al. The combined effects of multiple stressors in an endangered, long-lived species: lessons learnt and ways forward. Ecol. Appl. In Press. doi: 10.1002/eap.70144
Portman M. E. (2007). Zoning design for cross-border marine protected areas: The Red Sea Marine Peace Park case study. Ocean Coast. Manage. 50, 499–522. doi: 10.1016/j.ocecoaman.2007.02.008
Poulton A. J., Sethi S. A., Ellner S. P., and Smeltz T. S. (2023). Optimal dynamic spatial closures can improve fishery yield and reduce fishing-induced habitat damage. Can. J. Fisheries Aquat. Sci. 80, 893–912. doi: 10.1139/cjfas-2022-0198
R Core Team (2024). R: A Language and Environment for Statistical Computing (Vienna, Austria: R Foundation for Statistical Computing). Available online at: https://www.R-project.org/ (Accessed December 20, 2024).
Reed P. J., New L. F., Corkeron P. J., and Harcourt R. G. (2024). Disentangling the influence of entanglement on recruitment in North Atlantic right whales. Biol. Conserv. 289, 110411. doi: 10.1098/rspb.2024.0314
Riekkola L., Liu O. R., Feist B. E., Forney K. A., Abrahms B., Hazen E. L., et al. (2023). Retrospective analysis of measures to reduce large whale entanglements in a lucrative commercial fishery. Biol. Conserv. 278, 109880. doi: 10.1016/j.biocon.2022.109880
Riekkola L., Liu O. R., Ward E. J., Holland D. S., Feist B. E., and Samhouri J. F. (2024). Modeling the spatiotemporal patterns and drivers of Dungeness crab fishing effort to inform whale entanglement risk mitigation on the USA West Coast. J. Environ. Manage. 351, 119735. doi: 10.1016/j.jenvman.2023.119735
Roberts J. J., Best B. D., Mannocci L., Fujioka E. I., Halpin P. N., Palka D. L., et al. (2016). Habitat-based cetacean density models for the US Atlantic and Gulf of Mexico. Sci. Rep. 61, 12 p. doi: 10.1038/srep22615
Roberts J. J., Yack T. M., Fujioka E., Halpin P. N., Baumgartner M. F., Boisseau O., et al. (2024). North Atlantic right whale density surface model for the US Atlantic evaluated with passive acoustic monitoring. Mar. Ecol. Prog. Ser. 732, 167–192. doi: 10.3354/meps14547
Saez L., Lawson D., and DeAngelis M. (2021). Large whale entanglements off the US West Coast, from 1982-2017 (Silver Spring, MD, USA: NOAA Technical Memorandum NMFS-OPR-63A).
Salas S. and Gaertner D. (2004). The behavioural dynamics of fishers: management implications. Fish Fisheries 5, 153–167. doi: 10.1111/j.1467-2979.2004.00146.x
Smeltz T. S., Harris B. P., Olson J. V., and Sethi S. A. (2019). A seascape-scale habitat model to support management of fishing impacts on benthic ecosystems. Can. J. Fisheries Aquat. Sci. 76, 1836–1844. doi: 10.1139/cjfas-2018-0243
Squires D., Ballance L. T., Dagorn L., Dutton P. H., and Lent R. (2021). Mitigating bycatch: Novel insights to multidisciplinary approaches. Front. Mar. Sci. 8, 613285. doi: 10.3389/fmars.2021.613285
Stephenson R. L., Paul S., Pastoors M. A., Kraan M., Holm P., Wiber M., et al. (2016). Integrating fishers’ knowledge research in science and management. ICES J. Mar. Sci. 73, 1459–1465. doi: 10.1093/icesjms/fsw025
Stortini C. H., Shackell N. L., and O’Dor R. K. (2015). A decision-support tool to facilitate discussion of no-take boundaries for Marine Protected Areas during stakeholder consultation processes. J. Nat. Conserv. 23, 45–52. doi: 10.1016/j.jnc.2014.07.004
Verschuur X., Bleijenberg J., Jurrius L. H., and Steins N. A. (2025). An evaluative framework for integrating fishers’ experiential knowledge in collaborative research. ICES J. Mar. Sci. 82, fsaf016. doi: 10.1093/icesjms/fsaf016
Verutes G. M., Johnson A. F., Caillat M., Ponnampalam L. S., Peter C., Vu L., et al. (2020). Using GIS and stakeholder involvement to innovate marine mammal bycatch risk assessment in data-limited fisheries. PloS One 15, e0237835. doi: 10.1371/journal.pone.0237835
Wilen J. E., Smith M. D., Lockwood D., and Botsford L. W. (2002). Avoiding surprises: incorporating fisherman behavior into management models. Bull. Mar. Sci. 70, 553–575.
Wong-Parodi G. M., Mach K. J., Jagannathan K., and Sjostrom K. D. (2020). Insights for developing effective decision support tools for environmental sustainability. Curr. Opin. Environ. Sustain. 42, 52–59. doi: 10.1016/j.cosust.2020.01.005
Keywords: line entanglement, right whales, lobster fishery, decision support tool, Northwest Atlantic, fixed-gear fishery
Citation: Shank B, Miller AS, Solinger L, Asaro MJ, Sigourney D, Huamani A, Trego ML, Franco C, Roberts JJ, Walker JD, Price AL, Duffing Romero MD, Coogan C, Goebel J, Cole TVN and Hayes SA (2025) A decision support tool for assessing entanglement risk to protected species from fixed-gear fisheries with applications to North Atlantic right whales (Eubalaena glacialis) in the Northwest Atlantic. Front. Mar. Sci. 12:1549345. doi: 10.3389/fmars.2025.1549345
Received: 20 December 2024; Accepted: 03 November 2025;
Published: 27 November 2025.
Edited by:
Nuno Queiroz, Centro de Investigacao em Biodiversidade e Recursos Geneticos (CIBIO-InBIO), PortugalReviewed by:
Alejandro Daniel Buren, Argentine Antarctic Institute (IAA), ArgentinaGonzalo Mucientes Sandoval, Spanish National Research Council (CSIC), Spain
Copyright © 2025 Shank, Miller, Solinger, Asaro, Sigourney, Huamani, Trego, Franco, Roberts, Walker, Price, Duffing Romero, Coogan, Goebel, Cole and Hayes. This is an open-access article distributed under the terms of the Creative Commons Attribution License (CC BY). The use, distribution or reproduction in other forums is permitted, provided the original author(s) and the copyright owner(s) are credited and that the original publication in this journal is cited, in accordance with accepted academic practice. No use, distribution or reproduction is permitted which does not comply with these terms.
*Correspondence: Burton Shank, YnVydG9uLnNoYW5rQG5vYWEuZ292