On the application of inertial microfluidics for the size-based separation of polydisperse cementitious particulates
 Aditya Kumar
 Peter Lewis
 Magdalena Balonis
 Dino Di Carlo
 Gaurav Sant
- 1Laboratory for the Chemistry of Construction Materials (LC2), Department of Civil and Environmental Engineering, University of California Los Angeles, Los Angeles, CA, USA
- 2Department of Materials Science and Engineering, University of California Los Angeles, Los Angeles, CA, USA
- 3Institute for Technology Advancement, University of California Los Angeles, Los Angeles, CA, USA
- 4Microfluidics Biotechnology Laboratory, Department of Bioengineering, University of California Los Angeles, Los Angeles, CA, USA
- 5Jonsson Comprehensive Cancer Center, University of California Los Angeles, Los Angeles, CA, USA
- 6California Nanosystems Institute (CNSI), University of California Los Angeles, Los Angeles, CA, USA
The early-age performance of concrete is determined by the properties of its cementitious binder and the evolution of its chemical reactions. The chemical reactivity, and to some extent, the composition of cementitious particles can depend on particle size. Therefore, it is valuable to physically separate cementing minerals into well-defined size classes so that the influences of both particle size and composition on reaction progress can be studied without the confounding effects of a broad particle size distribution. However, conventional particle separation methods (e.g., density fractionation, wet sieving, field-flow extraction, ultrasonification–sedimentation) are time consuming and cumbersome and result in poor particle yields (PY) and size-selectivity, thus, making them unsuitable for processing large(r) volumes of cementitious powders (on the order of grams). This study applies a novel inertial microfluidics (IMF) based procedure to separate cementitious powders on the basis of their size. Special attention is paid to optimizing operating variables to ensure that particles in a fluid streamline achieve unique equilibrium positions within the device. From such positions, particles can be retrieved as a function of their size using symmetrical outlet configurations with tuned fluidic resistances. The approach is critically assessed in terms of: (1) its ability to separate cementitious powders into narrow size bins, and therefore its feasibility as a fractionation procedure, and (2) quantitatively relating the operating parameters to the PY and size selectivity. The study establishes rigorous metrics for assessing the ability of IMF methods to classify minerals and other polydisperse particles on the basis of their size.
Introduction and Background
The rate and extent of strength gain of a concrete at early ages (reaction times) are determined exclusively by the evolution of the cementitious binder’s properties. The binder itself is a mixture of a powder of cementitious minerals and water, and so the particle’s physical properties (e.g., surface area) and chemical composition are decisive in determining the behavior of a concrete at early times. Cementitious particles are predominantly calcium aluminosilicate minerals or glasses (Taylor, 1990) having a wide distribution of particle size and shape; with particle size ranging from <0.1 to ≥100 μm. At a fixed composition, the rate of reaction of particles per unit volume increases with decreasing particle size due to their increasing specific surface area (Bentz et al., 1999; Kumar et al., 2012). In addition, reports have suggested a particle size dependence of the phase composition of multi-phase cementitious particles and of fly-ash particles produced by coal combustion (Berry et al., 1989), although the exact relationships are unknown and probably vary from material to material. Determining the exact compositional dependence of reaction rates is therefore challenging because of the inherently wide distribution of particle sizes and shapes. This problem would be tractable if these kinds of powders could be separated into narrow size bins. However, existing methods for fractionation [e.g., sieving, density fractionation, field-flow fractionation, etc. (Tiessen and Stewart, 1983; Giddings, 1984)] are cumbersome, time consuming, and produce low yields making them unsuitable for such preparatory functions.
A novel inertial microfluidics (IMF) method has recently been shown to fractionate biological cells (Di Carlo et al. 2007, 2008; Di Carlo, 2009). IMF separations are performed using “on-chip” devices that generate inertial lift forces, thereby driving particles toward size-dependent equilibrium lateral positions in a fluid streamline within a high aspect-ratio microchannel (Anderson et al., 2000; Enger et al., 2004; Gijs, 2004; Wong et al., 2004; Cheng et al., 2007; Di Carlo, 2009; Wu et al., 2009; Pratt et al., 2011). As the particles converge toward these equilibrium positions, they are collected in symmetric outlets configured with tuned fluidic resistances (Di Carlo et al. 2007, 2008; Hur et al., 2010; Lee et al., 2011; Hansson et al., 2012). Inertial approaches have garnered significant interest because such separations are particle-size-dependent, continuous, and operate efficiently at high(er) flow rates as compared to other methods (Pamme, 2007; Bhagat et al., 2009; Hou et al., 2010; Hur et al., 2011). In separate studies, Zhang et al. (2014a) and Kim et al. (2014) demonstrated size-based separation of micro/nano sized particles using IMF devices with microchannels with a rectangular cross-section and serpentine and curvilinear geometries, respectively. In another study, polystyrene particles ranging in diameter from 1 to 10 μm have been separated by IMF methods according to size and shape, with a selectivity of ±2 μm and with yields up to 90% (Chen et al., 2008). Lee et al. (2014) have demonstrated successful separation of plasma cells, with yields in excess of 70% and throughputs in the order of 1011 cells/min, from human blood using IMF devices equipped with contraction–expansion array (CEA) within the microchannel. Hansson et al. (2012) also demonstrated the high-throughput filtration of particles using IMF by constructing parallel arrays of up to 16 microfluidic channels for the filtration of randomly sized particles. In more recent studies, Zhang et al. (2014b) have devised a hybrid microfluidic device, integrating inertial focusing of a typical IMF device with dielectrophoresis (DEP), for feedback-controlled manipulation and separation of micron-sized particles in a size-dependent manner. Recent advancements in the field of IMF-based methods are detailed in these review articles (Martel and Toner, 2014; Tabeling, 2014).
The high-throughput capabilities of IMF methods potentially offer a significant advance in the fractionation of inorganic powders. But, IMF separation studies to date have been conducted using particles having a narrow particle size distribution (PSD) or at least well-defined shapes and size classes. For application to pulverized powders with wide PSDs and irregular shapes, the selectivity and yield of the IMF process have not been assessed. Moreover, the role of IMF operating parameters on the size selectivity and yield of particulates remains unclear, including:
(a) the relationship between the size of particles and hydrodynamic forces,
(b) the variations in inertial lift forces and secondary flows with respect to the suspension’s physical characteristics and flow rate,
(c) the variations in hydrodynamic forces with respect to device geometries (i.e., those having straight or curvilinear channels, the channel dimensions, etc.), and,
(d) the effects of particle shape on their equilibrium positioning within the microchannel.
An improved understanding of the influences of these key parameters is required to tailor the IMF approach, and its application to powders with wide size and shape distributions. Therefore, the objective of this study is to establish the feasibility of IMF methods as a viable approach to separate mineral powder particulates, having either narrow or wide PSDs, into narrow size classes. A critical part of the study examines the effects of process/operating parameters so as to enhance particle yields (PY) and separation fidelity. The paper elucidates key details including: (i) the performance of a specific IMF device design in separating polydisperse particles, (ii) developing methods of analysis to quantify separation performance; both pre-and-post-separation and (iii) directions, and subjects of further research that are necessary to improve size-selectivity and particle enrichment before high-fidelity/throughput particle separations can be performed. It is anticipated that addressing the questions highlighted is critical to enhance the separation efficiency and performance of IMF devices.
Overview of the Principles of Inertial Microfluidics
Theoretical Background
In the 1960s, Segre and Silberberg dispersed millimeter-scale particles in a liquid, forced their dispersion through a 10 mm (diameter) tube, and observed that the particles migrated to an annulus centered at a position 0.6 times the tube radius (Segre and Silberberg, 1962a,b) (see Figure S1A in Supplementary Material). Subsequent observations revealed the action of two opposing lift forces on the particles, namely a wall-effect lift (FW) that pushes the particles away from the channel wall and a shear-gradient lift (FL) that pushes particles toward the walls. The magnitude of each force depends on the inertia of the fluid and the ratio of particle diameter, aP, to the channel diameter, DChannel (Segre and Silberberg, 1962b; Anderson et al., 2000; Matas et al., 2004; Di Carlo et al. 2007, 2008; Di Carlo, 2009). As [aP/DChannel] < <1, the particles failed to reach equilibrium positions within a reasonable channel length and remained randomly distributed between the channel centerline and the tube walls.
For typical Poiseuille flow of a suspension within a cylindrical channel, the parabolic velocity profile produces a shear-gradient induced inertial lift force (FL), which is directed down the shear gradient and vanishes at the channel’s centerline (Di Carlo et al. 2007, 2008; Di Carlo, 2009). The shear-gradient induced lift force therefore drives particles away from the center and toward the walls of the microchannel, with larger particles experiencing a greater force toward the walls. However, as particles come into close proximity to the walls, an asymmetric wake induced around them generates a wall-induced lift force (FW) that pushes the particles away from the wall with a magnitude that decays with an increasing distance from the wall (Di Carlo et al. 2007, 2008; Bhagat et al., 2008, 2009; Di Carlo, 2009) (see Figure S1B in Supplementary Material).
Following the observations of Segre and Silberberg, numerous studies attempted to explain this behavior. Matas et al. (2004) confirmed the inertial migration of particles in a cylindrical tube for a wide range of fluids and fluid velocities and found that the equilibrium positions of particles shift toward the wall for faster flow rates and toward the center for slower flow rates. They also reported that heavier particles equilibrate in similar positions as neutrally buoyant particles, confirming that the density of the particle has no major influence on the hydrodynamic forces. More recently, the inertial migration of particles in channels with square cross-sections has been reported (Chun and Ladd, 2006; Kim and Yoo, 2008), wherein it was shown that at low- and high-fluid velocities, particles equilibrate at four and eight stable equilibrium positions, respectively, within a square microchannel. But in asymmetric curvilinear serpentine (Di Carlo et al. 2007, 2008; Di Carlo, 2009) and spiral microchannels (Bhagat et al., 2008), wherein lateral Dean drag forces arising from secondary Dean flow in curvilinear geometries operate (i.e., in addition to the longitudinal viscous drag forces and the lateral lift forces), the inertial migration of particles is modulated (see Supplementary Material). These and numerous other studies have collectively led to a better understanding of the mechanisms of hydrodynamic forces and their influences on particle migration in fluids.
The interaction of the two lift forces in opposite directions leads to the particles attaining defined lateral equilibrium positions between the channel centerline and walls. The wall-induced lift force drives particles away from the walls and toward the centerline of the flow (Di Carlo et al. 2007, 2008; Bhagat et al., 2008, 2009; Di Carlo, 2009), whereas shear-induced lift forces drive the particles away from the channel centerline toward the channel walls. Di Carlo (2009) showed that the total magnitude of inertial lift forces [i.e., shear-gradient induced and wall-induced forces as shown in Eq. (1a)] scales as and close to the centerline and channel walls (Eqs 1b and c), respectively, where ap (m) and H (m) are particle diameter and the height of the microchannel, respectively.
In Eq. 1a, it should be noted that the lift force (FL, N) depends on the value of the particles’ Reynolds number (Rp, unitless) and fc (unitless), which is the non-dimensional lift coefficient that is a function of the channel’s Reynolds numbers (Rc, unitless) and the position of the particle within the cross-section of the channel (xc). The value of fc ranges from 0.02 to 0.05 for straight channels with aspect ratios (H/W) ranging from 0.50 to 2.00 (Di Carlo et al. 2007, 2008; Di Carlo, 2009). At the equilibrium position, where the wall-effect and shear-gradient lift forces balance each other, fc diminishes to zero. The channel’s Reynolds number (Rc), as shown in Eq. (2a), depends on the characteristics of the fluid, i.e., density (ρF, kg/m3), the dynamic viscosity (μ, kg/ms), the flow velocity (UF, m/s) in addition to the microchannel’s geometry described by the effective hydraulic diameter DH (m) in Eq. 2b (Di Carlo et al., 2007). The particles’ Reynolds number (Eq. 2c), on the other hand, is a function of the fluid’s characteristics (i.e., density, viscosity, and the flow velocity), particle size (aP), and the channel geometry (DH) (Di Carlo et al., 2007; Di Carlo, 2009).
In Eqs 1b,c, the total inertial lift force close to the channel centerline and the walls also depends on the particle velocity (Up, m/s), which scales with the fluid-flow velocity (UF), as shown in Eq. 3 (Di Carlo et al. 2007, 2008; Bhagat et al., 2008; Di Carlo, 2009; Gossett and Di Carlo, 2009). It should be noted that Up refers to the lateral migration velocity that the particle acquires due to its viscous interaction with the fluid. As this velocity is described in the reference frame of the flowing fluid, it does not include a velocity component along the direction of flow.
The viscous interaction between the suspended particles and the fluid is described by the viscous drag force (FD), which entrains particles along the streamlines. The drag force (written in Eq. 4) acts parallel to the flow direction and its magnitude increases with the fluid viscosity (μ), particle size (ap), and flow velocity (UF). In most flows, the drag force accelerates the particles toward the average intersected fluid speed until the drag force vanishes and no force acts on the particles in the flow direction (Di Carlo et al., 2007; Bhagat et al., 2009).
The descriptions above highlight that the properties of the particles, the fluid suspension, and the device geometry affect the nature and magnitude of hydrodynamic forces. In brief, it is noted that the following operating variables will influence the nature and quality of IMF separations:
• the aspect ratio of the microchannel (AR = H/W),
• the length of the microchannel (LC),
• the particle diameter (aP),
• the fluid-flow velocity (UF),
• the fluid-flow rate (Q), and,
• the carrier fluid properties including its density (ρF) and viscosity (μF).
These variables/parameters can thus be tuned to optimize particle separation. IMF processes can function based on kinetic or equilibrium criteria. In kinetic separation, differences in migration times of particles having different sizes leads to their separation, whereas equilibrium separation relies on differences in positions of particles having different sizes to control their separation. Both kinetic and equilibrium-based separation methods can be used to process large volumes of materials as they enable the use of multiple IMF devices (if so desired) in either series or parallel configurations. This study uses equilibrium-based separation because, in a channel of sufficient (but constant) length, it allows continuous size-based fractionation by collecting the particles in separate outlets after they have attained their inertial equilibrium positions; as dictated by size.
The Influence of IMF Device Dimensions on Particle Focusing
Equations (1–4) can be used to estimate the minimum channel length (Lc) that is required to allow particles to acquire their equilibrium positions. If the channel has a rectangular cross-section and is straight, Lc can be estimated from Eq. (5), which accounts for the dimensions of the channel, the fluid characteristics, and particle geometry (Di Carlo, 2009).
In addition to the length of the channel (LC), the number and the location of equilibrium particle positions within the channel also depend on the channel width and height. At high fluid velocities in straight channels, particles equilibrate to one of four positions in channels with AR ≈ 1, or one of two positions for AR >2 or AR <0.5 (Chun and Ladd, 2006; Di Carlo et al., 2009). Therefore, the optimum flow rate of the fluid (Q, m3/s) can be optimized using Eq. 6, which accounts for fluid-flow velocity in relation to the channel dimensions (width, W and height, H).
The particle concentration in the fluid is a critical factor that affects focusing behaviors. Steric crowding effects, which increase with particle concentration, influence particle migration within narrow streamlines in microchannels. While quantification of these effects is complex, Di Carlo suggested a parameter, λ in Eq. 7, such that steric interactions prevent focusing to a single stream when λ > 1 (Di Carlo, 2009). λ represents the fraction of the length of channel required for focusing of the particles in relation to the volume fraction (Vf, unitless) of the solid in suspension. At large values of Vf, λ > 1, thus implying inadequate channel length to allow the particles to migrate to their equilibrium positions. In addition, particle shape also influences hydrodynamic forces in microchannels. As such, while rod-shaped particles with ARParticle = 3 will collect closer to the channel centerline, spheres of the same volume (AR = 1) collect nearer to the channel walls (Masaeli et al., 2012).
IMF Device Design, Fabrication Process, and Selection of Operating Variables
For a straight microchannel, the channel width (W) and height (H) were fixed at 30 and 47 μm, respectively, to yield ARchannel = 0.638. This selection was made based on previous success using this design (Masaeli et al., 2012). Equations (5–7) were solved in a piece-wise manner to identify fluid properties, and suspension characteristics that would optimize particle enrichment/selectivity for inorganic powders with broad PSDs. Parameters of particular interest in the optimization process were: (a) carrier fluid density (ρF) and viscosity (μ), (b) fluid-flow rate (Q), and (c) volume fraction of solid in the suspension (Vf). These solutions are graphically represented in Figure 1 below. Also noted in Figure 1, is our justification for selection of Lc = 40 mm, which provides a balance of a compact device size, and suitable particle focusing.
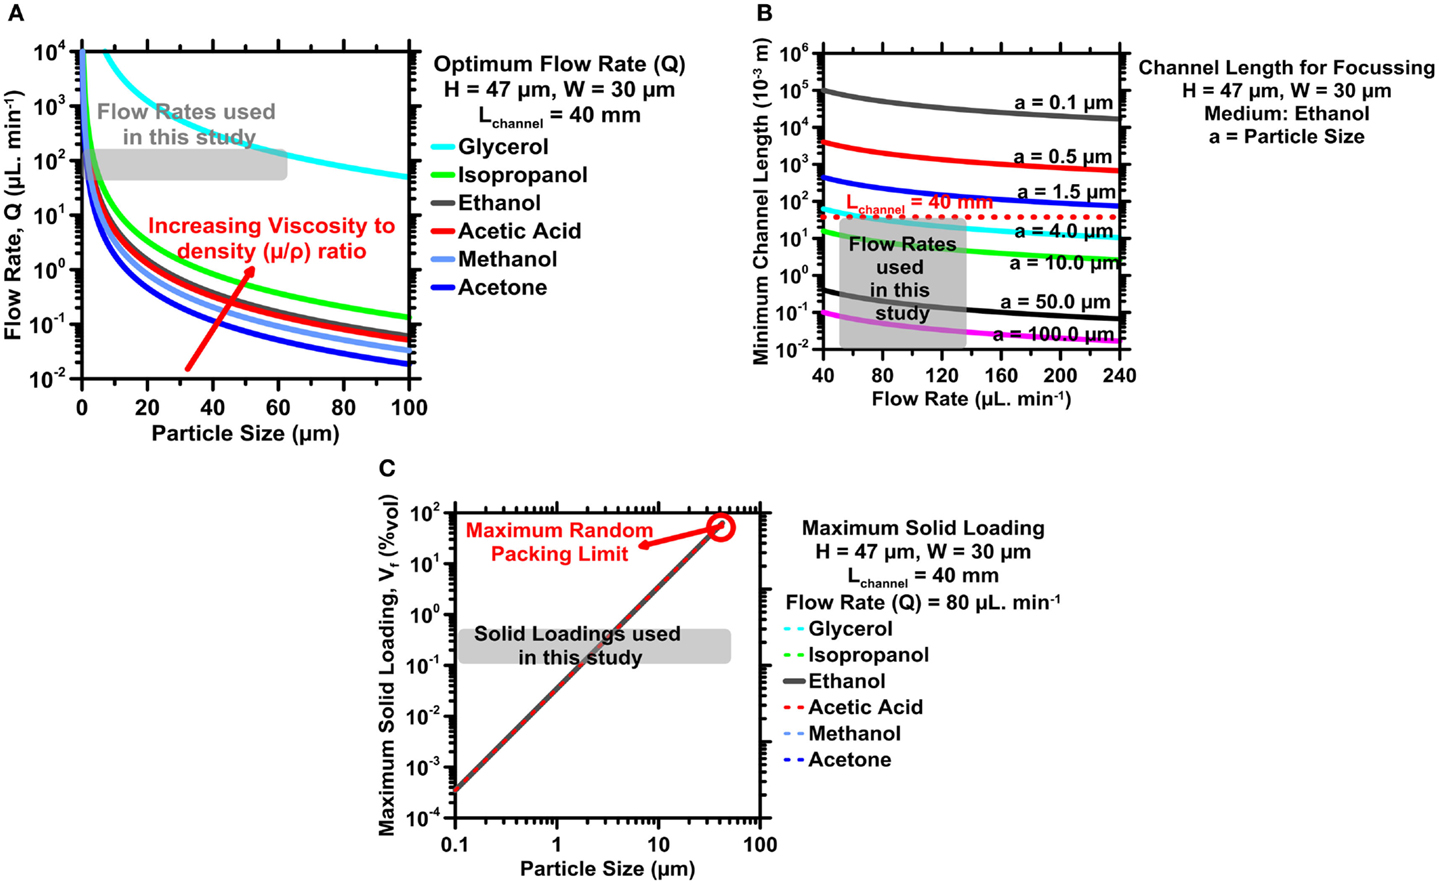
Figure 1. (A) The optimum flow rate (Q) as a function of particle size (aP) for different carrier fluids. (B) The optimum (design) channel length (Lc) as a function of the flow rate (Q) for different particle sizes. (C) The maximum volume percentage of solids in suspension to limit steric effects as a function of particle size (aP). The gray regions indicate optimum ranges selected in operating variables for size-based particle fractionation in this study.
Figure 1A shows, for suspensions flowing in a straight microchannel with a rectangular cross-section of a fixed geometry (LC = 40 mm, H = 47 μm, W = 30 μm), that very high flow rates are required to enable small particles, with volume-equivalent spherical diameters ≤3.5 μm, to acquire their inertial equilibrium positions. High flow rates in narrow microchannels, however, are not practical because of transitions to turbulent flow when Re >2000 (Stone et al., 2004). The flow rate can be reduced somewhat by using fluids with a lower kinematic viscosity (μ/ρ), but this reduction is insufficient to enable very small particles to reach their equilibrium positions. Based on the trends in Figure 1A and the need to avoid any reaction with cementitious particles, ethanol was chosen as the carrier fluid with a flow rate between 55 and 135 μL/min.
Using ethanol as a carrier fluid, Eqs 5–7, the fluid-flow rate was chosen within a range of 55–135 μL/min, shown in Figure 1B, the high end of which would enable for particles larger than 3.0 μm (aP) to migrate to their equilibrium positions. Again, focusing smaller particles would require longer channels or higher flow rates, and would therefore make device fabrication more challenging.
With Lc and Q selected, the focusing criterion in Eq. 7 was used to determine the optimal particle volume fraction in suspension. Generally, higher particulate concentrations are desirable to increase yield at the outlets. However, Figure 1C shows that high particle concentrations may induce steric crowding effects that hinder the migration of smaller particles. Based on this trade-off and Eq. 2c, an optimum particulate volume fraction (Vf) was identified to range between 0.1 and 0.5% by volume, for which particles ≥1.5 μm (aP) are expected to acquire equilibrium positions. Here, it should be noted that the λ parameter, as described in Eq. 7, does not consider the length of the microchannel and the fluid-flow rate explicitly. Therefore, when we factor in the limiting particle sizes for a channel length (LC) of 40 mm and fluid-flow rates of 55–130 μL/min, it is expected that in suspensions prepared at Vf <0.5%, particles wherein 1.5 μm < aP < 3.5 μm will not acquire their inertial equilibrium positions, despite not being adversely affected by steric crowding effects. The λ parameters also does not consider particle packing explicitly. Therefore, as a first approximation, a high packing efficiency of ≈64%, was chosen. Based on the analysis above, for optimum values of Lc, Q, and Vf, the minimum size (aP) of particles, which would acquire their inertial equilibrium positions, is 3.5 μm.
Our device incorporates a straight microchannel with cross-sectional dimensions of H = 47 μm, W = 30 μm, and Lc = 40 mm. The inlet of the IMF device is where the suspension is injected (see Figure 2). Following the inlet and long inertial focusing channel, there is a gradual expanding outlet region, with a radius of curvature (Rcurvature) of 3 mm, which allows the particles to maintain their streamline positions without Dean flow effects (Masaeli et al., 2012) (see Figure 2). Previous studies (Masaeli et al., 2012) have indicated that the gradual expansion in the channels increases the spacing between equilibrium positions of particles of different sizes, so that each outlet can collect particles from any given equilibrium position with less interference from nearby positions.
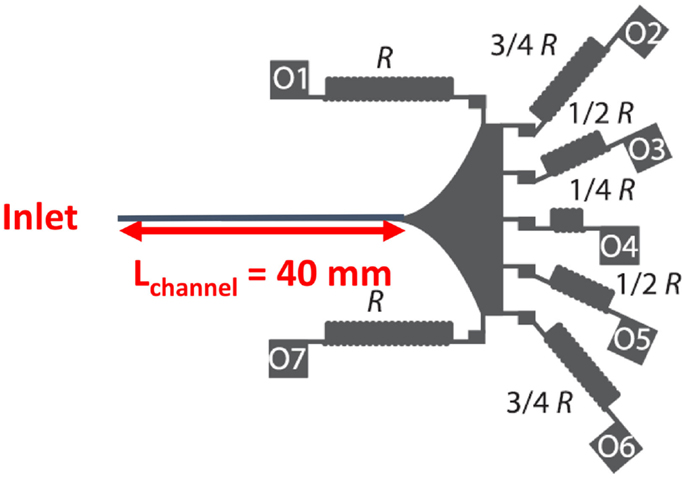
Figure 2. The design schematic of the IMF device. Outlets 1–7 are shown as O1–O7.
Of the seven outlets shown in Figure 2, outlets O5, O6, and O7 are identical by symmetry to outlets O3, O2, and O1, respectively. Therefore, the remainder of this section will focus on the characteristics of outlets O1 through O4. When comparing the outlets, the resistance ratio, αij, of outlet i to outlet j is defined as the ratio of the fluid-flow rates Qi/Qj. For the design shown in Figure 2, α12 = 3/4, α13 = 1/2, and α14 = 1/4. The outlets have serpentine geometries to increase fluidic resistance and limit flow-rate distortions (Masaeli et al., 2012). In the discussion that follows, particle collections in different outlets are described in the terms of the resistances of the outlets in which they are collected. It should be noted that outlets of higher resistances (i.e., O1, O7, O2, and O6) could alternately also be referred to “outer” channels, on account of their siphoning fluid closer to the inertial focusing channel walls, and outlets of lower resistance (i.e., O3, O4, and O5) as the “inner” channels, as they follow fluid trajectories closer to the microchannel centerline. This IMF device is thus optimized to permit separation of cementitious particles into four different size classes.
Device Fabrication
The fabrication process was divided into two parts: (i) photolithographic production of a master device mask and (ii) casting of poly-dimethysiloxane (PDMS) to produce the IMF device. The master device mask is designed using AutoCAD (Earle and Olsen, 1998) based on the design shown in Figure 2. A negative photoresist (SU-8) is spin-coated on a Si wafer and soft baked at 65°C for 2 min. Ultraviolet radiation with a wavelength of 300 nm is directed through the mask for 20 s to selectively expose the photoresist. Following a post-exposure bake at 95°C, the SU-8 photoresist is etched to leave a negative of the mask in the photoresist layer and the remaining photoresist is hard baked at 120°C. To cast the device, PDMS is mixed with a curing agent in a mass ratio of 10:1 and poured into a petri dish containing the Si wafer. The assembly is placed in a vacuum desiccator at 67 Pa for 1 h, and then cured in air at 85°C for 6 h. The PDMS is demolded, and in a hardened state, it is bonded onto a glass slide using plasma treatment.
Experimental Procedure
At the start of an experiment, a prepared suspension of powder in ethanol is loaded into a syringe connected to a pump (see setup graphic in the Supplementary Material). The suspension is magnetically stirred in the syringe to avoid sedimentation and maintain a constant solid loading (Vf). The suspension is injected into the device at a constant flow rate (Q), in this case ranging between 55 and 135 μL/min. Care is taken to retain the fluid at a similar height over the course of the experiment to minimize changes in piezometric head, which could result in differing levels of particle sedimentation within the syringe, and the IMF device before they migrate to their equilibrium positions. Post-separation, the particles are collected in separate vials connected to the device outlets using 60 μm PEEK™ tubing1.
Powder Composition and Physical Properties
Four powders were evaluated: (i) ordinary portland cement (OPC), (ii) finely ground limestone, a common filler material used in concrete binders (Lothenbach et al., 2008; Oey et al., 2013), (iii) coal fly ash (FA), a post-combustion residue that is often used as a pozzolanic additive in concrete (Lothenbach et al., 2011), and (iv) three size-classified silica microsphere powders with median diameters of 1.5, 4.0, or 8.0 μm.
The OPC was an ASTM C150 compliant Type I/II formulation with an estimated phase mass composition of 58.5% C3S, 18.4% C2S, 5.6% C3A, 9.2% C4AF, 4.2% CaCO3, 1.3% MgO, and an Na2O equivalent of 0.40%2. The ground limestone (CaCO3) is a commercially available powder of >95% purity produced by OMYA A.G. The oxide composition of the FA powder, estimated using X-ray fluorescence, is 57.98% SiO2, 27.71% Al2O3, and 6.23% Fe2O3, with minor quantities of CaO, MgO, Na2O, K2O, P2O5, TiO2 also measured. The silica microsphere powders were used to test the selectivity and yield of the device for powders with uniform shape and narrow size range.
The PSDs of each powder were measured by static light scattering (SLS) using ultrasonically agitated isopropanol as a carrier fluid to prevent reaction or agglomeration during the measurement. The measured size distributions are shown in Figure 3. The density of OPC, FA, limestone, and silica microspheres was assumed to be 3250, 2700, 2600, and 2650 kg/m3, respectively. The specific surface areas of the OPC, FA, and limestone powders, inferred from their PSDs by assuming spherical particles (Bullard and Garboczi, 2004), are 418, 495, and 401 m2/kg, respectively. Similarly, the specific surface area of the silica microsphere powders with median diameter of 1.5, 4.0, and 8.0 μm are calculated as being: 1791, 508, and 270 m2/g, respectively.
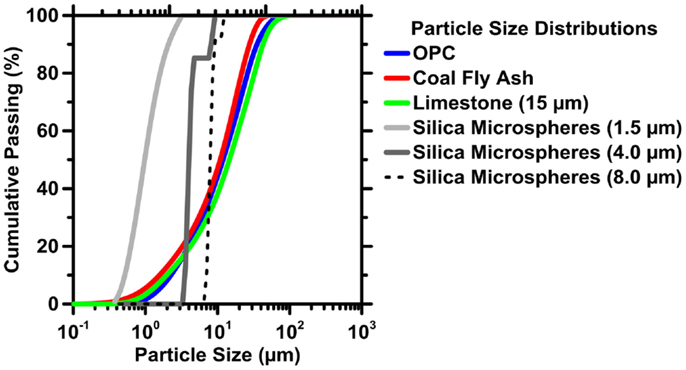
Figure 3. The particle size distributions (PSDs) of cement (OPC), coal fly ash (FA), limestone powders, and silica microspheres. The uncertainty in the measured particle size distribution is 6%, based on variations in the median diameter (d50) of six replicate measurements. Based on the uncertainty in the d50 values, the error in the calculated specific surface area is expected to scale with the product of the particle size (d) and Δd50, where Δd50 = 0.06.
Representative scanning electron micrographs of the powder particles, in secondary electron mode, are shown in Figure 4. Both the OPC and limestone have non-spherical particles (ARparticle > 1) in a wide range of sizes, while the silica particles are nearly spherical (ARparticle ≈ 1) and possess a narrower size distribution. The FA particles are present in a wide range of shapes, with a wide range of inhomogeneity in the surface morphology of the larger particles, although the majority of the small particles appear to be nearly spherical. The influence of particle shape distribution on the separation selectivity will be discussed in a later section.
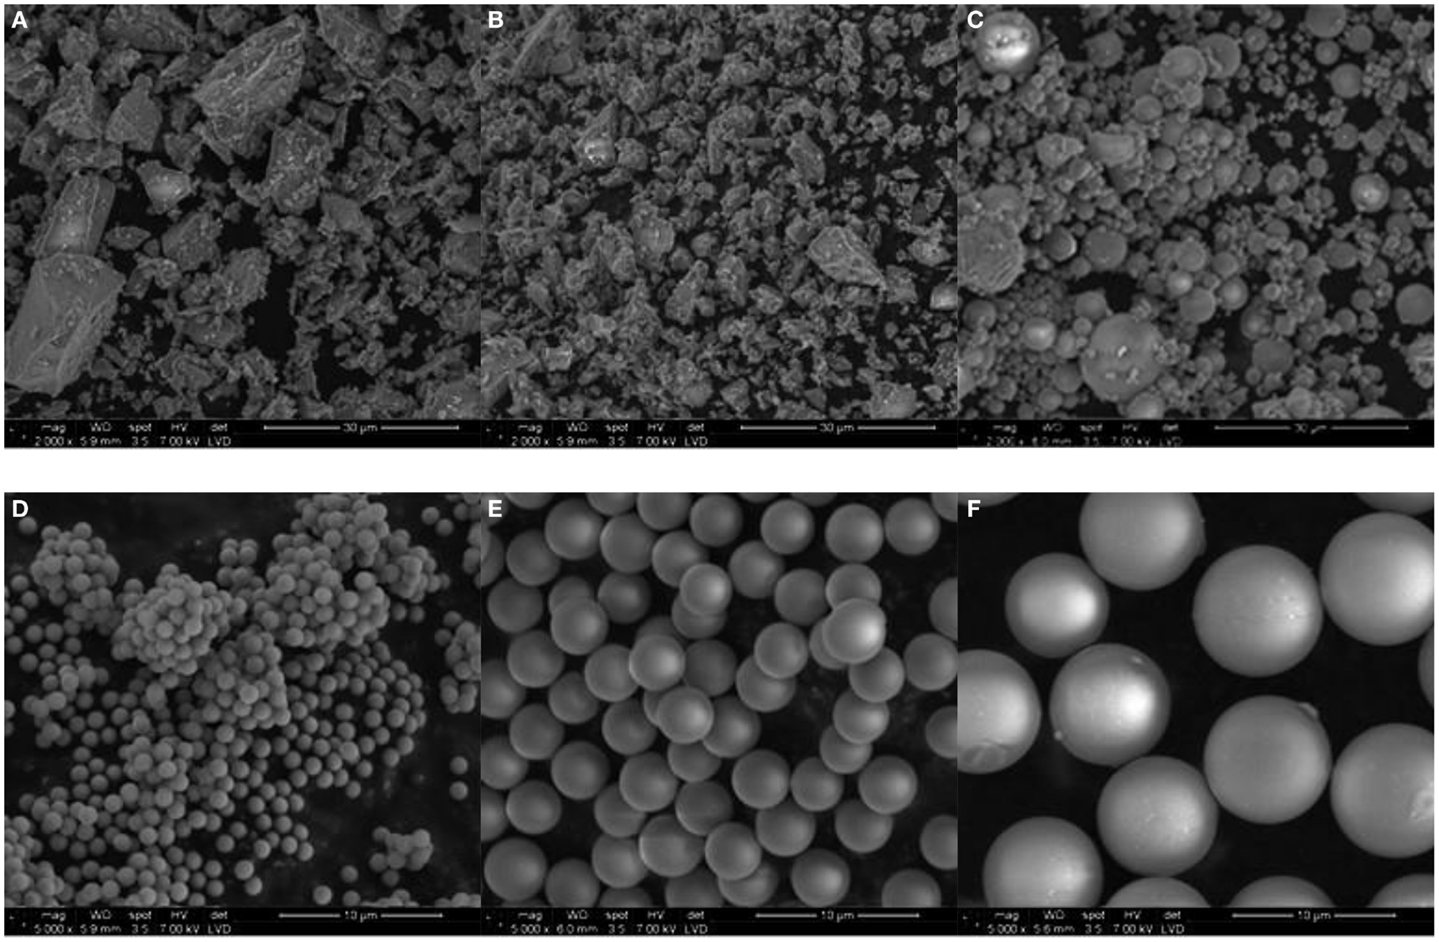
Figure 4. SEM micrographs of the different particles used in this study: (A) OPC, (B) limestone, (C) fly ash, (D) ≈1.5 μm silica microspheres, (E) ≈4 μm silica microspheres, and (F) ≈8 μm silica microspheres. The scale bars shown in (A–C) and (D–F) are 30 and 3 μm, respectively.
Image Analysis for Characterizing IMF Separations
Optical microscopy-based image capture and analysis (ICA) was applied to characterize the particle size-selectivity and particle enrichment in the different outlets. Particles collected in a given outlet are dispersed onto a glass slide, and an optical microscope fitted with a 20× objective was used to image the particles. To characterize particle separations in a statistically consistent manner, at least eight images, with a field of view (FoV) of 420 μm × 420 μm, are captured for particles exhausted at each outlet. Illumination, brightness, and contrast are each adjusted to achieve the best distinction between the particle boundaries and the background. The images are processed using a custom algorithm embedded within ImageJ (Schneider et al., 2012).
The image-processing algorithm applies the following routines to improve image features: (a) a Gaussian filter to remove background noise, (b) intensity thresholding to distinguish the particle boundaries from the background and (c) a watershed algorithm to subtract the residual image from the particles and their boundaries. The macro then performs a pixel count within the particle boundaries, and an image scale of 0.3225 μm/pixel edge is used to generate a PSD for the image. The sizes of the particles are related to both their cumulative volume percentages and the corresponding particle numbers. The results obtained from all the images for a given outlet are averaged to present a single PSD for that outlet. The outlet PSDs are used to evaluate PYs according to:
where, N is the particle number, i refers to a specific outlet, and “a” refers to specific size.
The calculation of PY is accomplished using two methods for particulates with narrow or broad size distributions. For silica microspheres, PY is assessed for each outlet while accounting for the size of the particle (Eq. 8a). Therefore, PY for the silica microspheres includes particle enrichment and particle size-selectivity. For cementitious powders, which have a very broad range of particle sizes, PY is calculated by simply counting the number of particles collected in a given outlet and dividing this value by the total number of particles counted at the inlet without accounting for particle size (Eq. 8b). This provides indications of particle enrichment but not of size-selectivity. Therefore, for particle size-selectivity, the median particle diameter (i.e., the d50) and SD of the distribution are presented in addition to PY. This procedure was applied because cementitious powders have numerous size-classes and imposing arbitrary size-classes is difficult.
To quantitatively analyze the particle separation metrics, the PSDs obtained from the ICA routine were fitted to Rayleigh, Gamma, and Rosin–Rammler distributions using a Nelder–Mead simplex optimization method (Nelder and Mead, 1965; Olsson and Nelson, 1975). The Rosin–Rammler distribution (Eq. 9a, RRD) was found to best fit the measured PSDs, in terms of the coefficient of determination and residuals analysis (Eq. 9b), so only the analysis of the RR distributions is discussed further. The RR distribution is given by:
where
where, RR(x) is the cumulative percentile of particles with sizes less than or equal to x, x (μm) is the particle size, d80 (μm) is the 80th percentile of the distribution, B (unitless) is the number of bins that represent the size-classes as obtained from the ICA routine, μ (μm) is the mean particle size, and m is a dimensionless exponent that influences the curvature of the RR function. The SD (σ) of the fitted distributions (Eq. 9c) can be used to define a size dispersion ratio (DR, Eq. 10), in the particle sizes of any given device outlet in relation to the dispersion in the particle sizes of the inlet. Values of DR >1 imply a larger scatter in outlet particle sizes and hence reduced size refinement, while DR <1 implies a narrower distribution and thus enhanced particle size refinement. When DR ≈ 0, this corresponds to monosized (on average) particles in the outlet. In the following sections, DR will be used as a measure of the particle size refinement produced (i.e., the purity of particle separation) at any given IMF device outlet.
It should be noted that the ICA routine was first validated against experiments performed on the near monosized silica microspheres. In general, at least three images for each of the three silica powders were captured and processed using the ICA macro. As seen in Figure 5, the results obtained from the macro agree well with the PSDs measured by SLS. In addition, RRD fits to the measured silica microsphere PSDs were obtained (see Figure S2 in Supplementary Material) and excellent agreement is noted between the PSDs and the median diameters (d50) derived from ICA methods and Rosin–Rammler fittings. The SDs calculated using Eq. 9c increased with increasing particle size suggesting larger dispersions in particle size with increasing d50 (Figure S2C in Supplementary Material). This is expected due to errors that result from both shadowing and centered-weighted optical focusing, which gain increasing the significance with increasing particle size.
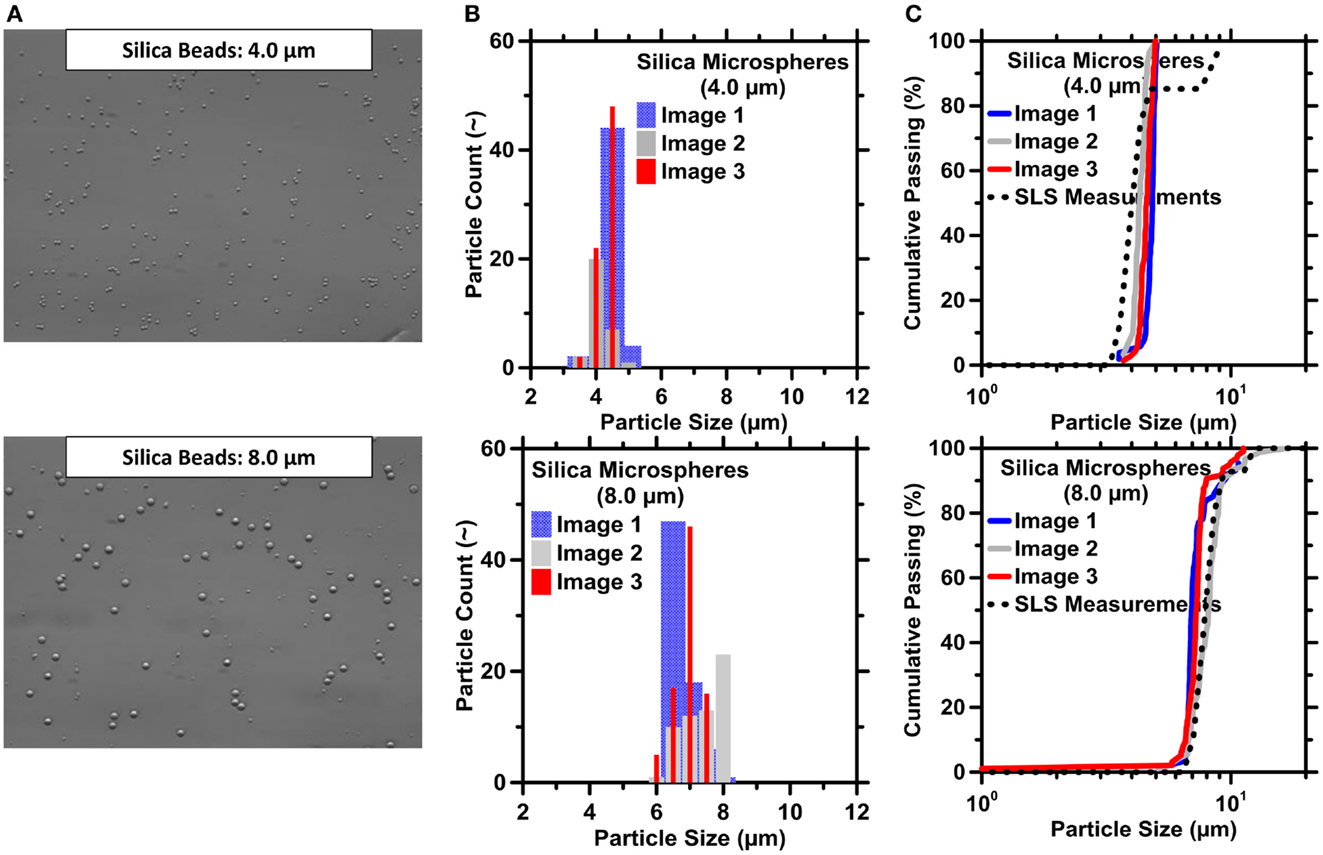
Figure 5. Image capture and processing routines for size-classified silica microspheres. (A) Images of silica microspheres with a size of 4.0 μm (top) and 8.0 μm (bottom). (B) Particle count and (C) cumulative passing as a function of particle size. Here, particle size represents the volume-equivalent spherical diameter of the particles. The highest uncertainty in particle count based on replicate ICA is on the order of 8.7%. The uncertainty in particle size based on variations in the d50 of replicate images is in the order of 13.5%.
Results
Silica Microspheres
A series of experiments were conducted using the IMF devices to assess size selectivity and PYs for two mixtures of size-classified silica microspheres. Suspensions were prepared at a dilution of 5 gsolid/L of ethanol. The fluid-flow rate (Q) was fixed at 80 μL/min. Mixture M1 consisted of equal mass fractions of 1.5 and 8 μm microspheres, and mixture M2 consisted of equal mass fractions of 4.0 and 8.0 μm silica microspheres. The collection of microspheres in different outlets was analyzed as described in the Section “Image Analysis for Characterizing IMF Separations.”
For M1, the smaller particles (1.5 μm) collected in all outlets, while the large particles (8.0 μm) collected selectively in high-resistance outlets O6 and O7, as shown in Figure 6A. For M2, it was noted that both 4.0 and the 8.0 particles collected selectively in high-resistance outlets O6 and O7, with minor particle collections in other outlets (Figure 6B). Experiments for mixture M2 were repeated on two more occasions, wherein in one case results similar to the ones described above were observed. However, in the other repetition, it was found that both 4 and 8 μm particles collected selectively in outlets O1 and O2 (of higher resistance) with minor particle collections in other outlets. Therefore, the results from these experiments suggest that in binary mixtures of small and large size-classified particles, the larger particles (≥4 μm) selectively collect in the outlets of higher resistance whereas small particles (<4 μm) collect in all outlets. It is worth noting that despite the symmetry in the device geometry, collection of large particles was biased on one side (either O1 and O2 or O6 and O7) with negligible collection of particles on the symmetrical outlets on the other side. The reason for this asymmetrical collection is not known at this point. However, it can be speculated that there may be some bias to which of the symmetric high-resistance outlets particles collect in due to non-uniform initial conditions between experiments. For example, the settling of silica microspheres in the inlet tubing prior to entry into the device could introduce a bias, disrupt inertial focusing, and hence result in the asymmetrical collection of particles. While magnetic stirring was used to minimize such effects, their elimination is not assured.
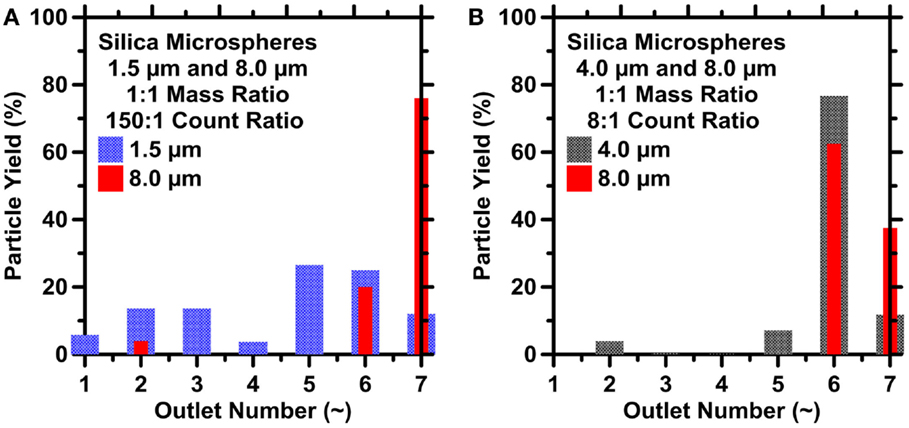
Figure 6. The particle yield at different outlets for suspensions prepared using 1:1 mass ratio mixtures of: (A) 1.5 and 8.0 μm and (B) 4.0 and 8.0 μm silica microspheres. The highest uncertainty in the particle count, and hence particle yield based on ICA on replicate images is on the order of 9.8% for (A) and 11% for (B), respectively.
Selective focusing of only the larger particles like that shown in Figure 6 was also reported by Bhagat et al. (2009). In their study, particle extractions were accomplished using IMF devices with channel dimensions of 20 μm × 50 μm (W × H) for mixtures of 0.59 and 1.9 μm particles. While the 1.9 μm particles were extracted in the outlets with higher resistances, the smaller 0.59 μm particles remained unfocused and collected in all outlets. Bhagat et al. (2009) reported that smaller particles failed to acquire their equilibrium positions because of: (i) the low particle Reynolds number, (ii) the small aP/LC ratio, which resulted in weak inertial lift forces, and (iii) the finite length of the focusing channel. They suggested that the smaller particles would acquire inertial equilibrium positions at higher fluid-flow rates (Figure 1A). Alternatively, longer microchannels would provide a greater distance over which the smaller particles could reach their equilibrium positions (Figure 1B). However, it should be noted that particle shape also influences inertial lift forces, and thus equilibrium particle positions, in IMF separations. This aspect is revisited later.
Limestone and Fly-Ash Powders
Measurable size-based separations were achieved for both limestone and FA as shown in Figure 7. The size distribution of particles accumulated in a given outlet was similar to that collected in its symmetric outlet (Figures 7A,B). The cumulative distributions in Figures 7A,B appear to be quite similar among outlets O2, O3, and O4. However, the selectivity among these outlets is more readily observed in terms of the median diameter of the collection in each outlet, as shown in Figures 7C,D. The median diameter (d50, μm) of the limestone or FA particles collected in a given outlet expectedly increases with decreasing outlet resistance.
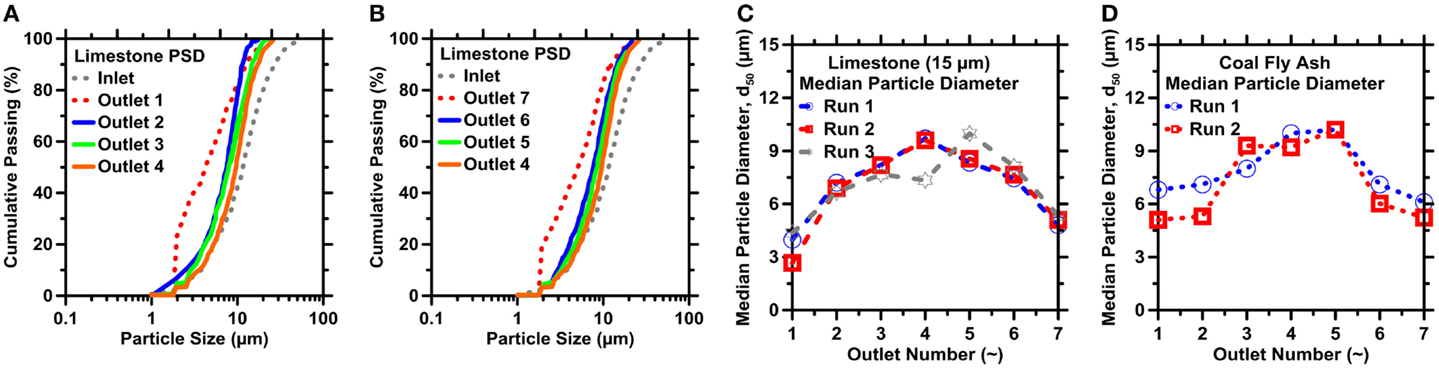
Figure 7. Particle size distributions (PSDs) of limestone measured by ICA for outlets: (A) limestone O1–O4 and (B) FA collected in different outlets O4–O7. The median diameter (d50) of (C) limestone and (D) FA particles as retrieved from different outlets. The uncertainty in the d50 values, hence the particle sizes, as determined from ICA on replicate images is on the order of 7% for limestone and 16% for coal fly ash, respectively.
As shown in Figures 8A,B, the overall dispersion in the sizes of particles collected (across the entire size span) in all outlets reduces by ≥40% compared to that of the inlet. This reduction in the DR value translates to ≈1.65× increase in the particle’s specific surface area. The DR, defined by Eq. 6, varies by about 10% from one run to the next, but an outlet’s DR is generally smaller in higher-resistance outlets. For example, DR varies between 0.32 and 0.40 in outlet O2, but varies between about 0.45 and 0.60 in outlet O4. As described earlier, however, the smallest particles in either powder (i.e., less than about 3 μm in diameter) were not well-focused in any of the experiments because of limitations in IMF device design. As a result, the smaller particles accumulated in all the outlets and prevented yet lower DR values from being realized. Finally, the highest yields (i.e., quantified in terms of particle counts) of both fly-ash and limestone particles were achieved in outlets 2 and 6 (see Figures 9A,B).
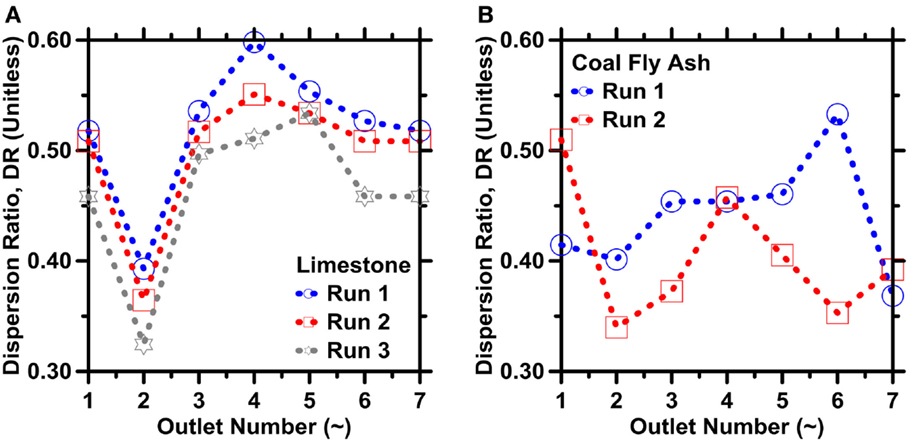
Figure 8. The dispersion ratio for: (A) limestone and (B) FA particles as retrieved from the different device outlets. The highest uncertainty in DR based on ICA on replicate images is on the order of 10% for limestone and 17% for coal fly ash, respectively.
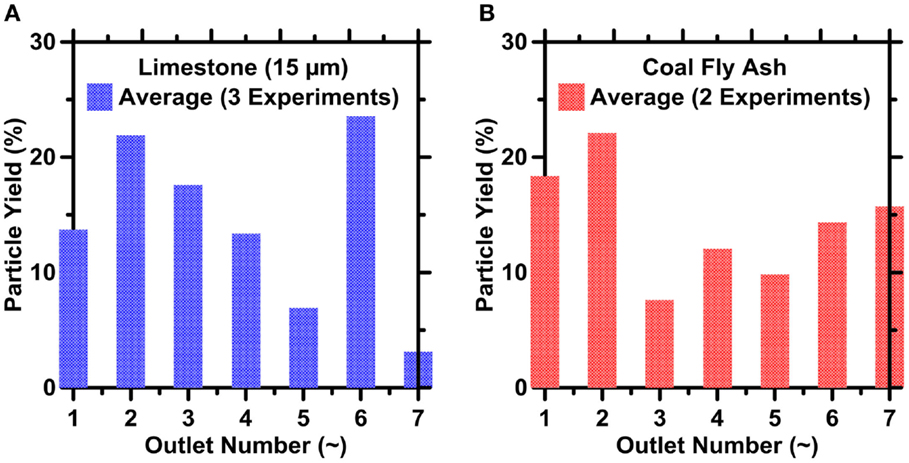
Figure 9. The particle yields for (A) limestone and (B) FA particles as retrieved from the different IMF device outlets. The highest uncertainty in the particle count, and hence particle yield based on ICA on replicate images is on the order of 10% for limestone and 21% for coal fly ash, respectively.
Ordinary Portland Cement Powders
The results for IMF-based separation of the OPC powder are summarized in Figure 10. These results are similar to those obtained for limestone and coal fly ash as shown in Figures 7–9. Figure 10A shows that OPC particles smaller than 5 μm accumulated preferentially in the highest-resistance outlets O1 and O7, and particles larger than 10 μm accumulated primarily in the lower-resistance outlets O3, O4, and O5. Particles with sizes between these extremes accumulated preferentially in outlets O2 and O6. The PSDs in symmetrically equivalent outlets are once again similar, as shown in Figures 10A,B. As observed for limestone, the DR of OPC particles accumulated in an outlet tends to increase with decreasing outlet resistance, as shown in Figure 8B.
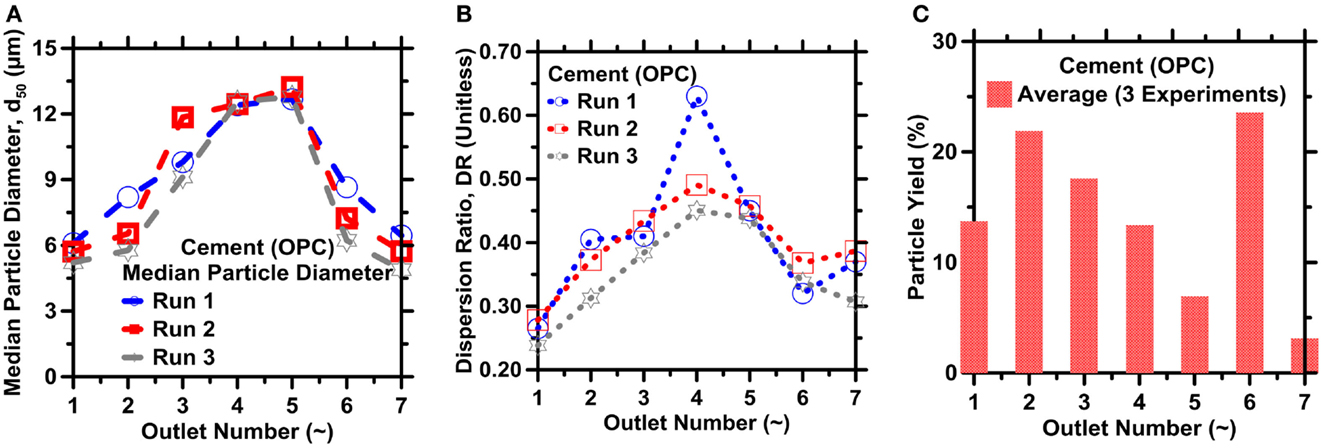
Figure 10. (A) Median diameter (d50), (B) dispersion ratio, and (C) average particle yield for OPC particles retrieved from the different outlets. Excellent repeatability is observed across all three repetitions (runs). The highest uncertainty in the d50, and hence the particle sizes, the DR value and the particle count (and particle yield) as determined from ICA on replicate images is on the order of 15, 10, and 18.0%, respectively.
Particles observed in the higher-resistance outlets O1, O2, and in their symmetric equivalents O6 and O7, had DRs between 0.24 and 0.38, which represent a considerable narrowing compared to the inlet distribution, as evident from 2.83× and 1.60× increases in the solid specific surface areas, respectively. By contrast, the lower-resistance outlets O3, O4, and O5 had DRs between 0.40 and 0.60, indicative of 1.56× and 1.21× increases in the solid specific surface areas, respectively. Once again, the highest PYs were achieved in outlets O2 and O6 (Figure 10C). Substantial changes in the IMF device design would be required to produce significantly narrower distributions in each outlet, primarily because of the established inability of the smallest particles to achieve inertial equilibrium positions in the device used.
The Roles of Suspension Concentration and Flow Rate
The solid loading in suspension (Vf) and the fluid-flow rate (Q) are both likely to influence the DRs and PYs obtained by IMF separations (Figure 1). With that in mind, several additional experiments were performed to better understand their effects on limestone powder separations. Three limestone powder suspensions in ethanol were prepared with solid concentrations of 2.5, 5.0, or 10.0 g/L, and IMF separations were performed with all other process parameters fixed as described in Section “Limestone and Fly Ash Powders.” Figure 11A shows that the median diameter of particles collected in a given outlet is approximately independent of solid concentration and similar to that already observed in Figure 7C. By contrast, the DRs in most of the outlets are far more influenced by the suspension concentration, as shown in Figure 11B. Specifically, the DR in most outlets decreases with decreasing solid concentration. That is, reducing the suspension (solid) concentration causes the particles in a given outlet to be banded within a narrower size range. However, the improvement in size selectivity comes at the expense of lower particle counts in the outlets (i.e., particle yields), corresponding to lower numbers of particles per unit volume flowing through the system (Figure 11C).
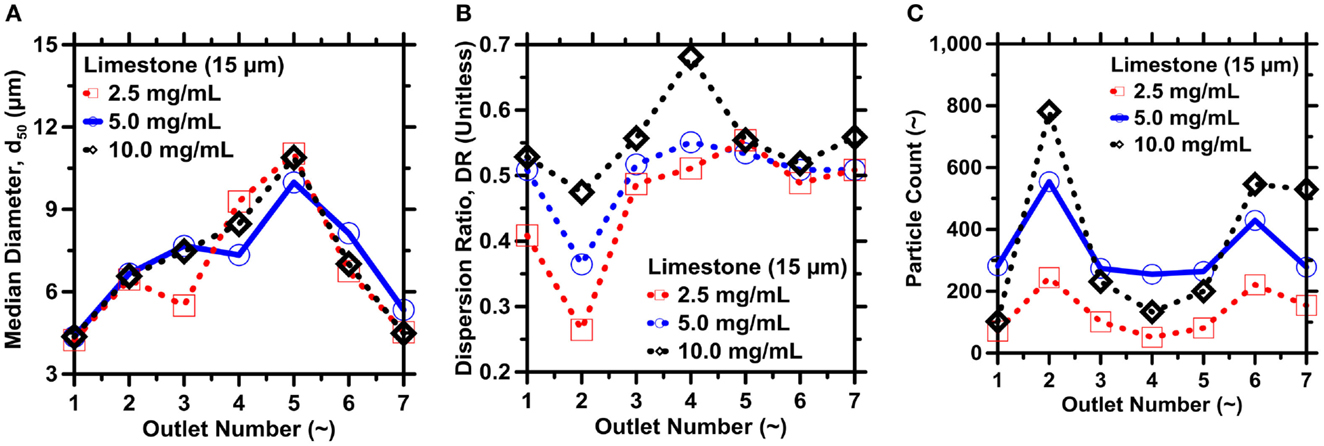
Figure 11. (A) Median particle diameter, (B) dispersion ratio, and (C) particle yields at the different outlets for different solid loadings. The solid used was limestone; for dilutions indicated in the legends. The highest uncertainty in d50, DR, and particle yield as determined from ICA on replicate images are on the order of: 4, 9, and 10.5%, respectively.
To isolate the effects of the flow rate on the separations, a limestone suspension with solid concentration of 5 g/L was injected into the outlet at a rate of 55, 80, or 135 μL/min. Again, the median diameter of particles collected in a given outlet is insensitive to the flow rate, as shown in Figure 12A. By contrast, Figure 12B shows that the particle DR in all outlets, and especially in the higher-resistance outlets, decreases with increasing flow rate(s). Improved size refinement is expected at higher flow rates because the higher velocities provide greater inertial lift forces, and greater forces enable particles to acquire their inertial equilibrium more readily, as discussed in the Section “IMF Device Design, Fabrication Process, and Selection of Operating Variables.” Once again, however, greater refinement comes at the expense of reduced particle counts. As shown in Figure 12C, the highest flow rate decreases the particle count in all outlets except O4. It appears as though the lower yield is caused, not by any influence of inertial forces, but primarily due to clogging within the device. Here, the clogging of particles was observed to mostly occur in close proximity to the entry point of the particles into the tubing. It is expected that higher fluid flows push a larger number of particles (and especially large particles) into the tubing in a short period of time, thereby, giving rise to chances of particle-clogging close to the inlet. The intermediate flow rate 80 μL/min appears to provide a balanced trade-off of selectivity and yield; in fact, both the refinement and yield are improved compared to the lowest flow rate of 55 μL/min.
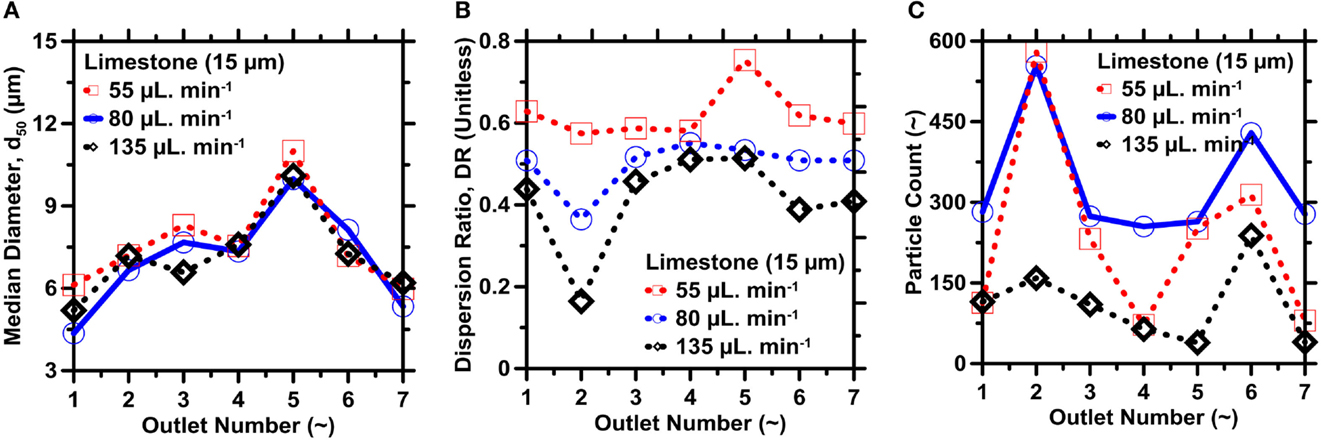
Figure 12. (A) Median particle diameter, (B) dispersion ratio, and (C) particle yield of limestone in different outlets for different flow rates. The highest uncertainty in d50, DR, and the particle yield as determined from ICA on replicate images are on the order of 5, 7, and 9%, respectively.
Particle migration behaviors with respect to change in the fluid-flow rate as observed in our experiments are in good agreement with the results reported by Bhagat et al. (2009). In their study conducted using both square and rectangular microchannels, the authors demonstrated that particles migrated to their equilibrium positions faster and within smaller fractions of the total length of microchannels at higher fluid-flow velocities. It was proposed that at low fluid-flow velocities [i.e., quantified in terms of the particle Reynolds number <10 (Bhagat et al., 2009)], Brownian diffusion is dominant with respect to inertial lift forces, especially for smaller particles, causing particles to cross streamlines and remain unfocussed. However, at higher fluid-flow velocities, inertial lift forces become dominant and result in faster migration of particles to their equilibrium positions. The authors, however, noted that even at high fluid-flow velocities, larger solid loadings could give rise to particle–particle interactions, which can invoke the diffusion-like migration of larger particles and, consequently, cause particles to remain unfocussed.
Discussion
The results obtained on all the powder separations are in excellent agreement with those reported by Yamada and Seki (2005) and by Zhou et al. (2013). For example, Yamada and Seki conducted experiments using a 40:3 mass ratio mixture of 1.0 and 2.1 μm polymer microspheres in a suspension with 0.002% mass loading. In their study, small amounts of liquid were repeatedly removed from the microchannel through side branch channels to align and concentrate particles close to the channel walls as they continued to move downstream. They reported preferential accumulation of the 1.0 μm particles in higher-resistance (outer channels) outlets, as they rapidly migrated close to the channel walls and of 2.1 μm particles in lower-resistance (inner channels) outlets, as they took longer to migrate close to the channel walls (Yamada and Seki, 2005; Zhou et al., 2013). This behavior is similar to that observed in our study, wherein smaller particles migrated rapidly to the channel walls and collected in outer channels (higher resistance) whereas larger particles remained close to the channel centerline until collected in the inner channels (lower resistance). However, it should be noted that in the work of Yamada and Seki and Zhou et al. (Yamada and Seki, 2005), the collection of particles was employed in the non-inertial regime and, as such, particle collections were merely based on their migration with respect to the channel walls (or centerline) before they acquired their equilibrium positions. Contrastingly, in our work, the IMF devices are designed with microchannel lengths tuned to allow particles to acquire their inertial equilibrium positions before collection.
Zhou et al. (2013) used a combination of microchannels with different aspect ratios to study the inertial focusing behavior of 9.94 and 20 μm particles suspended in a liquid with 0.025% mass loading. They reported that for a fluid-flow rate of 100 μL/min, the 20 μm particles were found predominantly in lower-resistance outlets and 9.94 μm particles in higher-resistance outlets. These results were explained in terms of the influence of particle size on the magnitude of the inertial lift forces. It was suggested that smaller particles are subjected to smaller wall-induced lift, so they equilibrate closer to the channel walls than larger particles (Zhou et al., 2013). Even though this explanation ignores the effect of shear-gradient lift forces, Eqs 1c,d indeed suggest that for a given channel aspect ratio, the magnitude of wall-induced lift forces is proportional to particle size. Zhou et al. (2013) also suggested that larger particles experience a greater rotation-induced lift that causes them to migrate away from smaller particles and toward the channel centerline within the IMF device.
Particle shape is likely to be an important factor in determining IMF lift forces and focusing behavior, although its influences have received less attention than those of particle size. Masaeli et al. (2012) recently showed that particles suspended in fluids acquired different inertial equilibrium positions depending on their aspect ratios (AR). Specifically, particles having larger aspect ratio have a greater angular momentum than spheres under the influence of hydrodynamic forces. In addition, the wall-induced lift force on an irregularly shaped particle depends on orientation; the wall-induced lift force is larger when a long edge is perpendicular to the channel walls than when it is parallel to the walls. When these effects are averaged over many rotations, particles with high aspect ratio focus close to the channel centerline and therefore collect in inner-more outlets than would be expected for spheres (Masaeli et al., 2012). These shape effects are broadly consistent with the results of the present study, in which larger particles accumulate in higher-resistance outlets when they are spherical (e.g., for silica microspheres, as shown in Figure 6), but do tend to accumulate in lower-resistance outlets when they have irregular shapes (e.g., for limestone, FA, and OPC, as shown in Figures 7–10). Furthermore, it can be speculated that the outer channels (e.g., O1, O2, O6, and O7) pull fluid closer to the channel walls allowing particles to migrate close to the channel walls. Particles with small rotational diameters are capable of occupying these positions and, therefore, collect in outer channels. Particles with large rotational diameters, on the other hand, are not able to occupy positions close to the channel walls and, as such, remain close to channel centerline until collected in the inner outlets (O3, O4, and O5).
However, the irregular shape distribution of the cementing powder particles is not enough to explain the focusing behavior observed in this study. This can be said in light of the observed migration behavior of coal fly-ash particles (Figures 7–9), which despite being nearly spherical (Figure 4) exhibit migration behavior similar to that of non-spherical OPC and limestone particles and in contrast to that of silica microspheres. While coal fly-ash particles are broadly spherical, they contain plerospheres and pores on their surfaces (Fisher et al., 1978) which may affect hydrodynamic forces at a micro-scale – further investigation is warranted to study these effects in detail. It is expected that another factor must be responsible for the inverse relation between particle size and outlet collection location observed for the limestone, fly ash, and cement powders. We suggest that the wide PSD, resulting in large particle numbers, of these powders is at least partially responsible. When particles having a very broad size range are introduced into a fluid streamline, they attempt to migrate to equilibrium positions as a function of their size and shape. Particle collisions, either with other particles or with the channel walls, could frustrate the ability of some particles to achieve equilibrium positions. The effect of collisions should be negligible in dilute suspensions, but may become important or even decisive at higher solid concentrations. In general, the number density of smaller particles is much greater in these cementitious powders than that of larger particles, so collisions between two large particles would be less probable than collisions involving small particles. The collision of two small particles could potentially perturb the migration of both particles significantly, but momentum conservation implies that a collision between one large and one small particle would significantly perturb the path of only the small particle. Therefore, in general, collisions would more likely inhibit smaller particles to focus at equilibrium positions than larger particles. If the smaller particles remain unfocused by collisions, they would accumulate more evenly in all the outlets and thereby resulting in wider dispersions especially in the lower-resistance outlets where only larger particles are expected. This reasoning is in good agreement with the observations of this study. Furthermore, the notion that particle crowding and collisions would degrade the IMF separations is supported by the observation that higher suspension concentrations correspond to wider size distributions in the outlets (Figure 11B). Again, higher solid concentrations increase the likelihood of collisions among the particles and would tend to impede the migration of the smaller particles more than larger particles toward their equilibrium positions within the channel.
Summary and Conclusion
This work has explored the feasibility of IMF-based methods for size fractionation of mineral particulates having irregular shapes and size distributions spanning several orders of magnitude. When operated at high flow rates, IMF devices are able to separate particulates according to size into overlapping classes, each of which has a narrower size distribution than the parent (i.e., the input) particle system. For some size classes, the spread of the size distribution was reduced by about 75%. Optical ICA methods have been developed to measure the quality of the separations in terms of a DR of the SDs of the output to the input size distributions. Particle shape, the width of the input size distribution, and the solids concentration in suspension all influence the separation quality at a given flow rate. Suspension properties and flow conditions that increase the frequency of interparticle collisions, or that produce multiple equilibrium positions for particles of equivalent size, will degrade the quality of separations by keeping the smaller particles unfocused. These aspects, especially those of particle shape effects, remain worthy of further research and attention.
Conflict of Interest Statement
The authors declare that the research was conducted in the absence of any commercial or financial relationships that could be construed as a potential conflict of interest.
Acknowledgments
The authors acknowledge financial support for this research provisioned by: The National Institute of Standards and Technology through the Exploratory Research Program (NIST-EARP, EL: 70NSNB13H005), National Science Foundation (CAREER Award # 1253269), and the University of California, Los Angeles (UCLA). The contents of this paper reflect the views and opinions of the authors, who are responsible for the accuracy of the data presented herein. This research was conducted in the Laboratory for Microfluidic Biotechnology, the Laboratory for the Chemistry of Construction Materials (LC2), and the Molecular Instrumentation Center (MIC) at the UCLA. As such, the authors acknowledge the support that has made these laboratories and their operations possible. The authors would like to acknowledge Jeffrey W. Bullard (NIST) for useful discussions and his review of this paper, and his support for this work in its foundational stages. The last author would also like to acknowledge discretionary support for this research provided by the Edward K. and Linda L. Rice Endowed Chair in Materials Science.
Supplementary Material
The Supplementary Material for this article can be found online at https://www.frontiersin.org/article/10.3389/fmats.2015.00048
Footnotes
- ^Certain commercial materials and equipment are identified to adequately specify experimental procedures. In no case does such identification imply recommendation or endorsement by University of California, Los Angeles (UCLA) or the National Institute of Standards and Technology (NIST), nor does it imply that the items identified are necessarily the best available for the purpose.
- ^Standard cement chemistry notation is used. As per this notation: C = CaO, S = SiO2, A = Al2O3, H = H2O, F = Fe2O3. Na2O equivalent represents the alkali oxide content in cement represented as a function of K2O and Na2O.
References
Anderson, J. R., Chiu, D. T., Jackman, R. J., Cherniavskaya, O., McDonald, J. C., Wu, H., et al. (2000). Fabrication of topologically complex three-dimensional microfluidic systems in PDMS by rapid prototyping. Anal. Chem. 72, 3158–3164. doi: 10.1021/ac9912294
Bentz, D. P., Garboczi, E. J., Haecker, C. J., and Jensen, O. M. (1999). Effects of cement particle size distribution on performance properties of Portland cement-based materials. Cem. Concr. Res. 29, 1663–1671. doi:10.1016/S0008-8846(99)00163-5
Berry, E. E., Hemmings, R. T., Langley, W. S., and Carette, G. G. (1989). “Beneficiated fly ash: hydration, microstructure, and strength development in Portland cement systems,” in Fly Ash, Silica Fume, Slag, and Natural Pozzolans in Concrete, Vol. 114, ed. V. M. Malhotra (Trondheim: ACI Special Publicayion), 241–273.
Bhagat, A. A. S., Kuntaegowdanahalli, S. S., and Papautsky, I. (2008). Continuous particle separation in spiral microchannels using dean flows and differential migration. Lab Chip 8, 1906–1914. doi:10.1039/b807107a
Bhagat, A. A. S., Kuntaegowdanahalli, S. S., and Papautsky, I. (2009). Inertial microfluidics for continuous particle filtration and extraction. Microfluid. Nanofluidics 7, 217–226. doi:10.1007/s10404-008-0377-2
Bullard, J. W., and Garboczi, E. J. (2004). Shape analysis of a reference cement. Cem. Conc. Res. 34, 1933–1937. doi:10.1016/j.cemconres.2004.01.006
Chen, C. S., Breslauer, D. N., Luna, J. I., Grimes, A., Chin, W. C., Lee, L. P., et al. (2008). Shrinky-dink microfluidics: 3D polystyrene chips. Lab Chip 8, 622–624. doi:10.1039/b719029h
Cheng, X., Irimia, D., Dixon, M., Sekine, K., Demirci, U., Zamir, L., et al. (2007). A microfluidic device for practical label-free CD4+ T cell counting of HIV-infected subjects. Lab Chip 7, 170–178. doi:10.1039/B612966H
Chun, B., and Ladd, A. J. C. (2006). Inertial migration of neutrally buoyant particles in a square duct: an investigation of multiple equilibrium positions. Phys. Fluids 18, 031704. doi:10.1063/1.2176587
Di Carlo, D., Edd, J. F., Humphry, K. J., Stone, H. A., and Toner, M. (2009). Particle segregation and dynamics in confined flows. Phys. Rev. Lett. 102, 094503. doi:10.1103/PhysRevLett.102.094503
Di Carlo, D., Edd, J. F., Irimia, D., Tompkins, R. G., and Toner, M. (2008). Equilibrium separation and filtration of particles using differential inertial focusing. Anal. Chem. 80, 2204–2211. doi:10.1021/ac702283m
Di Carlo, D., Irimia, D., Tompkins, R. G., and Toner, M. (2007). Continuous inertial focusing, ordering, and separation of particles in microchannels. Proc. Natl. Acad. Sci. U.S.A 104, 18892–18897. doi:10.1073/pnas.0704958104
Earle, J. H., and Olsen, D. (1998). Engineering Design Graphics: AutoCAD Release 14. Boston: Addison-Wesley Longman Publishing Company, Inc.
Enger, J., Goksör, M., Ramser, K., Hagberg, P., and Hanstorp, D. (2004). Optical tweezers applied to a microfluidic system. Lab Chip 4, 196–200. doi:10.1039/b307960k
Fisher, G. L., Prentice, B. A., Silberman, D., Ondov, J. M., Biermann, A. H., Ragaini, R. C., et al. (1978). Physical and morphological studies of size-classified coal fly ash. Environ. Sci. Tech. 12, 447–451. doi:10.1021/es60140a008
Giddings, J. C. (1984). Field-flow fractionation. Sep. Sci. Technol. 19, 831–847. doi:10.1080/01496398408068596
Gijs, M. A. (2004). Magnetic bead handling on-chip: new opportunities for analytical applications. Microfluid. Nanofluidics 1, 22–40. doi:10.1007/s10404-004-0010-y
Gossett, D. R., and Di Carlo, D. (2009). Particle focusing mechanisms in curving confined flows. Anal. Chem. 81, 8459–8465. doi:10.1021/ac901306y
Hansson, J., Karlsson, J. M., Haraldsson, T., Brismar, H., van der Wijngaart, W., and Russom, A. (2012). Inertial microfluidics in parallel channels for high-throughput applications. Lab Chip 12, 4644–4650. doi:10.1039/c2lc40241f
Hou, H. W., Bhagat, A. A. S., Chong, A. G. L., Mao, P., Tan, K. S. W., Han, J., et al. (2010). Deformability based cell margination – a simple microfluidic design for malaria-infected erythrocyte separation. Lab Chip 10, 2605–2613. doi:10.1039/c003873c
Hur, S. C., Henderson-MacLennan, N. K., McCabe, E. R., and Di Carlo, D. (2011). Deformability-based cell classification and enrichment using inertial microfluidics. Lab Chip 11, 912–920. doi:10.1039/c0lc00595a
Hur, S. C., Tse, H. T. K., and Di Carlo, D. (2010). Sheathless inertial cell ordering for extreme throughput flow cytometry. Lab Chip 10, 274–280. doi:10.1039/b919495a
Kim, T. H., Yoon, H. J., Stella, P., and Nagrath, S. (2014). Cascaded spiral microfluidic device for deterministic and high purity continuous separation of circulating tumor cells. Biomicrofluidics 8, 064117. doi:10.1063/1.4903501
Kim, Y. W., and Yoo, J. Y. (2008). The lateral migration of neutrally-buoyant spheres transported through square microchannels. J. Micromech. Microeng. 18, 065015. doi:10.1088/0960-1317/18/6/065015
Kumar, A., Bishnoi, S., and Scrivener, K. L. (2012). Modelling early age hydration kinetics of alite. Cem. Concr. Res. 42, 903–918. doi:10.1016/j.cemconres.2012.03.003
Lee, M. G., Shin, J. H., Choi, S., and Park, J. K. (2014). Enhanced blood plasma separation by modulation of inertial lift force. Sens. Actuators B Chem. 190, 311–317. doi:10.1016/j.snb.2013.08.092
Lee, W. C., Bhagat, A. A. S., Huang, S., Van Vliet, K. J., Han, J., and Lim, C. T. (2011). High-throughput cell cycle synchronization using inertial forces in spiral microchannels. Lab Chip 11, 1359–1367. doi:10.1039/c0lc00579g
Lothenbach, B., Le Saout, G., Gallucci, E., and Scrivener, K. (2008). Influence of limestone on the hydration of Portland cements. Cem. Concr. Res. 38, 848–860. doi:10.1016/j.cemconres.2008.01.002
Lothenbach, B., Scrivener, K., and Hooton, R. D. (2011). Supplementary cementitious materials. Cem. Concr. Res. 41, 1244–1256. doi:10.1016/j.cemconres.2010.12.001
Martel, J. M., and Toner, M. (2014). Inertial focusing in microfluidics. Annu. Rev. Biomed. Eng. 16, 371–396. doi:10.1146/annurev-bioeng-121813-120704
Masaeli, M., Sollier, E., Amini, H., Mao, W., Camacho, K., Doshi, N., et al. (2012). Continuous inertial focusing and separation of particles by shape. Phys. Rev. X 2, 031017. doi:10.1103/PhysRevX.2.031017
Matas, J. P., Morris, J. F., and Guazzelli, É (2004). Inertial migration of rigid spherical particles in Poiseuille flow. J. Fluid Mech. 515, 171–195. doi:10.1017/S0022112004000254
Nelder, J. A., and Mead, R. (1965). A simplex method for function minimization. Comp. J. 7, 308–313. doi:10.1093/comjnl/7.4.308
Oey, T., Kumar, A., Bullard, J. W., Neithalath, N., and Sant, G. (2013). The filler effect: the influence of filler content and surface area on cementitious reaction rates. J. Am. Ceram. Soc. 96, 1978–1990. doi:10.1111/jace.12264
Olsson, D. M., and Nelson, L. S. (1975). The Nelder-Mead simplex procedure for function minimization. Technometrics 17, 45–51. doi:10.1080/00401706.1975.10489269
Pamme, N. (2007). Continuous flow separations in microfluidic devices. Lab Chip 7, 1644–1659. doi:10.1039/b712784g
Pratt, E. D., Huang, C., Hawkins, B. G., Gleghorn, J. P., and Kirby, B. J. (2011). Rare cell capture in microfluidic devices. Chem. Eng. Sci. 66, 1508–1522. doi:10.1016/j.ces.2010.09.012
Schneider, C. A., Rasband, W. S., and Eliceiri, K. W. (2012). NIH Image to ImageJ: 25 years of image analysis. Nat. Methods 9, 671–675. doi:10.1038/nmeth.2089
Segre, G., and Silberberg, A. (1962a). Behaviour of macroscopic rigid spheres in Poiseuille flow part 1. Determination of local concentration by statistical analysis of particle passages through crossed light beams. J. Fluid Mech. 14, 115–135. doi:10.1017/S002211206200110X
Segre, G., and Silberberg, A. (1962b). Behaviour of macroscopic rigid spheres in Poiseuille flow part 2. Experimental results and interpretation. J. Fluid Mech. 14, 136–157. doi:10.1017/S0022112062001111
Stone, H. A., Stroock, A. D., and Ajdari, A. (2004). Engineering flows in small devices: microfluidics toward a lab-on-a-chip. Annu. Rev. Fluid Mech. 36, 381–411. doi:10.1146/annurev.fluid.36.050802.122124
Tabeling, P. (2014). Recent progress in the physics of microfluidics and related biotechnological applications. Curr. Opin. Biotechnol. 25, 129–134. doi:10.1016/j.copbio.2013.11.009
Tiessen, H. J. W. B., and Stewart, J. W. B. (1983). Particle-size fractions and their use in studies of soil organic matter: II. Cultivation effects on organic matter composition in size fractions. Soil Sci. Soc. Am. J. 47, 509–514. doi:10.2136/sssaj1983.03615995004700030023x
Wong, P. K., Chen, C. Y., Wang, T. H., and Ho, C. M. (2004). Electrokinetic bioprocessor for concentrating cells and molecules. Anal. Chem. 76, 6908–6914. doi:10.1021/ac049479u
Wu, Z., Willing, B., Bjerketorp, J., Jansson, J. K., and Hjort, K. (2009). Soft inertial microfluidics for high throughput separation of bacteria from human blood cells. Lab Chip 9, 1193–1199. doi:10.1039/b817611f
Yamada, M., and Seki, M. (2005). Hydrodynamic filtration for on-chip particle concentration and classification utilizing microfluidics. Lab Chip 5, 1233–1239. doi:10.1039/b509386d
Zhang, J., Yan, S., Sluyter, R., Li, W., Alici, G., and Nguyen, N. T. (2014a). Inertial particle separation by differential equilibrium positions in a symmetrical serpentine micro-channel. Sci. Rep. 4, 4527. doi:10.1038/srep04527
Zhang, J., Yan, S., Alici, G., Nguyen, N. T., Di Carlo, D., and Li, W. (2014b). Real-time control of inertial focusing in microfluidics using dielectrophoresis (DEP). RSC Adv. 4, 62076–62085. doi:10.1039/C4RA13075H
Keywords: microfluidics, inertial forces, powder processing, particle sorting, cement
Citation: Kumar A, Lewis P, Balonis M, Di Carlo D and Sant G (2015) On the application of inertial microfluidics for the size-based separation of polydisperse cementitious particulates. Front. Mater. 2:48. doi: 10.3389/fmats.2015.00048
Received: 03 March 2015; Accepted: 03 June 2015;
Published: 16 June 2015
Edited by:
P. Davide Cozzoli, University of Salento, ItalyReviewed by:
Sungyoung Choi, Kyung Hee University, South KoreaNam-Trung Nguyen, Griffith University, Australia
Copyright: © 2015 Kumar, Lewis, Balonis, Di Carlo and Sant. This is an open-access article distributed under the terms of the Creative Commons Attribution License (CC BY). The use, distribution or reproduction in other forums is permitted, provided the original author(s) or licensor are credited and that the original publication in this journal is cited, in accordance with accepted academic practice. No use, distribution or reproduction is permitted which does not comply with these terms.
*Correspondence: Dino Di Carlo, Microfluidics Biotechnology Laboratory, Department of Bioengineering, University of California Los Angeles, 420 Westwood Plaza, Los Angeles, CA, USA, dicarlo@seas.ucla.edu;
Gaurav Sant, Laboratory for the Chemistry of Construction Materials (LC2), Department of Civil and Environmental Engineering, University of California Los Angeles, 420 Westwood Plaza, Los Angeles, CA 90095, USA, gsant@ucla.edu