Design of Activated Carbon/Activated Carbon Asymmetric Capacitors
 Isabel Piñeiro-Prado1
 David Salinas-Torres1
 Ramiro Ruiz-Rosas2
 Emilia Morallón2*
  Diego Cazorla-Amorós1
- 1Departamento de Química Inorgánica, Instituto Universitario de Materiales, Universidad de Alicante, Alicante, Spain
- 2Departamento de Química Física, Instituto Universitario de Materiales, Universidad de Alicante, Alicante, Spain
Supercapacitors are energy storage devices that offer a high power density and a low energy density in comparison with batteries. Their limited energy density can be overcome by using asymmetric configuration in mass electrodes, where each electrode works within their maximum available potential window, rendering the maximum voltage output of the system. Such asymmetric capacitors are optimized using the capacitance and the potential stability limits of the electrodes, with the reliability of the design largely depending on the accuracy and the approach taken for the electrochemical characterization. Therefore, the performance could be lower than expected and even the system could break down, if a well thought out procedure is not followed.
In this work, a procedure for the development of asymmetric supercapacitors based on activated carbons is detailed. Three activated carbon materials with different textural properties and surface chemistry have been systematically characterized in neutral aqueous electrolyte. The asymmetric configuration of the masses of both electrodes in the supercapacitor has allowed to cover a higher potential window, resulting in an increase of the energy density of the three devices studied when compared with the symmetric systems, and an improved cycle life.
Introduction
The energy storage mechanism in supercapacitors relies on the electrostatic interaction arising between the polarized surface of the porous carbon electrode and the ions of the electrolyte that forms the electric double layer (Conway, 1999; Yu et al., 2013). This storage mechanism has a smaller response time than batteries and fuel cells to changes in the potential applied to the electrodes (i.e., charge/discharge of the devices). Consequently, supercapacitors can be charged only in a few minutes, they show superior power characteristics than conventional secondary batteries and fuel cells, and they also have a longer lifetime. Based on the above considerations, the supercapacitors can be used to deliver a high power demand during a short time, without damaging the power train system, when hybrid-electric and fuel cell vehicles are accelerated and to recover the energy when they are braked. The main limitation for their widespread commercialization is related to their low energy density, which is dictated by the capacitance of the electrodes and the voltage of the cell (Inagaki et al., 2014). In order to increase the number of applications where supercapacitors could be used, it is necessary to expand either the capacitance of the materials being used as electrodes or the working voltage of the device. In consequence, it is possible to find a large number of works that are oriented to increase the capacitance and the potential window of electrodes and solvent (Bleda-Martínez et al., 2005; Vaquero et al., 2013; Wu et al., 2013).
The capacitance of an electrode is related to the surface area available for the formation of the charged double layer and inversely related to the distance between the ion and the polarized surface of the electrode (Yu et al., 2013). The available surface area is related to the wettability of the porosity of the electrode, which comes as a result of the combination of, on the one hand, the polarity and size of the molecules of the solvent and the ions that constitute the electrolyte, and on the other hand, the pore size and surface chemistry of the electrode. The pores of the electrode must show a similar size to that of the ions of the electrolyte to avoid ion sieving effects and to enhance the surface capacitance (Chmiola et al., 2006; Pandolfo and Hollenkamp, 2006; Raymundo-Piñero et al., 2006; Simon and Burke, 2008) and, in addition, a surface chemistry of the electrode that matches that of the solvent will help in delivering a high wettability of the surface of the porosity (Lin et al., 2009). Besides, faradaic reactions involving the surface groups of the electrodes can also contribute to the capacitance by means of the so-called “pseudocapacitance” contribution (Conway et al., 1997). This contribution can maximize the capacitance of certain advanced carbon materials (Itoi et al., 2014), and, though it is mainly found in aqueous-based electrolytes (Bleda-Martínez et al., 2005), it can also contribute to the capacitance of organic-based electrolytes (Nueangnoraj et al., 2015). Porous carbon materials are the best suited materials for achieving a high capacitance, since they combine high electrical conductivity, chemical and physical stability with a tunable pore structure and surface chemistry, which opens the door to prepare electrodes with tailored properties for maximizing the resulting capacitance. Among them, activated carbons are the most used nowadays due to their competitive cost. An extensive effort has been already realized in the development of optimized porous carbon materials (Simon and Gogotsi, 2008; Zhang and Zhao, 2009; Béguin et al., 2014; Inagaki et al., 2014; Ruiz-Rosas et al., 2014), and it is possible to argue that nowadays it is difficult to surpass the performance already achieved by the huge collection of reported electrode materials by only attending to the modification of the pore size distribution and surface chemistry of carbon materials, especially when the economic sustainability of the production process is considered.
The working voltage of supercapacitors is mainly dictated by the solvent employed in the formulation of the electrolytes. Tolerable working voltage for the most used electrolytes are around 1 V for aqueous-based electrolytes, 2.5–2.7 V for organic-based electrolytes and more than 4.0 V for ionic liquids electrolytes (Béguin et al., 2014). Thanks to their high cell voltage, organic-based electrolytes are used in the majority of commercial devices since they deliver a higher specific energy than aqueous system (Brandt and Balducci, 2014). Nevertheless, organic-based systems provide a lower specific power than supercapacitors based on water-based electrolytes, and aqueous systems would be desirable for economy, toxicity, and environmental reasons. It is important to note that the surface chemistry of carbon materials can be tuned in order to provide an overpotential for the decomposition of the solvents, which has been profited for achieving larger operating voltage windows in aqueous media (Gao et al., 2012; Salinas-Torres et al., 2013). This effect is especially significant in neutral media, and makes possible reaching voltages of 2.0 V, turning viable this environmental friendly, safe, and economic electrolyte.
Beyond the materials and the electrolytes, there exists design strategies that can enhance the energy density of supercapacitors, such as the hybrid and asymmetric configurations. The hybrid designs allow the combination of a pseudocapacitive and a capacitive electrodes in one device. This combination allows taking advantage of the high capacitances of pseudocapacitive materials, while the operational voltage window and cell capacitance is enhanced by the wise selection of a porous carbon material that takes the role of the electrode where the pseudocapacitive material shows no redox contribution and low stability. This configuration have been profited for the development of Li-ion capacitors that combines an activated carbon electrode with graphite (Khomenko et al., 2008) or crystalline intercalation compounds (Amatucci et al., 2001). Wide voltage in water-based electrolytes capacitors can be also achieved using in the same cell an electrode made with transition metal oxides (Cottineau et al., 2006; Khomenko et al., 2006) and conducting polymers (Laforgue et al., 2001; Salinas-Torres et al., 2013) supported over a carbon material and combined with an activated carbon electrode.
On the other hand, the asymmetric configuration can consist in either the combination of two different porous carbon materials in one device or in the use of the same porous carbon material in both electrodes, but with different electrode weights (Roldán et al., 2015). In the first case, using activated carbons with optimized surface chemistry for each electrode, the operating voltage of acid-based supercapacitors can be expanded up to 1.6 V (Khomenko et al., 2010), while those prepared in neutral aqueous electrolytes can reach outstanding voltage values as high as 2.0 V (Khomenko et al., 2006; Gao et al., 2012).
Lastly, a cell design implying mass asymmetry of electrodes constructed from the same material is the most economic and less demanding approach for maximizing the energy density of supercapacitors. It only requires the use of two different weights for each electrode; thus, it can be easily implemented in laboratory and in commercial preparation of supercapacitor. This approach relies on three steps: (i) performing the electrochemical characterization of the porous carbon material on the potential windows that they will work in the capacitor as positive or negative electrode, (ii) determining both the gravimetric capacitance and the electrochemical stability window for each electrode, and (iii) adjusting the weight ratio of the positive and negative electrodes for a full profit of the available electrochemical stability windows of both electrodes, therefore maximizing the operational voltage of the cell (Peng et al., 2010; Chae and Chen, 2012). This strategy has been successfully employed in rather different scenarios, as hybrid capacitors (Peng et al., 2010; Nueangnoraj et al., 2014), asymmetric in material capacitors (Khomenko et al., 2010) and asymmetric in mass capacitors (Chae and Chen, 2012).
In this work, we propose the use of the asymmetric in mass configuration for the development of supercapacitors in Na2SO4 solution employing three different activated carbons. These activated carbons consists in (i) an ultraporous activated carbon; (ii) the same ultraporous activated carbon after a thermal reduction treatment; (iii) a commercial activated carbon used in the formulation of commercial supercapacitor cells. Choosing a neutral electrolyte ensures a wide electrochemical voltage window of stability due to the higher overpotential for water decomposition in such media, though at the cost of the suppression of the majority of pseudocapacitive contribution from surface chemistry. It is also in consonance with the development of greener, safer, less toxic, and more economic supercapacitor devices. First, the design of the asymmetric supercapacitor is clearly detailed, followed by the physicochemical and electrochemical characterization of the activated carbons. Finally, capacitors have been constructed in accordance with the principles for asymmetric design, their performance have been determined, and the capacitors were submitted to a durability test for determining the reliability of the proposed design.
Materials and Methods
Activated Carbon Samples
Three activated carbon samples were used in this work. Two of them were synthesized by chemical activation with KOH and the other one was an activated carbon used as electrode in commercial supercapacitors (named ACM). A Spanish anthracite were used as precursor in the synthesized activated carbon, which was mixed with KOH using a ratio of 4:1 (activating agent/precursor) and then, it was heated at 5°C min−1 up to 750°C, which was kept for 2 h (sample named as Ank4). Detailed synthesis conditions are available in the literature (Lozano-Castelló et al., 2001).
The presence of metals can act as catalysts for the decomposition of the electrolyte through redox reactions, while surface oxygen groups have been identified as the starting complexes in the oxidative degradation of porous carbon electrodes (Kinoshita and Bett, 1973). A purified activated carbon free of inorganic matter and with a reduced amount of surface oxygen groups was obtained from Ank4 by the following method. Ank4 was previously purified using aqueous solutions (10 wt.%) of HCl, HNO3, HF, at room temperature for 48 h. After acid treatments, Ank4 was washed with deionized water up to the final pH of the washing water and dried at 120°C overnight. Then, Ank4 was treated in U-shaped quartz reactor under a hydrogen/helium flow of 30 mL min−1 at 850°C for 3 h (named Ank_H2) (Calo et al., 1997; Vilella et al., 2005).
Porous Texture and Surface Chemistry Characterization
The porous texture of all samples was characterized by the analysis of both N2 and CO2 adsorption–desorption isotherms at −196 and 0°C, respectively, by using an Autosorb-6-Quantachrome apparatus. The samples were outgassed at 250°C for 4 h before starting the isotherm. From the analysis of these, the apparent surface area was obtained according to BET theory and the micropore volume was calculated by the Dubinin–Radushkevich equation.
CO2 adsorption at 0°C and subatmospheric pressures measures the narrow micropores (i.e., pores of size below about 0.7 nm) and to measure the total micropore volume (i.e., pores of size below 2 nm), high pressures should be used (Cazorla-Amorós et al., 1996, 1998). N2 at −196°C and at subatmospheric pressures measures the total micropore volume except for the narrowest pores (i.e., pores below 0.4 nm approximately) (Cazorla-Amorós et al., 1998). This means that in activated carbons with a well-developed porosity (which is the case of the materials selected), the micropore volume measured from N2 adsorption will be higher than that obtained from CO2 adsorption at 0°C and subatmospheric pressures, thus indicating the presence of supermicropores (i.e., pores between 0.7 and 2 nm).
Pore size distribution has been calculated from the N2 adsorption isotherms considering the 2D-NLDFT Heterogeneous surface model (Jagiello and Olivier, 2013) and by applying the Solution of Adsorption Integral Equation Using Splines (SAIEUS, available online at http://www.nldft.com/) Software. The surface chemistry of the samples were characterize by TPD experiments, which were performed by heating the samples at 20°C min−1 up to 930°C under a helium flow rate of 100 mL min−1. The evolved gases were assessed by a mass spectrometer (Thermostar, Balzers, BSC 200), which is coupled to a TGA-DSC instrument (TA Instruments, SDT Q600 Simultaneous).
Electrochemical Characterization
The carbon electrodes used for electrochemical measurements in a three-electrode cell were prepared in disk-shaped of 0.79 cm2 and a weight between 20 and 25 mg (dry basis), while electrodes used in two-electrode cell presented an area of 0.196 cm2 and a weight between 1 and 5 mg (dry basis). The electrode preparation consists of mixing the activated carbon, acetylene black, and polytetrafluoroethylene (PTFE) as binder in a ratio of 85:10:5. Then, it was pressed and placed onto a titanium mesh or a stainless rod to be characterized in a three-electrode or two-electrode configuration, respectively.
The electrochemical characterization of different electrodes was performed by using a standard three-electrode configuration. As reference electrode, Ag/AgCl (3 M KCl) was used and a spiral of platinum wire was used as a counter electrode. 0.5 M Na2SO4 solution was used as aqueous electrolyte. The electrochemical behavior of the different activated carbon electrodes was assessed by cyclic voltammetry (CV) experiments, which were carried out with an Autolab PGSTAT302. The values of specific capacitance were determined by CV for a wide range of potential windows. A selection of these values was used to calculate the mass ratio between both electrodes before assembling the capacitor (more details below). The electrochemical performance of different asymmetric capacitors was analyzed by using two-electrode cell configuration. These asymmetric capacitors were tested by galvanostatic charge/discharge (GCD) cycling and the specific capacitance value was estimated from the discharging time of the GCD experiments and was referred to the total weight of the active material of both electrodes. The energy density was determined from the area below the U vs. Q discharge curve, while the power density results from dividing the energy density by the discharge time. Coulombic efficiencies are determined as the ratio between the discharge and charge times.
Principles for the Asymmetric Design
The energy density (E, Wh kg−1) of a supercapacitor cell where all energy is stored by purely capacitive means is determined by the gravimetric capacitance (CSP, F g−1) of the cell and the operating voltage (U, V):
The capacitance of the cell is the consequence of the stacking of two parallel capacitors and, therefore, can be expressed in terms of the gravimetric capacitance of the positive and negative electrodes (C+ and C−, respectively, F g−1):
In Eq. 2, w+ and w− (g) stand for the weight of the positive and the negative electrode, and CSP+ and CSP− for the gravimetric capacitance of the positive and negative electrodes, respectively. The amount of charge, Q (C), stored in each of the positive and negative electrodes must be the same, and can be expressed by the Eqs. 3 and 4 (Peng et al., 2010; Chae and Chen, 2012):
where (V) and (V) represent the potential window of the positive and negative electrodes, respectively, during the operation of the capacitor. As can be seen in Figure 1, during a galvanostatic charge of the capacitor, the potential of each electrode (E+ and E−, V) can be calculated from their open circuit potential (EOCP, V), their capacitance and the charge stored in them.
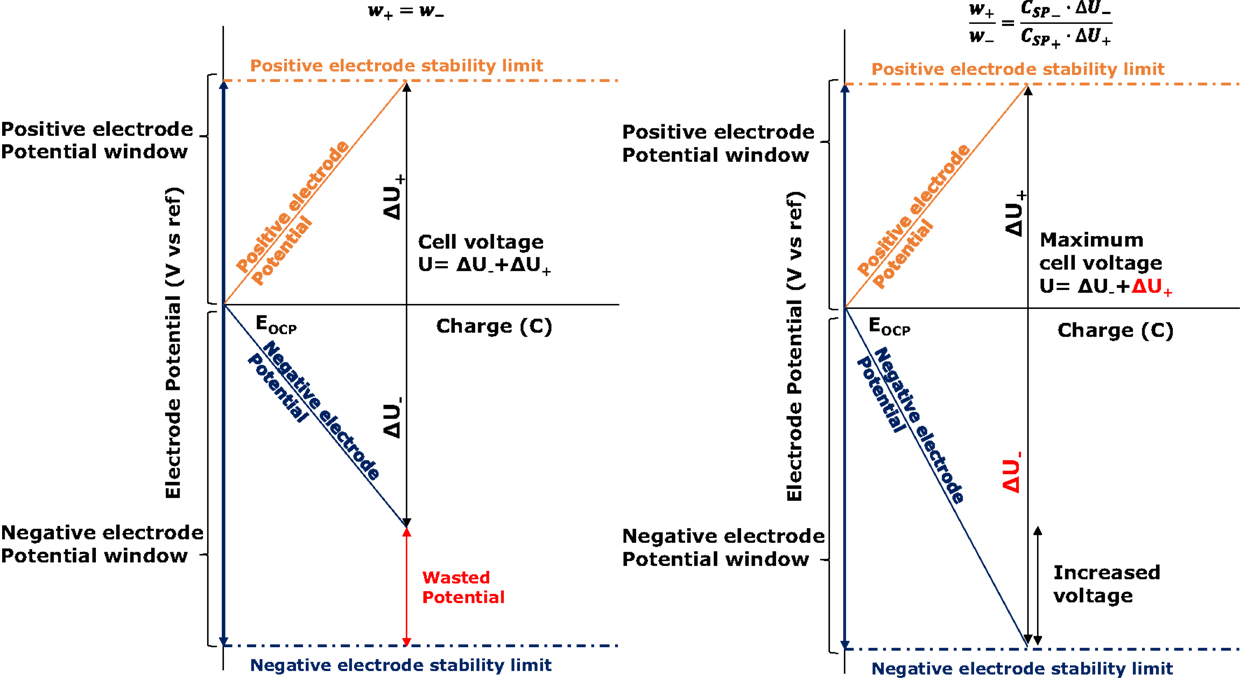
Figure 1. Scheme of the relationship between electrode potentials, voltage, and charge in symmetric (left) and asymmetric (right) supercapacitors.
A similar expression can be drawn for the negative potential window. In the particular case of symmetric configuration with equal capacitance values, it can be deducted that . In the most frequent scenario, the potential stability region of the electrodes is different for the positive and the negative electrodes (Chae and Chen, 2012) and, therefore, it is expected than the potential of one of the two limits will be reached earlier, generating a wasted potential region for the opposite electrode.
The strategy herein introduced pretends to fit the electrochemical stability windows of each electrode with their covered potential windows when the capacitor is charged. Observing Eq. 3, it is clear that, for fixing and in accordance with the electrochemical stability windows of the electrodes when the capacitor is fully loaded, and since their specific capacitances are inherent to each pair of material and electrolyte, the weight ratio of the electrodes must be fixed:
For ensuring a good result when implementing this strategy, the accurate determination of the potential stability limits is mandatory. It is also important to properly measure the open circuit potential of the electrodes. Then, the gravimetric capacitances must be determined in the potential windows ranging from the open circuit potential and the limiting stability potentials of each electrode. If the strategy is implemented successfully, it will be possible to extend the operating voltage by forcing both electrodes to reach a potential close to their stability limits, as seen in Figure 1. Although this approach is often seen in the development of hybrid and asymmetric in material supercapacitor devices, it is possible to find a few examples in the literature about the successful implementation of this technique for activated carbon/activated carbon capacitors. Two of the most relevant are the works of Chae and Chen, who reported the development of this kind of supercapacitor in neutral media and achieved 1.9 V (Chae and Chen, 2012), and Staiti et al., who optimized the mass ratio of xerogel carbon electrodes in sodium sulfate supercapacitor cells for achieving 1.8 V (Staiti et al., 2012). In both studies, durability tests consisting in a large number of GCD experiments were performed for assessing the degree of success achieved with this strategy. Consequently, GCD cyclability tests have been also conducted in this work.
Results
Porous Texture Characterization and Surface Chemistry Characterization
Figure 2A shows the N2 adsorption–desorption isotherms for activated carbon samples, which show a high nitrogen uptake at low relative pressures (type I isotherm). Therefore, all samples are microporous materials. However, both synthesized activated carbon samples from anthracite (Ank4 and Ank_H2) present a wider knee at low relative pressures than commercial activated carbon (ACM). It suggests that the pore size distribution for ACM is narrower than that in Ank4 and Ank_H2. This fact is in agreement with the NLDFT-PSD (Figure 2B), where it is observed that the ACM sample shows the narrowest PSD, while ANK4 and ANK_H2 samples have some contribution of wider pores. It can be seen that the treatment employed for the purification of ANK4 has slightly widened the porosity as consequence of the removal of impurities and especially of the elimination of surface oxygen groups. The purification process involved a treatment of 10% HNO3 for 48 h, which oxidizes the surface of the activated carbon (Bleda-Martínez et al., 2005), thus enhancing the widening of the porosity due to removal of surface oxygen groups when the oxidized activated carbon is later heat treated in presence of hydrogen.
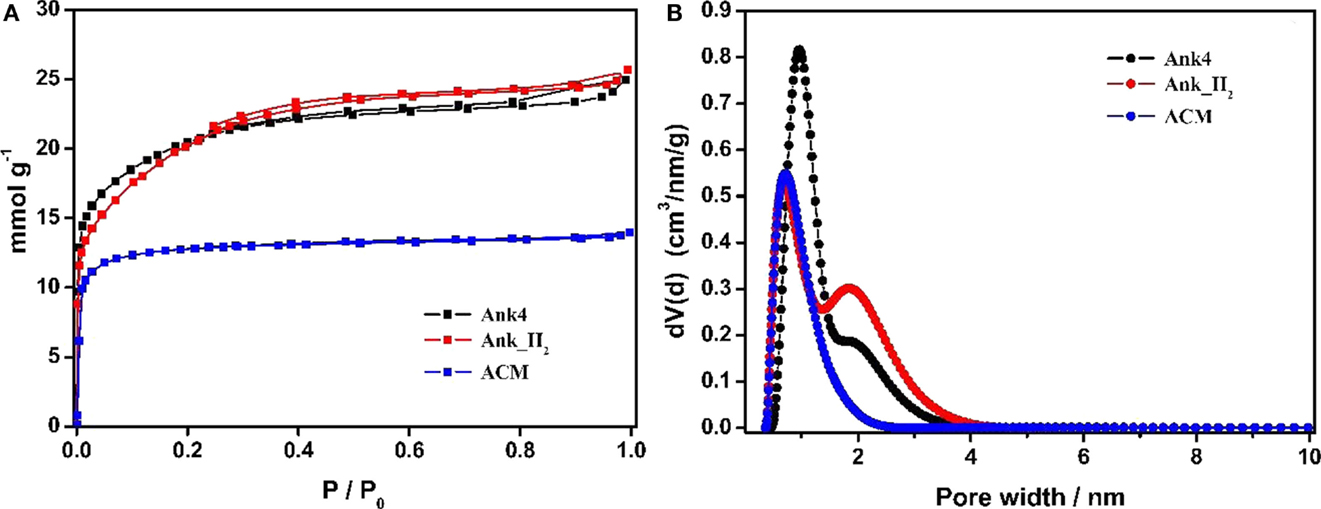
Figure 2. (A) N2 adsorption–desorption isotherms of the ACs samples. (B) N2 adsorption NLDFT-PSD of ACs samples.
Table 1 summarizes the porous texture characterization for all activated carbons samples. Activated carbons synthesized from anthracite show a larger apparent surface area (SBET) than ACM sample. These high SBET values are usually obtained in activated carbons prepared by KOH activation due to the high microporosity development produced by the chemical activation (Lozano-Castelló et al., 2001). The micropore volume determined by N2 adsorption is higher than the value estimated by CO2 adsorption for Ank4 and ANK_H2 samples, thus indicating the well-developed microporosity in these materials. However, this difference between the micropore volumes calculated from N2 and CO2 data is much lower for the ACM sample. This indicates that ACM sample presents a narrow micropore size distribution.
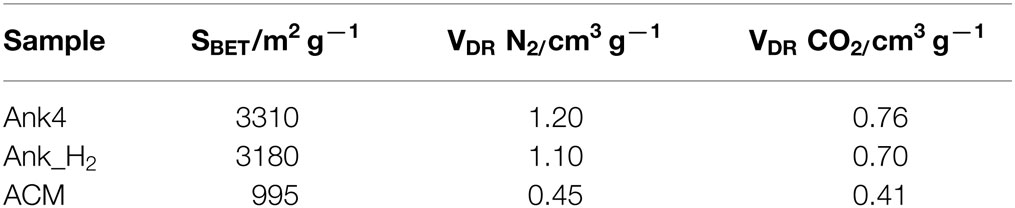
Table 1. Porous texture values of all activated carbon samples.
Figures 3A,B shows the CO and CO2 TPD profiles for all samples. Ank4 sample shows a variety of oxygen groups on its surface, which were produced by the chemical activation process. CO-evolving groups are related to the decomposition of carbonyls, quinones, and phenols groups, while CO2-evolving groups are associated with the decomposition of acidic groups (carboxylic, lactones, etc.) (Román-Martínez et al., 1993; Figueiredo et al., 1999; Boehm, 2002). It can be observed that both amounts of desorbed CO and CO2 decrease for Ank_H2 sample due to most of these groups were removed by the treatment in hydrogen. Thermal treatment of activated carbons causes the decomposition of surface oxygen groups, but the nascent free sites have high reactivity, and in contact with air, they will generate fresh surface oxygen groups. When hydrogen is feed during the thermal treatment, it is able to catalyze the removal of certain oxygen groups and to react with nascent free sites, deactivating them and explaining the high efficiency of this treatment for removal of surface groups (Calo et al., 1997). Regarding ACM sample, it shows a decrease in CO-evolving groups in comparison to Ank4. However, its CO2 profile is similar to Ank4 and CO2 desorption is observed from 200 to 500°C, which is related to the decomposition of carboxylic acids.
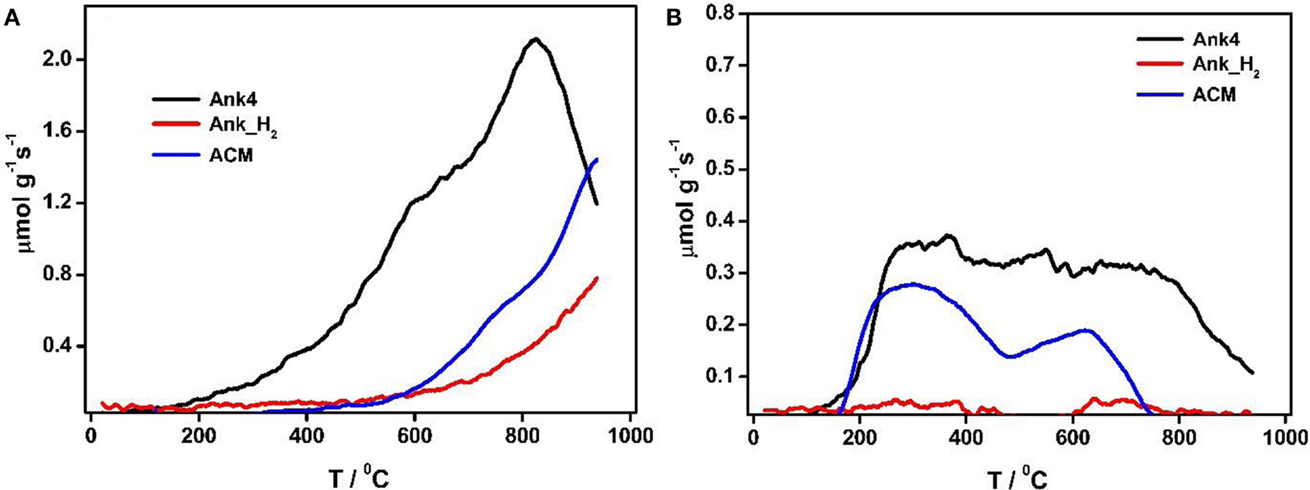
Figure 3. (A) CO and (B) CO2 TPD evolution profiles obtained from Ank4, Ank_H2, and ACM.
Table 2 contains the amount of CO and CO2 desorbed during the TPD experiments for all activated carbon samples. As mentioned above, Ank4 sample has high amounts of CO-type groups (carbonyl, quinones or phenolic groups). It can be seen that the amount of oxygen of Ank4 is much higher than Ank_H2, since the treatment in hydrogen at 850°C was extensively effective due to both the reducing agent (H2) and high temperature.
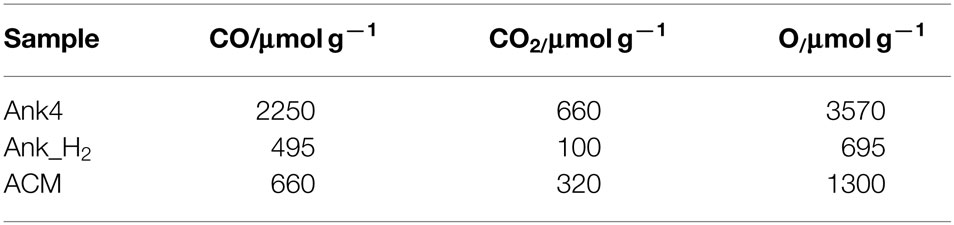
Table 2. Quantification of evolved CO and CO2 obtained from TPD experiments.
Electrochemical Characterization for all Activated Carbons
As mentioned above, three activated carbon samples were characterized in a three-electrode cell by using CV in order to assess its capacitance and electrochemical stability potential window. The experiments were carried out in 0.5 M Na2SO4 aqueous solution because it will be used as electrolyte in two-cell electrode due to high stability in a wide potential window (Fic et al., 2012).
Figure 4 shows the steady voltammograms for Ank4 sample from a fixed upper potential value toward less positive ones. It is observed that voltammogram between 0.5 and −0.4 V exhibits a quasi-rectangular shape related to the formation of the electric double layer. However, if the lower potential limit decreases, this shape changes slightly and a reduction process appears at −0.9 V related to the hydrogen evolution reaction (Bleda-Martínez et al., 2008). During the positive-going scan, it happens an increase in the oxidation current, which becomes larger when the lower potential limit is less positive. This electrochemical process is associated with the hydrogen oxidation that was adsorbed in the carbon network at less positive potential values. This process of hydrogen adsorption is more remarkable when the carbon material reaches further negative potential values (Leyva-García et al., 2014).
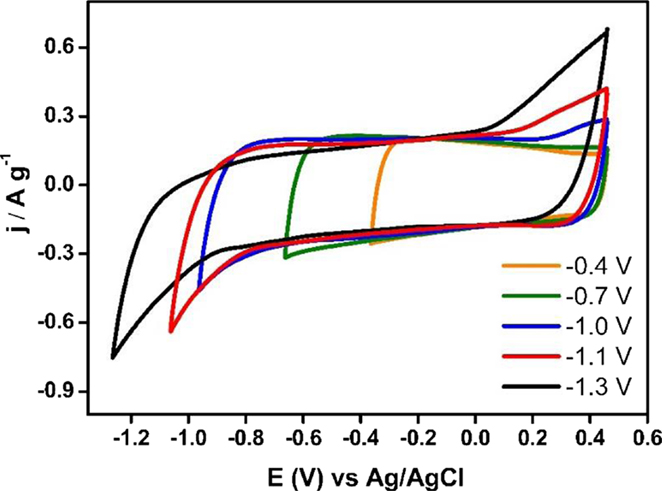
Figure 4. Steady voltammograms of Ank4 toward negative potentials (υ = 1 mV s−1; 0.5 M Na2SO4).
The electrochemical behavior for Ank4 sample to positive potential values is shown in Figure 5. The voltammograms also show a quasi-rectangular shape. Nevertheless, if the upper potential limit increases, the oxidation of the carbon material is not observed on the voltammograms up to potentials close to 0.8 V. This anodic current increases as the upper potential limit is higher. It could lead to the degradation of carbon material if the highest potential is kept for a long time. Moreover, it is observed in the reverse scan a cathodic current at 0.2 V which can be associated with the reduction of surface groups generated during the positive scan.
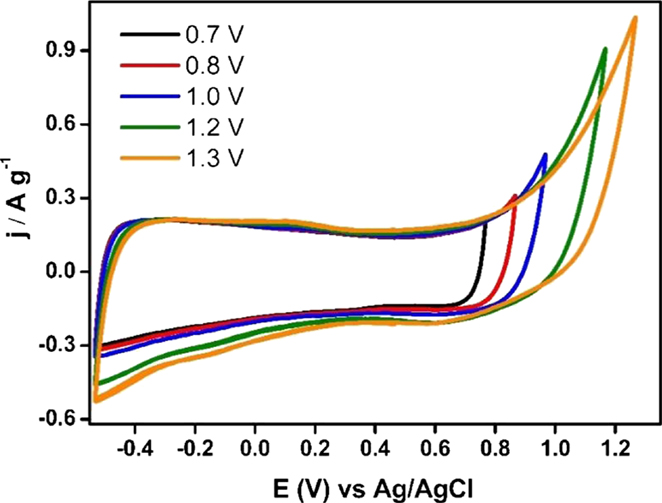
Figure 5. Steady voltammograms of Ank4 toward positive potentials (υ = 1 mV s−1; 0.5 M Na2SO4).
Regarding Ank_H2 sample, this one showed an electrochemical behavior similar to Ank4 sample (voltammograms not shown here) in both the anodic and cathodic process. However, the hydrogen evolution reaction shifted to more negative potential values. Moreover, the capacitance values are lower than those displayed by Ank4 sample. Finally, ACM sample presents cyclic voltammograms similar to those showed in Ank_H2 from 0.2 V to negative potential values. However, the steady voltammograms from −0.3 V to positive potential values exhibited a slight difference. In Figure 6, it is observed during the negative-going scan a redox process at 0.6 V corresponding to the reduction of species which were previously oxidized.
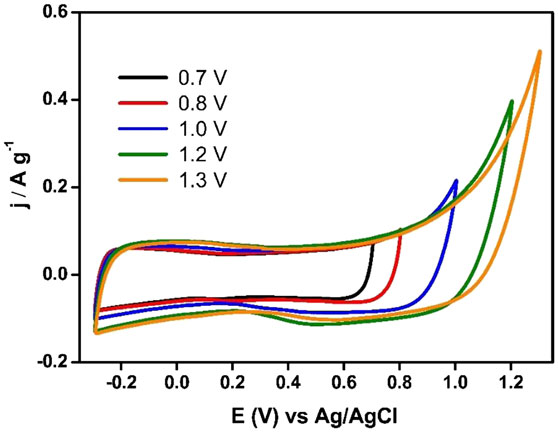
Figure 6. Steady voltammograms of ACM toward positive potentials (υ = 1 mV s−1; 0.5 M Na2SO4).
Optimization of Asymmetric Capacitor
Once the activated carbon samples have been characterized in a three-electrode cell, their maximum voltage window can be determined. It is well-known in symmetric supercapacitors that the positive electrode has generally a narrower potential window than the negative electrode. Therefore, the positive electrode is usually charged to its positive potential limit before the negative electrode reaches its negative potential limit. In this way, the maximum voltage window for a symmetric supercapacitor will be always lower than that potential window obtained in a three-electrode cell for the same carbon material (Peng et al., 2010). Hence, a suitable optimization of the mass ratio can be useful to increase the cell voltage. In order to do so, we first determined the positive and negative electrode potential windows. Then, capacitance values are calculated by charge–discharge curves in these potential windows. Finally, the mass of one of the electrodes is fixed, while the mass of other electrode is obtained from the optimized mass ratio, as determined from Eq. 3.
Concerning the potential windows, they range from the open circuit potential to an upper or lower potential limit. Taking into account this method and the electrochemical characterization in a three-electrode cell, three asymmetric supercapacitor were optimized to maximize the potential window without affecting the stability.
Figure 7 shows the steady voltammograms for Ank4 sample between EOCP (0.2 V vs. Ag/AgCl) to positive or negative potential values. It can be seen that suitable potential windows would be between 0.2 V and 0.8 V in the case of the positive electrode, while the negative potential window would be from 0.2 V to −1 V. Then, it can be observed that the voltage that can be reached with the capacitor prepared with this material could be 1.8 V.
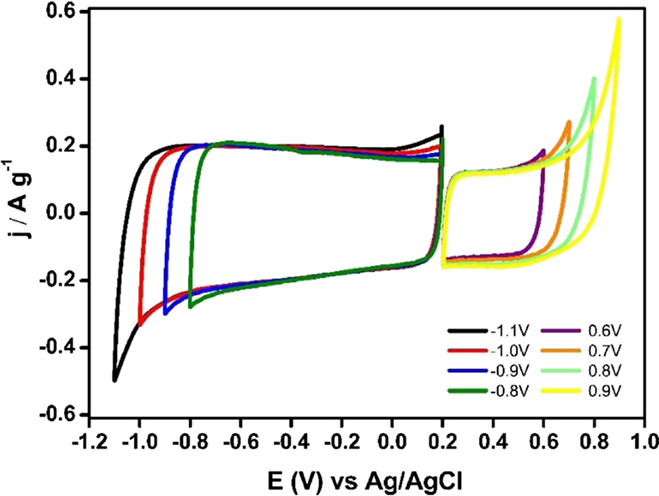
Figure 7. Steady voltammograms for Ank4 sample from EOCP to positive and negative potential values (υ = 1 mV s−1; 0.5 M Na2SO4).
Once the interval of voltage was selected for each electrode, the specific capacitance for both electrodes was calculated from voltammograms shown in the Figure 8. Specific capacitance value was 131 Fg−1 for the positive potential range and 199 F g−1 for the negative potential one. Finally, the mass ratio was calculated by using these specific capacitance values, obtaining a value of 3.
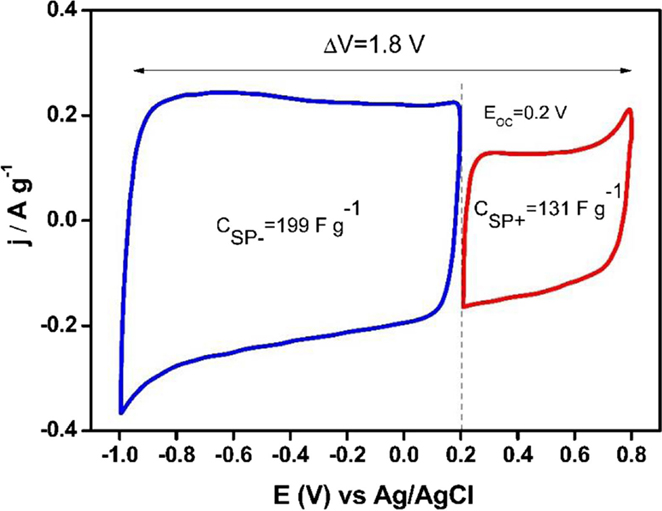
Figure 8. Steady voltammograms to design an asymmetric supercapacitor based on Ank4 sample (υ = 1 mV s−1; 0.5 M Na2SO4).
Asymmetric supercapacitors based on Ank_H2 and ACM were optimized following the procedure described above. Capacitance values for Ank_H2 were calculated between 0.14 and −1 V in the case of the negative electrode (166 Fg−1), while a range from 0.14 to 0.7 V was used for the positive electrode (119 Fg−1) and the resulting optimum mass ratio was 2.8 for a potential window of 1.7 V. This could be the functioning voltage of the capacitors prepared with this material. This voltage is lower than that determined for the parent activated carbon, and points out that the reduction thermal treatment in presence of hydrogen did not render any enhancement in the electrochemical stability of Ank electrode in aqueous electrolyte, and even renders a higher reactivity of the activated carbon when exposed to positive polarization. Regarding the asymmetric capacitor based on ACM, its operational voltage could be 2 V, a value much higher than those used in Ank4 or Ank_H2 supercapacitors. ACM sample could remain stable up to 0.85 V during the positive scan and −1.15 V was chosen as the lower potential limit (Figure 9). However, the capacitance values for ACM are lower than those obtained in Ank4 and Ank_H2. The positive electrode shows a value of 67 F g−1, while the capacitance value calculated for the negative electrode was 91 F g−1. The mass ratio used in the construction of the last cell was 2.43.
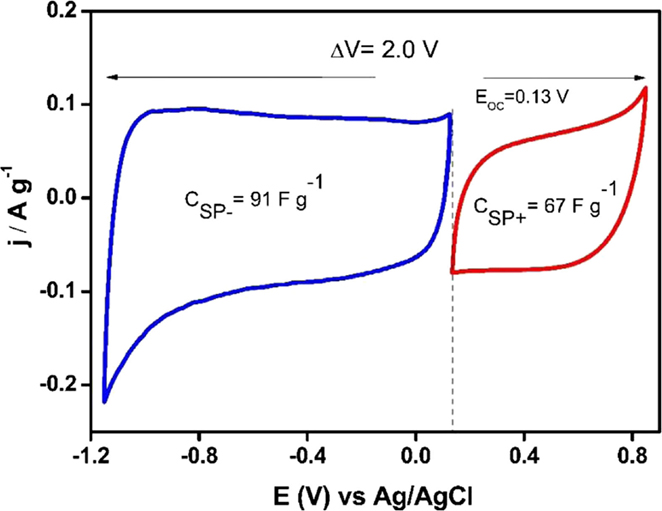
Figure 9. Steady voltammograms to design an asymmetric supercapacitor based on ACM sample (υ = 1 mV s−1; 0.5 M Na2SO4).
Electrochemical Study of Asymmetric Supercapacitors
After the optimization of mass ratios for all activated carbon samples, asymmetric supercapacitors were assembled using Swagelok-type cells with stainless current collectors. Both electrodes were separated by a nylon membrane and a 0.5 M Na2SO4 aqueous solution was used as electrolyte. These asymmetric capacitors were assessed by CV and GCD experiments in order to ensure the proper assembly of the supercapacitor. Then, a conditioning step for all supercapacitors was performed by GCD experiments. The cycle conditions were set up in 100 cycles at 0.5 A g−1 for different voltages to ensure that supercapacitors were stabilized. This would assure electrolyte penetration inside the porosity (1.3, 1.5, and 1.7 V).
Figure 10 shows the Ragone plot for all asymmetric supercapacitors obtained at the maximum available voltage (1.7 V for Ank_H2, 1.8 V for Ank4, and 2.0 V for ACM, as determined in section 3.3). It is observed that different energy densities are obtained for each cell, with the asymmetric supercapacitor based on Ank4 displaying the highest values of energy density, even though ACM supercapacitor cell works at a higher voltage. However, the latter shows a better performance at high current densities. Thus, the maximum power densities achieved at these conditions are 2.3 and 3.8 kW kg−1, respectively. After discounting the effect of the working voltage, cell resistance of ACM supercapacitor is still 25% lower than that of Ank4, therefore, these differences are not accountable only to the working voltage, but must arise from differences in the properties of the activated carbons. This improvement for ACM in comparison to Ank4 cannot be related to the PSD, since ACM sample presented a narrower PSD than Ank4 samples, which should lead to restricted ion mobility inside the pore network. Thus, they must be connected to differences in the electrical conductivity of the materials themselves, which can be in agreement with a lower conductivity with increasing the development of porosity. On the other hand, the asymmetric Ank_H2 supercapacitor rendered the lowest energy density, although it shows a better power density than Ank4 supercapacitor cell, which must be related to an increase in electrical conductivity induced by the removal of electron-withdrawing surface oxygen groups (Bleda-Martínez et al., 2005).
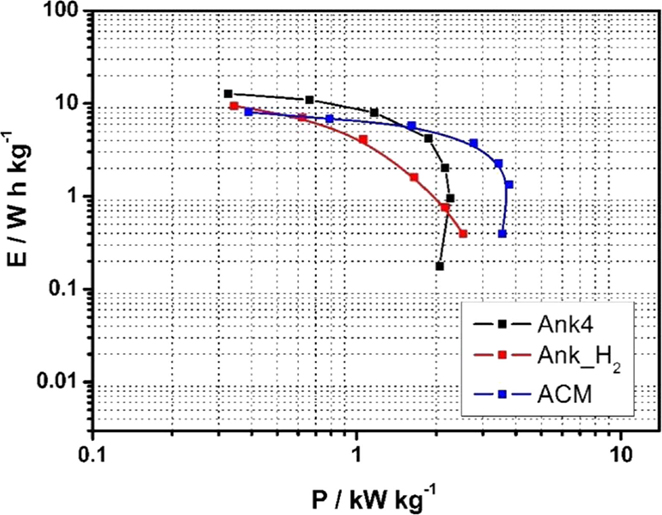
Figure 10. Ragone plot for asymmetric supercapacitors of Ank4 (ΔU = 1.8 V), Ank_H2 (ΔU = 1.7 V), ACM (ΔU = 2.0 V) before performing charge–discharge test (0.5 M Na2SO4).
The evolution of the specific capacitance for all devices was carried out by a durability test consisting in a large number of GCD measurements at a density current of 1 A g−1 using their maximum allowable voltages (Figure 11).
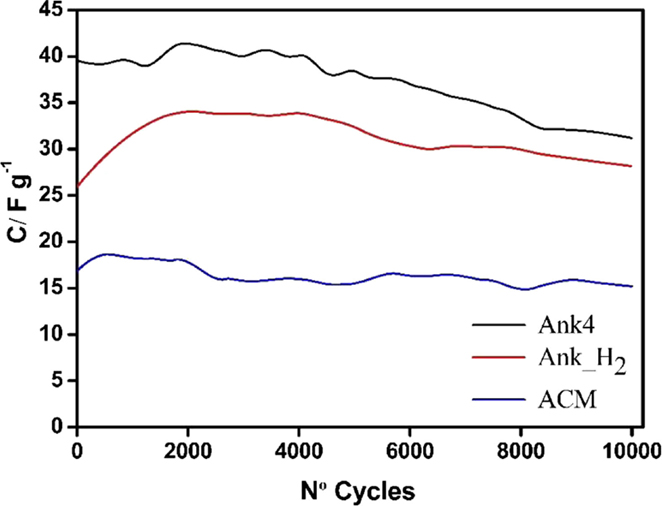
Figure 11. Evolution of specific capacitance for all asymmetric supercapacitors ( j = 1 A g−1; 0.5 M Na2SO4).
From these experiments, some parameters were obtained, which provided information about the cycle life of each supercapacitor (Table 3). Figure 11 shows the evolution of the capacitance for three capacitors obtained from charge–discharge curves. It can be seen that the capacitance values decreases with the number of cycles for all devices. This loss of capacitance is more noticeable for Ank4 capacitor. However, Ank_H2 supercapacitor shows a slight increase in the capacitance value up to 2000 cycles and from here it decreases following the trend as Ank4 and ACM. This behavior can be explained taking into account the hydrogen treatment, since Ank_H2 sample lost most surface groups after treatment, leading to a hydrophobic carbon. During the durability test, some of the oxygenated surface groups are again restored through the electrooxidation of the positive electrode. Therefore, the electrolyte needs a certain number of cycles before it can diffuse into all the available porosity, and because of that, the electric double-layer formation is somewhat hindered at the beginning of the durability test.
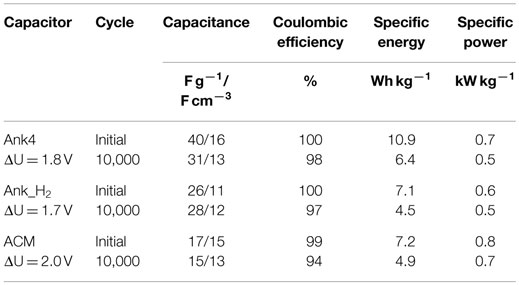
Table 3. Performance parameters for the supercapacitor cells in charge–discharge cycles at 1 A g−1.
Regarding the coulombic efficiency, the three asymmetric supercapacitors show high values (> 90%) even after 10,000 cycles (Table 3), indicating that charge–discharge of all supercapacitors still occurs through the double-layer formation. The slightly lower coulombic efficiencies after the durability test are related to the occurrence of irreversible redox reactions, which must be related to the degradation of either the electrolyte, the current collector or the carbon electrode (through the removal of surface oxygen groups in form of CO2). This degradation seems to be higher in the case of ACM supercapacitor due to its higher operational voltage. Concerning the specific energy, supercapacitor based on Ank4 exhibits the highest values but a harsh decrease is observed after 10,000 cycles (loss of 41%), while the highest real specific power is obtained from ACM supercapacitor (Table 3).
Additionally, CV measurements were performed for all asymmetric supercapacitors at its maximum voltage determined in the previous section (1.8 V for Ank4, 1.7 V for Ank_H2, and 2.0 V for ACM, shown in Figure S1, in Supplementary Material). In the case of Ank4 capacitor, CVs were also recorded at different points of the durability test. In this way, the evolution of the carbon material with the number of cycles can be observed. Figure 12 shows the steady voltammograms for the Ank4 supercapacitor, which were registered after fixed numbers of GCD cycles. It is observed a slight oxidation process at 1.4 V, leading to the generation of functional groups on the surface, which increases the specific capacitance. However, these surface groups are degraded under the same conditions and after 6000 cycles a redox process appears close to 0 V. Moreover, the deviation of the voltammograms means an increase in the resistance, which also indicates that the degradation of the material is happening. Finally, after 10,000 cycles, asymmetric capacitor based on Ank4, which was checked under conditions mentioned above, loses a significant percentage of the initial capacitance.
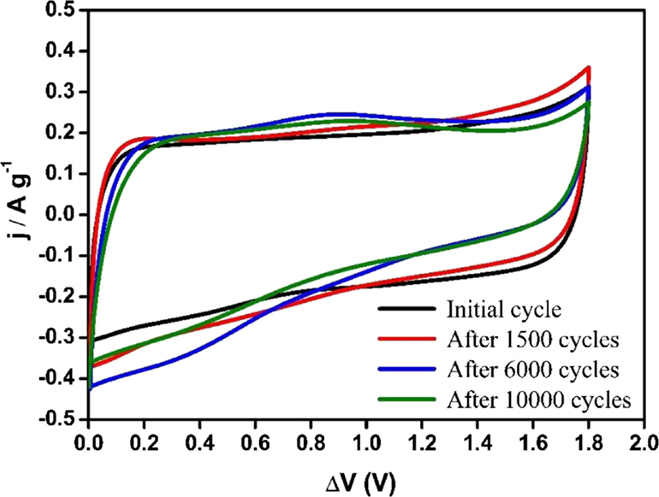
Figure 12. Steady voltammograms of supercapacitor based on Ank4 for a voltage of 1.8 V (υ = 5 mV s−1; 0.5 M Na2SO4).
Concerning the aforementioned parameters included in Table 3, it is noteworthy to mention that energy density values are commonly referred to the unit volume, since it is more appropriate for comparison purposes. At this point, energy density values in our devices were referred to the unit volume (using the geometric density of the electrodes) in order to properly compare them with other devices. These values were 7.3 and 4.5 Wh L−1 for supercapacitors based on Ank4 and Ank_H2, respectively. While a value of 6.5 Wh L−1 was obtained from the supercapacitor based on ACM sample, which is used in commercial capacitors. In view of the results, we can concluded that our asymmetric supercapacitors present values of energy density referred to unit volume higher than those symmetric supercapacitors based on activated carbons in aqueous electrolyte (2.2 Wh L−1) (Simon and Burke, 2008).
Finally, asymmetric capacitors based on Ank4 and ACM showed energy density values close to a symmetric device in organic electrolyte (7.6 Wh L−1) (Simon and Burke, 2008) or commercial capacitors, which have an average value of 5.0 Wh L−1 (Gogotsi and Simon, 2011a). Some energy density values provided by the biggest companies in the market (Panasonic, Maxwell, or Ness) range from 3.2 to 7.2 Wh L−1 (Simon and Burke, 2008). Therefore, our asymmetric supercapacitor exhibited very promising energy density values.
Discussion
All parameters assessed to characterize the performance of supercapacitors depend on a large number of factors, such as chemical composition, pore structure, mass, thickness, configuration and characterization technique and protocols, among others (Stoller and Ruoff, 2010). Even it must be taken into account if values are referred to volumetric or gravimetric basis. In our approach, special emphasis has been paid in the preparation and molding of the electrode paste. The formulation ensures a good electrical conductivity, while the weight of the electrodes was selected in the range between 5 and 15 mg/cm2, which are in turn translated into electrode thicknesses between 70 and 360 microns. Since a thin electrode film increases the specific power at the cost of greatly hampering the volumetric performance of the capacitor (Gogotsi and Simon, 2011b), we keep the electrode thickness in the range of commercial supercapacitors (Stoller and Ruoff, 2010). When determining the energy density, it is important to remark that, instead of using Eq. 1 for the determination of the energy, the energy density was calculated from the area under the discharge curve, which is the real energy being stored in and retrieved from the device. This practice is highly recommended for this kind of devices, since they usually show charge and discharge curves far from the triangular shape that allows determination of energy through Eq. 1 (Chen, 2013). However, this approach is rarely found in the literature. Table 4 compiles the electrode and asymmetric supercapacitor specifications. A comparison is stablished between the real (Ereal) and the calculated (Ethe) energy density for the three asymmetric supercapacitor cells. It can be seen that values of the calculated energy density are sensitively larger (30–60%) when Eq. 1 is used for reporting the energy density. This is a common error in characterizing supercapacitors when the charge–discharge curves are not straight lines.
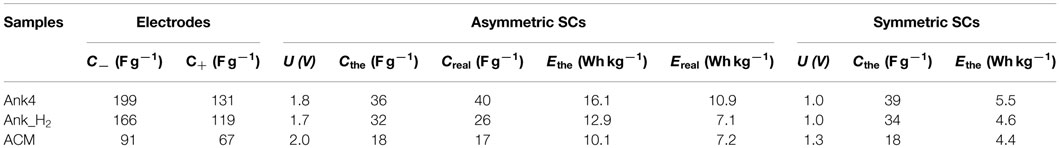
Table 4. Specifications for the electrodes, asymmetric, and symmetric (theoretical values) supercapacitors.
A straightforward method has allowed the design of asymmetric supercapacitors from a simple electrochemical characterization in a three-electrode cell by considering the stability of material at anodic and cathodic potential values and the specific capacitance in those potential windows. Then, theoretical capacitance of the asymmetric cells can be calculated by means of Eq. 2. Table 4 shows that the obtained capacitance is slightly higher for Ank4, while that of Ank_H2 is underestimated, compared to the theoretical ones. These discrepancies can be explained by differences in the potentials at which the electrodes are submitted when they are in a two-electrode supercapacitor cell instead of in a three-electrode cell. They can produce differences in the pseudocapacitance contribution and in the wettability of the surface. In the case of ACM, since it is the one showing the lowest contribution of pseudocapacitance, the good agreement between theoretical and real capacitance values are expected.
The optimized asymmetric supercapacitor improves its energy density in comparison with that symmetric capacitor based on the same material. This has been checked by estimating the theoretical operating voltage of the symmetric system, which is limited by the positive electrode. Once the maximum charge that can be stored in the positive electrode is estimated, it is possible to calculate the potential window of the negative electrode using Eq. 3. Table 4 shows that the Ank4 and Ank_H2 supercapacitor cells can be operated safely only at 1 V, while ACM could reach 1.3 V. This low operational voltage is translated into a sluggish theoretical energy density, being almost three times lower than that achieved in the asymmetric supercapacitor.
As mentioned above, the presence of surface oxygen groups and a higher apparent surface area do not lead to the best performance as in the case of the supercapacitor based on Ank4, since these groups do not remain stable after electrochemical treatments under severe conditions. However, the device based on Ank_H2 was free of most surface oxygen groups, and the supercapacitor constructed using this material shows an exceptional capacitance retention, even higher than that of the supercapacitor based on ACM. Even though ACM has a lower SBET and a narrower pore size distribution, it exhibited a good performance, with a maximum deliverable power (on Ragone plot, Figure 10) that is higher than the activated carbons with a wider pore size distribution. This can be related to the effect of the particle size, the position and tortuosity of the porosity and the electrical conductivity of the carbon material. This last aspect is very much dependent on the degree of development of porosity.
In conclusion, the most interesting results are obtained for the capacitors based on Ank4 and ACM, which showed energy density values comparable to commercial capacitors and symmetric capacitors (organic electrolyte). However, our asymmetric capacitors use an aqueous solution as electrolyte, which is environmentally friendly, and does not imply a new synthesis procedure, several preparation steps, or severe modification treatments of the cells. These advantages in specifications have been gained through careful estimation of the optimized mass of each electrode of the cell, a design strategy that can be easily implemented with small impact in production costs.
Author Contributions
EM is the corresponding authors. She has contributed with the conception, design of the work, analysis, and interpretation of data for the work. DCA has contributed with the conception, design of the work, analysis, and interpretation of data for the work. RRR has contributed in the analysis and interpretation of data for the work. DST has contributed in the acquisition, analysis, and interpretation of data for the work. IPP has contributed in the acquisition and analysis of data for the work.
Conflict of Interest Statement
The authors declare that the research was conducted in the absence of any commercial or financial relationships that could be construed as a potential conflict of interest.
Acknowledgments
The authors would like to thank MINECO (CTQ2012/31762, MAT2013-42007-P) and Generalitat Valenciana (PROMETEO/2013/038 and PROMETEOII/2014/010) for the financial support. RRR thanks MINECO for a “Juan de la Cierva” contract (JCI-2012-12664).
Supplementary Material
The Supplementary Material for this article can be found online at https://www.frontiersin.org/article/10.3389/fmats.2016.00016
References
Amatucci, G. G., Badway, F., Pasquier, A. D., and Zheng, T. (2001). An asymmetric hybrid nonaqueous energy storage cell. J. Electrochem. Soc. 148, A930–A939. doi: 10.1149/1.1383553
Béguin, F., Presser, V., Balducci, A., and Frackowiak, E. (2014). Carbons and electrolytes for advanced supercapacitors. Adv. Mater. 26, 2219–2251. doi:10.1002/adma.201304137
Bleda-Martínez, M. J., Maciá-Agulló, J. A., Lozano-Castelló, D., Morallón, E., Cazorla-Amorós, D., and Linares-Solano, A. (2005). Role of surface chemistry on electric double layer capacitance of carbon materials. Carbon 43, 2677–2684. doi:10.1016/j.carbon.2005.05.027
Bleda-Martínez, M. J., Pérez, J. M., Linares-Solano, A., Morallón, E., and Cazorla-Amorós, D. (2008). Effect of surface chemistry on electrochemical storage of hydrogen in porous carbon materials. Carbon N. Y. 46, 1053–1059. doi:10.1016/j.carbon.2008.03.016
Boehm, H. P. (2002). Surface oxides on carbon and their analysis: a critical assessment. Carbon 40, 145–149. doi:10.1016/S0008-6223(01)00165-8
Brandt, A., and Balducci, A. (2014). Theoretical and practical energy limitations of organic and ionic liquid-based electrolytes for high voltage electrochemical double layer capacitors. J. Power Sources 250, 343–351. doi:10.1016/j.jpowsour.2013.10.147
Calo, J. M., Cazorla-Amorós, D., Linares-Solano, A., Román-Martínez, M. C., and De Lecea, C. S.-M. (1997). The effects of hydrogen on thermal desorption of oxygen surface complexes. Carbon N. Y. 35, 543–554. doi:10.1016/S0008-6223(96)00173-X
Cazorla-Amorós, D., Alcañiz-Monge, J., de la Casa-Lillo, M. A., and Linares-Solano, A. (1998). CO2 as an adsorptive to characterize carbon molecular sieves and activated carbons. Langmuir 14, 4589–4596. doi:10.1021/la980198p
Cazorla-Amorós, D., Alcañiz-Monge, J., and Linares-Solano, A. (1996). Characterization of activated carbon fibers by CO2 adsorption. Langmuir 12, 2820–2824. doi:10.1021/la960022s
Chae, J. H., and Chen, G. Z. (2012). 1.9 V aqueous carbon–carbon supercapacitors with unequal electrode capacitances. Electrochim. Acta 86, 248–254. doi:10.1016/j.electacta.2012.07.033
Chen, G. Z. (2013). Understanding supercapacitors based on nano-hybrid materials with interfacial conjugation. Prog. Nat. Sci. Mater. Int. 23, 245–255. doi:10.1016/j.pnsc.2013.04.001
Chmiola, J., Yushin, G., Gogotsi, Y., Portet, C., Simon, P., and Taberna, P. L. (2006). Anomalous increase in carbon capacitance at pore sizes less than 1 nanometer. Science 313, 1760–1763. doi:10.1126/science.1132195
Conway, B. E. (1999). Electrochemical Supercapacitors: Scientific Fundamentals and Technological Applications. New York: Kluwer-Plenum Press.
Conway, B. E., Birss, V., and Wojtowicz, J. (1997). The role and utilization of pseudocapacitance for energy storage by supercapacitors. J. Power Sources 66, 1–14. doi:10.1016/S0378-7753(96)02474-3
Cottineau, T., Toupin, M., Delahaye, T., Brousse, T., and Bélanger, D. (2006). Nanostructured transition metal oxides for aqueous hybrid electrochemical supercapacitors. Appl. Phys. A 82, 599–606. doi:10.1007/s00339-005-3401-3
Fic, K., Lota, G., Meller, M., and Frackowiak, E. (2012). Novel insight into neutral medium as electrolyte for high-voltage supercapacitors. Energy Environ. Sci. 5, 5842–5850. doi:10.1039/C1EE02262H
Figueiredo, J. L., Pereira, M. F. R., Freitas, M. M. A., and Órfão, J. J. M. (1999). Modification of the surface chemistry of activated carbons. Carbon N. Y. 37, 1379–1389. doi:10.1016/S0008-6223(98)00333-9
Gao, Q., Demarconnay, L., Raymundo-Piñero, E., and Béguin, F. (2012). Exploring the large voltage range of carbon/carbon supercapacitors in aqueous lithium sulfate electrolyte. Energy Environ. Sci. 5, 9611–9617. doi:10.1039/C2EE22284A
Gogotsi, Y., and Simon, P. (2011a). Materials science. True performance metrics in electrochemical energy storage. Science 334, 917–918. doi:10.1126/science.1213003
Gogotsi, Y., and Simon, P. (2011b). True performance metrics in electrochemical energy storage. Science 334, 917–918. doi:10.1126/science.1213003
Inagaki, M., Kang, F., Toyoda, M., and Konno, H. (2014). “Chapter 11 – Carbon Materials for Electrochemical Capacitors,” in Advanced Materials Science and Engineering of Carbon, eds M. Inagaki, F. Kang, M. Toyoda, and H. Konno (Boston: Butterworth-Heinemann), 237–265.
Itoi, H., Nishihara, H., Ishii, T., Nueangnoraj, K., Berenguer, R., and Kyotani, T. (2014). Large pseudocapacitance in quinone-functionalized zeolite-templated carbon. Bull. Chem. Soc. Jpn. 87, 250–257. doi:10.1246/bcsj.20130292
Jagiello, J., and Olivier, J. P. (2013). 2D-NLDFT adsorption models for carbon slit-shaped pores with surface energetical heterogeneity and geometrical corrugation. Carbon N. Y. 55, 70–80. doi:10.1016/j.carbon.2012.12.011
Khomenko, V., Raymundo-Piñero, E., and Béguin, F. (2006). Optimisation of an asymmetric manganese oxide/activated carbon capacitor working at 2 V in aqueous medium. J. Power Sources 153, 183–190. doi:10.1016/j.jpowsour.2005.03.210
Khomenko, V., Raymundo-Piñero, E., and Béguin, F. (2008). High-energy density graphite/AC capacitor in organic electrolyte. J. Power Sources 177, 643–651. doi:10.1016/j.jpowsour.2007.11.101
Khomenko, V., Raymundo-Piñero, E., and Béguin, F. (2010). A new type of high energy asymmetric capacitor with nanoporous carbon electrodes in aqueous electrolyte. J. Power Sources 195, 4234–4241. doi:10.1016/j.jpowsour.2010.01.006
Kinoshita, K., and Bett, J. (1973). Electrochemical oxidation of carbon black in concentrated phosphoric acid at 135°C. Carbon N. Y. 11, 237–247. doi:10.1016/0008-6223(73)90026-2
Laforgue, A., Simon, P., Fauvarque, J. F., Sarrau, J. F., and Lailler, P. (2001). Hybrid supercapacitors based on activated carbons and conducting polymers. J. Electrochem. Soc. 148, A1130–A1134. doi:10.1149/1.1400742
Leyva-García, S., Morallón, E., Cazorla-Amorós, D., Béguin, F., and Lozano-Castelló, D. (2014). New insights on electrochemical hydrogen storage in nanoporous carbons by in situ Raman spectroscopy. Carbon N. Y. 69, 401–408. doi:10.1016/j.carbon.2013.12.042
Lin, R., Taberna, P. L., Chmiola, J., Guay, D., Gogotsi, Y., and Simon, P. (2009). Microelectrode study of pore size, ion size, and solvent effects on the charge/discharge behavior of microporous carbons for electrical double-layer capacitors. J. Electrochem. Soc. 156, A7–A7. doi:10.1149/1.3002376
Lozano-Castelló, D., Lillo-Ródenas, M. A., Cazorla-Amorós, D., and Linares-Solano, A. (2001). Preparation of activated carbons from Spanish anthracite – I. Activation by KOH. Carbon N. Y. 39, 741–749. doi:10.1016/S0008-6223(00)00185-8
Nueangnoraj, K., Nishihara, H., Ishii, T., Yamamoto, N., Itoi, H., Berenguer, R., et al. (2015). Pseudocapacitance of zeolite-templated carbon in organic electrolytes. Energy Storage Mater. 1, 35–41. doi:10.1016/j.ensm.2015.08.003
Nueangnoraj, K., Ruiz-Rosas, R., Nishihara, H., Shiraishi, S., Morallón, E., Cazorla-Amorós, D., et al. (2014). Carbon–carbon asymmetric aqueous capacitor by pseudocapacitive positive and stable negative electrodes. Carbon N. Y. 67, 792–794. doi:10.1016/j.carbon.2013.10.011
Pandolfo, A. G., and Hollenkamp, A. F. (2006). Carbon properties and their role in supercapacitors. J. Power Sources 157, 11–27. doi:10.1016/j.jpowsour.2006.02.065
Peng, C., Zhang, S., Zhou, X., and Chen, G. Z. (2010). Unequalisation of electrode capacitances for enhanced energy capacity in asymmetrical supercapacitors. Energy Environ. Sci. 3, 1499–1502. doi:10.1039/C0EE00228C
Raymundo-Piñero, E., Kierzek, K., Machnikowski, J., and Béguin, F. (2006). Relationship between the nanoporous texture of activated carbons and their capacitance properties in different electrolytes. Carbon N. Y. 44, 2498–2507. doi:10.1016/j.carbon.2006.05.022
Roldán, S., Barreda, D., Granda, M., Menéndez, R., Santamaría, R., and Blanco, C. (2015). An approach to classification and capacitance expressions in electrochemical capacitors technology. Phys. Chem. Chem. Phys. 17, 1084–1092. doi:10.1039/C4CP05124F
Román-Martínez, M. C., Cazorla-Amorós, D., Linares-Solano, A., and de Lecea, C. S.-M. (1993). TPD and TPR characterization of carbonaceous supports and Pt/C catalysts. Carbon N. Y. 31, 895–902. doi:10.1016/0008-6223(93)90190-L
Ruiz-Rosas, R., Valero-Romero, M. J., Salinas-Torres, D., Rodríguez-Mirasol, J., Cordero, T., Morallón, E., et al. (2014). Electrochemical performance of hierarchical porous carbon materials obtained from the infiltration of lignin into zeolite templates. ChemSusChem 7, 1458–1467. doi:10.1002/cssc.201301408
Salinas-Torres, D., Sieben, J. M., Lozano-Castelló, D., Cazorla-Amorós, D., and Morallón, E. (2013). Asymmetric hybrid capacitors based on activated carbon and activated carbon fibre-PANI electrodes. Electrochim. Acta 89, 326–333. doi:10.1016/j.electacta.2012.11.039
Simon, P., and Burke, A. (2008). Nanostructured carbons: Double-layer capacitance and more. Electrochemical Society Interface 17, 38–43.
Simon, P., and Gogotsi, Y. (2008). Materials for electrochemical capacitors. Nat. Mater. 7, 845–854. doi:10.1038/nmat2297
Staiti, P., Arenillas, A., Lufrano, F., and Menéndez, J. Á (2012). High energy ultracapacitor based on carbon xerogel electrodes and sodium sulfate electrolyte. J. Power Sources 214, 137–141. doi:10.1016/j.jpowsour.2012.04.056
Stoller, M. D., and Ruoff, R. S. (2010). Best practice methods for determining an electrode material’s performance for ultracapacitors. Energy Environ. Sci. 3, 1294–1301. doi:10.1039/c0ee00074d
Vaquero, S., Palma, J., Anderson, M., and Marcilla, R. (2013). Mass-balancing of electrodes as a strategy to widen the operating voltage window of carbon/carbon supercapacitors in neutral aqueous electrolytes. Int. J. Electrochem. Sci 8, 10293–10307.
Vilella, I. M. J., de Miguel, S. R., de Lecea, C. S.-M., Linares-Solano, Á, and Scelza, O. A. (2005). Catalytic performance in citral hydrogenation and characterization of PtSn catalysts supported on activated carbon felt and powder. Appl. Catal. A 281, 247–258. doi:10.1016/j.apcata.2004.11.034
Wu, T.-H., Hsu, C.-T., Hu, C.-C., and Hardwick, L. J. (2013). Important parameters affecting the cell voltage of aqueous electrical double-layer capacitors. J. Power Sources 242, 289–298. doi:10.1016/j.jpowsour.2013.05.080
Yu, A., Chabot, V., and Zhang, J. (2013). Electrochemical Supercapacitors for Energy Storage and Delivery: Fundamentals and Applications. Boca Raton, FL: CRC Press.
Keywords: supercapacitors, activated carbons, electrochemistry, asymmetric capacitors, energy storage
Citation: Piñeiro-Prado I, Salinas-Torres D, Ruiz-Rosas R, Morallón E and Cazorla-Amorós D (2016) Design of Activated Carbon/Activated Carbon Asymmetric Capacitors. Front. Mater. 3:16. doi: 10.3389/fmats.2016.00016
Received: 14 December 2015; Accepted: 09 March 2016;
Published: 24 March 2016
Edited by:
Santosh Kumar Yadav, Drexel University, USAReviewed by:
Sihong Wang, Stanford University, USAMohd Omaish Ansari, King Abdulaziz University, Saudi Arabia
Copyright: © 2016 Piñeiro-Prado, Salinas-Torres, Ruiz-Rosas, Morallón and Cazorla-Amorós. This is an open-access article distributed under the terms of the Creative Commons Attribution License (CC BY). The use, distribution or reproduction in other forums is permitted, provided the original author(s) or licensor are credited and that the original publication in this journal is cited, in accordance with accepted academic practice. No use, distribution or reproduction is permitted which does not comply with these terms.
*Correspondence: Emilia Morallón, morallon@ua.es