Equilibrium Liquid Crystal Phase Diagrams and Detection of Kinetic Arrest in Cellulose Nanocrystal Suspensions
 Camila Honorato-Rios1
 Anja Kuhnhold2
Johanna R. Bruckner1
Anja Kuhnhold2
Johanna R. Bruckner1
 Rick Dannert3
Tanja Schilling2
Rick Dannert3
Tanja Schilling2  Jan P. F. Lagerwall1*
- 1Experimental Soft Matter Physics Group, Physics and Materials Science Research Unit, University of Luxembourg, Luxembourg City, Luxembourg
- 2Theory of Soft Condensed Matter Physics Group, Physics and Materials Science Research Unit, University of Luxembourg, Luxembourg City, Luxembourg
- 3Physics and Materials Science Research Unit, Laboratory for the Physics of Advanced Materials, University of Luxembourg, Luxembourg City, Luxembourg
The cholesteric liquid crystal self-assembly of water-suspended cellulose nanocrystal (CNC) into a helical arrangement was observed already more than 20 years ago, and the phenomenon was used to produce iridescent solid films by evaporating the solvent or via sol–gel processing. Yet, it remains challenging to produce optically uniform films and to control the pitch reproducibly, reflecting the complexity of the three-stage drying process that is followed in preparing the films. An equilibrium liquid crystal phase formation stage is followed by a non-equilibrium kinetic arrest, which in turn is followed by structural collapse as the remaining solvent is evaporated. Here, we focus on the first of these stages, combining a set of systematic rheology and polarizing optics experiments with computer simulations to establish a detailed phase diagram of aqueous CNC suspensions with two different values of the surface charge, up to the concentration where kinetic arrest sets in. We also study the effect of varying ionic strength of the solvent. Within the cholesteric phase regime, we measure the equilibrium helical pitch as a function of the same parameters. We report a hitherto unnoticed change in character of the isotropic–cholesteric transition at increasing ionic strength, with a continuous weakening of the first-order character up to the point where phase coexistence is difficult to detect macroscopically due to substantial critical fluctuations.
1. Introduction
Functional materials produced in a sustainable manner from renewable resources are currently enjoying, rapidly increasing attention across the world, in recognition of their potential to deliver solutions to increasingly complex technological demands without exhausting our limited fossile-based resources. Among the most interesting are single-phase and composite materials based on the polysaccharides chitin and cellulose (Dufresne, 2010; Habibi et al., 2010; Rey, 2010; Chung et al., 2011; Eichhorn, 2011; Klemm et al., 2011; Moon et al., 2011; Yao et al., 2013; Lagerwall et al., 2014), which are abundantly present and continuously reproduced within our planet’s animal and plant kingdoms, respectively, and offer many attractive physical and chemical properties. A particular focus is set on the crystalline nanorods that can be produced by mechanical processing followed by acid hydrolysis of various raw materials rich in these polysaccharides. Their surface chemistry can be readily tuned to allow easy suspension in aqueous solvents or for further chemical functionalization for incorporation in organic or inorganic matrices (Habibi, 2014), and the rods are mechanically strong, light-weight, transparent, and birefringent. Importantly, they have the attractive ability to self-organize into a long-range ordered, macroscopically anisotropic, liquid crystalline phase of chiral nematic (abbreviated N* and also called cholesteric) type when suspended in a liquid host at volume fractions beyond a threshold value φ0 (Onsager, 1949; Marchessault et al., 1959; Revol et al., 1992; Revol and Marchessault, 1993; Lagerwall et al., 2014). These suspensions are thus prime examples of anisotropic deformable biomaterials, the theme of this Frontiers Research Topic. The relatively high aspect ratio rod shape promotes the long-range orientational ordering along a common orientation (called the director) that is characteristic of nematic (N) liquid crystals (Onsager, 1949), and the chirality (*) of cellulose and chitin leads to a helical modulation of the director (de Gennes and Prost, 1993), with periods ranging from tens of micrometers down to some hundred nanometers.
The optical birefringence characteristic of liquid crystals coupled with the helical director modulation means that the refractive index varies periodically on the scale of the helix, turning a polysaccharide N* phase into a self-assembled biomaterial photonic crystal (Mitov, 2012). If the helix is allowed to reach the short sub-micron range, this can be seen by the naked eye as vivid iridescent colors being reflected from the sample. Typically, this happens when the water of an aqueous suspension of the rods is allowed to evaporate, leaving a thin paper-like film that displays striking colors across the whole visible spectrum (Beck et al., 2011, 2013; Tabor et al., 2012; Gray, 2013; Dumanli et al., 2014; Kelly et al., 2014; Lagerwall et al., 2014; Mu and Gray, 2014; Park et al., 2014). Moreover, due to the helical internal structure, the reflected light is circularly polarized with the same handedness as the helix (Dumanli et al., 2014; Lagerwall et al., 2014; Park et al., 2014). These photonic films have immediate application potential in many photonic materials and devices, e.g., in security papers for anti-counterfeiting purposes (Tabor et al., 2012), sensors (Giese et al., 2013a; Zhang et al., 2013), or in mirrorless lasing (Lagerwall et al., 2014; Wenzlik et al., 2014). Further enhancements are possible by letting the liquid crystalline order organize guest nanoparticles (Campbell et al., 2014; Liu et al., 2014; Nguyen et al., 2014; Querejeta-Fernandez et al., 2014) or template an inorganic or other organic phase that is synthesized within the polysaccharide suspension (Shopsowitz et al., 2010, 2012a,b, 2014; Kelly et al., 2012; Giese et al., 2013b; Khan et al., 2013). The self-assembled N* order also holds potential for creating extremely strong, yet light-weight composites, mimicking the helical internal structure of the most performing biocomposites found in Nature.
An important distinction from most other lyotropic liquid crystals is that the structure remains qualitatively intact during evaporation of the solvent, thanks to the locking-in of the ordered structure via a transition into a kinetically arrested state when the rod mass fraction w exceeds a threshold value wk. Although this non-equilibrium state introduces its own complications, as discussed below, it makes these systems much more useful than surfactant-based liquid crystals, which crystallize and thus develop a totally different structure upon drying (Bouligand, 2008; Dufresne, 2010; Rey, 2010; Moon et al., 2011; Weaver et al., 2012; Yao et al., 2013; Lagerwall et al., 2014).
The application of this new class of nanoparticle has been delayed, largely due to an unsatisfactory understanding of the complex procedure through which the photonic crystal film is formed during evaporation of the solvent. Fortunately, the picture now appears to be clearing up, thanks to an increased awareness of the multi-stage nature of the drying process (Lagerwall et al., 2014; Mu and Gray, 2014; Park et al., 2014). In a recent review (Lagerwall et al., 2014), we put the focus on the need to clearly distinguish between the equilibrium process as the pitch of the N* helix shrinks continuously in response to increasing mass fraction of the chiral nanorod, and the out-of-equilibrium process governing the end of the drying process, after the system has entered the kinetically arrested gel-like state at w > wk. The situation is complicated by the strong gradient in w that occurs in a still-standing droplet during water evaporation, which means that the surface layer, which has the highest nanorod fraction, gets kinetically arrested, while the bulk is still in the equilibrium liquid crystal state (Lagerwall et al., 2014). Although the gradient can be minimized by introducing a shear flow during drying (Park et al., 2014), this works only during the early stage of the drying process and the shear flow may be undesirable from other points of view.
Mu and Gray (2014) recently conducted an experimental study where this aspect was elegantly highligted, by adding d-(+)-glucose at varying concentration to drying suspensions of cellulose nanocrystals (CNC). The glucose has a twofold influence on the CNC suspension, on the one hand decreasing the pitch of the equilibrium N* phase, on the other hand reducing wk. The counterintuitive result is that the pitch in the final film is increased by glucose, although the equilibrium pitch prior to kinetic arrest is decreased, an outcome that can only be understood by considering the two main stages of evaporation individually. Another beautiful experiment, by Dumanli et al. (2014), gave further evidence of the two-step process. Here, real-time optical spectroscopic monitoring allowed the authors to follow the reduction in helix pitch throughout the process of evaporating the water, at controlled humidity values, finding a continuous pitch reduction followed by a discontinuous jump to the short-pitch value of the dry film as the final water leaves the sample.
In order to achieve good control of any product derived by evaporating the solvent from a CNC (or chitin nanocrystal) suspension, it is thus of crucial importance to develop a detailed understanding of each process separately. First, we must understand how the cholesteric phase formation from the low-concentration isotropic (I) phase, and the N* helix pitch, is influenced by parameters like nanorod dimensions and mass fraction, surface charge, and ionic strength of the solvent, then we must analyze what determines the threshold wk that separates the two stages, and finally we must model the structural changes that take place in the non-equilibrium system as the last remaining water evaporates.
In this paper, we focus on the first two aspects, launching a combined experimental and simulation thrust where we use CNC as our model system. We map out the liquid crystal phase diagram, in particular in the range of I–N* phase coexistence, determine the equilibrium helical pitch in the N* phase, and establish wk. We explore these issues as a function of nanorod mass fraction w for CNCs of two different values of the surface charge, and as a function of ionic strength by adding NaCl salt at selected concentrations cs. The systems are interrogated by polarizing optical investigations, rheological measurements, and atomic force microscopy, and these experimental data are complemented by results from computer simulations of a model CNC system.
Cholesteric liquid crystals have attracted much less attention than the other liquid crystalline phases in the computer simulations community, because it is difficult to handle the boundary conditions of a twisted simulation sample. In the literature, several models for chiral rods have been proposed, and their ensembles were shown to form cholesteric phases under certain conditions. These studies were either based on Onsager/Straley theory (Wensink and Jackson, 2011; Frezza et al., 2014), density functional theory (Dussi et al., 2015), or Monte Carlo simulations (Memmer, 2001; Germano et al., 2002; Varga and Jackson, 2003; Frezza et al., 2013; Kolli et al., 2014). They provide interesting information about various aspects of the phase behavior of chiral rods, yet the parameter space of the problem is vast and no study so far has focused specifically on the part that is relevant for CNC.
2. Materials and Methods
2.1. Cellulose Nanocrystal Production
Our CNC was prepared by sulfuric acid hydrolysis of commercial cotton (Roth, Germany), using two alternative acid/cotton ratios to obtain one low- and one high-surface charge batch (L-CNC and H-CNC, respectively). The former was prepared by dispersing 30 g of cotton in 300 mL of 64 wt.-% sulfuric acid (H2SO4) at 45°C, mixing with a mechanical overhead stirrer for 2 h. For the H-CNC, the same hydrolysis procedure was followed, but now 30 g of cotton was dispersed in 1500 mL of 64 wt.-% H2SO4. In both cases, the reaction was stopped by the addition of deionized water. The resulting dispersions were centrifuged three times with a large excess of fresh deionized water and subsequently purified using dialysis membranes in deionized water for a minimum of 4 days with daily exchange of water.
The suspensions were diluted to w = 1.5 wt.-% and sonicated for 10 min with an ultrasonic probe (Dr. Hielscher UP200St) equipped with a 2 mm diameter titanium tip, at an effective power density of 0.75 W cm–2. Thereafter the suspensions were concentrated to w ≈ 10 wt.-% by controlled evaporation of water at 35°C for ~20 min under reduced pressure (as generated by a water aspirator) using a rotary evaporator. During the process, the suspension was kept in a glass flask, the inside of which had been silanized using trichloro(octadecyl)silane at 1 vol.% in toluene, to avoid the formation of a CNC film as the concentration increased.
A series of relevant mass fractions w were obtained by dividing the two batches into aliquots and diluting with appropriate amounts of deionized water. Furthermore, to study the influence of ionic strength on the phase diagram and on the helix pitch, multiple samples with identical H- and L-CNC mass fractions, respectively, were prepared, with varying amounts of a stock solution of NaCl being added. This gave samples with NaCl content cs varying from 0 to 5 mM for each value of w investigated. The vials were then left standing at room temperature for 6 weeks, allowing gravity-induced vertical phase separation to occur when w was in the range of I–N* phase coexistence. All vials were silanized on the inside in order to minimize the meniscus formation at the liquid–air interface, as a flat interface greatly simplifies the quantitative analysis of the fractions of isotropic and liquid crystalline phases. To further facilitate the distinction of the phases, the vials were placed between crossed polarizers during observation.
2.2. Determination of CNC Concentration and Amount of Charged Surface Groups
The mass fraction of CNC was determined by weighing aliquots of the corresponding sample before and after the evaporation of water. To ensure complete evaporation, the samples were heated in an oven at 70°C for minimum 1 h.
The sulfate half-ester content of each CNC batch was determined by the conductometric titration method reported by Beck et al. (2015). We diluted each CNC suspension sample, prepared to contain 150 mg of cellulose (thus equivalent of 150 mg dry CNC), with deionized water to give a total volume of 200 mL. After the addition of 2 mL of 0.1 M NaCl solution, the suspension was titrated with 10 mM NaOH. The NaOH solution was added in 0.1 mL increments over a period of 30 min. The conductivity was recorded using a conductivity sensor (Eutech instrument, CON 450).
2.3. Atomic Force Microscopy (AFM) Investigation
A 20 μL volume of poly-l-lysine solution (0.01 vol.-%) was deposited onto a freshly cleaved mica surface (NanoAndMore GmbH) and was allowed to react for 3 min. Subsequently, the mica surface was rinsed with deionized water and dried with compressed air. The CNC dispersion to be investigated was diluted to 0.002 wt.-%, and 20 μL was placed on the treated surface for 3 min. After rinsing with deionized water, the samples were dried with compressed air, followed by drying in a vacuum oven at 30°C overnight in order to remove any excess water. A Multi-mode V AFM (Digital instruments Nanoscope Veeco) was used in tapping mode to image the samples, using AFM probes from Budget Sensors (Tap300 Al-G, resonance frequency 300 kHz and force constant 40 Nm–1). The dimensions of the CNC particles were manually measured using the software WSxM.
2.4. Polarized Optical Microscopy
Images of the liquid crystalline CNC suspensions between crossed polarizers were taken in transmission mode on an Olympus BX51 microscope equipped with an Olympus DP73 camera. The CNC suspensions were filled into 5 cm long capillaries with a rectangular cross-section of 0.20 mm × 4.0 mm (CM Scientific Ltd.). The capillaries were sealed with Super Mix Metal epoxy glue and stored at room temperature for 2 weeks before imaging. The pitch values were determined by measuring the spacing between lines in the fingerprint texture (the pitch is twice this spacing), using the software Image J.
2.5. Rheological Investigations
The aqeuous CNC suspensions were investigated rheologically for w between 2 and 10 wt.-%, using an Anton Paar MCR302 rotational rheometer in plate-plate geometry with diameter of 50 or 25 mm, depending on sample. For each sample, the flow curves were measured in a shear range between 0.01 and 100 s–1. The measurements were performed at room temperature and started immediately after the sample was placed into the rheometer in order to prevent an uncontrolled transition into a kinetically arrested state. To avoid the loss of water during investigations, sponges soaked with water were placed within the measurement chamber, ensuring saturated humidity. The dry content of the samples was determined before and after the measurement, revealing no change in w within measurement error.
To test for reproducibility of the data, an additional reference set of measurements was obtained for selected CNC suspensions using a second rotational rheometer (Haake Mars, Thermo Electron Cooperation) with a parallel plate geometry of 35 mm. Based on the complete set of data, we concluded that, for high-viscous samples, data in the range from 0.1 to 100 s–1 are of high quality and reliable, whereas for low-viscous samples this range is somewhat reduced to 4–100 s–1. All presented diagrams are thus limited to the respective reliable range, as are discussions and interpretations of the rheology data.
2.6. Monte Carlo Simulations
We model the chiral interactions between CNC rods by assuming a helical arrangement of charges on their surface. Specifically, a set of npc discrete point charges (pc) is placed along a line that wraps helically around a hard spherocylinder of length L and diameter D (called rod from here on). Figure 1 sketches this model for different values of the internal pitch pint (length of one full turn of the charge helix). While there are experimental indications that CNCs should rather be considered as twisted cuboids of large excentricity (Cherhal et al., 2015; Usov et al., 2015), the electrostatic interactions between spherocylinders with a helical charge distribution and a uniformly twisted cuboid with constant surface charge are in fact close to identical, hence our model should yield relevant results regardless of the exact shape and charge distributions on actual CNC.
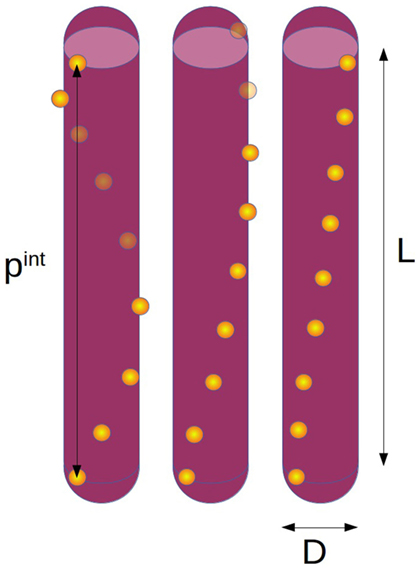
Figure 1. Sketch of the simulation model with length L, diameter D, and different internal pitches (left pint = L, middle pint = 2L, right pint = 4L) with the number of point charges per rod npc = 9.
The interaction potential between two point charges on different rods is given by a Yukawa potential:
where r is the distance between the point charges, kB Boltzmann’s constant, T the temperature, Zs the total charge on one rod, npc the number of point charges on one rod, λB the Bjerrum length (the distance where the electrostatic attraction potential between monovalent ions of opposite signs equals the thermal energy), and κ the Debye screening constant (κ−1 is the Debye screening length, which for practical purposes can be considered the effective range of electrostatic repulsion). The last two parameters are defined as:
with e the elementary charge, ϵ0 and ϵr the vacuum and relative permittivities, respectively, ρ the concentration of rods and cs the added salt concentration, i.e., Zsρ + 2cs is the total concentration of free ions (not connected to a rod) in the system. The value of λB is set to 0.7 nm, corresponding to water at T = 298 K, and the internal pitch is set to pint = 200 nm. The simulated ranges of w and cs are similar to those used in the experiments. The value of Zs is adjusted to match the experimental data, based on the surface charge obtained from conductometric titration, and average length L and diameter D are in the ranges estimated from AFM measurements. The system contains 1800 rods and the order parameter is averaged over 105 Monte Carlo steps in the NVT ensemble (constant particle number, sample volume and temperature). The simulation code is based on Metropolis Monte Carlo, and it has been written in house. Simulations were started in the nematic phase and equilibration was ensured by observing convergence of two particle positional and orientational correlation functions.
We study the nematic order parameter (the 3D ensemble average of the second Legendre polynomial, with β the angle of a rod with respect to the director) in dependence on the volume fraction φp of the physical rods (see below for the distinction between physical and effective rod volume), the surface charge and the salt concentration cs. The order parameter S2 reveals a transition from the isotropic (S2 = 0) to the N* phase (S2 > 0) upon increasing φp beyond a critical concentration φ0 (onset of phase separation) (Onsager, 1949).
3. Results
3.1. Preparation and Characterization of Cellulose Nanocrystals
The conductometric titration confirmed that the final CNC surface charge was lower when less acid was used for the hydrolysis. For the low acid/cellulose ratio (L-CNC), the measured surface charge was 23 mmol kg–1 compared to 37 mmol kg–1 for the higher acid/cellulose ratio (H-CNC). The AFM investigations revealed that there was also a considerable structural difference between the two samples. The H-CNC batch is substantially more polydisperse with a shorter average rod length than the L-CNC batch, cf. Figure 2. From a population of 200 rods, the average length was ~200 nm for H-CNC and ~250 nm for L-CNC. Moreover, while about 60% of the H-CNC rods were evenly distributed in the length range 100–250 nm, the L-CNC sample had more than one-third of its rods in a narrow length span from 200–250 nm, and more than 50% of the rods had lengths within 200–300 nm.
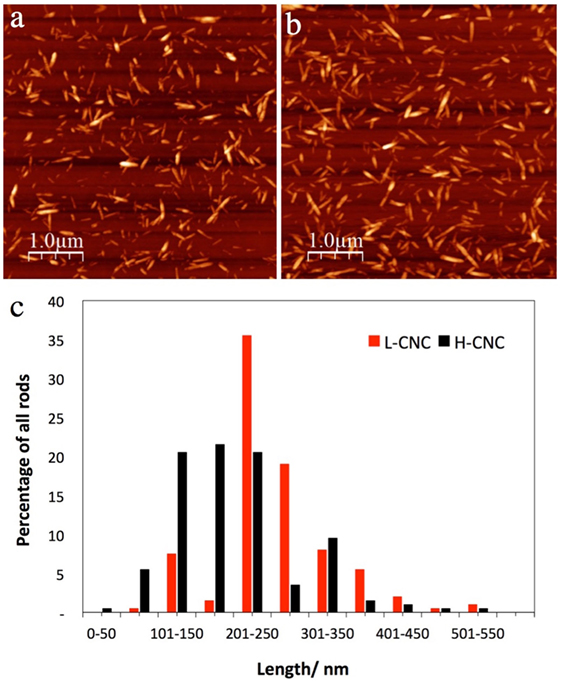
Figure 2. Representative AFM images of (A) L-CNC and (B) H-CNC, together with an overview (C) of the length distribution of both samples. In both cases, the CNC mass fraction in the starting suspension was w = 3 wt.-%.
The obtained higher surface charge for H-CNC supports the separation of individual crystals from each other during the ultra-sonication treatment, and counteracts reaggregation afterward, thanks to electrostatic repulsion between deprotonated sulfonate groups.
3.2. Equilibrium Phase Diagrams of Aqueous CNC Suspensions with Two Different Values of Surface Charge
The macroscopic phase separation in suspensions of L-CNC and H-CNC in pure water is presented in Figure 3. Beyond a critical mass fraction of w0 between 3 and 4 wt.-%, a certain macroscopic volume fraction Φ of cholesteric liquid crystal phase can be detected, sinking to the bottom due to its higher density compared to the isotropic phase (Onsager, 1949). As w increases, Φ should increase monotonically (but not linearly, since we have electrostatically stabilized rods (Dong et al., 1996; Lagerwall et al., 2014)) until all of the sample is liquid crystalline at a CNC mass fraction w1. For our samples, w1 was close to the onset of kinetic arrest wk, beyond which the sample no longer attains equilibrium, hence it is difficult to give a reliable value of w1. From the phase separation experiments in Figures 3A,B, it would appear that w1 ≈ 10 wt.-%. However, setting Φ = 1 for w = 10 wt.-% in the plot in Figure 3C would clearly break the trend, hence we believe that the apparent uniformity at w = 10 wt.-% is an artifact, the reason for which we will come back to below. We thus plot data only up to w = 9 wt.-%, and an extrapolation of the data indicates that w1 ≈ 11 wt.-% for H-CNC, somewhat lower for L-CNC. For each value of w, Φ was slightly lower for H-CNC than for L-CNC for a particular value of w, although the difference was rather small.
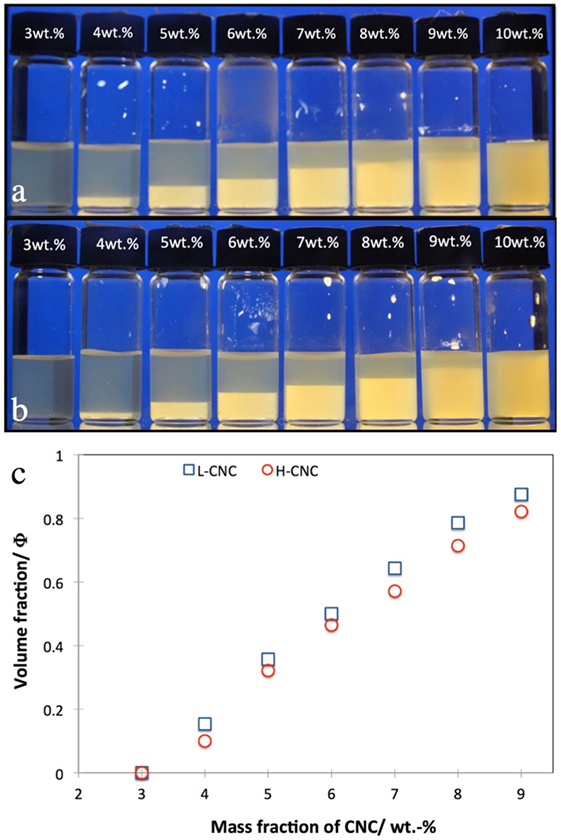
Figure 3. Phase separation in suspensions of cellulose nanocrystals (A) L-CNC; (B) H-CNC in pure water at different CNC mass fractions w, as indicated on each vial cap. The volume fraction Φ of cholesteric phase (bottom, bright between crossed polarizers) is plotted quantitatively for both series in the diagram in (C).
3.2.1. Effect of Added Salt on Phase Diagrams
In addition to studying the phase diagrams of the pure aqueous CNC suspensions, we also studied the effect of adding NaCl salt at various concentrations cs, for both batches of CNC. While studies of the effect of salt addition on CNC suspensions have been reported (Dong et al., 1996; Dong and Gray, 1997; Cherhal et al., 2015), there is so far, to the best of our knowledge, no critical comparison of the effect on CNC with different surface charges. In Figure 4, the effect of added NaCl at 1 < cs < 4 mM on the phase separation for L-CNC and H-CNC is shown, with the data for the suspensions without added salt included for comparison. For both batches, the threshold w0 for phase separation was shifted to higher w values by the NaCl addition.
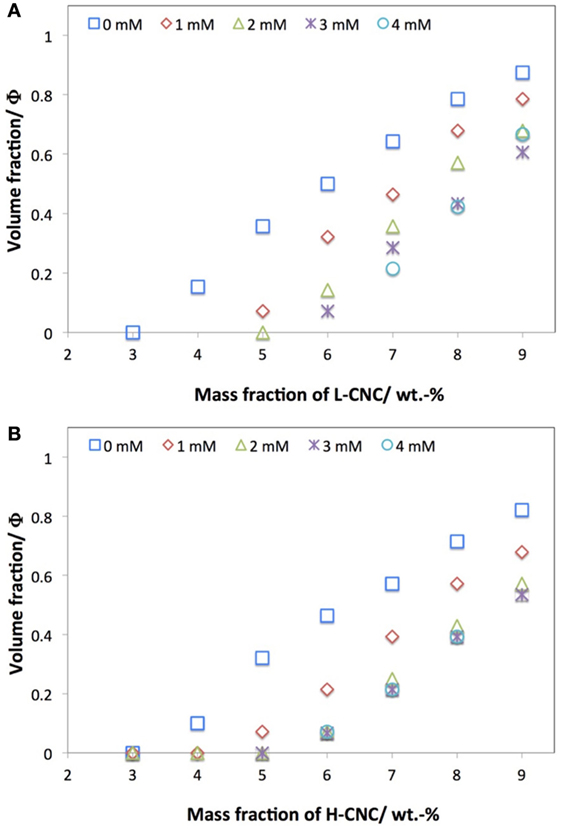
Figure 4. Effect of NaCl addition on the macroscopic volume fraction Φ of N* phase at different CNC concentrations for (A) L-CNC and (B) H-CNC.
A very interesting observation in the investigation of the samples with added salt, which has not been reported previously, is that the bottom (high-density) and top (low-density) phases became increasingly similar with added NaCl, cf. Figure 5. While the upper phase in the absence of NaCl is reasonably transparent (in particular for lower values of w, as shown in Figure 3), as expected for an isotropic phase, the scattering continuously increases with salt addition. This observation will be important in the Discussion ending the paper.
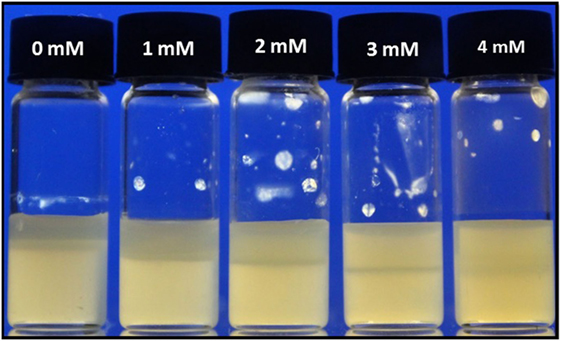
Figure 5. Phase separation of L-CNC suspensions with w = 9 wt.-%, at different concentrations cs of added NaCl. The fraction of the bottom phase is reduced by salt addition, but the difference in appearance of the two phases also gets increasingly weaker.
The added NaCl screens the sulfonate group charges on the CNC surface, weakening the electrostatic stabilization of the colloid, hence an increased degree of aggregation may be expected for samples with added salt. Indeed, this was confirmed by investigating some of the samples by AFM. Figure 6 shows AFM images of L-CNC and H-CNC at the high NaCl concentration of cs = 4 mM. As expected, the rods are aggregated to some extent compared to the salt-free images in Figure 2, the effect being stronger for H-CNC than for L-CNC. This indicates that the negative effect of increased screening with increasing ionic strength dominates over the positive effect of increased surface charge.
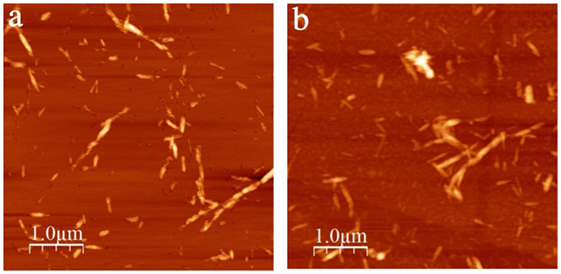
Figure 6. AFM images of nanocrystals on poly-l-lysine-coated mica substrates, for L-CNC in (A) and for H-CNC in (B), after addition of NaCl to the suspension. The samples were prepared from w = 4 wt.-% CNC suspensions to which cs = 4 mM NaCl had been added diluted to w′ = 0.002 wt.-% prior to dispensing on the substrate.
3.3. Helix Pitch of the Equilibrium Cholesteric CNC Phases
Some representative cholesteric fingerprint textures, obtained with 10 wt.-% suspensions of L-CNC and H-CNC, respectively, filled into flat glas capillaries, are presented in Figure 7. Comparing the L- and H-CNC samples, it is clear that the pitch is longer for the former than for the latter, a difference that can be recognized for all concentrations studied, cf. Figure 8. The difference may be traced back to the greater degree of surface charge, as well as to the smaller rod length of the H-CNC sample. As expected, considering that the source of chirality is the CNC (Lagerwall et al., 2014), the pitch always decreases with increasing w.
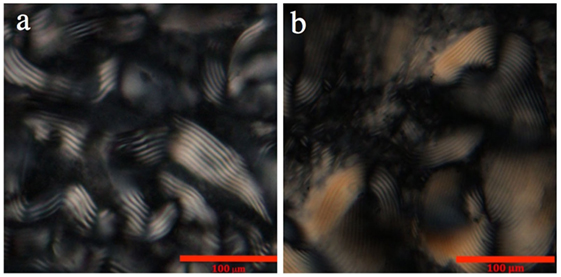
Figure 7. Fingerprint textures of L-CNC (A) and H-CNC (B) in deionized water at w = 10 wt.-%. From the images, pitch values of about 10 and 8 μm, respectively, can be estimated for the two CNC types.
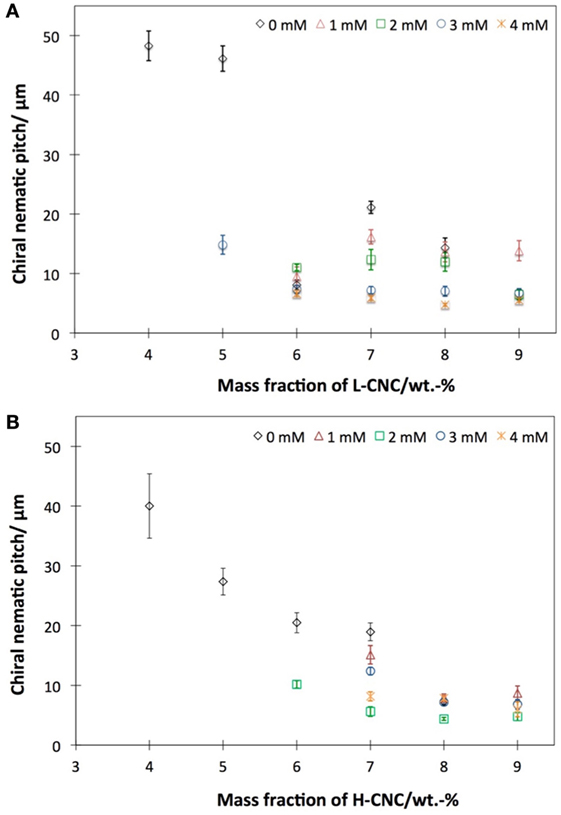
Figure 8. Approximate helix pitch in the chiral nematic phase of aqueous suspensions of (A) L-CNC and (B) H-CNC, as estimated from fingerprint textures in glass capillaries. Data plotted as diamonds are without added salt, while the other series represent varying amounts of added NaCl.
In order to evaluate the influence of ionic strength on the helix formation, samples with different cs were analyzed. In Figure 8, the helix pitch of L-CNC and H-CNC is plotted against w, for 0 < cs < 4 mM. For L-CNC, the pitch decreases essentially monotonically with increasing salt content up to cs = 2 mM. For greater cs, the pitch data were rather scattered, with large standard deviations. For H-CNC, the pitch initially also decreased with increasing NaCl concentration, but beyond cs = 2 mM the trend changed, possibly even reversed, with pitch values that could increase with further addition of NaCl up to the maximum cs = 4 mM investigated. The differences were not large, however, and the behavior was not entirely monotonic, as seen, e.g., at w = 7 wt.-%, where 3 mM NaCl gave substantially longer pitch than at cs = 2 mM, but a further increase to cs = 4 mM again reduced the pitch. As discussed in Section 4.2, these inconsistent variations may say more about the limitations of the method of measuring the pitch in glass capillaries than the actual helix response to salt addition.
3.4. Detection of Kinetic Arrest from Rheology Data
So far, we have not addressed the important question of the value of wk, the concentration at which the CNC system enters a kinetically arrested state. The task to establish this threshold is actually far from trivial, the best experimental technique being, in our opinion, rheological studies of the viscous response of the CNC suspensions. In Figure 9, the shear viscosity measured for different shear rates is plotted versus w. The onset concentrations w0 for the I–N* phase transition, as estimated from Figure 3, are indicated as dotted vertical lines.
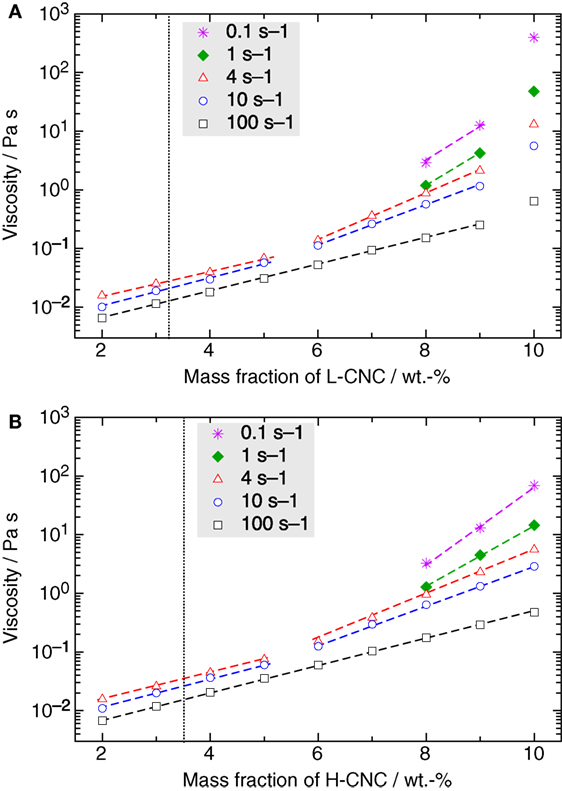
Figure 9. Semi-logarithmic representation of the viscosity versus mass fraction w of (A) L-CNC and (B) H-CNC for different shear rates. The transition from isotropic to the biphasic region, as estimated from the phase separation experiments in Figure 3, is indicated by a dotted vertical line. In general, there is a logarithmic increase of the viscosity with increasing mass fraction of CNC, with a slope in this lin–log diagram changing around 5 wt.-% for low shear rates. (Dashed lines are guides for the eyes to highlight this behavior.) However, in the case of L-CNC a sudden jump in the values occurs beyond w ≥ 10 wt.-%, indicating that the concentration threshold for kinetic arrest is between 9 and 10 wt.-%.
For all suspensions, the viscosity increases monotonically with increasing w, at all investigated shear rates. For w < 10 wt.-%, the viscosity curves are very similar for L- and H-CNC. We can, for both types of CNC, distinguish two types of behavior, for low and high shear rates, respectively. In the latter case, here represented by the data obtained at 100 s–1 shear rate, the increase with w is logarithmic (the curve in the lin–log diagram appears linear) as long as w < wk. In the L-CNC data, we can easily distinguish wk through the sudden superlogarithmic increase of the viscosity at w = 10 wt.-%. In fact, at all shear rates an increase in viscosity upon reaching w = 10 wt.-%, that is much greater than the trend for lower CNC concentrations can be detected, indicating that 9 < wk < 10 wt.-% for L-CNC. At w = 10 wt.-%, the viscosity at 100 s–1 suddenly rises to 0.64 Pa s from <0.3 Pa s at w = 9 wt.-%, and for a shear rate of 0.1 s–1, the corresponding increase is from just above 10 Pa s to 0.40 kPa s. For H-CNC, in contrast, no such change in trend can be seen at any shear rate, indicating that wk > 10 wt.-% for this CNC type. At a shear rate of 100 s–1, the H-CNC viscosity increases logarithmically, with constant slope in the lin–log diagram, from 6.7 mPa s to 0.47 Pa s by increasing w from 2 to 10 wt-%. For the low shear rate of 0.1 s–1, the viscosity peaks at 69 Pa s for highly concentrated samples.
The conclusion concerning wk from the rheological investigations is corroborated by a simple, more qualitative observation, by gently turning sample vials upside down. For all H-CNC suspensions and for all L-CNC suspensions with w < 10 wt.-%, the suspension flows down to the bottom, more or less rapidly depending on the concentration. This demonstrates that these are all in fluid states, even though the viscosity can be rather high for the higher values of w. In contrast, the 10 wt.-% suspension of L-CNC stays at the top, unchanged in shape, even after several hours or days. This is a clear indication that this sample is kinetically arrested.
3.5. Results from Monte Carlo Simulation
Figure 10 shows the nematic order parameter S2 in dependence on the physical rod volume fraction φp of rods with diameter D = 10 nm, length L = 20D, and internal pitch pint = 20D for two different surface charges and six different concentrations cs of added monovalent salt. With increasing cs, the I–N* transition shifts to higher φp in accordance with the experimental results shown above. Note that the volume fraction φp on the x-axis in Figure 10 is the volume fraction of the physical rod, thus of the cellulose without the “padding” from electrostatic repulsion (discussed further in Section 4.2). This is directly proportional to the mass fraction w considered in the experimental part.
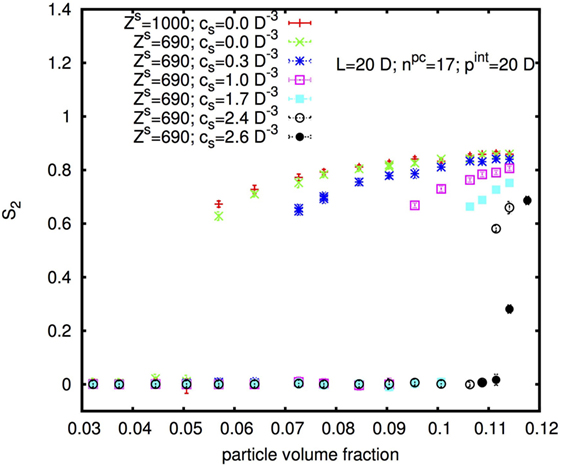
Figure 10. Isotropic-nematic transition as a function of rod physical volume fraction, for rods with diameter D = 10 nm, length L = 20D, and internal pitch pint = 20D for different surface charges and different added salt concentrations cs.
Interestingly, an increase in the surface charge appears to shift the I–N* transition to slightly lower rod concentration in contradiction to the experimental results, for which, w0 was found to be slightly higher for H-CNC than for L-CNC. We will come back to this observation, and how it should be compared to the experimental observations, in the Discussion ending the paper.
A further illustration of the complex influence of the CNC surface charge can be seen in the diagram in Figure 11. Here S2 is plotted for rods with diameter D = 5 nm, length L = 15D, and internal pitch pint = 40D, at constant φp (and thus for constant w), in dependence of the surface charge. It is apparent that S2 first increases from zero to a rather high plateau value, but then again decreases for very high-surface charge. Thus, at very low- and very high-surface charge the system is isotropic, while in between it is chiral nematic. The lower limit is zero surface charge, which is the hard spherocylinder case, where the system is in the isotropic phase at the given concentration. And the upper limit is when the surface charge is so high that κ → ∞ or κ–1 → 0, which effectively means that there again is no electrostatic interaction (UY = 0), hence we are back to the hard spherocylinder case. A benefit of computer simulations is that we can much easier probe a greater parameter space than in experiments, and here the simulations were partially in a different region concerning the surface charge dependence.
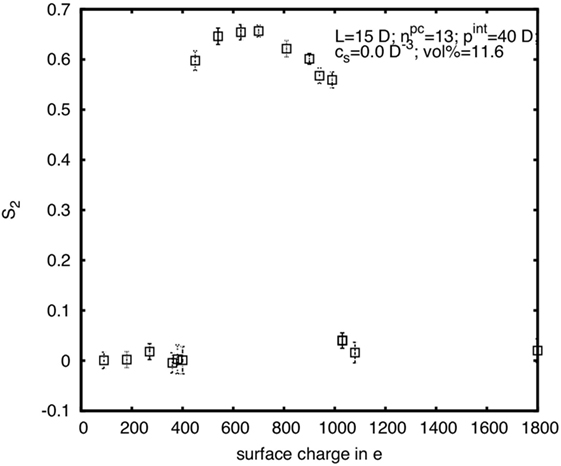
Figure 11. Nematic order parameter in dependence on the surface charge for rods with diameter D = 5 nm, length L = 15D, and internal pitch pint = 40D at a rod volume concentration of φp = 11.6%.
4. Discussion
4.1. Isotropic–Cholesteric Phase Separation
Looking at the upper isotropic phase fractions in Figure 3, we notice that they become increasingly bright as w is increased, giving rise to the difficulties in detecting phase separation in the 10 wt.-% vials. We will be able to give a tentative explanation for this behavior below. In both series we also see that a top layer, and for the generally isotropic 3 wt.-% samples also a bottom layer, is anomalously bright between crossed polarizers. This is indicative of long-range anisotropic order. We hypothesize that this is due to interface-induced ordering, leading to localized liquid crystal formation even when the adjacent bulk phase is isotropic. This conjecture is strengthened by our polarizing microscopy observations of the isotropic phases filled into capillaries (not shown), where we frequently noticed a weak schlieren texture characteristic of nematic ordering, overlaid on a black background that contained cholesteric tactoids if the phase coexistence regime had been reached. We assume that this texture arose from the same type of interface-induced liquid crystal ordering close to each capillary wall, although the bulk sample was predominantly isotropic.
In the L-CNC sample with w ≈ 9 wt.-%, we noticed a curious separation into three, rather than two, macroscopically distinct phases. Such three-phase separation in CNC suspensions has been observed before (Kimura et al., 2005; Schütz et al., 2015) although no explanation has been given. Indeed, it is far from obvious why a highly polydisperse suspension would separate into specifically three phases. We are currently investigating this issue, following two alternative hypotheses. On the one hand, we consider the possibility that only the top and bottom phases are in equilibrium, whereas the middle phase is in a non-equilibrium state where kinetic barriers between domains with subtle structural and/or compositional differences prevent the merging with the bottom, equilibrium, N* phase. On the other hand, it may be the narrower length distribution with a strong dominance for rods in the range 200–250 nm that strengthens the tendency of the phase separation phenomenon to induce a fractionation by rod length (Dong et al., 1998; Zhang et al., 2006), thus giving rise to two N* phases with strong difference in average rod length and polydispersity.
4.2. Influence of Solvent Ionic Strength
As for any electrostatically stabilized colloidal suspension, ions dissolved in the water affect the phase diagram of the CNC suspensions, a phenomenon that can most simply be traced back to the resulting change in effective particle size and anisotropy. As is clear from equation (3), salt addition reduces the Debye screening length κ–1. While this has a negligible relative influence on the length, which is orders of magnitude greater than κ–1, the relative reduction in effective diameter can be significant when the physical rod diameter is comparable to κ–1. This has two simultaneous consequences with antagonistic influences on the phase diagram. First, the effective aspect ratio increases, which according to basic Onsager theory (Onsager, 1949) reduces the volume fraction threshold φ0 for liquid crystal formation. Considering only this respect, adding salt at constant w would promote liquid crystal phase formation. In reality, however, the effect of salt addition is the opposite, as confirmed in both experiments and simulations. This is because salt addition also reduces the effective volume of each rod. The total effective rod volume fraction φ thus goes down with increasing salt concentration at constant w. This effect dominates over the change in effective aspect ratio, which scales linearly with κ via L/(D + 2κ–1), while the reduction in volume fraction scales with the square of κ, νrod = Lπ(D/2 + κ–1)2. We thus always see a decrease in the fraction of anisotropic phase upon salt addition.
The relative effect of salt addition is strong at low cs, for both CNC series, but the response is saturated rather rapidly, with no significant difference being seen between the 3 and 4 mM NaCl series. One might expect a larger difference in the saturation value between the two series, since H2SO4-treated CNC itself is ionic, and thus contributes to the ionic strength. In other words, if ionic strength was the only important parameter, less NaCl ought to be needed to reach saturation for H-CNC. However, the greater surface charge present on the H-CNC nanorods affects the close-range interactions considerably, whereas the NaCl addition affects only the Debye screening length κ–1.
Comparing with the literature, we find that Hirai et al. (2009) reported for suspensions of high aspect ratio bacterial CNC, a complex non-monotonic response to NaCl salt addition at a fix value of w. For cs up to 1 mM, Φ decreased, but for higher concentrations (the study went up to cs = 5 mM) the N* fraction again began increasing, apparently reaching Φ = 1 already for cs ≈ 2 mM for w = 3 wt.-%. In contrast, Dong et al. (1996) only observed a linear drop in Φ for their filter paper-derived CNC as NaCl was added at constant w = 8.1 wt.-%. However, their study did not extend beyond cs = 2.4 mM.
Our results differ from both these trends. Salt addition never entirely removes the N* phase, as seen by Dong et al. (1996), but we also do not see the trend reversal that Hirai et al. observed, for either of our CNC batches. The fact that three distinctly different responses to salt addition can be observed highlights one of the great challenges in CNC research, namely the extreme variation in behavior depending on CNC source and treatment. Comparing the three studies, we note that the Hirai et al. study used exceptionally long and slender bacterial CNC nanorods, with rather low surface charge (about half of that of our L-CNC), whereas the CNC studied by Dong et al. had about three times higher surface charge, thus somewhat higher than our H-CNC, and their average rod length was rather small, about 115 nm.
The increase in scattering observed as salt is added to the samples in the phase coexistence regime, leading to the gradually increasing similarity between lower and upper phases, is a behavior typically connected to a second-order (continuous) phase transition, where critical fluctuations are very important (Landau and Lifschitz, 1980; Giesselmann, 1997). A strongly first-order (discontinuous) transition is rather characterized by clean phase separation without significant scattering, as seen in our experiments with low ionic strength. It may thus be that a part of the reason for decreasing Φ with added salt is a continuously weakened barrier between the energy minima corresponding to isotropic and cholesteric phase, respectively, as well as a decreased discontinuity in the nematic order parameter. As a consequence, the compositional difference between the isotropic and liquid crystal phases is reduced as cs increases. With the isotropic and liquid crystal phases approaching each other in character, and the barrier between them decreasing, it becomes increasingly likely that a fluctuation leads to temporary and localized anisotropic phase development, tiny cholesteric droplets constantly forming and dissolving, already for w < w0. This would explain the scattering seen in the upper phase when NaCl is added. Indeed, our simulation results also indicate that the first-order character of the I–N* transition is weakened as the ionic strength is increased. We may now also understand why the upper isotropic phase in the experiment in Figure 3 becomes increasingly bright and scattering upon increasing w, with indistinguishable phase separation at w = 10 wt.-%: also the CNC itself contributes to the ionic strength, since it is electrostatically stabilized through its non-zero surface charge, hence the first-order I–N* transition character weakens as the CNC concentration increases, leading to critical fluctuations and consequent scattering once w approaches w1. It should be noted, however, that the gradually increasing scattering of the upper isotropic phase is not always observed, hence with other types of CNC, e.g., that used in the study by Schütz et al. (2015), this dependence on solvent ionic strength of the transition character may be much weaker.
The erratic variations in pitch as the concentration of added NaCl was varied indicate that analysis of fingerprint textures of samples filled into capillaries is not the best method to determine the helix pitch, most likely due to surface-induced deviations from the equilibrium value as well as the lack of control of the helix orientation within the capillary. A better method may be laser scattering from bulk samples, as used in a recent study by Schütz et al. (Schütz et al., 2015).
The general trend of decreasing pitch upon salt addition is nevertheless rather clear, and this can be understood as an effect of the reduced effective rod diameter. This brings the centers of mass of adjacent CNC rods closer to each other and thus increases the intensity of chiral interactions (Dong et al., 1996; Lagerwall et al., 2014). An increasing pitch with increasing ionic strength, as suggested by a few experiments in our study, and much clearer by Hirai et al. (2009), remains to be explained.
4.3. Kinetic Arrest
There may be several explanations to the lower value of wk for L-CNC compared to H-CNC. First, the lower surface charge means that the electrostatic stabilization fundamentally is weaker, rendering contacts between rods more likely, and thereby increasing the chance of long-term aggregation. Second, the greater average physical rod size in the L-CNC sample, due to reduced screening from counter ions in the solvent, increases the total rod volume fraction φ at a certain w. This promotes long-range network formation and thus reduces the apparent percolation threshold. Together with the increased risk of rod-rod contact, this makes a rigidity percolation event, corresponding to kinetic arrest, more likely.
The low shear rate behavior is a little different from the behavior at high shear rates, for both CNC series. Up to w ≈ 5 wt.-%, the viscosity increase with CNC concentration is logarithmic, with a constant slope in the lin–log diagram, as for the high shear rate studies. However, from w ≈ 6 wt.-%, the slope increases for lower shear rates. As we are in the I–N* coexistence regime, this indicates that the low shear rate is insufficient to fully unwind the cholesteric helix and align the director uniformly in anisotropic domains, leading to a slightly higher viscosity than what an extrapolation of the low-concentration trend would yield. If the instrument would have been able to measure also the low-concentration samples at low shear rates, we expect that we would have seen this change of slope already at lower values of w, down to w0 for sufficiently low shear rates. But at a shear rate of 4 s–1 and higher, the N* domains at the low-concentration end of the biphasic regime are apparently uniformly aligned.
It is interesting to compare the above observations with earlier reports from rheological studies on CNC suspensions. A direct comparison of the data is, however, challenging, as the behavior strongly depends on the source of the CNC and the preparation process (Bercea and Navard, 2000; de Souza Lima and Borsali, 2004; Urena-Benavides et al., 2011), the sonication time (Shafiei-Sabet et al., 2012), and the ion content (Chau et al., 2015). There has been some work on the influence of the surface charges on the viscosity of CNC. In 2013, Shafeiei-Sabet et al. (2013) investigated the rheological properties of two different CNC samples with different degrees of sulfation and found that CNC with lower surface charge gets kinetically arrested at lower mass fractions than CNC with high-surface charge, similar to our observations. Unfortunately, they did not provide any information on the physical rod lengths in their samples, making an in-depth comparison difficult. Araki et al. (1998, 1999) investigated CNC produced by acidic hydrolysis with HCl or H2SO4, resulting in CNC with similar particle dimensions but low- or high-surface charge, respectively. Their experiments revealed that the viscosity of their CNCs was strongly affected by the surface charge, in absolute values as well as in the time dependence, the highly charged CNC produced by H2SO4 hydrolysis exhibiting lower viscosities. However, they did not give information on the impact of the surface charges on the phase behavior. CNC prepared by treatment with H2SO4 but with different hydrolysis times were investigated by Li et al. (2015). These authors also found that the viscosity decreased with stronger sulfation of the surfaces, achieved by increased hydrolysis time. Furthermore, they showed that w0 was shifted to higher values for longer hydrolysis times. The authors did not, however, relate that behavioral change to a different surface charge, but rather to a lower aspect ratio of the CNC resulting from longer duration of the acidic hydrolysis.
4.4. Comparison between Experimental and Simulation Results
Since it is difficult to exactly match the model parameters to the actual CNC samples, which are highly polydisperse in rod length and thickness, it is not straightforward to quantitatively compare simulation and experimental results. However, we can use the monotonic behavior of S2 to compare the trends for φ0 versus surface charge and cs obtained from simulation, with the corresponding experimental trends. If salt addition according to simulations leads to a decrease in S2 at fixed w, the critical concentration φ0 increases.
A striking, and very important, result of changing the ionic strength by increasing the added salt concentration in Figure 10, seen clearly between the cs = 1.7 and cs > 1.7D–3 data for low surface charge, is the change in the magnitude of order parameter discontinuity at the I–N* phase transition. It is notably smaller for high cs than for samples where the ionic strength is low. In other words, increasing the ionic strength reduces the strength of the first-order character of the I–N* transition, in accordance with our experimental observations. Considering this change in the transition character, quantitative comparisons of thresholds between samples with different ionic strength obviously become difficult.
5. Conclusion
In suspensions of cellulose nanocrystals (CNC), the equilibrium phase sequence and structural parameters, as well as the concentration where kinetic arrest into a non-equilibrium state sets in, are highly sensitive to the ionic strength of the solution. This applies whether the ionic strength is tuned by salt addition, through variations of the surface charge of the rods, or through variations in their concentration. Increased ionic strength shifts the phase sequence toward the isotropic phase, raising the onset mass fraction threshold w0 of liquid crystalline order. It also reduces the equilibrium helix pitch in the cholesteric phase. Both phenomena can be understood as a result of weakened electrostatic repulsion between rods, reducing the effective volume fraction (explaining the shift in phase sequence) and allowing closer approach of adjacent rods (explaining the shorter pitch as a result of stronger chiral interactions). High CNC surface charge appears to increase the mass fraction at which the suspension gets kinetically arrested, as detected by rheological experiments. We cannot rule out, however, that also the variation in average rod length and polydispersity between our batches with low- and high-surface charge may have had an impact.
Our experiments and computer simulations also indicate that the ionic strength of the solvent influences the character of the isotropic–chiral nematic transition. With increasing ionic strength, this transition appears to gradually loose its normally, strongly first-order character, eventually reaching a state where critical fluctuations give rise to strong light scattering. Since the CNC itself introduces counterions into solution, even an increase of the CNC mass fraction can trigger this change, such that it can be difficult to distinguish the isotropic from the nematic phase toward the high mass fraction end of the biphasic regime of the phase diagram. This is of practical importance in terms of establishing the phase diagram, as it can be very challenging to accurately determine the fraction w1 where the entire sample is in the chiral nematic state. As there are experimental studies where no strong scattering in the isotropic phase was observed, it appears that this change in character of the phase transition also depends on the characteristics of the CNC. It is a stimulating challenge for further studies to better understand when and why this phenomenon arises.
Author Contributions
The CNC was synthesized by CH-R, who also did the characterization apart from the rheological investigations, which were conducted by JB and RD. AK and TS developed the simulation code and AK carried out the computer simulations. JL wrote the final manuscript. JL and TS oversaw the study and did the overall analysis.
Conflict of Interest Statement
The authors declare that the research was conducted in the absence of any commercial or financial relationships that could be construed as a potential conflict of interest.
Acknowledgments
The simulations presented in this paper were carried out using the HPC facilities of the University of Luxembourg, see http://hpc.uni.lu (Varrette, 2014). We thank Nina Schwarz for her assistance with the CNC synthesis and Marlena Filimon for initial assistance with the AFM.
Funding
Financial support is kindly acknowledged from the Luxembourg National Research Fund (FNR; project MISONANCE, grant code C14/MS/8331546) and, for JB, from the Dr. Leni Schöninger Foundation.
References
Araki, J., Wada, M., Kuga, S., and Okano, T. (1998). Flow properties of microcrystalline cellulose suspension prepared by acid treatment of native cellulose. Colloid Surf. A 142, 75–82. doi: 10.1016/S0927-7757(98)00404-X
Araki, J., Wada, M., Kuga, S., and Okano, T. (1999). Influence of surface charge on viscosity behavior of cellulose microcrystal suspension. J. Wood Sci. 45, 258–261. doi:10.1007/BF01177736
Beck, S., Bouchard, J., and Berry, R. (2011). Controlling the reflection wavelength of iridescent solid films of nanocrystalline cellulose. Biomacromolecules 12, 167–172. doi:10.1021/bm1010905
Beck, S., Bouchard, J., Chauve, G., and Berry, R. (2013). Controlled production of patterns in iridescent solid films of cellulose nanocrystals. Cellulose 20, 1401–1411. doi:10.1007/s10570-013-9888-4
Beck, S., Méthot, M., and Bouchard, J. (2015). General procedure for determining cellulose nanocrystal sulfate half-ester content by conductometric titration. Cellulose 22, 101–116. doi:10.1007/s10570-014-0513-y
Bercea, M., and Navard, P. (2000). Shear dynamics of aqueous suspensions of cellulose whiskers. Macromolecules 33, 6011–6016. doi:10.1021/ma000417p
Bouligand, Y. (2008). Liquid crystals and biological morphogenesis: ancient and new questions. C. R. Chim. 11, 281–296. doi:10.1016/j.crci.2007.10.001
Campbell, M., Liu, Q., Sanders, A., Evans, J., and Smalyukh, I. (2014). Preparation of nanocomposite plasmonic films made from cellulose nanocrystals or mesoporous silica decorated with unidirectionally aligned gold nanorods. Materials 7, 3021–3033. doi:10.3390/ma7043021
Chau, M., Sriskandha, S. E., Pichugin, D., Therien Aubin, H. L. S., Nykypanchuk, D., Chauve, G., et al. (2015). Ion-mediated gelation of aqueous suspensions of cellulose nanocrystals. Biomacromolecules 16, 2455–2462. doi:10.1021/acs.biomac.5b00701
Cherhal, F., Cousin, F., and Capron, I. (2015). Influence of charge density and ionic strength on the aggregation process of cellulose nanocrystals in aqueous suspension, as revealed by small-angle neutron scattering. Langmuir 31, 5596–5602. doi:10.1021/acs.langmuir.5b00851
Chung, W.-J., Oh, J.-W., Kwak, K., Lee, B. Y., Meyer, J., Wang, E., et al. (2011). Biomimetic self-templating supramolecular structures. Nature 478, 364–368. doi:10.1038/nature10513
de Souza Lima, M. M., and Borsali, R. (2004). Rodlike cellulose microcrystals: structure, properties, and applications. Macromol. Rapid Commun. 25, 771–787. doi:10.1002/marc.200300268
Dong, X., and Gray, D. (1997). Effect of counterions on ordered phase formation in suspensions of charged rodlike cellulose crystallites. Langmuir 13, 2404–2409. doi:10.1021/la960724h
Dong, X., Kimura, T., Revol, J., and Gray, D. (1996). Effects of ionic strength on the isotropic-chiral nematic phase transition of suspensions of cellulose crystallites. Langmuir 12, 2076–2082. doi:10.1021/la950133b
Dong, X., Revol, J., and Gray, D. (1998). Effect of microcrystallite preparation conditions on the formation of colloid crystals of cellulose. Cellulose 5, 19–32. doi:10.1023/A:1009260511939
Dufresne, A. (2010). Processing of polymer nanocomposites reinforced with polysaccharide nanocrystals. Molecules 15, 4111–4128. doi:10.3390/molecules15064111
Dumanli, A., Kamita, G., Landman, J., van der Kooij, H., Glover, B., Baumberg, J., et al. (2014). Controlled, bio-inspired self-assembly of cellulose-based chiral reflectors. Adv. Opt. Mater. 2, 646–650. doi:10.1002/adom.201400112
Dussi, S., Belli, S., van Roij, R., and Dijkstra, M. (2015). Cholesterics of colloidal helices: predicting the macroscopic pitch from the particle shape and thermodynamic state. J. Chem. Phys. 142, 074905. doi:10.1063/1.4908162
Eichhorn, S. J. (2011). Cellulose nanowhiskers: promising materials for advanced applications. Soft Matter 7, 303–315. doi:10.1039/C0SM00142B
Frezza, E., Ferrarini, A., Kolli, H. B., Giacometti, A., and Cinacchi, G. (2013). The isotropic-to-nematic phase transition in hard helices: theory and simulation. J. Chem. Phys. 138, 164906. doi:10.1063/1.4802005
Frezza, E., Ferrarini, A., Kolli, H. B., Giacometti, A., and Cinacchi, G. (2014). Left or right cholesterics? A matter of helix handedness and curliness. Phys. Chem. Chem. Phys. 16, 16225–16232. doi:10.1039/c4cp01816h
Germano, G., Allen, M. P., and Masters, A. J. (2002). Simultaneous calculation of the helical pitch and the twist elastic constant in chiral liquid crystals from intermolecular torques. J. Chem. Phys. 116, 9422. doi:10.1063/1.1475747
Giese, M., De Witt, J., Shopsowitz, K., Manning, A., Dong, R., Michal, C., et al. (2013a). Thermal switching of the reflection in chiral nematic mesoporous organosilica films infiltrated with liquid crystals. ACS Appl. Mater. Interfaces 5, 6854–6859. doi:10.1021/am402266z
Giese, M., Khan, M. K., Hamad, W. Y., and MacLachlan, M. J. (2013b). Imprinting of photonic patterns with thermosetting amino-formaldehyde-cellulose composites. ACS Macro Lett. 2, 818–821. doi:10.1021/mz4003722
Giesselmann, F. (1997). Smectic A–C Phase Transitions in Liquid Crystals. Habilitation thesis, Clausthal University of Technology, Clausthal-Zellerfeld.
Gray, D. G. (2013). Iridescent films from cellulose nanocrystals: chiral nematic or smectic multi-lamellar structure. J-FOR 3, 6–8.
Habibi, Y. (2014). Key advances in the chemical modification of nanocelluloses. Chem. Soc. Rev. 43, 1519–1542. doi:10.1039/c3cs60204d
Habibi, Y., Lucia, L., and Rojas, O. J. (2010). Cellulose nanocrystals: chemistry, self-assembly, and applications. Chem. Rev. 110, 3479–3500. doi:10.1021/cr900339w
Hirai, A., Inui, O., Horii, F., and Tsuji, M. (2009). Phase separation behavior in aqueous suspensions of bacterial cellulose nanocrystals prepared by sulfuric acid treatment. Langmuir 25, 497–502. doi:10.1021/la802947m
Kelly, J., Giese, M., Shopsowitz, K., Hamad, W., and Maclachlan, M. (2014). The development of chiral nematic mesoporous materials. Acc. Chem. Res. 47, 1088–1096. doi:10.1021/ar400243m
Kelly, J. A., Shopsowitz, K. E., Ahn, J. M., Hamad, W. Y., and MacLachlan, M. J. (2012). Chiral nematic stained glass: controlling the optical properties of nanocrystalline cellulose-templated materials. Langmuir 28, 17256–17262. doi:10.1021/la3041902
Khan, M., Giese, M., Yu, M., Kelly, J., Hamad, W., and MacLachlan, M. (2013). Flexible mesoporous photonic resins with tunable chiral nematic structures. Angew. Chem. (Int. Ed.) 52, 8921–8924. doi:10.1002/anie.201303829
Kimura, F., Kimura, T., Tamura, M., Hirai, A., Ikuno, M., and Horii, F. (2005). Magnetic alignment of the chiral nematic phase of a cellulose microfibril suspension. Langmuir 21, 2034–2037. doi:10.1021/la0475728
Klemm, D., Kramer, F., Moritz, S., Lindstrom, T., Ankerfors, M., Gray, D., et al. (2011). Nanocelluloses: a new family of nature-based materials. Angew. Chem. Int. Ed. 50, 5438–5466. doi:10.1002/anie.201001273
Kolli, H., Frezza, E., Cinacchi, G., Ferrarini, A., Giacometti, A., and Hudson, T. (2014). Communication: from rods to helices: evidence of a screw-like nematic phase. J. Chem. Phys. 140, 081101. doi:10.1063/1.4866808
Lagerwall, J. P. F., Schütz, C., Salajkova, M., Noh, J., Park, J. H., Scalia, G., et al. (2014). Cellulose nanocrystal-based materials: from liquid crystal self-assembly and glass formation to multifunctional thin films. NPG Asia Mater. 6, e80. doi:10.1038/am.2013.69
Landau, L., and Lifschitz, E. M. (1980). “Phase transitions of the second kind and critical phenomena,” in Statistical Physics (vol. 5), 3rd Edition, part 1 (Oxford: Butterworth-Heinemann), 446–4471.
Li, M.-C., Wu, Q., Song, K., Lee, S., Qing, Y., and Wu, Y. (2015). Cellulose nanoparticles: structure-morphology-rheology relationships. ACS Sustain. Chem. Eng. 3, 821–832. doi:10.1021/acssuschemeng.5b00144
Liu, Q., Campbell, M., Evans, J., and Smalyukh, I. (2014). Orientationally ordered colloidal co-dispersions of gold nanorods and cellulose nanocrystals. Adv. Mater. 26, 7178–7184. doi:10.1002/adma.201402699
Marchessault, R., Morehead, F., and Walter, N. (1959). Liquid crystal systems from fibrillar polysaccharides. Nature 184, 632–633. doi:10.1038/184632a0
Memmer, R. (2001). Determination of equilibrium pitch of cholesteric phases by isobaric–isothermal monte carlo simulation. J. Chem. Phys. 114, 8210. doi:10.1063/1.1365086
Mitov, M. (2012). Cholesteric liquid crystals with a broad light reflection band. Adv. Mater. 24, 6260–6276. doi:10.1002/adma.201202913
Moon, R., Martini, A., Nairn, J., Simonsen, J., and Youngblood, J. (2011). Cellulose nanomaterials review: structure, properties and nanocomposites. Chem. Soc. Rev. 40, 3941–3994. doi:10.1039/c0cs00108b
Mu, X., and Gray, D. (2014). Formation of chiral nematic films from cellulose nanocrystal suspensions is a two-stage process. Langmuir 30, 9256–9260. doi:10.1021/la501741r
Nguyen, T.-D., Hamad, W. Y., and MacLachlan, M. J. (2014). Cds quantum dots encapsulated in chiral nematic mesoporous silica: new iridescent and luminescent materials. Adv. Funct. Mater. 24, 777–783. doi:10.1002/adfm.201302521
Onsager, L. (1949). The effects of shape on the interaction of colloidal particles. Ann. N. Y. Acad. Sci. 51, 627–659. doi:10.1111/j.1749-6632.1949.tb27296.x
Park, J. H., Noh, J., Schütz, C., Salazar-Alvarez, G., Scalia, G., Bergström, L., et al. (2014). Macroscopic control of helix orientation in films dried from cholesteric liquid-crystalline cellulose nanocrystal suspensions. Chemphyschem 15, 1477–1484. doi:10.1002/cphc.201400062
Querejeta-Fernandez, A., Chauve, G., Methot, M., Bouchard, J., and Kumacheva, E. (2014). Chiral plasmonic films formed by gold nanorods and cellulose nanocrystals. J. Am. Chem. Soc. 136, 4788–4793. doi:10.1021/ja501642p
Revol, J., Bradford, H., Giasson, J., Marchessault, R., and Gray, D. (1992). Helicoidal self-ordering of cellulose microfibrils in aqueous suspension. Int. J. Biol. Macromol. 14, 170–172. doi:10.1016/S0141-8130(05)80008-X
Revol, J., and Marchessault, R. (1993). In vitro chiral nematic ordering of chitin crystallites. Int. J. Biol. Macromol. 15, 329–335. doi:10.1016/0141-8130(93)90049-R
Rey, A. (2010). Liquid crystal models of biological materials and processes. Soft Matter 6, 3402–3429. doi:10.1039/b921576j
Schütz, C., Agthe, M., Fall, A., Gordeyeva, K., Guccini, V., Salajková, M., et al. (2015). Rod packing in chiral nematic cellulose nanocrystal dispersions studied by small-angle x-ray scattering and laser diffraction. Langmuir 31, 6507–6513. doi:10.1021/acs.langmuir.5b00924
Shafeiei-Sabet, S., Hamad, W. Y., and Hatzikiriakos, S. G. (2013). Influence of degree of sulfation on the rheology of cellulose nanocrystal suspensions. Rheol. Acta 52, 741–751. doi:10.1007/s00397-013-0722-6
Shafiei-Sabet, S., Hamad, W. Y., and Hatzikiriakos, S. G. (2012). Rheology of nanocrystalline cellulose aqueous suspensions. Langmuir 28, 17124–17133. doi:10.1021/la303380v
Shopsowitz, K., Qi, H., Hamad, W., and MacLachlan, M. (2010). Free-standing mesoporous silica films with tunable chiral nematic structures. Nature 468, 422–425. doi:10.1038/nature09540
Shopsowitz, K. E., Hamad, W. Y., and MacLachlan, M. J. (2012a). Flexible and iridescent chiral nematic mesoporous organosilica films. J. Am. Chem. Soc. 134, 867–870. doi:10.1021/ja210355v
Shopsowitz, K. E., Stahl, A., Hamad, W. Y., MacLachlan, M. J. (2012b). Hard templating of nanocrystalline titanium dioxide with chiral nematic ordering. Angew. Chem. (Int. Ed.) 51, 6886–6890. doi:10.1002/anie.201201113
Shopsowitz, K. E., Kelly, J. A., Hamad, W. Y., and MacLachlan, M. J. (2014). Biopolymer templated glass with a twist: controlling the chirality, porosity, and photonic properties of silica with cellulose nanocrystals. Adv. Funct. Mater. 24, 327–338. doi:10.1002/adfm.201301737
Tabor, C., Kajzar, F., Kaino, T., and Koike, Y., editors (2012). Nanocrystalline Cellulose for Covert Optical Encryption, Vol. 8258, Zhang, Y. P. (reprint author). Montreal, PQ: McGill Univ, Dept Elect & Comp Engn. [Zhang, Y. P., Chodavarapu, V. P., and Kirk, A. G.] Montreal, PQ: McGill Univ, Dept Elect & Comp Engn. SPIE-International Society for Optical Engineering.
Urena-Benavides, E. E., Ao, G., Davis, V. A., and Kitchens, C. L. (2011). Rheology and phase behavior of lyotropic cellulose nanocrystal suspensions. Macromolecules 44, 8990–8998. doi:10.1021/ma201649f
Usov, I., Nyström, G., Adamcik, J., Handschin, S., Schütz, C., Fall, A., et al. (2015). Understanding nanocellulose chirality and structure-properties relationship at the single fibril level. Nat. Commun. 6, 7564. doi:10.1038/ncomms8564
Varga, S., and Jackson, G. (2003). Simulation of the macroscopic pitch of a chiral nematic phase of a model chiral mesogen. Chem. Phys. Lett. 377, 6–12. doi:10.1016/S0009-2614(03)01066-2
Varrette, S., Bouvry, P., Cartiaux, H., and Georgatos, F. (2014). “Management of an academic HPC cluster: the UL experience,” in 2014 International Conference on High Performance Computing & Simulation (HPCS) (IEEE).
Weaver, J. C., Milliron, G. W., Miserez, A., Evans-Lutterodt, K., Herrera, S., Gallana, I., et al. (2012). The stomatopod dactyl club: a formidable damage-tolerant biological hammer. Science 336, 1275–1280. doi:10.1126/science.1218764
Wensink, H. H., and Jackson, G. (2011). Cholesteric order in systems of helical Yukawa rods. J. Phys. Condens. Matter 23, 194107. doi:10.1088/0953-8984/23/19/194107
Wenzlik, D., Varanytsia, A., Munoz, A., Kosa, T., Taheri, B., Zentel, R., et al. (2014). Distributed feedback lasing in cellulose films. Opt. Mater. Express 4, 162. doi:10.1364/OME.4.000162
Yao, H., Zheng, G., Li, W., McDowell, M., Seh, Z., Liu, N., et al. (2013). Crab shells as sustainable templates from nature for nanostructured battery electrodes. Nano Lett. 13, 3385–3390. doi:10.1021/nl401729r
Zhang, S. J., Kinloch, I. A., and Windle, A. H. (2006). Mesogenicity drives fractionation in lyotropic aqueous suspensions of multiwall carbon nanotubes. Nano Lett. 6, 568–572. doi:10.1021/nl0521322
Keywords: cellulose nanocrystals, cholesteric liquid crystal, colloids, electrostatic stabilization, phase coexistence, kinetic arrest, phase transitions
Citation: Honorato-Rios C, Kuhnhold A, Bruckner JR, Dannert R, Schilling T and Lagerwall JPF (2016) Equilibrium Liquid Crystal Phase Diagrams and Detection of Kinetic Arrest in Cellulose Nanocrystal Suspensions. Front. Mater. 3:21. doi: 10.3389/fmats.2016.00021
Received: 11 January 2016; Accepted: 15 April 2016;
Published: 03 May 2016
Edited by:
Anupam Sengupta, MIT, USAReviewed by:
Ilaria Cacciotti, University of Rome Niccolò Cusano, ItalySilvia Vignolini, University of Cambridge, UK
Copyright: © 2016 Honorato-Rios, Kuhnhold, Bruckner, Dannert, Schilling and Lagerwall. This is an open-access article distributed under the terms of the Creative Commons Attribution License (CC BY). The use, distribution or reproduction in other forums is permitted, provided the original author(s) or licensor are credited and that the original publication in this journal is cited, in accordance with accepted academic practice. No use, distribution or reproduction is permitted which does not comply with these terms.
*Correspondence: Jan P. F. Lagerwall, jan.lagerwall@lcsoftmatter.com