Encapsulating Mo-Doped TiO2 Anatase in N-Doped Amorphous Carbon With Excellent Lithium Storage Performances
 Ying Xia
  Fengqi Lu
- MOE Key Laboratory of New Processing Technology for Nonferrous Metal and Materials, Guangxi Universities Key Laboratory of Nonferrous Metal Oxide Electronic Functional Materials and Devices, College of Materials Science and Engineering, Guilin University of Technology, Guilin, China
To improve the capability, cycling stability and rate capacity of anatase TiO2-based electrode, Mo-doped TiO2 anatase encapsulated in nitrogen-doped amorphous carbon (denoted for Mo-TiO2@NC) were synthesized using a facile hydrothermal method followed by a coating with polyaniline (PANI) and heating treatment. When tested as an anode for lithium ion batteries, the Mo-TiO2@NC electrode showed an initial discharge and charge capacity of 850.7 and 548.3 mAh g−1 at a current density of 85 mA g−1, respectively, with a remarkable discharge capacity maintained at 449.2 mAh g−1 after 100 cycles. Even at a high current density of 850 mA g−1, a reversible capacity of 154 mAh g−1 after 200 cycles was obtained, displaying good rate capacity and long-term cycling stability. The outstanding electrochemical performance of Mo-TiO2@NC can be attributed to the synergistic effect of aliovalent ions doping and carbon coating.
Introduction
The development of high safety lithium-ion batteries (LIBs) with high powder density, a longer cycle life and at lower cost are necessary to meet the needs of future portable electronics and electric or hybrid electric vehicles (Chen et al., 2013; Reddy et al., 2013; Lü et al., 2016). Because of its low cost, non-toxicity, rich earth content, and negligible volume expansion (<4 % for anatase) during charging and discharging, titanium dioxide (TiO2) has been considered as a potential anode material of LIBs (Jiang and Zhang, 2013; Wu et al., 2014). Accordingly, diverse crystals of TiO2, such as anatase, rutile, brookite and bronze, have been studied as anode materials for LIBs (Liu et al., 2015; Yu et al., 2015; Guan et al., 2016), Because of its essential crystal, anatase TiO2 is considered favorable for lithium ion intercalation/deintercalation, environmental friendliness, low cost and stability, and has been widely investigated as a promising anode material for LIBs (Hyder et al., 2013; Mo et al., 2014; Zhang et al., 2014a). Unfortunately, the lithium storage performance of anatase TiO2 is not good enough for its practical application, which is mainly derived from a relatively low lithium ion diffusion coefficient and poor electronic conductivity (Wu et al., 2012; Myung et al., 2013).
To solve its intrinsic disadvantage, different strategies have been devoted to improve the lithium ion storage performance, such as compounding with conductive agents to enhance electronic conductivity (Gomes et al., 2013; Wang et al., 2016), reducing particle size to nano-scale to shorten the lithium ion diffusion distance (Hu et al., 2015), and manufacturing mesoporous or porous TiO2 to increase the electrolyte/electrode contact area (Li et al., 2015, 2016). Furthermore, researchers found that the electrical property of TiO2 is impressible to aliovalent ions doping in the lattice (Zhang et al., 2012; Zhao et al., 2015). Aliovalent ion doping in the structure of TiO2 can slightly modify the electronic structure, which can improve the electronic conductivity and facilitate lithium ion diffusivity (Sheppard et al., 2008). When used as electrode materials for LIBs, this doping method not only favors the charge transfer but also creates a defect to provide more space for the storage of lithium ion and provides more channels for lithium ion diffusion (Wang et al., 2010b; Jiao et al., 2013). Wei and his coworkers prepared Nb doped brookite TiO2 Nano sheets displayed reversible capacities of 119.7 mAh g−1 at 5 C after 100 cycles (Liu et al., 2015). Ji and his coworkers reported that Ti3+ self-doped dark rutile TiO2 ultrafine nanorods with durable high-rate capability for LIBs (Chen et al., 2015b). Wang's research group presented that niobium doped mesoporous anatase TiO2 showed good electrochemical performance with a stable capacity of 160 mAh g−1 after 100 cycles (Wang et al., 2010b). Recently, Kim and his coworkers reported that Mo-doped TiNb2O7 anode material showed excellent high C-rates electrochemical performance, which could be attributed to dope hetero-generous Mo atom increasing electronic conductivity and facilitating lithium ion diffusivity (Song and Kim, 2015). However, few papers reported the Mo-doped TiO2 materials for application in LIBs. For example, Thi et al. and Zhang et al. showed that Mo-doped anatase TiO2 exhibited significant capacity, excellent cycle performance and remarkable rate capability, compared with pristine anatase TiO2, owning to the increase of the electrical conductivity, the decrease of the crystal size and lattice distortion by Mo6+ doping (Thi et al., 2014; Zhang et al., 2014b). Notwithstanding these advances, the rational design and facile synthesis of Mo-doped anatase TiO2-based nanostructures for highly reversible lithium storage still remain a significant challenge.
In this present study, to overcome inferior cycling stability and rate capability of anatase TiO2-based materials, we prepared Mo-doped TiO2 anatase encapsulated in nitrogen-doped amorphous carbon (Mo-TiO2@NC) as anode materials for high performance LIBs. This material was synthesized via a facile hydrothermal method followed by a coating with polyaniline (PANI) and calcination treatment. As expected, the Mo-TiO2 nanoparticles were homogenously embedded in the nitrogen-doped amorphous carbon. As a result, the obtained Mo-TiO2@NC materials exhibit high reversible capacity and excellent rate capabilities.
Experimental Section
Materials
Tetrabutyl titanate (TBT, Ti(OC4H9)4, 99%), hydrogen peroxide (H2O2,~30%), molybdenum powder (Mo, 99.95%), ammonia water (NH3·H2O, 25~28%), ammonium persulfate (APS, (NH4)2S2O8, 98%), hydrochloric acid (HCl, 36~38%), aniline (C6H5NH2, 99.5%), were purchased from a chemical reagents factory and used without further purification.
Synthesis of Mo-Doped TiO2
Mo-doped TiO2 (the Mo/(Mo+Ti) ratio equals to 5 mol%) nanoparticles were synthesis using hydrothermal methods. Firstly, 30 mg of molybdenum powder were dissolved into 4 mL hydrogen peroxide and 24 mL of de-ionized (DI) water under continuous stirring until a clear and yellow solution was obtained, followed by adding 2 mL TBT. After 30 min, 0.5 mL of ammonia water was added and stirred for another 30 min. The reaction solution was then transferred to a Teflon-lined stainless steel autoclave (50 mL) and kept in an electric oven at 180°C for 12 h. The autoclave was removed from the oven and cooled to room temperature naturally. The blue precipitate was washed with DI water and collected via centrifugation several times and then dried at 60°C. As a comparison, the undoped TiO2 sample was also similarly prepared without adding molybdenum powder.
Synthesis of Mo-TiO2@NC
The Mo-TiO2@PANI composite materials were prepared by the in situ oxidative polymerization of aniline monomers using ammonium persulfate as an oxidizer. In a typical process, 200 mg of Mo-TiO2 were dispersed in DI water (150 mL) and ultrasonicated for 2 h. The hydrochloric acid was added to adjust pH and the concentration was 0.15 mol L−1. Four hundred microliter of aniline was then added to the solution. The obtained suspension solution was stirred in an ice bath (0~5°C). After 30 min, APS with the molar ratio of 1:1.5 (APS: aniline) was added to the suspension and stirred for 8 h in the ice bath. Precipitations were washed several times with DI water and ethanol until a medium solution was obtained and then dried at 60°C. The Mo-TiO2@PANI nanocomposites were then obtained.
To obtain the Mo-TiO2@NC, Mo-TiO2@ PANI nanocomposites were annealed in Ar gas at the temperature of 500°C for 3 h with a heating rate of 2°C min−1. For comparison, Mo-TiO2 and TiO2 were also annealed under the same conditions.
Characterizations
The phase of the samples were characterized by X-ray diffraction (XRD) with PANalytical X'pert Power (Holland) using Cu Kα radiation (λ = 1.5418 Å). Rietveld refinements were performed using Topas-Academic software (Coelho, 2005). The morphologies of as-prepared samples were observed by a field-emission scanning electron microscope (FE-SEM, S4800, Hitachi, Japan), Transmission electron microscopies (TEM, JEM-2010HR, 200 kV) and high-resolution transmission electron microscopies (HRTEM). X-ray photoelectron spectroscopy (XPS) was recorded using a Perkin-Elmer ESCALAB 250Xi, and using C 1s (B. E. 284.8 eV) as a reference. Thermogravimetric analysis (TGA) was carried out by STA8000 analyzer (PerkinElmer, USA), heated from 30 to 850°C in air at a rate of 5°C/min. Raman spectra were tested on a DXR Raman microscope (Thermo Fisher Scientific DXR) with 633 nm Ar ion laser at 8 mW.
Electrochemical Measurements
The electrochemical properties of the samples were performed by using CR2032-type coin cells. The working electrodes consisted of 70 wt% Mo-TiO2@NC, 20 wt% carbon (Super-P-Li), and 10 wt% polyvinylidene fluoride (PVDF). The slurry was coated onto Cu foil and then dried under a vacuum at 100°C for 12 h. The CR2032-type coin cells were assembled in an argon-filled glove box [Mikrouna (China) Co., Ltd.] with the moisture and oxygen concentrations below 0.1 ppm. The pure lithium foil was used as the counter and reference electrode. The electrolyte was 1 M LiPF6 in a 50:50 v/v mixture of ethylene carbonate/dimethyl carbonate solution. A micro-porous membrane (Celgard 2400) was used as the separator. The galvanostatic charge-discharge performances were tested at different current densities in the voltage range of 0.01–3 V using a battery testing system (Shenzhen Neware, China). Cyclic voltammogram (CV) and electrochemical impedance spectroscopy (EIS) measurements were tested on an electrochemical workstation (CHI760E, Shanghai Chenhua). All of the tests were measured at room temperature.
Results and Discussion
The synthesis process of Mo-TiO2@NC is straightforward, as described in Scheme 1. Firstly, Mo-TiO2 nanoparticles were prepared via hydrothermal method in aqueous solution with TBT as a titanium source and metal molybdenum powder as a molybdenum source. The Mo-TiO2@PANI was then obtained by in situ oxidative polymerization; the Mo-TiO2@PANI samples with dark green are different from light blue Mo-TiO2 samples. To obtain better confirmation of the presence of PANI, Raman spectroscopic investigation was conducted. Figure S1 shows the Raman spectra of Mo-TiO2 and Mo-TiO2@PANI. The Raman spectra show the meaningful structural changes that take place during the oxidative polymerization process from aniline to polyaniline. For Mo-TiO2@PANI samples, the Raman characteristic peaks at 1,171, 1,349, 1,449, and 1,586 cm−1 and can be assigned to the C-H bending vibration of the quinoid ring, C–N and C = N stretching of the bipolaronic structure, and C = C stretching vibration of the benzenoid plan ring, respectively (Wang et al., 2010a). After heating treatment in Ar atmosphere, Mo-TiO2 nanoparticles encapsulated in nitrogen-doped amorphous carbon were obtained by thermal-induced carbonization of PANI.
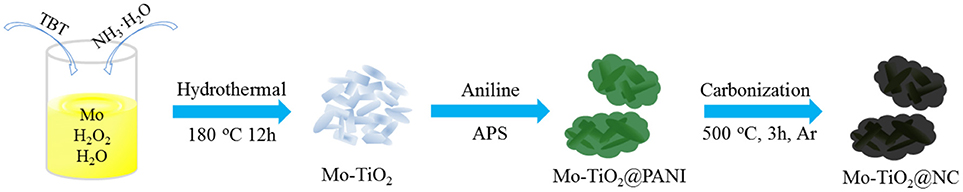
Scheme 1. Schematic illustration of the formation of anatase Mo-TiO2@NC.
The phase of as-obtained samples was measured by X-ray diffraction (XRD). The diffraction peaks showed a XRD pattern of TiO2, Mo-TiO2 before annealing treatment, and Mo-TiO2@PANI could be well-indexed to anatase TiO2 (PDF#01-084-1285) (Figure S2). Diffraction peaks of MoO3 or other Mo-containing samples were not detected in Mo-doped samples. The light blue Mo-TiO2 was also different from white TiO2, indicating that a low molar ratio of Mo was doped into the TiO2 crystal lattice. For Mo-TiO2@PANI, there was a broad and weak peak located at about 20°, which indicated the formation of amorphous PANI. After heating treatment, TiO2 kept its initial white color, while Mo-TiO2 turned light gray from light blue, and Mo-TiO2@NC was black color because of existing carbon derived from PANI thermolysis. After heating treatment, the phase composition was also confirmed by XRD. The XRD patterns of TiO2, Mo-TiO2 and Mo-TiO2@NC are shown in Figure 1. The diffraction peaks located at 25.26, 36.92, 37.81, 47.96, 53.92, 55.01, 62.83, 68.88, 70.24, 75.04°, corresponding with (101), (103), (004), (200), (105), (211), (204), (116), (220), (215) planes of anatase TiO2 (PDF#01-084-1285, space group: I41/amd), respectively. There was no diffraction peak from carbon or graphite, suggesting that amorphous carbon was generated by the thermal decomposition of PANI. Owning to the ionic radius of Mo6+ ion (0.062 nm) is very similar to that of the Ti4+ ion (0.0605 nm), the Mo6+ ion could easily substitute the Ti4+ ion in the lattice, which leads to lattice deformation (Štengl and Bakardjieva, 2010). The lattice constants were refined by the Rietveld method with Topas-Academic software. The XRD plots after refinement are in Figure S3. The lattice parameters a, c, and volume (V) are given in Table 1. The cell parameter a increased after Mo doping in the lattice as well as an increase in V, while the cell parameter c decreased slightly, demonstrating that the Mo elemental has been successfully doped into the lattice of anatase. This is in accordance with the results reported in the literature for Mo doped TiO2 samples (Štengl and Bakardjieva, 2010; Zhang et al., 2014b). According to the experimental design, the content of Mo is 5 mol%, however, Rietveld refinements of such a low amount of doped element remain challenging. In order to confirm the carbon content of Mo-TiO2@NC, thermal gravimetric analysis (TGA) were operated in air with a heating rate of 5°C min−1 (Figure S4). The residual products were anatase phase without other impurity after TGA (Figure S5). The weight loss of 2.19% to 800°C of TiO2 and Mo-TiO2 can be attributed to the removal of absorbed water molecules. For Mo-TiO2@NC, the weight loss of 7.75% below 400°C was attributed to the evaporation of absorbed water, and the sharp weight loss from 400 to 800°C showed that the carbon layer in the Mo-TiO2@NC was oxidized completely. By calculating the TGA results, the carbon content of Mo-TiO2@NC was estimated to be 37.34 wt%.
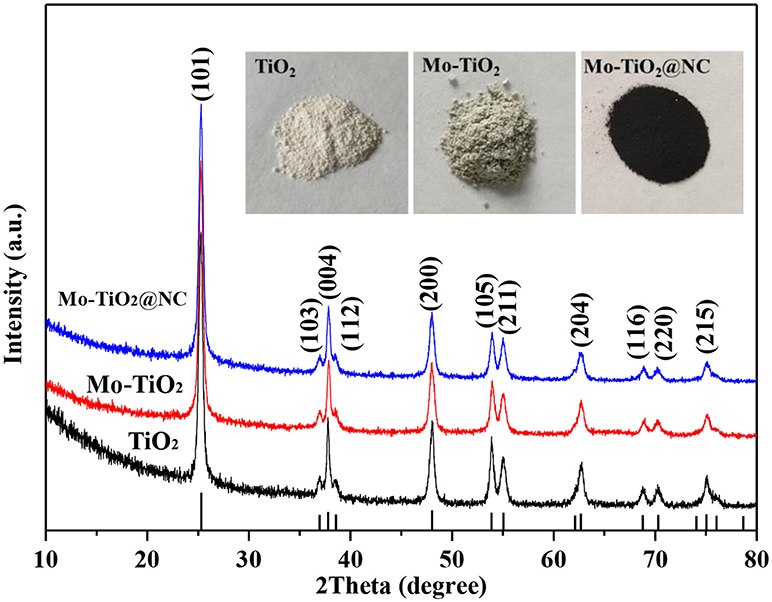
Figure 1. XRD patterns of TiO2, Mo-TiO2 and Mo-TiO2@NC. The lower vertical lines represent the JCPDS card no. 01-84-1285 (anatase). The upper inset maps are the physical photos of TiO2, Mo-TiO2, and Mo-TiO2@NC.
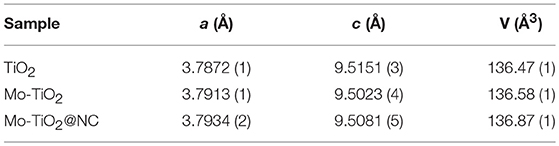
Table 1. The lattice parameters and volume of TiO2, Mo-TiO2, and Mo-TiO2@NC.
The morphologies of the TiO2, Mo-TiO2, and Mo-TiO2@NC were investigated by field emission scanning electron microscopy (FESEM, Figures 2a–c) and transmission electron microscopy (TEM, Figures 2d–f). As shown in Figures 2a,b, TiO2 and Mo-TiO2 have particle morphologies with uniform diameters of 20~30 nm. Compared with Mo-TiO2, the external size of Mo-TiO2@NC composite material increased to 50~60 nm, and showed irregular shapes, suggesting that carbon layers are coated on the surface of granular Mo-TiO2. Transmission electron microscopy (TEM) and high-resolution transmission electron microscopy (HRTEM) images in Figures 2d–i further study the microstructure of the TiO2, Mo-TiO2, and Mo-TiO2@NC samples. For TiO2 nanoparticle, the TEM image (Figure 2d) shows that the rice-like morphology with a length of 30~50 nm and a diameter of about 15 nm, and the lattice-resolved HRTEM image in Figure 2g shows the interplanar spacing of 3.46 Å belongs to (101) plane of anatase TiO2. For Mo-TiO2 nanoparticle, the TEM image in Figure 2e also shows that the particle morphologies with uniform diameters of 15 nm and a length of about 30~40 nm. The two sets d-spacing obtained in Figure 2h from HRTEM image is 3.41 Å of Mo-TiO2, which corresponding to the equivalent crystal planes (101) and (011), respectively. Compared with pristine TiO2 samples (Figure 2d), the morphology of the Mo-TiO2 samples changes from inhomogeneous rice-like to uniform rectangular shapes, which indicates that substitution of Ti4+ by Mo6+ in the anatase structure restrains the growth of TiO2 nanoparticles. The selected-area electron diffraction (SAED) patterns (Figure 2i) indicates the Mo-TiO2 nanoparticles are polycrystalline in nature, all diffraction rings of Mo-TiO2 (101), (103), (004), (112), (200), and (202) were displayed in the SAED patterns, which can be completely indexed to the anatase TiO2 phase. The TEM image of Mo-TiO2@NC, in Figure 2f, show that the Mo-TiO2 particles were conformably coated by carbon shells. Further, the EDS and EDS elemental mapping results of Mo-TiO2@NC are shown in Figure S6. The Mo/(Mo+Ti) ratio equals to 4.86(2) mol% based on the EDS results (Figure S6a), which is consistent with the experiment. EDS elemental mappings (Figure S6b) are confirmations that the Ti, Mo, C, N, and O elements are uniformly distributed in the Mo-TiO2@NC. In particular, as the energy edge of Au (Mα, 2.123 keV) is close to that of Mo (Lα, 2.293 keV), the EDS elemental mapping of Mo looks a bit bright. Such a shell-core nanostructure can observably improve the electrical conductivity and avoid the reunions of Mo-TiO2 nanoparticles.
Figure 2. SEM images of TiO2 (a), Mo-TiO2 (b), and Mo-TiO2@NC (c). TEM images of TiO2 (d), Mo-TiO2 (e), and Mo-TiO2@NC (f). HRTEM images of TiO2 (g) and Mo-TiO2 (h), (i) SAED pattern of Mo-TiO2.
In order to further analyze the chemical environment and valence state of samples, we also performed X-ray photoelectron spectroscopy (XPS) analyses (Figure 3). Figure 3A shows the XPS survey spectra of TiO2, Mo-TiO2, and Mo-TiO2@NC composites. No trace of Mo peaks can be detected in TiO2 samples. Compared with pristine TiO2, typical Mo, Ti, O, C and N signals were all observed in the Mo-TiO2@NC sample, indicating that the Mo has been successfully innovated into TiO2 and the N-doped carbon coating. Figure 3B shows the high-resolution Ti 2p core-level XPS spectra and the states of the Ti in the samples were determined to be Ti4+. After doping with Mo, the Ti 2p peaks shifted to a lower binding energy, indicating that the atoms were reduced by the charge redistribution (Song and Kim, 2015). A high symmetric peak of Ti 2p means a complete oxidation of Ti (Luo et al., 2014). Figure 3C shows the high-resolution Mo 3d core-level XPS spectra, the binding energies of 232.9 eV and 235.99 eV can be ascribed to the feature of Mo6+, while 232.09 eV and 235.1 eV consistent with the existence of Mo5+ in the Mo-TiO2@NC composites (Luo et al., 2012). These results therefore show that the Mo was doped into the lattice of TiO2 nanoparticle and represented in the state of Mo6+ and Mo5+ in the Mo-TiO2@NC samples, thereby when Mo6+ and Mo5+ replaced the Ti4+, the titanium vacancies formed in the TiO2 lattice. Figure 3D shows the high-resolution O 1s core-level spectrum of TiO2 and Mo-TiO2@NC. For pure TiO2, the O 1s spectrum can be divided into two peaks, the main peak located at about 530.13 eV is attributed to the lattice oxygen in TiO2, and the small left shoulder peak at about 531.51 eV is contributed to adsorbed oxygen. For Mo-TiO2@NC, the O 1s XPS spectrum shows three peaks, the first peak located at 530.31 eV corresponds to the formation of Ti-O bond in the TiO2 lattice, the second peak at about 531.04 eV consistent with adsorbed oxygen and the last peak at about 532.4 eV only appears in Mo-TiO2, which is attributed to adsorbed water and hydroxyl groups. The C 1s and N 1s XPS spectra of Mo-TiO2@NC are shown in Figures 3E,F, respectively. The XPS C 1s spectra can decompose to four peaks centered at 284.56, 285.50, 287.2, and 289.5 eV and can be attributed to sp3 C-C, sp3 C-N, sp2 C-N, and C-O bonding, respectively, the results corresponding to the references (Lin et al., 2008). The XPS spectra of N 1s appear at two peaks located at about 398.6 and 400.28 eV and can be attributed to sp3 C-N and sp2 C-N bonding, respectively (Lin et al., 2008). The nitrogen doping into the carbon layer could be conducive to improve the electronic conductivity.
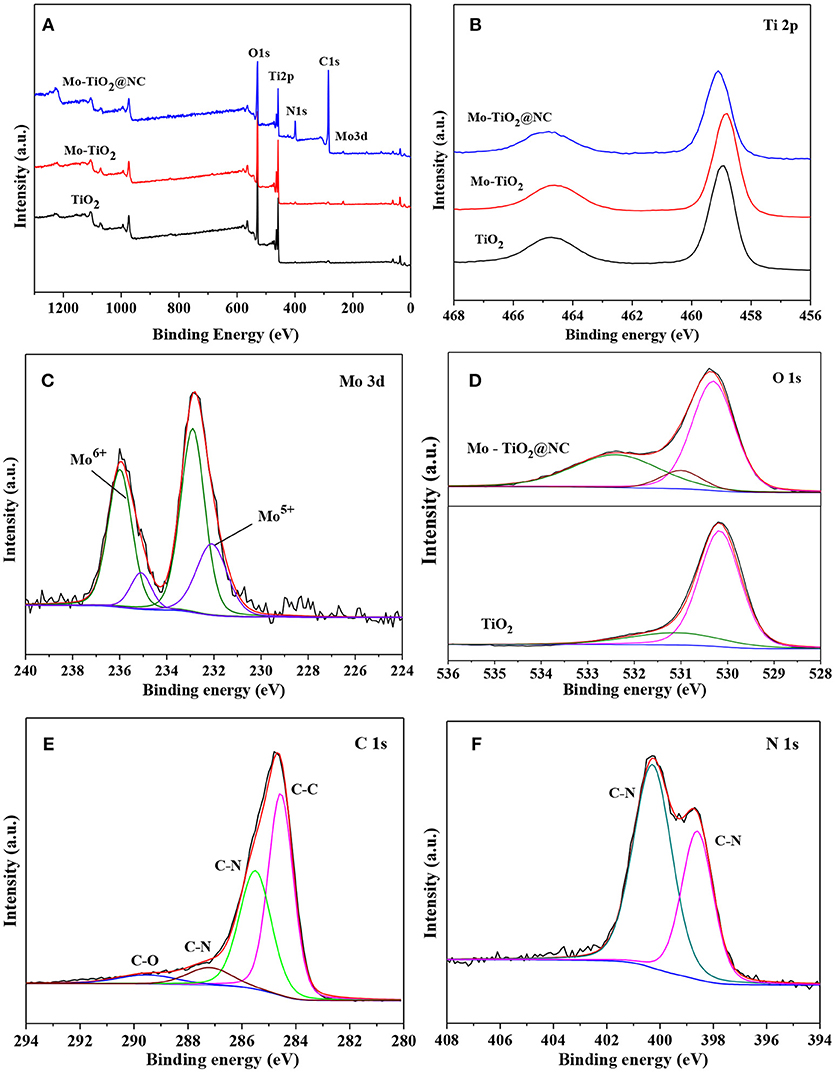
Figure 3. (A) Full XPS spectra of TiO2 Mo-TiO2, and Mo-TiO2@NC, (B) Ti 2p XPS spectra of TiO2 Mo-TiO2 and Mo-TiO2@NC, fitted XPS spectra of Mo (C), O (D), C 1s (E), N 1s (F) of Mo-TiO2@NC.
Electrochemical Performances
The electrochemical properties of the samples after heating treatment were investigated as anode materials for LIBs in the voltage range of 0.01–3.0 V. In previous works of TiO2-based anode, the voltage window was frequently discharged to 1.0 V. In this work, a voltage window range of 0.01–3.0 V was chosen to consider the contribution of the nitrogen doping carbon layer and the conversion reaction of the Mo6+ dopants with Li+. The electrochemical performances are shown in Figure 4. Figure 4A show the 1st−3rd cycle CV curves of Mo-TiO2@NC electrode in the voltage range from 0.01 to 3 V at a scan rate of 0.1 mV s−1. In the first cycle, two reduction peaks can be observed around at 1.64 and 0.58 V. The former reduction peak can be attributed to the lithium insertion in the TiO2 lattice without phase decomposition (Dong et al., 2016; Xie et al., 2017). The latter peak can be associated with the decomposition of electrolytes and the formation of a solid-electrolyte interphase (SEI) layer in the first cycle (Chen et al., 2011, 2017). From the second cycle, the peak at 0.58 V disappeared, which is consistent with the irreversible capacity loss of the anode (Dong et al., 2016; Chen et al., 2017; Xie et al., 2017). The oxidation peak at 2.07 V can be assigned to the lithium extraction from the TiO2 lattice (Xu et al., 2007; Zhang et al., 2007; Chen et al., 2015a; Ge et al., 2016). A pair of redox peaks at 1.64 V and 2.1 V for the following two cycles are ascribed to the process of Li+ insertion and extraction in the TiO2 lattice [Equation (1)], (Dong et al., 2016; Xie et al., 2017) which is also observed to be highly reversible in subsequent cycles, certifying that a stable SEI layer is generated on the surface of the coated carbon layer. The electrochemical behavior is consistent with the reported anatase anode electrodes in the literature (Zhao and Shao, 2012; Shen et al., 2013). The CV curves of TiO2 (Figure S7a) and Mo-TiO2 (Figure S7b) are also consistent with the electrochemical behavior of anatase TiO2. It is interesting that Mo-TiO2@NC has the smallest voltage difference (0.43 V) between the cathodic and anodic peaks, compared to those of TiO2 (0.54 V) and Mo-TiO2 (0.59 V) in the first cycle CV, displaying the lowest polarization of the Mo-TiO2@NC electrode by hybridizing with Mo-doped and carbon coating.

Next, the cycle performances of TiO2, Mo-TiO2, Mo-TiO2@NC were investigated. Firstly, the capacity contribution of the carbon layer in the composite was evaluated, the cycle performances of the carbon layer were tested at the current density of 85 and 850 mA g−1 as shown in Figure S8. The capacity contribution of the carbon layer was ascribed to lithium ion insertion and extraction below 0.5 V. The discharge capacity of the carbon layer was about 195.5 mAh g−1 after 30 cycles at 85 mA g−1 (Figure S7a), indicating that the carbon layer has a rather high contribution to the total capacity at low current density. At high current density of 850 mA g−1, the discharge capacity was about 26.4 mAh g−1 after 30 cycles (Figure S7b), showing that the contribution of the carbon layer was limited at high current density. Thus, considering the contribution of the carbon layer, the specific capacity was calculated by the total mass for Mo-TiO2@NC. Figure 4B shows the charge-discharge voltage-capacity curves of Mo-TiO2@NC electrode for the 1st, 2nd, and 3rd cycle at a current density of 85 mA g−1. The two typical discharge plateaus (1.75 and 0.8 V) were apparent at the first cycle, which matches well with the results observed in the CV curves. The initial discharge and charge specific capacities are 860.7 and 548.3 mAh g−1, respectively, with an initial coulombic efficiency of 63.7%. The low coulombic efficiency can be attributed to decomposition of electrolytes and the formation of a SEI layer (Chen et al., 2017; Xie et al., 2017). The 1st, 2nd, and 3rd cycle charge-discharge voltage-capacity curves of TiO2 and Mo-TiO2 electrode at a current density of 85 mA g−1 are shown in Figure S7. As seen in Figures S7b,c, the obvious voltage plateaus are in agreement with the CV curves. The cycle performance of TiO2, Mo-TiO2, and Mo-TiO2@NC were performed at a current density of 85 mA g−1 (Figure 4C). For Mo-TiO2@NC, a reversible specific capacity up to 449.2 mAh g−1 can still be obtained after 100 cycles, which is higher than the specific capacity of Mo-TiO2 (193.97 mAh g−1) and TiO2 (142.08 mAh g−1), indicating that the Mo-TiO2@NC electrode possesses stable electrochemical reversibility. Besides this, from the corresponding coulombic efficiency curve of Mo-TiO2@NC shown in Figure 4C, the columbic efficiency quickly increases to 90.29% at the second cycle and approaches 99% after the third cycle, which reveals the excellent electrochemical reversibility of Mo-TiO2@NC.
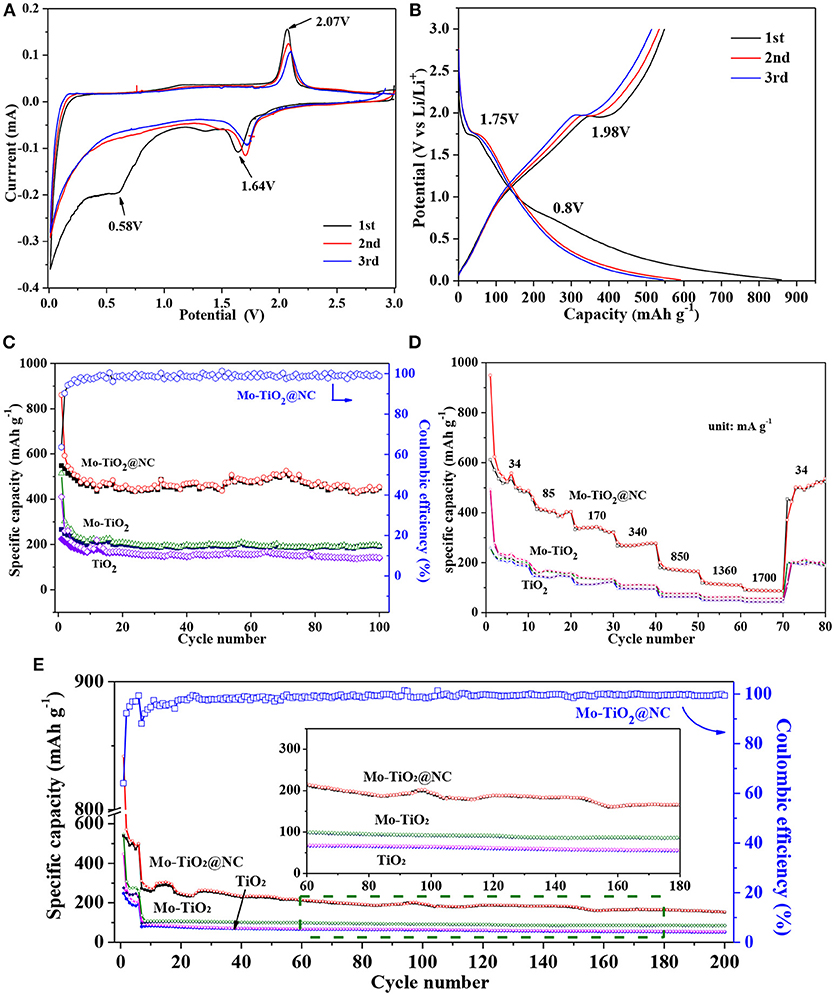
Figure 4. (A) Cyclic voltammograms (CV) curves of the first three cycles of Mo-TiO2@NC. (B) The 1st, 2nd, and 3rd voltages-capacity curves of Mo-TiO2@NC at a current density of 34 mA g−1. (C) Cycle performance of TiO2, Mo-TiO2, and Mo-TiO2@NC at a current density of 34 mA g−1. (D) Rate performances of TiO2, Mo-TiO2, and Mo-TiO2@NC electrodes from 34 to 1,700 mA g−1. (E) Cycle performance of TiO2, Mo-TiO2, and Mo-TiO2@NC at a current density of 850 mA g−1.
The rate capacities of the TiO2, Mo-TiO2, and Mo-TiO2@NC electrodes were tested by discharging/charging at various current densities from 34 to 1,700 mA g−1 (Figure 4D). The average discharge capacities of TiO2 are 242.93, 147.55, 117.76, 97.48, 64.59, 49.86, and 43.41 mAh g−1 at rates of 34, 85, 170, 340, 850, 1,360, and 1,700 mA g−1, respectively. The average discharge capacities of Mo-TiO2 are 255.94, 165.22, 138.85, 112.19, 78.14, 63.34 and 57.3 mAh g−1 at rates of 34, 85, 170, 340, 850, 1,360, and 1,700 mA g−1, respectively. By contrast, the Mo-TiO2@NC electrode showed higher discharge capacities of 574.07, 410.44, 335.74, 273.38, 173.41, 114.47, and 88.68 mAh g−1 at different current densities of 34, 85, 170, 340, 850, 1,360, and 1,700 mA g−1, respectively. When the current density came back to 34 mA g−1, the discharge capacity of Mo-TiO2@NC electrode still remained at 449.2 mAh g−1. Compared with TiO2 and Mo-TiO2 electrode, the Mo-TiO2@NC electrode shows an obvious advantage with a higher discharge capacity and good cycling stability. And the cycle performance of TiO2, Mo-TiO2, and Mo-TiO2@NC were performed at a high current density of 850 mA g−1 (Figure 4E). After discharging/charging 200 cycles, the reversible specific capacities of TiO2, Mo-TiO2, and Mo-TiO2@NC are 52.89, 85.24, and 154 mAh g−1, respectively. The Mo-TiO2@NC composites electrode holds the highest reversible capacity. The comparison summarized in Table S1 shows that the Mo-TiO2@NC electrode obtains the highest value capacity at low current density, and even at higher current density it was comparable to most other TiO2-based electrode materials which charge/discharge at low current densities, revealing that the Mo-TiO2@NC holds potential application in high-energy lithium ion batteries.
The oxidation/reduction or phase transformation process in the electrode reaction can be studied by CV curves, and then the in the TiO2 particles can be estimated quantitatively (Rui et al., 2010). Figure 5A shows the CV curves at various sweep rates of 0.2, 0.4, 0.6, 0.8, and 1 mV s−1, the area under the curves represents the capacity of electrode. With the increase of scan rates, the intensities and areas of redox peak increase. Furthermore, the value of the oxidation peak and reduction peak have shifted to higher and lower, respectively. It indicates that the irreversible behavior becomes more obvious with the increase of scan rates, especially scan rate at 1 mV s−1. For semi-infinite and finite diffusion, the relationship of the peak current (ip) and the CV scan rate (v) in the CV curves can be expressed as follow: (Das et al., 2005)
where n is the number of charge-transfer (for Li+ it is 1), A is the contact area between electrode material and electrolyte solution (here the area of electrode is 1.13 cm2), ΔCo is the change of concentration of Li corresponding to the specific electrochemical reaction [2.34 × 10⁻² mol cm−3 for x = 0.5, calculated from the volume of TiO2 (142.02 Å3)]. At slow scan rate (< 1 mV s−1), an almost linear relationship between peak current (ip) and squre root of the scan rate (v1/2) as displayed in Figure 5B. Based on Equation (2) and slope of ip vs. v1/2, the diffusion coefficient can be calculated to be 2.15 × 10⁻⁹ cm2 s−1 (anode) and 2.33 × 10⁻⁹ cm2 s−1 (cathode). These values are slightly higher than those reported in the literature (Wagemaker et al., 2001; Shen et al., 2013, 2014).
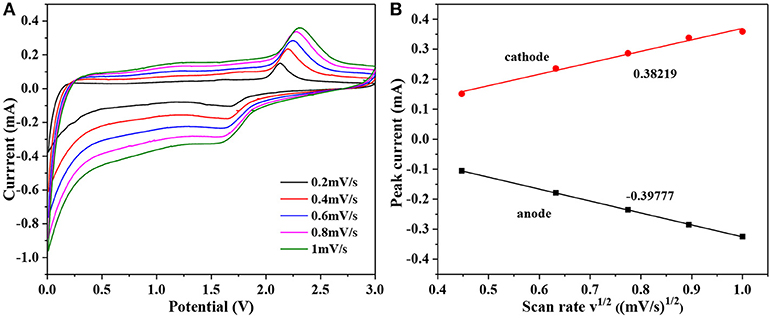
Figure 5. (A) CV curves of Mo-TiO2@NC at different scan rates: 0.2, 0.4, 0.6, 0.8, and 1 mV s−1. (B) The relationship between peak current (ip) and square root of the scan rate (v1/2).
The lithium total storage mechanism mainly includes three parts: the faradaic contribution from the diffusion-controlled Li+ insertion, the lithium storage mechanism from charge transfers with surface atoms (named as pseudocapacitance effect) and the non-faradaic contribution from double-layer effect (Augustyn et al., 2014; Chao et al., 2016). Furthermore, the capacitive and diffusion effect to the electrode total storage in active materials, described and analyzed by the cyclic voltammetry data at different scan rates, obey the following equation: (Yu et al., 2018)
Both a and b are the adjustable parameters, the b value can be determined by plotting the slop of log (i) vs. log (v). There are two boundary conditions of the b-value: b = 0.5 and b = 1.0. For a b value of 0.5, indicating the current comes mainly from Li+ intercalation process; while a b value between 0.5 and 1.0, implies that the charge storage is dominated by a mostly contributed by capacitive effect (Yu et al., 2018). Figure 6A shows the CV curves for Mo-TiO2@NC nanocomposites at different scan rates of 0.2, 1, 2, 5, and 10 mV s−1 in the voltage range from 0.01 to 3 V, the area under the CV curves represent the total charge storage adding from faradaic and non-faradaic processes. And the b-value can be determined from the slope of the linear plot of logi vs. logv in Figure 6B, which indicates that the lithium storage is controlled by both diffusion and capacity effect processes, and mainly by the pseudocapacitance effect. Thereby, the current response at an any fixed potential can be described as the sum of the pseudocapacitance effect and diffusion-controlled behavior:
To facilitate the analysis, the equation 4 can also be rewritten into the following format:
where i(V) represent the total current response at any fixed potential V, k1v, and k2v1/2 correspond to the current contribution from capacity effects and diffusion controlled intercalation process, respectively., It is key to determine k1 (slope) and k2 (intercept) through linear fitting of i(V)/v1/2 vs. v1/2 (see Figure 6C), therefore making it possible to estimate the contribution from Li+ insertion and capacitive-controlled process at a certain potential. Figures 6D,E show the voltage profile from the capacitive current (red region) in the Mo-TiO2@NC electrode at 0.2 and 5 mV s−1, and the capacitive contribution was 25.56 and 58.73%, respectively. As the scan rate increases, the ratio of capacitive effect (k1v) contribution further increases (Figure 6F). The pseudocapacitive contribution for Mo-TiO2@NC enlarged to 73.07% at 10 mV s−1, indicating the highest capacitive contribution of the Mo-TiO2@NC electrode, which could improve its high rate reversible capacity.
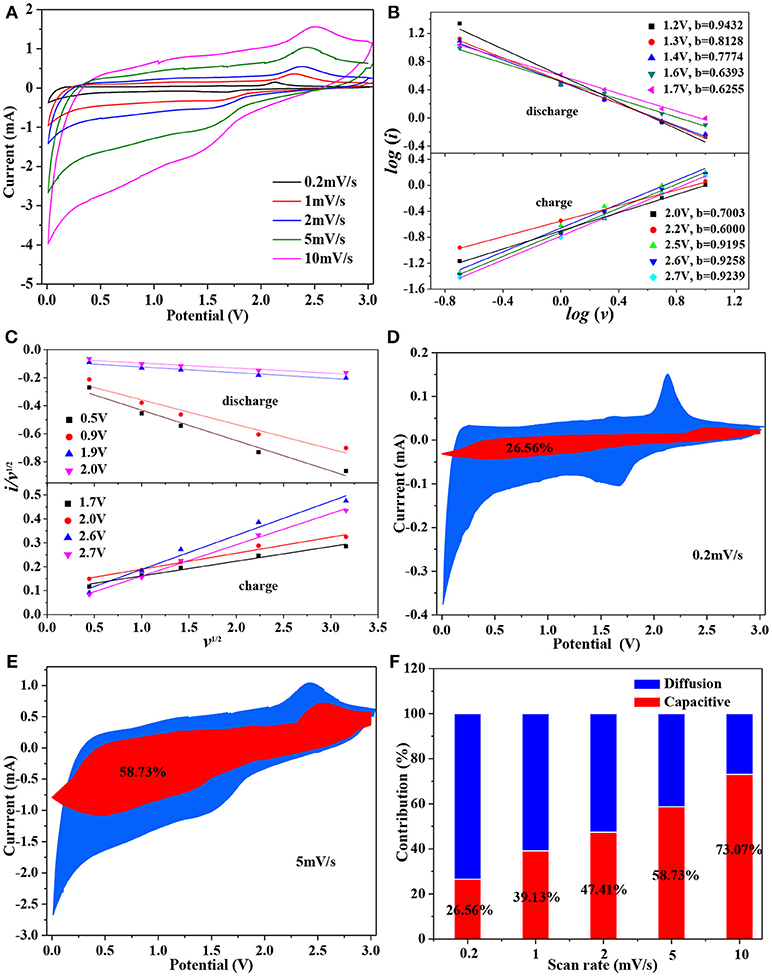
Figure 6. (A) CV curves of Mo-TiO2@NC at different scan rates; (B) the relationship between log i and log ν; (C) the plots of i(V)/ν1/2 vs. ν1/2 used for calculating constants k1 and k2 at different potentials; capacitive current contribution at different scan rates. (D) 0.2 mV/s, (E) 5 mV/s; (F) the proportion of capacitive current contribution at different scan rates.
To deeply understand the electrode kinetics, electrochemical impedance spectra (EIS) were performed in a frequency range from 105 to 0.1 Hz at room temperature. Figure 7 show the Nyquist plots of TiO2 Mo-TiO2 and Mo-TiO2@NC electrode. All Nyquist plots exhibit a semicircle in the medium-high frequency region and a sloped line in the low frequency region, which indicates that the electrochemical behavior is controlled by both charge transfer and lithium ion diffusion (Manjunatha et al., 2011; Hang et al., 2013). As shown in Figure 7, the diameter of the semicircle for Mo-TiO2 is shorter than that of the pristine TiO2, indicating a smaller charge-transfer in the former. Owning to the partial substitution of Ti4+ with Mo6+ ions could create oxygen vacancies, titanium vacancies, or conduction band electrons to compensate for the imbalance in the charge by doping (Kroger and Vink, 1956), thus significantly heightening the electrical conductivity of the electrode, enhancing much easier charge transfer, therefore, reducing the overall internal resistance of the battery. Apparently, after coating with N-doped carbon layer, the Mo-TiO2@NC has the minimum diameter of the semicircle in the medium-high frequency region. This demonstrates that the Mo-TiO2@NC electrode has the lowest charge-transfer impedance, which could promote the Li+ diffusion in the electrode during the lithium ion insertion/extraction process, consequently, improving the electrochemical performances.
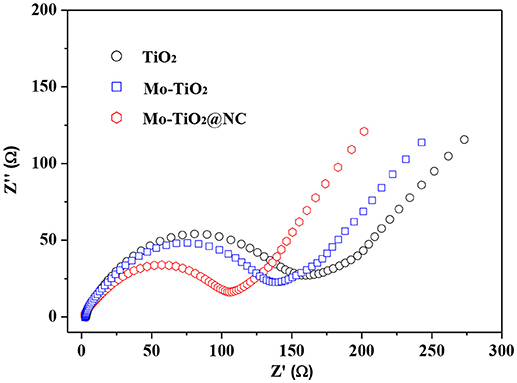
Figure 7. Nyquist plots of TiO2, Mo-TiO2, and Mo-TiO2@NC electrodes before cycling.
Based on the above results, the total capacity of Mo-TiO2@NC comes from the lithium ion insertion/extraction of Mo-TiO2 and N-doped carbon layer, as well as the contribution of pseudocapacitance. The excellent electrochemical performance of the obtained Mo-TiO2@NC as an anode material for LIBs could be attributed to their unique structural features and several possible factors. First, Mo-doping can adjust the electronic structure of TiO2 and increase the cell volume, thereby improving the electrical conductivity and accelerating lithium ion diffusion (Thi et al., 2014; Zhang et al., 2014b). Second, Mo-doping in the structure of TiO2 can generate defects in the structure; these vacancies could act as new sites for lithium ion insertion (Liao et al., 2016). Also, the conversion reaction could occur between Mo with Li, thus increasing the theoretical capacity (Zhang et al., 2014b). Third, the structure of anatase TiO2 is very stable during charge/discharge process, which could improve the cycle stability (Bauer et al., 2017). Finally, the nitrogen doped carbon layer has relatively high conductivity, which can not only enhance the conductivity and help to form a stable SEI layer during cycling, but also has great contribution to the capacity at low current density (Liu et al., 2017). It is worth noting that the Mo-TiO2@NC composed of small nanoparticles can short diffusion length in the solid phase for lithium ion and electrons, which further improves the lithium reaction rate (Jiang and Zhang, 2013). These distinct advantages significantly improve the long-term and high-rate performances of the Mo-TiO2@NC hybrid and make it a very promising anode material for LIBs.
Conclusions
In summary, Mo-doped anatase TiO2 coating with nitrogen-doped amorphous carbon layer were obtained using a facile hydrothermal and heat treatment. When used as an anode material, the reversible capacities, cycling performance, and rate capability are significantly improved by Mo doping and carbon coating. The Mo-TiO2@NC delivers a high reversible capacity of 449.2 at 85 mA g−1 after 100 cycles, which is much higher than that of TiO2 and Mo-TiO2. Remarkably, a reversible capacity up to 154 mAh g−1 is obtained after 200 cycles at 850 mA g−1. The present study show that aliovalent ions doped in the TiO2 lattice combined with carbon coating is a synergistic effect for enhancing the performance of TiO2-based electrodes for lithium-ion batteries.
Author Contributions
YX and CR conducted the synthesis. YX and XY carried out the characterization and the electrochemical measurements. FL and XK co-wrote the manuscript. All authors discussed the data and commented on the manuscript.
Conflict of Interest Statement
The authors declare that the research was conducted in the absence of any commercial or financial relationships that could be construed as a potential conflict of interest.
Acknowledgments
The authors acknowledge financial support from Guangxi Natural Science Foundation (No. 2017GXNSFBA198149). The authors thank Prof. Wenfeng Zhu and Ms. Yuchun Ji for the help on the SEM and EDS experiments, and Ms. Shuyi Mo on the XPS measurement.
Supplementary Material
The Supplementary Material for this article can be found online at: https://www.frontiersin.org/articles/10.3389/fmats.2019.00001/full#supplementary-material
References
Augustyn, V., Simon, P., and Dunn, B. (2014). Pseudocapacitive oxide materials for high-rate electrochemical energy storage. Energy Environ. Sci. 7, 1597–1614. doi: 10.1039/c3ee44164d
Bauer, D., Roberts, A. J., Matsumi, N., and Darr, J. A. (2017). Nano-sized Mo- and Nb-doped TiO2 as anode materials for high energy and high power hybrid Li-ion capacitors. Nanotechnology. 28:195403. doi: 10.1088/1361-6528/aa69df
Chao, D., Zhu, C., Yang, P., Xia, X., Liu, J., Wang, J., et al. (2016). Array of nanosheets render ultrafast and high-capacity Na-ion storage by tunable pseudocapacitance. Nat Commun. 7:12122. doi: 10.1038/ncomms12122
Chen, J., Archer, L. A., and Lou, X. W. (2011). SnO2 hollow structures and TiO2 nanosheets for lithium-ion batteries. J. Mater. Chem. 21, 9912–9924. doi: 10.1039/C0JM04163G
Chen, J., Hou, H., Yang, Y., Song, W., Zhang, Y., Yang, X., et al. (2015a). An electrochemically anodic study of anatase TiO2 tuned through carbon-coating for high-performance lithium-ion battery. Electrochim. Acta. 164, 330–336. doi: 10.1016/j.electacta.2015.02.202
Chen, J., Song, W., Hou, H., Zhang, Y., Jing, M., Jia, X., et al. (2015b). Ti3+ self-doped dark rutile TiO2 ultrafine nanorods with durable high-rate capability for lithium-ion batteries. Adv. Funct. Mater. 25, 6793–6801. doi: 10.1002/adfm.201502978
Chen, J., Yang, L., Zhang, Z., Fang, S., and Hirano, S. (2013). Mesoporous TiO2-Sn@C core-shell microspheres for Li-ion batteries. Chem. Commun. 49, 2792–2794. doi: 10.1039/c3cc40671g
Chen, Q., Lu, F., Xia, Y., Wang, H., and Kuang, X. (2017). Interlayer expansion of few-layered Mo-doped SnS2 nanosheets grown on carbon cloth with excellent lithium storage performance for lithium ion batteries. J. Mater. Chem. A 5, 4075–4083. doi: 10.1039/c7ta00236j
Das, S. R., Majumder, S. B., and Katiyar, R. S. (2005). Kinetic analysis of the Li+ ion intercalation behavior of solution derived nano-crystalline lithium manganate thin films. J. Power Sources. 139, 261–268. doi: 10.1016/j.jpowsour.2004.06.056
Dong, Y., Yu, M., Wang, Z., Liu, Y., Wang, X., Zhao, Z., et al. (2016). A top-down strategy toward 3D carbon nanosheet frameworks decorated with hollow nanostructures for superior lithium storage. Adv. Funct. Mater. 26, 7590–7598. doi: 10.1002/adfm.201603659
Ge, M., Cao, C., Huang, J., Li, S., Chen, Z., Zhang, K.-Q., et al. (2016). A review of one-dimensional TiO2 nanostructured materials for environmental and energy applications. J. Mater. Chem. A 4, 6772–6801. doi: 10.1039/c5ta09323f
Gomes, W. J. A. S., Araújo, D. M., Carvalho, A. J. F., Campana-Filho, S. P., and Huguenin, F. (2013). High lithium ion electroinsertion rate into self-assembled films formed from TiO2. J. Phys. Chem. C 117, 16774–16782. doi: 10.1021/jp404179x
Guan, B., Yu, L., Li, J., and Lou, X. W. (2016). A universal cooperative assembly-directed method for coating of mesoporous TiO2 nanoshells with enhanced lithium storage properties. Sci. Adv. 2:e1501554. doi: 10.1126/sciadv.1501554
Hang, T., Mukoyama, D., Nara, H., Takami, N., Momma, T., and Osaka, T. (2013). Electrochemical impedance spectroscopy analysis for lithium-ion battery using Li4Ti5O12 anode. J. Power Sources 222, 442–447. doi: 10.1016/j.jpowsour.2012.09.010
Hu, H., Yu, L., Gao, X., Lin, Z., and Lou, X. W. (2015). Hierarchical tubular structures constructed from ultrathin TiO2(B) nanosheets for highly reversible lithium storage. Energy Environ. Sci. 8, 1480–1483. doi: 10.1039/C5EE00101C
Hyder, M. N., Gallant, B. M., Shah, N. J., Shao-Horn, Y., and Hammond, P. T. (2013). Synthesis of highly stable sub-8 nm TiO2 nanoparticles and their multilayer Eelectrodes of TiO2/MWNT for electrochemical applications. Nano Lett. 13, 4610–4619. doi: 10.1021/nl401387s
Jiang, C., and Zhang, J. (2013). Nanoengineering titania for high rate lithium storage: a review. J. Mater. Sci. Technol. 9, 97–122. doi: 10.1016/j.jmst.2012.11.017
Jiao, W., Li, N., Wang, L., Wen, L., Li, F., Liu, G., et al. (2013). High-rate lithium storage of anatase TiO2 crystals doped with both nitrogen and sulfur. Chem. Commun. 49, 3461–3463. doi: 10.1039/c3cc40568k
Li, W., Liu, J., and Zhao, D. (2016). Mesoporous materials for energy conversion and storage devices. Nat. Rev. Mater. 1, 1–17. doi: 10.1038/natrevmats.2016.23
Li, W., Wang, F., Liu, Y., Wang, J., Yang, J., Zhang, L., et al. (2015). General strategy to synthesize uniform mesoporous TiO2/graphene/mesoporous TiO2 sandwich-like nanosheets for highly reversible lithium storage. Nano Lett. 15, 2186–2193. doi: 10.1021/acs.nanolett.5b00291
Liao, H., Xie, L., Zhang, Y., Qiu, X., Li, S., Huang, Z., et al. (2016). Mo-doped gray anatase TiO2: lattice expansion for enhanced sodium storage. Electrochim. Acta 219, 227–234. doi: 10.1016/j.electacta.2016.10.016
Lin, L., Niu, H., Zhang, M., Song, W., Wang, Z., and Bai, X. (2008). Electron field emission from amorphous carbon with N-doped nanostructures pyrolyzed from polyaniline. Appl. Surf. Sci. 254, 7250–7254. doi: 10.1016/j.apsusc.2008.05.347
Liu, Y., Liu, M., Lan, T., Dou, J., and Wei, M. (2015). One-step hydrothermal synthesis of Nb doped brookite TiO2 nanosheets with enhanced lithium-ion intercalation properties. J. Mater. Chem. A 3, 18882–18888. doi: 10.1039/C5TA04870B
Liu, Z., Lu, T., Song, T., Yu, X.-Y., Lou, X. W., and Paik, U. (2017). Structure-designed synthesis of FeS2@C yolk-shell nanoboxes as a high-performance anode for sodium-ion batteries. Energy Environ. Sci. 10, 1576–1580. doi: 10.1039/c7ee01100h
Lü, X., Howard, J. W., Chen, A., Zhu, J., Li, S., Wu, G., et al. (2016). Antiperovskite Li3OCl superionic conductor films for solid-state Li-ion batteries. Adv. Sci. 3:1500359. doi: 10.1002/advs.201500359
Luo, S.-Y., Yan, B.-X., and Shen, J. (2012). Enhancement of photoelectric and photocatalytic activities: Mo doped TiO2 thin films deposited by sputtering. Thin Solid Films 522, 361–365. doi: 10.1016/j.tsf.2012.07.121
Luo, S.-Y., Yan, B.-X., and Shen, J. (2014). Direction-regulated electric field implanted in multilayer Mo-TiO2 films and its contribution to photocatalytic property. Superlattice Microst. 75, 927–935. doi: 10.1016/j.spmi.2013.12.009
Manjunatha, H., Mahesh, K. C., Suresh, G. S., and Venkatesha, T. V. (2011). The study of lithium ion de-insertion/insertion in LiMn2O4 and determination of kinetic parameters in aqueous Li2SO4 solution using electrochemical impedance spectroscopy. Electrochim. Acta 56, 1439–1446. doi: 10.1016/j.electacta.2010.08.107
Mo, R., Lei, Z., Sun, K., and Rooney, D. (2014). Facile synthesis of anatase TiO2 quantum-dot/graphene nanosheet composites with enhanced electrochemical performance for lithium-ion batteries. Adv. Mater. 26, 2084–2088. doi: 10.1002/adma.201304338
Myung, S. T., Kikuchi, M., Yoon, C. S., Yashiro, H., Kim, S. J., Sun, Y. K., et al. (2013). Black anatase titania enabling ultra-high cycling rates for rechargeable lithium batteries. Energy Environ. Sci. 6, 2609–2614. doi: 10.1039/C3EE41960F
Reddy, M. V., Subba Rao, G. V., and Chowdari, B. V. R. (2013). Metal oxides and oxysalts as anode materials for Li-ion batteries. Chem. Rev. 113, 5364–5457. doi: 10.1021/cr3001884
Rui, X., Ding, N., Liu, J., Li, C., and Chen, C. (2010), Analysis of the chemical diffusion coefficient of lithium ions in Li3V2(PO4)3 cathode material. Electrochim. Acta 55, 2384–2390. doi: 10.1016/j.electacta.2009.11.096
Shen, J., Wang, H., Zhou, Y., Ye, N., Wang, Y., and Wang, L. (2013). Hollow mesoporous frameworks without the annealing process for high-performance lithium–ion batteries: a case for anatase TiO2. Chem. Eng. J. 228, 724–730. doi: 10.1016/j.cej.2013.05.050
Shen, K., Chen, H., Klaver, F., Mulder, F. M., and Wagemaker, M. (2014). Impact of particle size on the non-equilibrium phase transition of lithium-inserted anatase TiO2. Chem. Mater. 26, 1608–1615. doi: 10.1021/cm4037346
Sheppard, L. R., Bak, T., and Nowotny, J. (2008). Electrical properties of niobium-doped titanium dioxide. 3. thermoelectric power. J. Phys. Chem. C 112, 611–617. doi: 10.1021/jp0730491
Song, H., and Kim, Y.-T. (2015). A Mo-doped TiNb2O7 anode for lithium-ion batteries with high rate capability due to charge redistribution. Chem. Commun. 51, 9849–9852. doi: 10.1039/c5cc02221e
Štengl, V., and Bakardjieva, S. (2010). Molybdenum-doped anatase and its extraordinary photocatalytic activity in the degradation of orange II in the UV and vis regions, J. Phys. Chem. C 114, 19308–19317. doi: 10.1021/jp104271q
Thi, T. V., Rai, A. K., Gim, J., Kim, S., and Kim, J. (2014). Effect of Mo6+ doping on electrochemical performance of anatase TiO2 as a high performance anode material for secondary lithium-ion batteries. J. Alloy. Comp. 598, 16–22. doi: 10.1016/j.jallcom.2014.02.019
Wagemaker, M., Van, d,. K. R., Kentgens, A. P., van Well, A. A., and Mulder, F. M. (2001). Two phase morphology limits lithium diffusion in TiO2 (Anatase): a Li-7 MAS NMR study. J. Am. Chem. Soc. 123, 11454–11461. doi: 10.1021/ja0161148
Wang, F., Wang, C., Zhao, Y., Liu, Z., Chang, Z., Fu, L., et al. (2016). A quasi-solid-state Li-ion capacitor based on porous TiO2 hollow microspheres wrapped with graphene nanosheets. Small 12, 6207–6213. doi: 10.1002/smll.201602331
Wang, H., Hao, Q., Yang, X., Lu, L., and Wang, X. (2010a). Nanostructured graphene/polyaniline hybrid material for supercapacitors. Nanoscale 2, 2164–2170. doi: 10.1039/c0nr00224k
Wang, Y., Smarsly, B. M., and Djerdj, I. (2010b). Niobium doped TiO2 with mesoporosity and its application for lithium insertion. Chem. Mater. 22, 6624–6631. doi: 10.1021/cm1020977
Wu, H., Chen, J., Hng, H. H., and Lou, X. W. (2012). Nanostructured metal oxide-based materials as advanced anodes for lithium-ion batteries. Nanoscale 4, 2526–2542. doi: 10.1039/c2nr11966h
Wu, Q., Xu, J., Yang, X., Lu, F., He, S., Yang, J., et al. (2014). Ultrathin anatase TiO2 nanosheets embedded with TiO2-B nanodomains for Lithium-ion storage: capacity enhancement by phase boundaries. Adv. Energy Mater. 5:1401756. doi: 10.1002/aenm.201401756
Xie, H., Chen, M., and Wu, L. (2017). Hierarchical TiO2/SnO2 hollow spheres coated with graphitized carbon for high-performance electrochemical Li-ion storage. Small 13:1604283. doi: 10.1002/smll.201604283
Xu, J., Jia, C., Cao, B., and Zhang, W. F. (2007). Electrochemical properties of anatase TiO2 nanotubes as an anode material for lithium-ion batteries. Electrochim. Acta. 52, 8044–8047. doi: 10.1016/j.electacta.2007.06.077
Yu, Q., Jiang, B., Gao, Y., Li, P., Liu, Z., Suo, G., et al. (2018). Metallic octahedral CoSe2 threaded by N-doped carbon nanotubes: a flexible framework for high-performance potassium-ion batteries. Adv. Sci. 5:1800782. doi: 10.1002/advs.201800782
Yu, X., Wu, H., Yu, L., Ma, F., and Lou, X. W. (2015). Rutile TiO2 submicroboxes with superior lithinm storage properties. Angew. Chem. Int. Ed. 54, 4001–4004. doi: 10.1002/anie.201411353
Zhang, G., Wu, H., Song, T., Paik, U., and Lou, X. W. (2014a), TiO2 hollow spheres composed of highly crystalline nanocrystals exhibit superior lithium storage properties. Angew. Chem. Int. Ed. 53, 12590–12593. doi: 10.1002/anie.201406476
Zhang, H., Li, G., An, L., Yan, T., Gao, X., and Zhu, H. (2007). Electrochemical lithium storage of titanate and titania nanotubes and nanorods. J. Phys. Chem. C 111, 6143–6148. doi: 10.1021/jp0702595
Zhang, J., Huang, T., Zhang, L., and Yu, A. (2014b). Molybdenum-doped titanium dioxide and its superior lithium storage performance, J. Phys. Chem. C 118, 25300–25309. doi: 10.1021/jp506401q
Zhang, R., Elzatahry, A. A., Al-Deyab, S. S., and Zhao, D. (2012). Mesoporous titania: from synthesis to application. Nano Today 7, 344–366. doi: 10.1016/j.nantod.2012.06.012
Zhao, B., and Shao, Z. (2012). From paper to paper-like hierarchical anatase TiO2 film electrode for high-performance lithium-ion batteries. J. Phys. Chem. C 116, 17440–17447. doi: 10.1021/jp305744c
Keywords: anatase, titanium dioxide, anode materials, lithium-ion batteries, aliovalent ions doped, nitrogen doped carbon
Citation: Xia Y, Rong C, Yang X, Lu F and Kuang X (2019) Encapsulating Mo-Doped TiO2 Anatase in N-Doped Amorphous Carbon With Excellent Lithium Storage Performances. Front. Mater. 6:1. doi: 10.3389/fmats.2019.00001
Received: 30 September 2018; Accepted: 03 January 2019;
Published: 13 February 2019.
Edited by:
Kai-Xue Wang, Shanghai Jiao Tong University, ChinaReviewed by:
Kai Zhu, Harbin Engineering University, ChinaShengfu Tong, Sun Yat-sen University, China
Chunhai Jiang, Xiamen University of Technology, China
Copyright © 2019 Xia, Rong, Yang, Lu and Kuang. This is an open-access article distributed under the terms of the Creative Commons Attribution License (CC BY). The use, distribution or reproduction in other forums is permitted, provided the original author(s) and the copyright owner(s) are credited and that the original publication in this journal is cited, in accordance with accepted academic practice. No use, distribution or reproduction is permitted which does not comply with these terms.
*Correspondence: Fengqi Lu, lufengqi@glut.edu.cn.