Charge Carrier Mobility of Alkali Silicate Glasses Calculated by Molecular Dynamics
 Rebecca S. Welch
 Collin James Wilkinson
 John Christopher Mauro
 Caio Barca Bragatto
- 1Department of Physics, Coe College, Cedar Rapids, IA, United States
- 2Department of Materials Science and Engineering, The Pennsylvania State University, University Park, PA, United States
Ionic conductivity is a property of rapidly increasing interest. Various models attempting to explain ionic conductivity of glass systems have shown limited agreement with experimental results; however, none have been comprehensive. By using molecular dynamics simulations, the diffusion of ion species through a network can be directly observed, providing insights into the mechanisms and their relation to ionic conductivity models. In this report, a method of utilizing molecular dynamics simulations is proposed for the study of the ionic mobility of Na, Li, and K ions in binary silicate glasses. Values found for glasses with x = 0.1, x = 0.2, and x = 0.3 alkali content are between 10−5 and 10−4 cm2·s−1·V−1 and did not change significantly with composition or temperature. This is in agreement with the interstitial pair and weak-electrolyte models used to explain ionic conductivity in glasses.
Introduction
In non-crystalline alkali silicate materials, alkalis are the most mobiles species; self-diffusion of alkali ions is generally understood as an exchange of cationic pairs between sites (Kahnt, 1991). If enough energy is applied to an ion to overcome a transition barrier to a new configuration, such as from an applied electric field, or thermal fluctuations, the atom can “hop” or “jump” to the next available site (Varshneya and Mauro, 2019). Since alkali ions are loosely associated and not strongly confined (when compared with the mostly rigid glass network), they can more easily jump between sites (Greaves et al., 1991). Certain glass compositions have been studied in literature due to their remarkably high ionic conductivity when compared to crystals (Minami et al., 1977), particularly phosphates doped with silver (Rodrigues et al., 2011), and lithium (Robert et al., 1981). In addition, increasing the conductivity of phosphate glasses by adding various modifiers has been of interest due to their already promising conductivity values (Martin and Angell, 1986; Martin, 1991).
In general, the electric conductivity, σ, can be defined as
Where Z is the valence number of the charge carrier, e is the charge of an electron, μ is the mobility of the charge carriers, and n is the concentration of the charge carriers. Further, μ can be understood from the random walk properties of mobile species and calculated using the Nernst-Einstein equation (Murch, 1983) which relates the mobility of charge carriers to the diffusion coefficient:
Where k is the Boltzmann constant and T is the absolute temperature. D is the diffusion coefficient, which can be expressed using Boltzmann statistics dependent on the jump distance (dj) of the mobile species, the geometrical factor (α) in which the diffusion hopping takes place, and the vibrational frequency (v0) of ions within the potential energy well of depth Em (Tuller et al., 1980):
The diffusion of ions can also be regarded more generally from the mean squared displacement (r2) which is more commonly used in molecular dynamics (MD) simulations. First derived by Einstein (1906), the expression relates the diffusion coefficient to the mean squared displacement within a specified observational time according to
where N is the number of averaged particles, is an initial reference position, is the position with respect to time, and the related diffusion coefficient D is given by
where Δt is the change in time over which diffusion is calculated, and nd is the dimensionality in which the process occurs.
Such diffusion mechanisms in glasses have been widely studied with various models being developed in literature (Ingram, 1989; Martin, 1991; Bunde et al., 1994). However, there remains little consensus on which model is sufficient to explain the entirety of ionic conductivity in amorphous solids. Since the mobile species in an alkali silicate glass system are only monovalent ions, Z and e from equation (1) are constant, therefore making the conductivity proportional to only the mobility and concentration of charge carriers. The difficulty of accurately measuring μ and n separately with experimental techniques has led to a lack of agreement between various models (Dyre et al., 2009). Glasses are generally considered as either strong or weak electrolytes, with the notion that either all charge carriers are able to dissociate and move rapidly (as in strong electrolytes), or only a fraction of ions over a given time interval (weak electrolytes).
The strong electrolyte view comes from the model developed by Anderson and Stuart (Anderson and Stuart, 1954), which borrows principles from the Frenkel defect theory for crystalline materials (Frenkel, 1947). They theorize that ions must overcome two energy barriers: the amount of energy needed to break an ionic bond (electrostatic binding energy), and the energy needed to create a vacancy defect in the glass network for an occupying ion (strain energy). The main conclusion from this model is that all charge carriers instantaneously move through the network given enough supplied energy, and that the concentration of charge carriers is constant with temperature (McElfresh and Howitt, 1986), making the ionic mobility the limiting factor for conductivity.
In contrast, the Interstitial Pair model (Charles, 1961) and the Weak-Electrolyte (W-E) model (Ravaine and Souquet, 1976, 1977), suggest that the charge carrier concentration n from equation (1) is what limits the conductivity. By assuming that μ is constant for a specific time interval, the concentration of moving ions will therefore be the only determining factor. Since only a fraction of ions can move, the concentration of mobile species is low but with a higher constant mobility. Glasses are considered to behave as weak electrolytes due to the smaller fraction of available ions when compared to the overall concentration (Souquet et al., 2010).
Molecular dynamics simulations have been previously used in literature to study diffusion mechanisms in glassy systems (Soules and Busbey, 1981; Soules, 1982; Li and Garofalini, 2004) including some electronic properties (Tilocca and de Leeuw, 2006), and can be used as a tool for visualizing ion transport pathways (Cormack et al., 2002; Müller et al., 2007). Due to the availability of accurate potentials and the ability to have large enough systems that can capture the statistical nature of glass, MD enables observation of behaviors which are difficult to examine experimentally. In this report, a method for utilizing MD simulations to study the mobility of binary lithium, sodium, and potassium silicates is proposed. By applying an electric field to the simulated glasses, we can gain further insights on the mechanisms of ion transport and how they relate to the ionic conductivity models that currently exist.
Methods
For an MD simulation, potentials define the inter-atomic interactions within the system and must be empirically fitted and optimized for a specific material property. In addition to potentials, the densities for each glass composition are also needed to specify the volume used in the canonical ensemble of the simulations presented. In our report, Large-scale Atomic/Molecular Massively Parallel Simulator (LAMMPS) molecular dynamics package was used to conduct all simulations. Lithium, sodium, and potassium oxide silicate glasses of the form x M2O (1-x) SiO2 were simulated for x = 0.1, x = 0.2, and x = 0.3. Pairwise potentials developed by Pedone et al. were used to describe the interactions between the species with the expression being (Pedone et al., 2006):
where Dij is the bond dissociation energy, aij is a function of the slope of the potential energy well, and r0 is the equilibrium bond distance. The fitted parameters in Table 1 were derived by Pedone et al. from binary oxide crystals. These potentials were chosen due to their widely reported accuracy for silicates and their known ability to reproduce mechanical properties (Prasada Rao et al., 2010; Xiang et al., 2013; Deng et al., 2015). Densities used were those collected by Tischendorf et al. and can be found in Table 2 (Tischendorf et al., 1998).
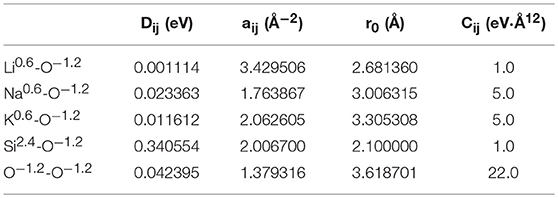
Table 1. Interatomic potential parameters used in binary silicates from Pedone et al., 2006.
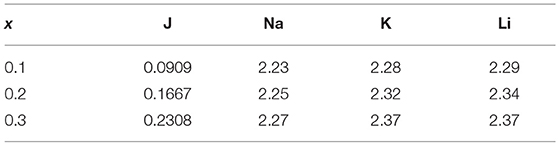
Table 2. Densities (in g/cm3) for corresponding x-values (converted from J values) used for simulations collected from Tischendorf et al., 1998.
For each composition, a timestep of 1 femtosecond (fs) was used and melting was simulated at 3,000 K. The system was then quenched and held for 1 ns at 2,000 K, 1,000 K, and 300 K in the NVT ensemble. For each sample, an electric field of 5·105 V/m across the x dimension (~2 nm) was applied after the quenching process was complete. The voltage of the electric field was chosen based on experimental values used for typical Electrical Impedance Spectroscopy measurements in which a 5–10 mV electric field is applied to a 1–3 cm thickness sample (Park and Yoo, 2003). The system was heated from 300 K to 800 K with the electric field being applied simultaneously. During this process, the mean squared displacement (MSD) was calculated by equation (4) and was recorded every 100 timesteps (approximately every 5 K). The mobility was then calculated from the MSD values as a function of the temperature by first using equation (5) to calculate the diffusion co-efficient and then equation (2) to find the mobility. For each alkali the simulation and calculation were performed independently with 3000 atoms.
Results and Discussion
In Figure 1, the pathway for one single sodium ion is shown from the simulation of the x = 0.1 sodium silicate glass. It can be seen that the ion sits on specific sites before jumping to the next, where it vibrates until it can jump once more. Similar behavior has been observed in MD previously by Jund et al. (2001), where simulated sodium ions, not exposed to an electric field, showed a propensity to jump to new sites rather than returning to the previous one (Funke and Hoppe, 1990). This motion is predicted by both strong and weak electrolyte models. The specific behavior observed in Figure 1 may be further explained as a Markovian chain process, suggesting that the motion of an ion depends only on its current environment, with no memory of its previous location (Landau and Binder, 2015).

Figure 1. Pathway for one single sodium ion during the simulation of the 0.3 Na2O · 0.7 SiO2 glass. It is possible to see how the ion has preferred sites and eventually jumps from one to the next.
Figure 2 shows the probability density function for the movement of alkali ions with varying alkali content. As shown in Figure 2, the jump distance appears to be ion-dependent, with shorter jump distances for Li, then Na, and lastly K. The average values for the jump distances are reported in Table 3. This can be attributed to the size of the ion, since a smaller ion will have a higher probability of finding a compatible site for it to move into.
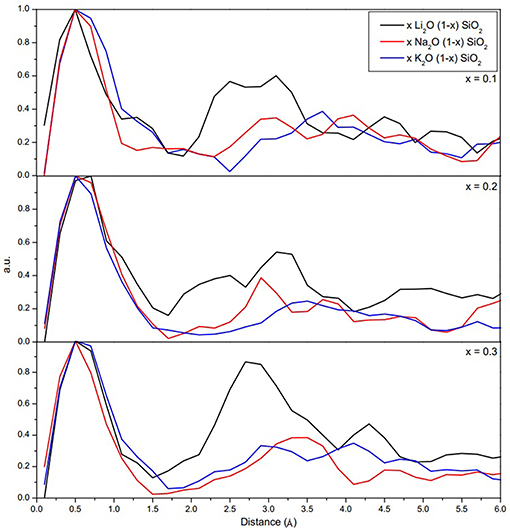
Figure 2. Probability density function of the jump distance for the alkali ions. The jump distances can be estimated from the difference between two points in which the ions spent more time during the simulation.
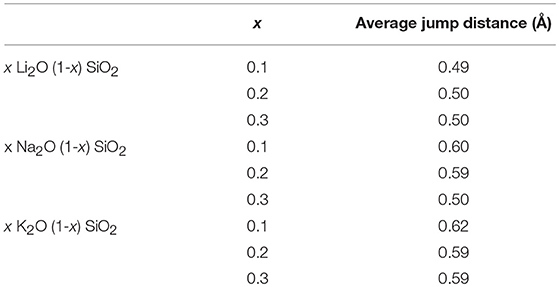
Table 3. Average jump distance (in Å) for each composition obtained by peak fitting of the probability density function from Figure 2.
Figure 3 shows the diffusion coefficient calculated using equation (5) as a function of 1000/T (in 1,000·K−1). The diffusion follows an Arrhenius behavior for the process, as expected when comparing to experimental results (Varshneya and Mauro, 2019). The ionic mobility, as well as the diffusion coefficient, was calculated using the MSD of the alkali ions that moved along the axis of the applied field with distances above the threshold of 3 Å. This threshold was chosen as a minimum jump distance from the probability density function of Figure 2. Figure 4 show the temperature dependence of the ionic mobility of the simulated glasses at given temperatures. The diffusion and ionic mobility were fitted with an Arrhenius equation. The slopes, which correspond to the activation energy, and the intercept values can be seen in Table 4.
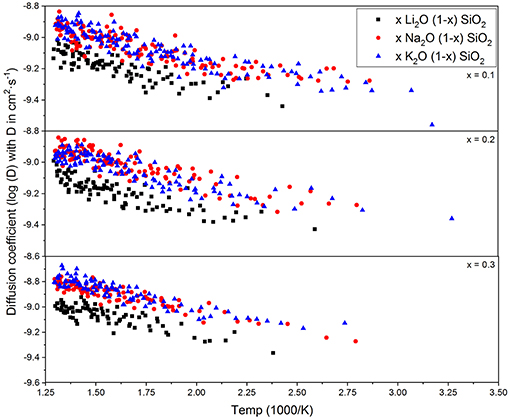
Figure 3. Diffusion coefficient of the alkali ions calculated from equation (5) as a function of 1/T. The Arrhenius behavior is well-known for these glasses, being self-diffusion, or diffusion due to an external electric potential.
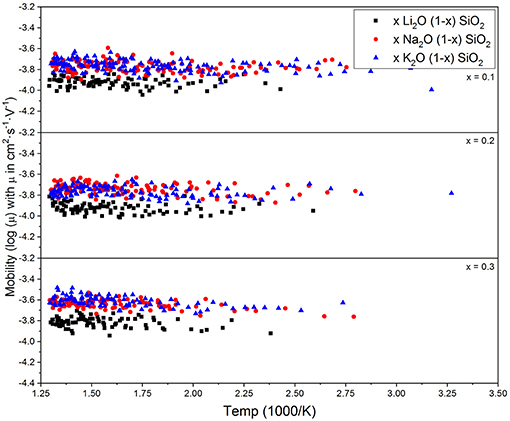
Figure 4. Calculated alkali ion mobilities from equation (6) vs. temperature for three different compositions. The mobility does not change significantly with temperature or chemical composition, which is in agreement with the interstitial pair and weak-electrolyte models.
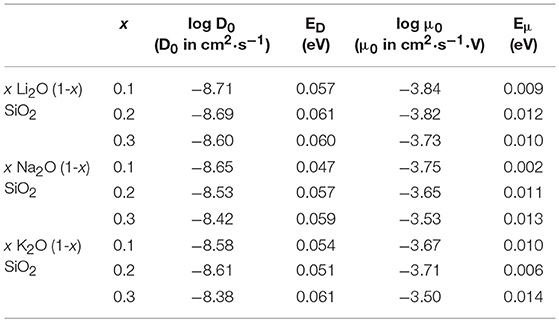
Table 4. Intercept (log D0, D0 in cm2·s−1 and log μ0, μ0 in cm2·s−1·V) and activation energy (ED and Eμ, both in eV) for the diffusion process and the ionic mobility, respectively, calculated using the Arrhenius equation and the data from Figure 2.
From Figure 4 it is easy to see that the ionic mobility does not change significantly with either chemical composition or temperature, varying from 5·10−5 to 5·10−4 cm2·s−1·V−1. Thus, the diffusion process has a lower activation energy when compared to the activation energy needed for charge carrier formation or the energy required for the ionic conductivity process. This result is very close to the values found for AgPO3-AgI conducted by Clément et al. from Hall effect measurements (Clément et al., 1988) and by Rodrigues who measured the enthalpy change for the glasses at temperatures above and below the glass transition temperature (Rodrigues et al., 2011). Diffusion of different alkali ions in water, both by physical experiments and by MD simulations, agree in order of magnitude (Lee and Rasaiah, 1994). This is in agreement with the weak-electrolyte model where the mobility is relatively constant (within one order of magnitude) and the number of effective charge carriers is largely responsible for whether a glass is more or less ionically conductive.
The ionic conductivity of these glasses may vary by orders of magnitude with temperature according to experimental results (Varshneya and Mauro, 2019). The results presented here which show a constant mobility with respect to temperature and composition, suggest that a change in the number of effective charge carriers is what causes the increase in ionic conductivity in these alkali silicate glasses. Due to the non-crystalline nature of the glassy state and its complex energy landscape, the energy barriers for moving ions have a distribution. Thus, during a single ion's diffusion, it may either end up being “trapped” in a high-energy barrier site or stay for a comparably short time in a low-energy barrier one. Given enough time, however, all mobile ions should move and contribute equally to the ionic conductivity at non-zero temperatures, assuming that during this process each ion will jump through enough sites for an average energy to be observed. The problem resides in defining a sufficient time interval to wait before proceeding to calculations. This complicates the definitions of a charge carrier and its corresponding mobility, previously defined in equation (1), since the number of charge carriers can change depending on the time interval used (Dyre et al., 2009).
Physical experimental results in which the so-called DC ionic conductivity (Barsoukov and Macdonald, 2005) is observed, the data is normally obtained by AC impedance spectroscopy with frequencies varying from 104 to 102 Hz, i.e., the measurement takes from 108 to 1010 ps. This does not affect the mobility of the ions, but it does affect the number of effective charge carriers. With the simulated glasses, diffusion was observed for 5,000 ps at each temperature. Due to the difference in observation times, it is difficult to compare calculated ionic conductivity values obtained from these simulations with their physical counterparts. The only experimental data which exists was obtained by Clément using Hall Effect Measurement in silver phosphate glasses, and by indirect measurements by Rodrigues, also in silver phosphate glasses. The process of obtaining the ionic conductivity with these glasses in literature is by Electrical Impedance Spectroscopy measurements which are done in frequencies from 106 to 1 Hz, which is also not comparable to the nanosecond scales of molecular dynamics simulations.
It is also known that the ionic conductivity shows a dependence with the thermal history of the glass (Bragatto et al., 2016). Even though this dependency is small for physical experiments when compared to effects of temperature and chemical composition, the extreme cooling rates used in MD may have a larger impact on the results.
Conclusions
Lithium, sodium, and potassium silicates glasses were simulated using the LAMMPS molecular dynamics package with potential parameters from Pedone et al. while under an electric field. The mean squared displacement of the ions was used to calculate the jump distance between sites, the ionic diffusion, and the ionic mobility of the alkalis. In literature, models for ionic conductivity in glasses can be divided into two groups: one proposing that the ionic conductivity depends mainly on the ionic mobility of the glasses and one proposing that it depends on the dissociation equilibrium of the dopant salts in the glass. From our results, we conclude that the second is most likely to be true for alkali silicate glasses. The ionic mobility was found to be constant with temperature and independent of chemical composition. This is in agreement with predictions from the interstitial pair and the weak-electrolyte models, i.e., the ionic conductivity of glasses depends more strongly on the number of effective charge carriers than the mobility of the ions. The ionic conductivity itself was not accurately calculated due the short observational time intrinsic to MD experiments. MD has been shown to be a strong tool for observing many phenomena which would be impossible, costly, or labor-intensive, as in the present case for ionic diffusion due to electric fields in oxide glasses. The main objective of this study was to gain insight on the dependency of the ionic mobility with glass composition with the new technique of applying an electric field to simulated samples.
Author Contributions
CB designed the research. RW, CW, and JM worked on the MD. RW and CW worked on the calculations and figures. All authors contributed to writing the article.
Conflict of Interest Statement
The authors declare that the research was conducted in the absence of any commercial or financial relationships that could be construed as a potential conflict of interest.
Acknowledgments
The authors would like to acknowledge Penn State for the computational resources. The authors would also like to thank Dr. Steve Feller, Dr. Mario Affatigato, and Arron Potter for their comments and Dr. Lothar Wondraczek for the invitation to publish.
References
Anderson, O. L., and Stuart, D. A. (1954). Calculation of activation energy of ionic conductivity in silica glasses by classical methods. J. Am. Ceram. Soc. 37, 573–580. doi: 10.1111/j.1151-2916.1954.tb13991.x
Barsoukov, E., and Macdonald, J. R. (2005). Impedance Spectroscopy: Theory, Experiment, and Applications. 2nd Edn. Somerset, NJ: John Wiley & Sons, Inc. doi: 10.1002/0471716243
Bragatto, C. B., Cassar, D. R., Peitl, O., Souquet, J.-L., and Rodrigues, A. C. M. (2016). Structural relaxation in AgPO3 glass followed by in situ ionic conductivity measurements. J. Non Cryst. Solids 437, 43–47. doi: 10.1016/j.jnoncrysol.2016.01.010
Bunde, A., Ingram, M. D., and Maass, P. (1994). The dynamic structure model for ion transport in glasses. J. Non-Cryst. Solids 172–174, 1222–1236. doi: 10.1016/0022-3093(94)90647-5
Charles, R. J. (1961). Polarization and diffusion in a silicate glass. J. App. Phys. 32, 1115–1126. doi: 10.1063/1.1736169
Clément, V., Ravaine, D., Déportes, C., and Billat, R. (1988). Measurement of hall mobilities in AgPO AgI glasses. Solid State Ionics. 28–30, 1572–1578. doi: 10.1016/0167-2738(88)90422-5
Cormack, A. N., Du, J., and Zeitler, T. R. (2002). Alkali ion migration mechanisms in silicate glasses probed by molecular dynamics simulations. J. Phys. Chem. Chem. Phys. 4, 3193–3197. doi: 10.1039/b201721k
Deng, Y., Eames, C., Chotard, J.-N., Lalère, F., Seznec, V., Emge, S., et al. (2015). Structural and mechanistic insights into fast lithium-ion conduction in Li4SiO4-Lo3PO4 solid electrolytes. J. Am. Chem. Soc. 137, 9136–9145. doi: 10.1021/jacs.5b04444
Dyre, J. C., Maass, P., Roling, B., and Sidebottom, D. L. (2009). Fundamental questions relating to ion conduction in disordered solids. Rep. Prog. Phys. 72:046501. doi: 10.1088/0034-4885/72/4/046501
Einstein, A. (1906). Investigations on the theory of the brownian movement (translated). Ann. Phys. 19:371. doi: 10.1002/andp.19063240208
Funke, K., and Hoppe, R. (1990). Jump-relaxation model yields Kohlrausch-Williams-Watts behavior. Solid State Ionics. 40–41, 200–204. doi: 10.1016/0167-2738(90)90321-H
Greaves, G. N., Gurman, S. J., Catlow, R. A., Chadwick, A. V., Houde-Walter, S., Henderson, C. M. B., et al. (1991). A structural basis for ionic diffusion in oxide glasses. Phil. Mag. 64, 1059–1072. doi: 10.1080/01418619108204878
Ingram, M. D. (1989). Ionic conductivity and glass structure. Phil. Mag. Part B. 60, 729–740. doi: 10.1080/13642818908209739
Jund, P., Kob, W., and Jullien, R. (2001). Channel diffusion of sodium in a silicate glass. Phys. Rev. B 64, 1–5. doi: 10.1103/PhysRevB.64.134303
Kahnt, H. (1991). Ionic transport in oxide glasses and frequency dependence of conductivity. Phys. Chem. 95, 1021–1025. doi: 10.1002/bbpc.19910950913
Landau, D. P., and Binder, K. (2015). A Guide to Monte Carlo Simulations in Statistical Physics. 4th Edn. Cambridge, UK: Cambridge University Press, 33–35.
Lee, S. H., and Rasaiah, J. C. (1994). Molecular dynamics simulation of ionic mobility. I. Alkali metal cations in water at 25°C. J. Chem. Phys. 101, 6964–6974. doi: 10.1063/1.468323
Li, W., and Garofalini, S. H. (2004). Molecular dynamics simulation of lithium diffusion in Li2O-Al2O3-SiO2 glasses. J. Solid State Ionics. 166, 365–373. doi: 10.1016/j.ssi.2003.11.015
Martin, S. W. (1991). Ionic conduction in phosphate glasses. J. Am. Ceram. Soc. 74, 1767–1784. doi: 10.1111/j.1151-2916.1991.tb07788.x
Martin, S. W., and Angell, C. A. (1986). Dc and Ac conductivity in wide composition range Li2O P2O5 glasses. J. Non-Crys. Sol. 83, 185–207. doi: 10.1016/0022-3093(86)90067-0
McElfresh, D. K., and Howitt, D. G. (1986). Activation enthalpy for diffusion in glass. J. Am. Ceram. Soc. 69, C237–C238. doi: 10.1111/j.1151-2916.1986.tb07347.x
Minami, T., Nambu, H., and Tanaka, M. (1977). Comparison of ionic conductivity between glassy and crystalline solid electrolytes in the system AgI-Ag2O-MoO3. J. Am. Ceram. Soc. 60, 467–469. doi: 10.1111/j.1151-2916.1977.tb15539.x
Müller, C., Zienicke, E., Adams, S., Habasaki, J., and Maass, P. (2007). Comparison of ion sites and diffusion paths in glasses obtained by molecular dynamics simulations and bond valence analysis. J. Phys. Rev. B 75:014203. doi: 10.1103/PhysRevB.75.014203
Murch, G. E. (1983). The exact Nernst-Einstein equations and the interpretation of cross phenomenological coefficients in unary, binary, and ambipolar systems. Radiat. Eff. 73, 299–305. doi: 10.1080/00337578308220688
Park, S. M., and Yoo, J. S. (2003). Electrochemical Impedance Spectroscopy for Better Electrical Measurements. Anal. Chem. 75, 455–461. doi: 10.1021/ac0313973
Pedone, A., Malavasi, G., Menziani, C. M., Cormack, A. N., and Segre, U. (2006). A new self- consistent empirical interatomic potential model for oxides, silicates, and silica-based glasses. J. Phys. Chem. B. 110, 11780–11795. doi: 10.1021/jp0611018
Prasada Rao, R., Tho, T. D., and Adoms, S. (2010). Ion transport pathways in molecular dynamics simulated lithium silicate glasses. Solid State Ionics 181, 1–6. doi: 10.1016/j.ssi.2009.12.003
Ravaine, D., and Souquet, J.-L. (1977). A thermodynamic approach to ionic conductivity in oxide glasses. Part 2. A statistical model for the variations of the chemical potential of the constituents in binary alkali oxide glasses. Phys. Chem. Glasses. 19, 115–120.
Ravaine, D., and Souquet, J. L. (1976). A thermodynamic approach to ionic conductivity in oxide glasses. Part 1. Correlation of the ionic conductivity with the chemical potential of alkali oxide in oxide glasses. Phys. Chem. Glasses. 18, 27–31.
Robert, G., Malugani, J., and Saida, A. (1981). Fast ionic silver and lithium conduction in glasses. Solid State Ionics 3–4, 311–315. doi: 10.1016/0167-2738(81)90104-1
Rodrigues, A. C., Nascimento, M. L., Bragatto, C. B., and Souquet, J.-L. (2011). Charge carrier mobility and concentration as a function of composition in AgPO3-AgI glasses. J. Chem. Phys. 135:234504. doi: 10.1063/1.3666835
Soules, T. F. (1982). Molecular dynamic calculations of glass structure and diffusion in glass. J. Non-Cryst. Solids. 49, 29–52. doi: 10.1016/0022-3093(82)90107-7
Soules, T. F., and Busbey, R. F. (1981). Sodium diffusion in alkali silicate glass by molecular dynamics. J. Chem. Phys. 75, 969–975. doi: 10.1063/1.442097
Souquet, J.-L., Nascimento, M. L., and Rodrigues, A. C. (2010). Charge carrier concentration and mobility in alkali silicates. J. Chem. Phys. 132:034704. doi: 10.1063/1.3271154
Tilocca, A., and de Leeuw, N. H. (2006). Structural and electronic properties of modified sodium and soda-lime silicate glasses by Car-Parrinello molecular dynamics. J. Mat. Chem. 16, 1950–1955. doi: 10.1039/B517362K
Tischendorf, B., Ma, C., Hammersten, E., Venhuizen, P., Peters, M., Affatigato, M., and Feller, S. (1998). The density of alkali silicate glasses over wide compositional ranges. J. Non-Cryst. Solids. 239, 197–202. doi: 10.1016/S0022-3093(98)00740-6
Tuller, H. L., Button, D. P., and Uhlmann, D. R. (1980). Fast ion transport in oxide glasses. J. Non-Cryst. Solids. 40, 93–118. doi: 10.1016/0022-3093(80)90096-4
Varshneya, A. K., and Mauro, J. C. (2019). Fundamentals of Inorganic Glasses. 3rd Edn. Cambridge, MA: Elsevier. doi: 10.1016/B978-0-12-816225-5.00022-5
Keywords: glass, molecular dynamics, ionic conductivity, ionic mobility, ionic conductivity models
Citation: Welch RS, Wilkinson CJ, Mauro JC and Bragatto CB (2019) Charge Carrier Mobility of Alkali Silicate Glasses Calculated by Molecular Dynamics. Front. Mater. 6:121. doi: 10.3389/fmats.2019.00121
Received: 02 January 2019; Accepted: 10 May 2019;
Published: 31 May 2019.
Edited by:
Lothar Wondraczek, Friedrich Schiller University Jena, GermanyReviewed by:
Alfonso Pedone, University of Modena and Reggio Emilia, ItalyDonghui Zhao, Unifrax LLC, Tonawanda, United States
Copyright © 2019 Welch, Wilkinson, Mauro and Bragatto. This is an open-access article distributed under the terms of the Creative Commons Attribution License (CC BY). The use, distribution or reproduction in other forums is permitted, provided the original author(s) and the copyright owner(s) are credited and that the original publication in this journal is cited, in accordance with accepted academic practice. No use, distribution or reproduction is permitted which does not comply with these terms.
*Correspondence: Caio Barca Bragatto, cbragatto@coe.edu