Evidence for a Correlation of Melt Fragility Index With Topological Phases of Multicomponent Glasses
 Ralph Chbeir
 Mathieu Bauchy
 Matthieu Micoulaut
 Punit Boolchand
- 1Department of Electrical Engineering and Computer Science, University of Cincinnati, Cincinnati, OH, United States
- 2Physics of AmoRphous and Inorganic Solids Laboratory (PARISlab), Department of Civil and Environmental Engineering, University of California, Los Angeles, Los Angeles, CA, United States
- 3Sorbonne Université, CNRS UMR 7600, Laboratoire de Physique Théorique de la Matière Condensée, Paris, France
Scores of glass compositions in the equimolar GexAsxSe100−2x ternary system are synthesized across the 0 < x < 26% range, and their homogeneity tracked by ex-situ Raman profiling. In synthesis, we alloyed the starting materials to homogenize until the variance, <Δ×>Ge, in Ge content “x,” across a 1.5-g sized batch composition of <0.01% was realized. We undertook Modulated-DSC, Raman scattering, and molar volume experiments as a function of composition. Trends in Tg(x) increase monotonically with x over the examined range, but the non-reversing enthalpy of relaxation at Tg, ΔHnr(x), displays a sharp square-well like reversibility window over the 9.5(2)% < x < 17.0(2)% range even in rejuvenated glasses. Trends in melt fragility index, m(x), established by measuring the T-dependence of the enthalpy relaxation time across Tg, show a Gaussian-like variation with m(x) < 20 in the 9.5(2)% < x < 17.0(2)% range, and m > 20 outside that range, thus establishing a fragility window. The close correlation between the variations of m(x) and ΔHnr(x) underscores that super-strong melts formed in the fragility window form Intermediate Phase (IP) glasses in the reversibility window, while fragile melts formed at non-IP compositions give rise to either flexible or stressed-rigid glasses. Molar volumes of glasses reveal a global reduction for IP glass compositions, thereby underscoring the compacted nature of the isostatically rigid networks formed in that phase. Evidence for specific dynamic features of the different phases is provided by molecular dynamics simulations, which indicate that the diffusivity is minuscule for x > 17% and increases substantially in the flexible phase. These results show that liquid dynamics and fragility encode glass topological phases in this ternary chalcogenide. The optimization of the glass-forming tendency for IP compositions, the stress-free nature of these networks, and the qualitative suppression of aging, are features that all point to their ideal nature. These ideas of IP glasses as ideal glasses are at variance with the notion that ideal glasses possess a low configurational entropy and form at Tg values that approach the Kauzmann temperature. IP networks display, adaptability, high glass-forming tendency, stress-free nature, and high configurational entropy of networks.
Introduction
Chalcogenide glasses have served as useful test laboratory to examine the predictions of Topological Constraint Theory (TCT) since the theory was first introduced (Phillips, 1979) in 1979 and its vibrational consequences elucidated by M.F. Thorpe (Thorpe, 1983) in 1983. Chalcogenides have also emerged as the materials of choice for 3D-X-point memory devices(Intel1; Malventano2; Tang et al., 2009), phase-change memory (Raoux and Wuttig, 2009), Continuum emission in the IR (Goncalves et al., 2018; Tremblay et al., 2018), optical fibers, and waveguides (Tang et al., 2015; Chen et al., 2019). The interplay between these applications and underlying basic science including topological phases (TP) now offers new prospects to tune material functionality with applications.
Amongst the chalcogenides, and particularly within the context of TCT, binary GexSe100−x glasses have acquired much notoriety starting from the mid-1980s. Inelastic neutron scattering experiments revealed a low frequency mode near 5 meV (Boolchand et al., 1990; Kamitakahara et al., 1991) and one found that the fractional scattering strength of the mode normalized to the total vibrational density of states acquires a value of nearly 1/3 in pure Se as x→ 0. The result gives confirmation of the floppy mode concept that Thorpe introduced (Thorpe, 1983) to establish the percolation of rigidity near <r> = 2.40. This indicates that the elastic phase transition is driven by a control parameter <r>, whereas the density of low frequency modes represents the order parameter of the transition. The presence of these low frequency excitations led the 119Sn Mössbauer Debye-Waller factors in GexSe100−x glasses to display a giant softening as x→ 0. This follows because the mean-square displacement (<r2>) relates to the first inverse moment of the vibrational density of states. Measurements of 119Sn mean-square displacement, <r2> as a function of Ge content x, show a vibrational threshold near x = 20.0%, or <r> of 2.40, in harmony with the notion of percolation of rigidity (Boolchand et al., 1990). And the connection of such floppy modes has been linked to the energy landscape in glasses (Naumis, 2005).
Crucial insights into the molecular structure of binary GexSe100−x glasses emerged from Mössbauer spectroscopy (Bresser et al., 1981; Boolchand et al., 1982; Boolchand, 1985; Boolchand and Bresser, 2000) using both 119Sn absorption and 129I emission spectroscopy. These experiments performed in the 31.5% < x < 33.3% composition range showed that glassy networks undergo a nanoscale phase separation (NSPS) transition near x = 31.5% into characteristic Ge-rich and Se-rich clusters, resulting in a 2% concentration of homopolar (Ge-Ge, and Se-Se) bonds in the stoichiometric glass at x = 33.3% (GeSe2) (Salmon and Petri, 2003; Salmon, 2007). Such NSPS was later confirmed in Calorimetric and Raman scattering measurements on homogeneous glasses (Bhosle et al., 2012b). In these Mössbauer Effect experiments since tracers (119Sn, 129mTe) were doped in a base glass, batch compositions necessarily had to be kept rather small, <¼ g, and the issue of glass heterogeneity was never in doubt.
A significant step forward in the field was the observation of a reversibility window in binary SixSe100−x glasses (Selvanathan et al., 1999). In MDSC one observes the enthalpy of relaxation at Tg to show a square-well like minimum (reversibility window), with the walls of the window. Such walls have been identified in a variety of theoretical models as a rigidity and a stress transition (Thorpe et al., 2000; Micoulaut and Phillips, 2003; Barré et al., 2005; Chubynsky et al., 2006). The first transition near x = 20% (<r> = 2.40), the rigidity transition, is followed by the second transition near x = 27% (<r> = 2.54), the stress transition (Thorpe et al., 2000). And it was not until 2010 (Micoulaut, 2010) that one recognized that the near vanishing of the enthalpy of relaxation in the reversibility window constituted a signature of the isostatically rigid nature of glassy networks (nc = 3) formed between the two elastic phase transitions. Such reversibility windows have now been documented in several scores of glasses (Yildirim et al., 2016b), unequivocally demonstrating the generality of the three topological phases, flexible-, intermediate, and stressed-rigid.
As larger batch sizes (2–20 g) of the chalcogenides were synthesized, it emerged in 2011 that such melts undergo delayed homogenization (Bhosle et al., 2012b; Chakraborty and Boolchand, 2014; Ravindren et al., 2014). The behavior can now be traced to the super-strong behavior of Intermediate Phase (IP) melts formed in these binary glass systems. The present equimolar Ge-As-Se ternary drew our attention for two reasons. Although MDSC and Raman scattering results did reveal (Qu et al., 2002) evidence of a reversibility window, the glass samples synthesized in 2002, were not homogeneous, a recognition that emerged only later in 2011. The second reason came from the recognition that the glass transition temperature Tg(x) displayed an almost linear variation with x, even when x exceeded the chemical threshold near xc = 18.18%. Such is not the case in several binary Selenide and Sulfide glasses such as Ge-Se (or S), and As-Se (or S) where a Tg maximum occurs near the chemical thresholds. The observation suggested (Boolchand et al., 2002) that fully polymerized glassy networks must apparently exist in the GexAsxSe100−2x ternary over a rather wide range of stoichiometry, 0 < x < 26%. That feature of the ternary was appealing (Qu et al., 2002; Qu, 2004), as it suggested the absence of any NSPS at compositions exceeding the chemical threshold. Thus, probing the nature of the topological phases, and especially the underlying rigidity- and stress- elastic phase transitions that separate these phases would be immune from effects due to NSPS.
The finding of delayed homogenization of binary Ge-Se melts/glasses was a strong impetus to re-examine the TPs in the present GexAsxSe100−2x ternary, and to clarify the role of glass synthesis in relation to the sharpness of the rigidity- and stress-elastic phase transitions that border the Intermediate Phase (IP). The second goal of the present work was to also measure the variation of fragility index in such homogenized melts and to explore if trends in melt dynamics have a bearing on the nature of the glass TPs.
In the present work we report observing a rather abrupt thermally reversing window that is square-well-like in nature even in freshly quenched glasses after rejuvenation (Tg cycling) of the especially homogenized GexAsxSe100−2x ternary glasses. Furthermore, we also examined the variation of fragility index (m(x)), and find evidence of a compositional range across which m < 20, which defines the “fragility window.” Remarkably, the compositional width of the “fragility window” observed not only coincides with that of the “reversibility window,” but both are somewhat wider in range, 9.5% < x < 17.0%, than the previous report (Qu et al., 2002; Qu, 2004). These experimentally measured anomalies are correlated with dynamic anomalies calculated from molecular dynamics simulations and a huge increase in diffusivity is detected once the glass-forming liquids become flexible.
Why is the homogeneity of a melt/glass so critical to examining topological phases? Previous molecular dynamics simulations have shown that the reversibility window arises from the fact that the flexible-to-rigid and unstressed-to-stressed transitions occur at different compositional thresholds, thereby giving birth to an intermediate phase that is rigid but free of stress (Bauchy, 2019). These two elastic transitions have been shown to be percolative in character (Jacobs and Thorpe, 1995; Thorpe et al., 2000) and, hence, one expects these transitions, in principle, to be intrinsically sharp in the composition space. In binary GexSe100−x glasses, for example, the network connectivity is determined locally by the Ge fraction x. If the variance in Ge stoichiometry “ <Δ×>Ge” across a glass specimen were to exceed 1%, one can expect the two elastic phase transitions to be smeared. That is exactly what we observed in our experiments on the GexAsxSe100−2x ternary in 2003. If the variance in Ge stoichiometry exceeded 3%, the reversibility window could be triangular (Bhosle et al., 2012b) or, worse yet, the window may not be observed. On the other hand, if the variance in Ge stoichiometry is <0.01%, as noted in the present work, one expects and, indeed, observes rather sharp rigidity- and stress-transitions. And, ideally, one would like to establish the Ge variance on an atomic scale. As a practical matter it should be at least on a scale of 50 microns, if not lower. The observation of abrupt elastic phase transitions in a topologically disordered network is not only novel and exciting but also constitutes evidence of the percolative nature of these elastic phase transitions.
Materials and Methods
Synthesis of Glasses, and Characterization of Their Homogeneity by ex situ Ft-Raman Profiling
The starting materials for the synthesis included small pieces (~ 3 mm in diameter) of 99.999% pure Se nodules from Alfa Aesar, 99.999% pure Ge lumps from Alfa Aesar and stoichiometric As2Se3 from Noah Technologies. We handled these materials in a model HE-493/MO-5 Glove box from Vacuum Atmospheres, which is designed to be flushed with dry N2 gas continuously and with a relative humidity of <0.01%. We sealed small pieces of the starting materials of about 3 mm in size or less, in the desired weight ratio, in evacuated quartz tubes of 5 mm ID and 1 mm wall thickness. Prior to their use, we dried quartz tubes in a vacuum oven at 80°C for at least 24 h. Batch size were kept at 1.5 g, and the starting materials encapsulated in evacuated quartz tubes at a pressure of 2 × 10⁻⁷ Torr using a liquid Nitrogen trapped diffusion pump system. We heated quartz tubes to 950°C for typically 10 days, keeping them vertical in a box furnace. Water impurity doping of chalcogenide glasses, unwittingly assists homogenization of melts, increases the enthalpy of relaxation of glasses, decreases Tg, and increases the fragility index of melts (Bhosle et al., 2012a,b). These extrinsic features are not representative of the dry melts/glasses.
A Thermo-Nicolet Nexus 870 based FT-Raman system, using 1,064 nm radiation from a Nd-YAG laser, focused to a 50 μm spot size (micro-setting), was used to excite the scattering. The collection optics also has provision for a macro-setting with a laser spot size of 1 mm. Glass specimen wetting 5 mm ID evacuated quartz tubes were mounted on a digitally controlled x-y-z stage to focus the laser beam entering along the quartz tube diameter (x-axis adjustment) and onto the quartz tube glass specimen interface (z-axis adjustment) to optimize the signal. The y-axis adjustment of the sample stage permitted to access specific locations along the glass column for recording Raman scattering. Spectra were acquired at typically six locations about 2 mm apart along the glass specimen column of typically 20 mm in length (y-axis adjustment). The software permits comparing observed lineshapes normalized to the highest scattering strength mode, and that facilitated directly variations in glass specimen stoichiometry by comparing the scattering strength of the corner sharing (CS) of GeSe4 tetrahedra (near 200 cm−1) with the broad band of a triad of modes (Dash et al., 2017) associated with Sen chains-uncorrelated, Sen chain-correlated, and Se8 rings (near 250 cm−1). Periodically, quartz tubes were water quenched after lowering their T to 650°C and Raman spectra taken at 6 locations along the 20 mm long melt column. By using a laser beam spot size of 50 μm or less, one probes glass homogeneity to a finer scale, which is essential to get a true representation of glass/melt homogeneity. It is important to emphasize that in these homogeneity studies the full batch composition was profiled. This of course is necessary since the stoichiometry of a small part of the batch is tied to the stoichiometry of the rest of the batch (Gunasekera et al., 2013). Figure 1 shows a partial summary of the observed spectra; and one finds how the starting melt, which is rich in Ge(Se) atoms at the bottom(top) of the vertical melt column, steadily homogenizes as Ge atoms diffuse up while Se atoms diffuse down the melt column. After 2 days of alloying the variance in Ge stoichiometry, <Δ×>Ge is found to be about 1.04%, but it systematically decreased by almost three orders of magnitude to nearly 0.01 % or lower after 10.5 days of alloying (Figure 2). In these profiling experiments, one could successfully decode the heterogeneity of the batch to a level of 0.01% range in the variance of Ge by merely sampling only a tiny volume fraction of 2% of the batch column. The existence of a gravitationally induced segregation that sets up in the melt column at the beginning of the alloying process as quartz tubes are held vertical, aids in tracking how Ge- and Se-atoms, respectively, diffuse the melt column (Gunasekera et al., 2013) to homogenize with no rocking. Had we rocked the melt column it would have been difficult to detect the isolated super-strong melt inclusions spread across the melt column unless one probed more like 10–30% or more of the batch volume, which surely would have been an enormous task in itself.
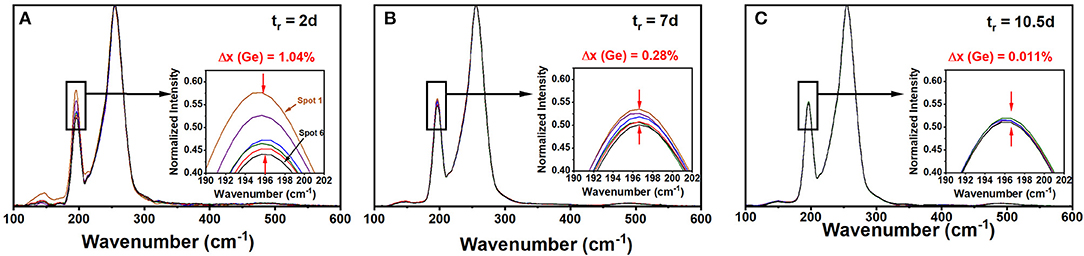
Figure 1. FT-Raman spectra of a Ge9As9Se82 glass composition profiled after being alloyed at 950°C in (A) 2d, in (B) 7d, and in (C) 10.5 d. The variance <Δ×>Ge in Ge concentration “x” across the batch decreased from 1.04(5) to 0.28(5) to < 0.05% upon progressive alloying as revealed by the spread in the normalized scattering strength of the Corner-Sharing mode near 200 cm−1 in insets. The Omnic software normalizes each spectrum to the most intense peak near 250 cm−1 coming from polymeric Sen chains. The <Δ×>Ge variance is being probed on a 50 micron scale set by the laser-spot size.
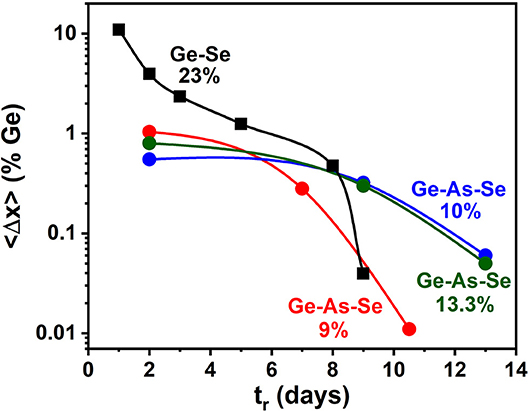
Figure 2. Observed reduction in the Ge variance <Δ×>Ge of the GexAsxSe100−2x glasses as a function of alloying time tr in days at indicated compositions x when probed at a 50 μm resolution determined by the laser spot size. Glass homogeneity steadily increases as <Δ×>Ge decreases by almost two orders of magnitude upon alloying the starting materials for typically 10–13 days. We show that delayed homogenization is tied to the Super-strong character of melts in the 9.5% < x < 17% range, the Intermediate Phase.
There are other aspects of the homogenization studies that we mention in passing. The scale on which a batch is examined in the Raman profiling experiments matters because TPs are determined by atomic scale network connectivity or mean coordination number <r>, fixed by the local Ge, As, and Se stoichiometry. Furthermore, the scale on which a batch is examined in the Raman profiling experiments matters. A sample may be homogeneous after 2 days of alloying on a spatial scale of 1 mm (laser spot size) but not on a finer scale of 50 μm (laser spot size) as we have noted (Bhosle et al., 2012a). Finally, melt homogenization kinetics are broadly determined by the slowest diffusing species or the species with the highest viscosity, which occurs in the IP. Most compositions in the GexAsxSe100−2x ternary, at x > 5%, take typically 7–11 days to homogenize in our chosen geometry. The IP compositions such as x = 10 and 13.3% take a few days longer to homogenize than non-IP ones. The fragility index of IP melts apparently controls the kinetics of melt homogenization, as we will comment later in discussion of results. In very select cases where a stoichiometric glass is being synthesized at a composition where there exists a distinct well-defined underlying simple crystalline phase, delayed homogenization could be circumvented. In the present ternary, we are unaware of any crystalline phase or phases that occur and that may expedite the homogenization process.
Finally, in our present efforts we aimed to synthesize the most homogeneous melts to explore the physics of TPs in network glasses. Once these fundamental issues are understood, new strategies can be implemented to reduce the alloying time of glass synthesis by at least an order of magnitude to achieve homogeneous melts/glasses.
Modulated-DSC as a Probe of the Enthalpy of Relaxation of Glasses at Tg and the Fragility Index of Melts
Modulated Differential Scanning Calorimetry (MDSC) has proven to be a reliable (Thomas, 2005; Bhosle et al., 2012b) and rather direct means to independently establish the glass transition temperature Tg, and the modulation frequency corrected enthalpy of relaxation of a glass at Tg (ΔHnr) with minimal scanning-rate-related kinetic upshifts. The procedure for obtaining the frequency corrected enthalpy of relaxation was developed as early as in 1995 by Len Thomas (Thomas, 2005), and more recently confirmed in numerical simulations (Guo et al., 2012). The measured ΔHnr term is a pivotal calorimetric observable of a glass, that characterizes not merely its non-ergodic state but is crucially linked to the flexibility and rigidity of networks (Micoulaut, 2010) provided these are dry and homogenous. Furthermore, MDSC also permits measuring the fragility index “m,” of a melt. We illustrate the principles of both these methods by showing results of ternary GexAsxSe100−2x glasses at select compositions. We used a Q2000 TA Instruments MDSC with glass samples in hermetically sealed Tzero Al pans (Thomas, 2005) to achieve the best baselines in the calorimetric scans.
Enthalpy of Relaxation of a Glass at Tg
A significant advance in understanding the nature of Tg in network glasses has emerged from the use of MDSC over the traditional DSC (Bhosle et al., 2012a,b; Gunasekera et al., 2013). In this approach, one programs a sinusoidal temperature variation on a linear T- ramp, to extract the part of the total heat flow that tracks the sinusoidal oscillations, called the reversing heat flow, and then obtain from them the difference signal between the total heat flow and the reversing heat flow, the non-reversing heat flow. Experiments reveal that the reversing heat flow shows a rounded step (shown in blue), while the non-reversing heat flow, shows a Gaussian-like peak (shown in red) that relates to the overshoot observed in the total heat flow (shown in green) as illustrated in Figure 3 for the case of a ternary glass at x = 11%. The red shaded area in the endotherm (curve 3, Figure 3) gives the enthalpy of relaxation upon heating the glass, and is used to calculate the frequency corrected enthalpy of relaxation (Thomas, 2005) of ΔHnr(x = 11%) = 0.00(3) cal/g. The ΔHnr term is closely tied to the physics of the glassy state. The deconvolution of the total endothermic heat flow into the reversing and non-reversing heat flow is of fundamental interest in glass science. The reversing heat flow permits establishing the Tg from the inflection point of the step while the step height ΔCp yields the change in the specific heat between the melt and the glass. The non-reversing heat flow provides a measure of non-ergodicity of the Tg transition and it's vanishing for the case of a ternary glass at x = 11%, constitutes the signature of an isostatically-rigid glass, i.e., nc = 3 (Micoulaut, 2010). The reversing heat flow provides a measure of vibrational entropy change between the glass and the melt, while the non-reversing heat flow provides a direct measure of the configurational entropy difference between the glass and the melt. The vanishing of the ΔHnr(x) term suggests that the configurational entropy of the glass is melt-like, in other words the excess entropy of the glass remains high as in the corresponding melt. Excess entropy is defined as the entropy difference between the super cooled liquid at T and the state of the glass at which the entropy can no longer be lost (Bestul and Chang, 1964).
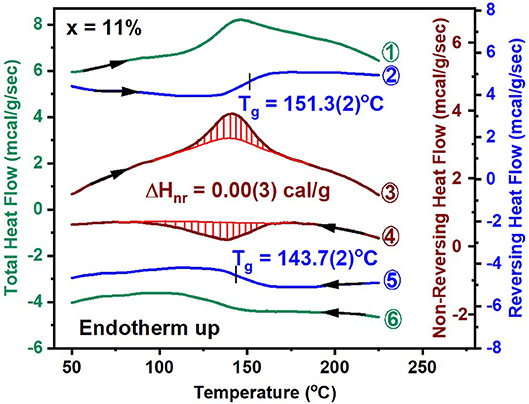
Figure 3. MDSC scan of a GexAsxSe100−2x glass at x = 11%, showing the total, reversing and non-reversing heat flow as curves labeled 1, 2, and 3 in the heating cycle. The corresponding heat flow terms in the cooling cycle are labeled as curves 4, 5, and 6. See text for the operating parameters. The mean value of Tg of 151.3°C in the heating cycle and of 143.7°C in the cooling cycle yields the scanning rate independent Tg. The frequency corrected enthalpy of relaxation, ΔHnr(x) is obtained by subtracting the exothermic contribution shaded in red (curve 4) from the endothermic one (in curve 3). The typical operating conditions are as follows; linear T ramp at 3°C/min, modulation time of 100 s, and modulation amplitude at ±1°C.
Fragility Index of a Melt
There is broad recognition (Carpentier et al., 2003; Thomas, 2005) that MDSC experiments can be undertaken to analyze the glass transition endotherm either in terms of the reversing and non-reversing heat flow components or in the complex Cp formalism. In the latter approach, the in-phase- part of the complex specific heat, Cpip, shows a step-like feature akin to the reversing heat flow, while the out- of- phase part of the complex specific heat, Cpop, shows a Gaussian-like peak akin to the non-reversing enthalpy of relaxation. Starting from a T above Tg, as one cools a melt across Tg, one observes a glass transition exotherm. One analyses the thermal event in terms of Cpip and Cpop as a function of modulation frequency and obtains the melt fragility index. In these experiments, one tracks the shift of Cpop peak as the modulation frequency is systematically changed.
To illustrate the method, we show below (Figure 4) the complex Cp results for a GexAsxSe100−2x melt at x = 14%. These results were obtained as a function of modulation time period tm in the range 60 s < tm < 120 s as the melt T is lowered from 220 to 140°C. One finds that the step in Cpip steadily shifts to higher T as the modulation frequency ω = 2π/tm increases. On the other hand, Cpop displays a peak that steadily shifts to higher T as ω increases. At the peak location the glass enthalpy of relaxation tracks the programmed modulated T- profile, i.e., ωτ = 1. By establishing the peak location of the relaxation peak, one fixes the enthalpy relaxation time τ given the modulation frequency (ω) used, and from the abscissa of the Cpop, the T at which that enthalpy relaxation time τ occurs. By plotting log of τ as a function of Tg/T (Figure 4 right) one obtains the fragility index.
The following relation then permits deducing the activation energy, Ea, for enthalpy relaxation,
The typical operating parameters are as follows; the cooling rate used was 0.5°C/min, modulation time varied from 120 to 60 s, modulation amplitude was kept at ±1°C. We calibrated the Q2000 MDSC calorimeter for temperature by performing an Indium melting scan. We calibrated the head for specific heat by using a sapphire standard. These are slow experiments typically requiring 48 h of scanning to examine one glass composition.
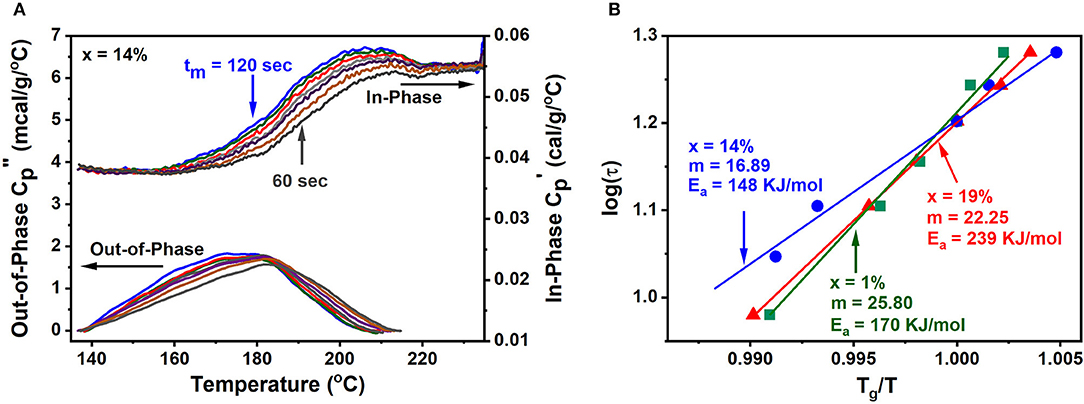
Figure 4. (A) Shows the variation of the Cpip and Cpop contributions as a function of modulation frequency. As the modulation frequency increases in going from a tm of 120–60 s, the Cpop peaks corresponding to ω·τ = 1, steadily shifts to higher temperature underscoring the melt has to relax faster (τ decreases) to track the increased (ω) modulated heat flow. (B) Shows a plot of log of τ as a function of Tg/T permitting one to deduce the fragility index from the slope (Equation 1).
Analogies between dielectric relaxation studied in electrical measurements and enthalpy relaxation examined in a calorimetric measurement (MDSC) in several glass forming systems, both organic as well as inorganic, show a rather appealing feature (Carpentier et al., 2003; Descamps and Decroix, 2014). Dielectric relaxation involves variation of polarization with a time varying electric field, while enthalpy relaxation relates to the variation of heat flow with a time varying temperature. Dielectric relaxation proceeds at a higher frequency (0.05 Hz−150 KHz) than enthalpy relaxation (0.01–0.1 Hz), and thus occurs at a lower T regime. And if one plots how these relaxation times vary with T, one observes a smooth extrapolation of the dielectric relaxation times to the longer enthalpy relaxation times as T approaches Tg (Carpentier et al., 2003). These results reassure us that melt dynamics probed by two different probes in different relaxation time regimes, show universality of behavior. These observations lend credence to the melt fragility index results on glasses deduced from MDSC.
The increase of viscosity (η) of a glass forming melt as its T is lowered to Tg is often described (Vogel, 1921; Fulcher, 1925; Tammann and Hesse, 1926; Williams et al., 1955; Angell, 1995; Hodge, 1996) by plotting log η against Tg/T. Only select melts display an Arrhenius variation of η on such a plot, such as fused SiO2, and these are termed strong, but a large number of melts display a super-Arrhenius behavior in which the activation energy Ea of viscosity (η = ηo exp Ea/kT) steadily increases as T approaches Tg. One describes (Angell, 1995; Hodge, 1996) such melts as fragile. And, formally, one defines the fragility index of a melt, m, as the dimensionless slope of the log η vs. Tg/T, as T approaches Tg (Equation 3). Within the fragile-strong classification, m varies from about a minimum value near 17 for super-strong melts to a maximum value of about 145 for the fragile ones (Mauro et al., 2009; Gunasekera et al., 2013; Chakraborty and Boolchand, 2014).
The Maxwell relation (Equation 4) connects viscosity to the shear stress relaxation time τ
with G∞ representing the infinite frequency shear modulus. And, since G∞ is T-independent, one can write the fragility index as shown in Equation 1.
In the calorimetric measurements one measures the enthalpy relaxation time τH near Tg to deduce the fragility index (Carpentier et al., 2003).
A wide variety of glass forming melts, both organic as well as inorganic, display a fragile behavior (Angell, 1995; Debenedetti and Stillinger, 2001). And one expects that at high T, close to twice Tg, the viscosity of a superstrong melt (m = 17) will exceed that of a fragile melt (m = 35) by one order in magnitude. Most remarkably, for the especially homogenized IP melt compositions examined presently and elsewhere (Gunasekera et al., 2013; Chakraborty and Boolchand, 2014; Mohanty, 2018) the super-strong nature of such melts with m < 20 (Figure 5C), leads understandably to a higher viscosity of such melts than those of the flexible phase or stressed-rigid melts. This key finding rests at the base of delayed homogenization of glass forming melts encompassing an IP composition.
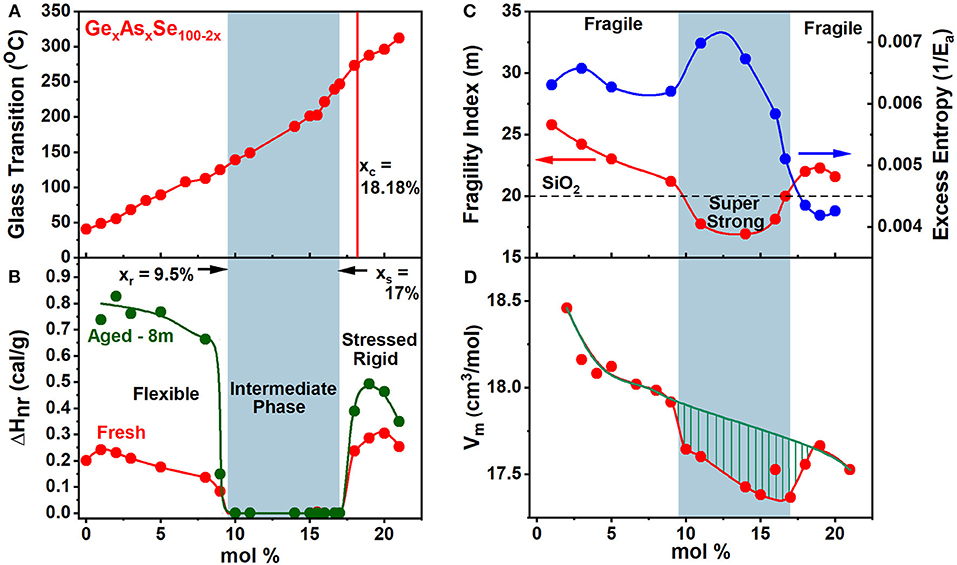
Figure 5. Displays the observed compositional trends in (A) glass transition temperature, Tg(x), (B) the non-reversing enthalpy of relaxation at Tg, ΔHnr(x), (C) melt fragility index, m(x) and (D) Molar Volumes, Vm(x), of especially homogenized GexAsxSe100−2x ternary glasses. The green striped region represents the volumetric window where the average behavior deviates from the mean behavior showing a compaction in the intermediate phase. The blue panel highlights the IP—compositions spanning the range 9.5% < x < 17.0%.
Raman Scattering
A Thermo-Nicolet FTIR Nexus 870 research bench with a Raman module was used to record Raman scattering from the bulk glasses encapsulated in evacuated quartz tubes. The bulk glass specimen was positioned on an xyz stage of the instrument and the scattering was excited using the 1,064 nm radiation from a Nd-YAG laser tightly focused to a 50 μm spot size. In a typical run 126 mW of laser power was used, the radiation focused at the quartz/ bulk glass interface and an acquisition of 100 cycles took 7 min of acquisition time. In section Quantitative Mapping of melt homogeneity by FT Raman Profiling below, we provide details of the quantitative mapping of glass/melt homogeneity from these Raman scattering data that profiled the bulk glass.
Quantitative Mapping of Melt Homogeneity by FT Raman Profiling
The variance in Ge stoichiometry <Δ×>Ge of a ternary glass at a composition x = 9%, was deduced from the spectra of Figure 1 as follows. The scattering strength ratio of the CS mode near 200 cm−1 to the broad band observed near 250 cm−1, which has contribution from predominantly Sen polymeric chains, As-centered pyramids (PYR) and -quasi-tetrahedra (QT) was deduced by analyzing Raman scattering. An empirical correlation of the Raman scattering strength ratios as a function of weighed glass composition in FT-Raman profiling experiments is generated self-consistently by having Raman results (Figure 1) from all the fully homogenized glass compositions as shown in Figure 6 by the red line joining the red filled circles. Next the profiled spectra of the glass specimen at x = 9% after 2 days of alloying was deduced and these data projected in Figure 6 as the black square data points. These data place the variance in Ge concentration across the batch after 2 days of alloying near 1.04% and provides a visual measure of glass heterogeneity. Upon alloying the glass for 7 days, the variance in Ge content in the batch decreased to 0.28%, and after 10.5 days of alloying became minuscule (<0.01%) when the batch was considered to be homogeneous.
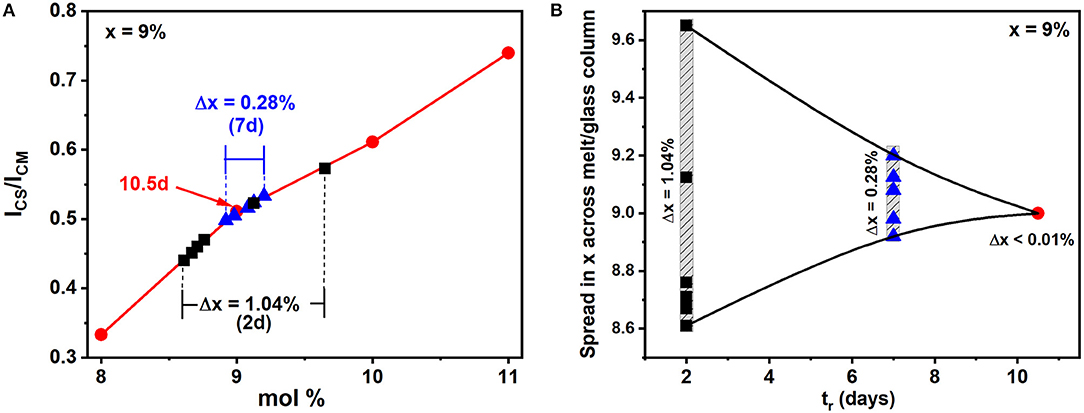
Figure 6. (A) From the fully homogenized glasses we established the red, empirical correlation of the Raman scattering strength ratios with weighed glass composition once that composition has been homogenized in the FT-Raman profiling experiments, describing the variation in the scattering strength ratio of the Corner-Sharing mode near 200 cm−1 to the broad Sen chain band near 250 cm−1. The six spectra plotted in Figure 1 are normalized to the highest scattering strength band near 250 cm−1, and the spread in the CS mode strength after 2 days of alloying provides a visual measure of glass heterogeneity. These data are plotted as the black squares in the plot above. Upon alloying the glass for 7 days, the variance in Ge content of the glass decreased to 0.28%, and then became minuscule (<0.01%) after 10.5 days of alloying. (B) An alternative representation of melt homogenization can be displayed by plotting the variance <Δ×> in Ge stoichiometry deduced from FT-Raman profiling of a 1.5-g batch composition weighed at x = 9% and its composition tracked as a function of tr, the alloying time, at 950°C in days. Note that the variance decreases by 2 orders of magnitude in going from 2d (1.04%) to 10.5d (0.01%) and yields the expected weighed composition at x = 9%.
The rigidity- and stress- elastic phase transitions in these disordered molecular networks are intrinsically sharp because of their percolative (Thorpe, 1985) nature, and glasses must be homogenized (Boolchand, 1985) at least to a scale of 50 μm or less to establish the intrinsic nature of these transitions.
Molar Volumes
Densities of our glass samples were determined by using Archimedes principle with 200 proof alcohol being the immersion fluid. We established the density of alcohol by using a Si crystal wafer of a known density (ρsi = 2.323 g/cm3). We mounted the Si crystal on a quartz fiber that was suspended from a Mettler-Toledo model B154 digital microbalance, with a resolution of 0.1 mg, and weighed it in air. The quartz fiber is then submerged into the fluid and the balance tared to negate the buoyant force on the fiber. The Si crystal was then placed on the quartz fiber hook and submerged into the fluid and the weight of the Si crystal in alcohol recorded. Having the weight of the Si crystal in air and in alcohol then enabled one to calculate the density of the alcohol.
To establish the accuracy and reproducibility of our method, the density of a Ge single crystal was independently measured, and a value of 5.324(6) g/cm3 was found, which is comparable to the published standard value of 5.323 g/cm3.
We emphasize that the glass samples used in density experiments are to be no <100 mg in weight. This allows the density to be measured to an accuracy of 0.25% or less. Each sample's density measurement was repeated 5 times.
We provide, as an example, the calculations used to establish the density of the alcohol, ρalc, and the density of a GexAsxSe100−2x glass specimen at x = 14%, ρsample.
Density of Alcohol
Weight of Silicon in air (wair): 104.8 mg; Weight of Silicon in alcohol (walc): 69.3 mg; Density of Silicon (ρsi) = 2.323 g/cm3
Density of GexAsxSe100-2x x = 14%
Weight of sample in air (wair): 127.2 mg; Weight of sample in alcohol (walc): 104.7 mg; Density of alcohol (ρalcohol): 0.786 g/cm3
The molar volumes of the bulk glass were then deduced from the mass density.
Molar Volume of GexAsxSe100-2x x = 14%
Molar mass of sample: 77.52 g/mol, Density of sample: 4.45 g/cm3.
Trends in molar volumes of the ternary glasses are summarized in the next section.
First Principles Molecular Dynamics Simulations
We performed a series of First principles molecular dynamics simulations (Car and Parrinello, 1985), using the canonical (NVT) ensemble, for the computation of the mean square displacement and the diffusion constant, on the same GexAsxSe100−2x systems containing N = 249 atoms at 11 different compositions (2, 4, 5, 8, 9, 10, 15, 17, 18, 19, 21%) with the number of As, Ge and Se atoms fulfilling the desired stoichiometry. A periodically repeated cubic cell was used, whose size changes according to the number density of the glasses (see section Molar Volumes). For the simulation of the present liquids, we used density functional theory (DFT) in combination with plane wave basis sets. The electronic scheme has been chosen after a series of methodological investigations on different liquid chalcogenide glasses and liquids (Micoulaut et al., 2009; Massobrio et al., 2010; Bouzid et al., 2015). These showed that a generalized gradient approximation (GGA) for the exchange correlation energy improves substantially the description of both short and intermediate-range order as compared to the local density approximation (LDA) (Massobrio et al., 1999). In addition, it was demonstrated that the exchange-correlation functional reducing the metallic character of the bonding (a Becke, Lee, Yang and Parr (BLYP) functional) led to systems with a reduced number of miscoordinated atoms and metallic character (Micoulaut et al., 2009), and improved the reproduction of structure functions obtained from neutron diffusion in the liquid and amorphous state (Bauchy et al., 2013; Micoulaut et al., 2013; Yildirim et al., 2016b).
Using these recipes, the electronic structure of the As-Ge-Se liquids was described within DFT and evolved self-consistently during the motion using a GGA for the exchange and correlation parts of the total energy, according to Becke (B) and LYP, respectively (Becke, 1988; Lee et al., 1988). Valence electrons were treated explicitly, in conjunction with norm-conserving pseudopotentials to account for core-valence interactions. The wave functions were expanded at the γ-point of the supercell and the energy cutoff was set at 20 Ry. Starting configurations were taken from binary Ge-Se liquids (Yildirim et al., 2016b) and As atoms were appropriately inserted in order to meet the desired stoichiometry. Loss of the memory of the initial configurations has been achieved through preliminary runs at 2,000 K over 50 ps. For all investigated compositions and temperatures (1,500 and 1,200 K), statistical averages in the liquid state were obtained over 20–25 ps of trajectory with a time step of Δt = 0.12 fs and a fictitious mass of 1,000 a.u.
Results
Glass Transition Temperature, Glass Enthalpy of Relaxation, and Melt Fragility Index
The calorimetric results on homogeneous GexAsxSe100−2x glasses show that Tg(x) increases monotonically with x over a wide range 0 < x < 25% of compositions (Figure 5A). These results show that Ge- and As- atoms serve to cross-link (Micoulaut and Naumis, 1999) polymeric Sen chains as GeSe2 tetrahedra both CS and Edge-Sharing (ES), and AsSe(1/2)3 pyramids form in the chemical composition range 8% <×< xc = 18.2%. At x > xc homopolar Ge-Ge and As-As bonds must form part of the same backbone as the one prevailing at x < xc, for Tg(x) to continue to increase at x > xc.
The variation of the non-reversing enthalpy of relaxation at Tg (ΔHnr), in the glasses shows a sharply defined square-well like minimum (Figure 5B), and it is highlighted by the light blue panel, i.e., the thermally reversing window. The vanishing of the frequency corrected enthalpy of relaxation at Tg, ΔHnr, in the 9.5% < x < 17.0. % range constitutes evidence that it represents the region of phase space (Micoulaut, 2010; Bauchy and Micoulaut, 2015; Mantisi et al., 2015) where glass transitions become thermally-reversing in character. The ΔHnr is minuscule in the IP, which is a clear evidence that the samples are dry and do not contain water impurities (Vaills et al., 2005). The dynamic reversibility of glass transitions corresponds to the overshoot in the endotherm vanishing, and is identified with the formation of isostatically-rigid local structures (Bauchy and Micoulaut, 2015), with the count of bonding constraints per atom, nc = 3, and satisfy the Maxwell-Phillips rigidity criteria (Maxwell, 1864; Phillips, 1979). Such networks are rigid but unstressed and possess a liquid-like entropy.
The variation of the melt fragility index, m(x), displaying a Gaussian like minimum (Figure 5C) with m < 20 for IP compositions, and serves to define a fragility window or, at least, a fragility minimum, in which melts are viewed to be super-strong, in the strong-fragile classification (Angell, 1995) of melts. Note that the dashed line drawn in Figure 5C marks the fragility index of SiO2 glass taken as m = 20, and it divides the m(x) plot into three regions; (i) a low x region (x < 9.5%) and (ii) a high x region (x > 17%) and (iii) an intermediate x -region. Note that fragility window coincides with the reversibility window in x-space and the three regions mentioned above represent, respectively, the flexible phase (x < 9.5%), stressed-rigid phase (x > 17.0%), and the intermediate phase (9.5% < x < 17.0%).
Intermediate phase melts, with m< 20, are quite special; these are super-strong and their viscosity at 950°C where we alloyed the starting materials are significantly greater than those of their non-IP composition counterparts. Finally, the close correlation in composition between melt- and glass- properties leads to the central finding of this work, viz, that melt fragility index encode glass TPs. Parallel findings have recently been noted in binary Ge-Se (or S) (Bhosle et al., 2012a,b; Gunasekera et al., 2013; Chakraborty and Boolchand, 2014) glasses and are suggestive that the melt-glass correlation could well be a general feature of glass science.
Compacted Nature of Intermediate Phase Networks
The variation in molar volumes of the present ternary glasses as a function of composition is plotted in Figure 5D. The average behavior shows Vm to decrease from 18.5 to 17.5 cm3/mol, reflecting the increased cross-linking of the networks. The plot also shows an additional reduction of Vm in the reversibility window shown by the hashed mark region. These data show that glass compositions are compacted (Boolchand et al., 2013), a feature observed in the IP of other glasses as well (Bhosle et al., 2012a,b; Chakraborty and Boolchand, 2014). The network compaction is broadly viewed as the consequence of the stress-free nature of the glass backbone where the effect of longer range forces such as van der Waals and Coulombic come into play, largely because the strong short-range covalent forces are balanced by the 3D network dimensionality. The average reduction in Vm(x), with increasing x, is a consequence of the increased mean coordination number, <r> = 2 + 3x, that increases linearly with x leading to space filling, i.e., more atoms being packed per unit volume. Here the mean coordination number follows if one assumes that Ge, As, and Se atoms are, respectively, 4, 3-, and 2-fold coordinated conforming to the 8-N bonding rule.
Glass Structure Evolution With Composition From Raman Scattering
Raman scattering has been particularly useful in elucidating the glass structure evolution of the present chalcogenides. The observed Raman line shapes as a function of increasing As and Ge alloying content “x” are displayed in Figure 7. We are greatly assisted in mode assignments because of the availability (Jackson and Pederson, 1990; Pederson and Jackson, 1990, 1991; Quong et al., 1993; Porezag and Pederson, 1996; Porezag, 1997; Briley and Pederson, 1998; Jackson et al., 1999) of the expected normal mode frequencies of the various As-centered and Ge-Centered local structures from NRLMOL cluster calculations (Table 1). Furthermore, Raman scattering in the Ge-Se binary glasses, intensely investigated in previous work (Bhosle et al., 2011, 2012a), have confirmed the Ge-centered local structure mode frequencies. The case of the As-Se binary glasses has also been investigated (Chen et al., 2010; Ravindren et al., 2014), although some ambiguities in mode assignments have persisted, issues that we will address here.
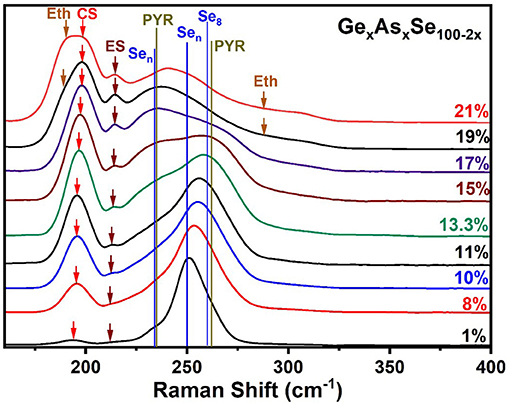
Figure 7. Observed FT-Raman scattering results on GexAsxSe100−2x ternary glasses as a function of increasing Ge and As content “x.” The expected vibrational modes are labeled. Jackson et al. have calculated these normal modes by NRLMOL code summarized in Table 1. In the 300 cm−1 to the 600 cm−1 range we see weakly excited modes that are presented and analyzed in Figure 8. The assigned modes are Eth, Ethane; CS, Corner Sharing; ES, Edge Sharing; Sen, Selenium Chain; PYR, Pyramidal; Se8, Selenium 8 rings.
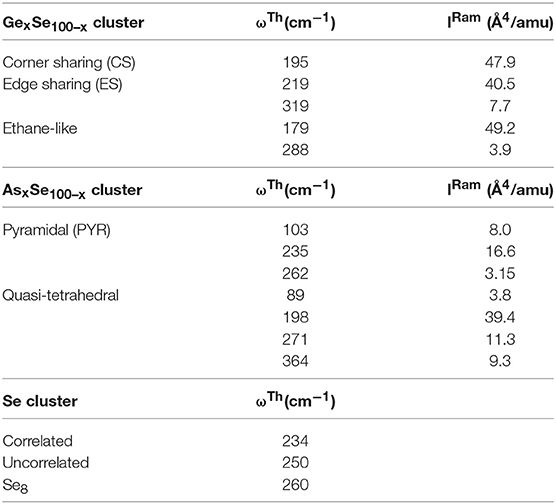
Table 1. Vibrational modes of the Ge-centered CS and ES tetrahedra and Ethane like Ge2Se6 units are included in the top panel, followed by those of the As-centered local structures base on pyramidal and quasi-tetrahedral local structure in the middle panel, and those of the triad of modes related to polymeric Sen Chains in the lowest panel (Jackson et al., 1999).
At low x (< 5%), the spectra are dominated by the broad band near 250 cm−1 coming from polymeric Sen chains and some contribution from Se8 rings and compacted Sen chains. These display a triad of modes (234, 259, and 260 cm−1) as shown in Table 1 and have been confirmed in experiments on very dilute Ge doped Se glasses (Yannopoulos and Andrikopoulos, 2004; Dash et al., 2017). Detailed results in binary GexSe100−x glasses (Bhosle et al., 2012a) reveal that the vibrational modes near 197 cm−1 comes from Corner-sharing and the one near 217 cm−1 from edge sharing GeSe2 tetrahedra. With increasing x, and particularly near x = 15% the square shaped band in the 225–275 cm−1 range has contributions from modes of As-centered pyramidal (235 cm−1, 265 cm−1) and quasi-tetrahedral (198, 271 cm−1) units.
Perhaps the most striking result to emerge from these spectra on homogeneous glasses in the present work is the mode near 350 cm−1 (shown in the inset of Figure 8) that steadily increases with x. Although the increase is slight in QT1, by comparing it to its bond bending vibrational mode, QT2, there is undoubtedly an increase in the concentration of the quasi-tetrahedra with increasing x. In a previous study (Qu et al., 2002; Qu, 2004), this particular mode was not observed in glasses probably because these were not especially homogenized. This particular mode is predicted near 364 cm−1 (Table 1) and involves stretch of the double bonded Se = As(Se1/2)3 in a quasi-tetrahedral local structure. With increasing x, the QT mode near 350 cm−1 sits at the edge of the more strongly excited mode of Ge ES units near 320 cm−1 and is thus eventually masked in the inset of Figure 8.
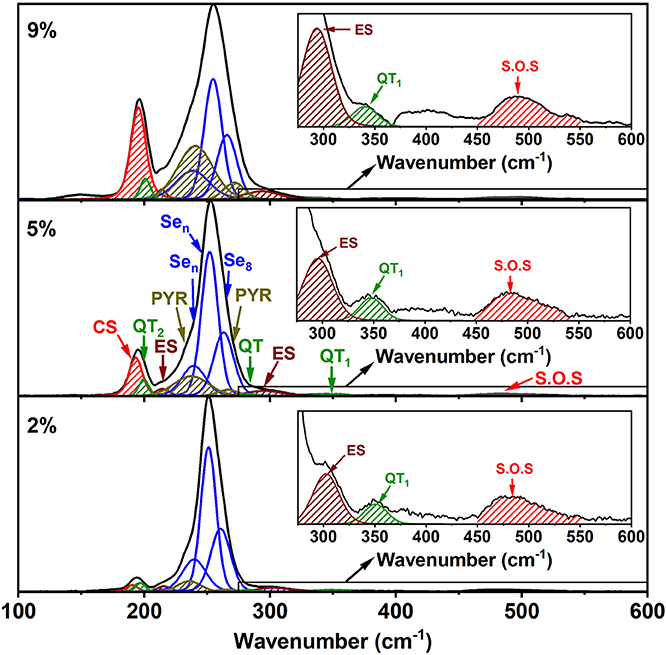
Figure 8. Raman line shape deconvolution at several glass compositions in the low x regime of the present ternary. These modes are in harmony with the expected vibrational modes of the characteristic local structures as shown in Table 1. In the high frequency range spanning 300–600 cm−1, we illustrate in the inset evidence of the 350 cm−1 mode coming from the As-centered QT units. The red hash-marked mode represents second order scattering from the Sen chain mode near 250 cm−1. See text.
The strongest QT mode occurs at 198 cm−1 and it overlaps with the mode of CS tetrahedral units, making a quantitative determination of the QT local structures at best difficult.
Dynamic Anomalies in the Liquid State
In the present contribution, we also focus on the dynamics of the obtained simulations. Structural properties will be considered and discussed elsewhere. The calculation of the mean-square displacement (msd) <r2(t)> of the three tagged atoms (As, Ge, Se) leads to a usual profile in a log-log plot representing <r2(t)> with time, i.e., a ballistic regime at short time where the behavior scales as t2 and a diffusive regime that sets in for most compositions (1,500 K) at around 1–5 ps. Note that, because of the chosen high temperatures considered herein, no cage-like motion is obtained. The diffusion constant Di (i = As, Ge, Se) can be obtained using the Einstein relation limit:
and both DSe and DAs are plotted as a function of content for the isotherms 1,500 and 1,200 K (Figure 9). Experimental diffusivity values for such system are unavailable but one can check that the values of Di are globally compatible with similar systems. For instance, it has been found (Yildirim et al., 2016a) that Ge diffusion is of about 5.10−5 cm2.s−1 in Ge20Se80 liquids at 1,373 K, i.e., rather close to the value obtained for a similar Se content in the present case (6.4.10−5 cm2.s−1 for Ge10As10Se80 at 1,500 K). Such values have been found to be compatible with viscosity results (Stølen et al., 2002; Gueguen et al., 2011) at high temperature once a Stokes-Einstein equation is used to estimate the viscosity (Sipp and Richet, 2002).
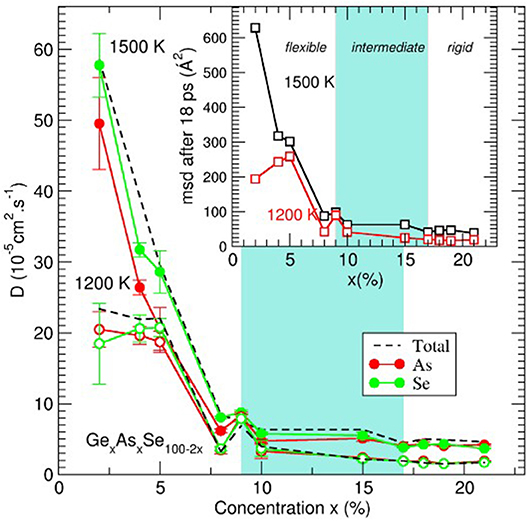
Figure 9. Average self-diffusion constant (broken lines) and species dependent (As, red; Se, green) self-diffusion constant D(x) for two isotherms (1,500 and 1,200 K) as a function of content x in GexAsxSe100−2x glass-forming liquids. The inset represents the Se average mean-square displacement after 18 ps simulation time. Gray zones represent the location of the intermediate phase.
An inspection of the behavior with composition clearly indicates that the diffusivity results contain features of the underlying TPs. Di is very small for highly cross-linked melts (x > 17%, e.g., DSe = 2.5 10−5 cm2.s−1 for x = 21% and 1,500 K), increases slightly in the IP, and then becomes very large (about 10 times larger at x = 4%), with the substantial increase of D manifesting in the flexible phase. In contrast to the Ge-Se, wherein IP melts were found to display a minimum in diffusivity (Yildirim et al., 2016b), in the present Ge-As-Se, melts in the IP (9–17%) remain nearly constant in diffusivity. However, it should be noted that, for such elevated temperatures, extrema can be barely visible, as noted earlier for high temperature Ge-Se liquids (Yildirim et al., 2016a).
The nature of the dynamics is also very strongly dependent on composition and the distance of motion for the atoms (e.g., Se atoms in the inset of Figure 9) increases substantially in liquids that are flexible. For stressed-rigid phase compositions, the msd is rather small, e.g., <r2(t)>=19Å2 for x = 21% at 1,200 K, corresponding to a distance of several interatomic distances only (4.5 Å) and larger distances can hardly be explored due to the large cross-link density. As the Se content increases, IP compositions seem to lead to a slight increase <r2(t)>, barely visible from the figure. The most noticeable change is obtained at the intermediate to flexible boundary and at both investigated temperatures, <r2(t)> starts to dramatically increase at 8–9% to reach nearly 200 Å2 for x = 2%.
Discussion
Correlating Melt Dynamics With Glass Topological Phases
Trends in Fragility Index and in Projected Melt Viscosity
In the observed trend of m(x) (Figure 5C), we had noted before, that there is a global Gaussian-like variation of m(x) centered around the fragility window; with m < 20 in the fragility window, 9.5% < x < 17.0%, and m > 20 for compositions outside that window. The implications are that the viscosity of melts in the fragility window would be much greater than those of melt compositions outside that window.
We have used the Mauro, Yue, Allison, Gupta and Alan (MYEGA) model to calculate the viscosity of GexAsxSe100−2x melts using the following relation,
as a function of Tg/T given the measured fragility index, m, the alloying temperature of T = 950°C, and the measured Tg(x) of the glasses. In the Equation (5) above η∞ is taken as log10 η∞ = −4 at m = 60. We project the variation of the viscosity η(x) with melt composition in Figure 10C as the green data points. We find η(x) increases by almost two orders of magnitude in going from the fragile melt composition x = 9.0% to the super-strong melt composition at x = 15.0 % in the fragility window. In fragile melts at x > 17% the increase of Tg is responsible for the increased viscosity from Equation (5). The broad implications of these projections are clear, viscosity of melts in the fragility window increases substantially leading melt diffusivity to reduce in that window in relation to diffusivity of fragile melt compositions at x < 9.5%. We believe these considerations are responsible for the delayed homogenization of all chalcogenide melts (Figure 2) synthesized presently. As an aside we would like to draw attention of the reader to reference (Gunasekera et al., 2013), wherein one could visually observe the sharply reduced diffusion of GexSe100−x melts (in Figure 3 of the reference) in the narrow super-strong regime of 21.5% < x < 23.0% where the fragility index reduced to m = 15. This was made possible by recording Raman spectra as a function of alloying time in those profiling experiments.
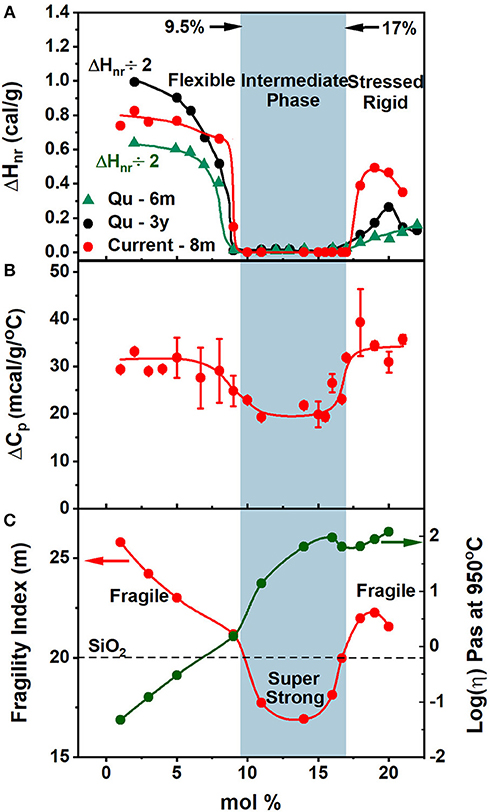
Figure 10. Observed variation of (A) the Non-reversing heat flow, ΔHnr(x) in present glasses () compared to previous work of Tao and Boolchand (, •), (B) the specific change ΔCp(x), and (C) the fragility index, m, in the especially homogenized ternary GexAsxSe100−2x glasses in the present work. Also projected is the variation of melt viscosity, η at 950°C expected using the measured m and the MYEGA equation.
Trends in Enthalpy of Relaxation at Tg and Configurational Entropy Difference ΔSconfig Between a Glass and Corresponding Melt
The present calorimetric results (Figure 10) unambiguously show the existence of two elastic phase transitions (Boolchand et al., 2001; Qu et al., 2002) rather than a single one, as was suspected several years ago (Thorpe, 1983; Tatsumisago et al., 1990; Böhmer and Angell, 1992), corresponding to the percolation of rigidity near <r> = 2.40. The observation of two elastic phase transitions in binary SixSe100−x glasses (Selvanathan et al., 1999) lead as early as 1998 to the recognition that, in real glasses, the rigidity and stress transitions will, in general, occur at two distinct and separate network connectivity. And it led to the birth of the IP as composed of rigid but unstressed networks formed between these two transitions. In the present ternary these two transitions occur near x = 9.5% or <r> = 2.285, and near x = 17.0% or <r> = 2.51. And we identify these, respectively, with the onset of rigidity and onset of stress in these glasses (Thorpe et al., 2000). The identification is consistent with the vanishing of the frequency corrected enthalpy of relaxation, which has been shown to be the signature (Micoulaut, 2010) of networks being isostatically rigid, nc = 3. Micoulaut (2010) and Bauchy and Micoulaut (2015) were one of the first to link enthalpy of relaxation at Tg in calorimetric measurements with the optimally-constrained nature, nc = 3, of glassy networks. The two transitions are also observed in ΔCp(x), which reveals a small step of 0.01 cal/g/°C at both the rigidity- and the stress-transitions (Figure 10B). The two transitions are also observed in melt fragility index variation m(x), which show a fragile (m > 20) to superstrong (m <20) transition near x = 9.5%, and then a superstrong (m < 20) to fragile (m > 20) transition near x = 17.0%, the stress-transition.
Correlating Melt Dynamics With Their Glass Topological Phases
The compositional variation of ΔHnr(x) and m(x) observed (Figures 10A,C) in the present glass system demonstrates that superstrong melts in the fragility window upon cooling to Tg will invariably form IP glasses in the reversibility window. On the other hand, fragile melts formed at non-IP compositions give rise to either flexible or stressed-rigid glasses. Furthermore, one can uniquely distinguish between the two kinds of fragile melts by recognizing that for glasses in the flexible phase the fragility index, m, decreases with an increase of Tg, while the reverse would be the case for glasses in the stressed-rigid phase (see Figures 5A,C). The correlation observed between ΔHnr(x) and m(x) here in the case of the present ternary has, indeed, close parallels to the case of the Ge-Se (or S) binary systems (Gunasekera et al., 2013; Chakraborty and Boolchand, 2014). Taken together, these results on especially homogenized melts/glasses are suggestive that melt dynamics encode the glass topological phases. The result that may well-represent a general principle of glass science.
Correlating Melt Fragility Index From Flexure- and Viscosity- With Present Modulated-DSC Experiments
Three decades ago, ternary GexAsxSe100−2x melts were investigated in terms of viscosity (Tatsumisago et al., 1990) and flexure measurements (Böhmer and Angell, 1992). Both sets of experiments made use of the same stock of glasses. These were synthesized by alloying the pure elements in evacuated quartz tubes at a T range in the 600–1,150°C range for 24 h. The fragility index results as a function of glass composition from both sets of experiments (Böhmer and Angell, 1992) yielded remarkably similar results (Figure 11). And, for ease of comparison, we have included the present results (Figure 5C) in Figure 11 as well. It is comforting to see that in all three data sets, fragility index of melts within a narrow range of compositions near x = 13.3% or <r>= 2.40 display a strong character, while those at x < 9.5% and x > 17% become increasingly fragile.
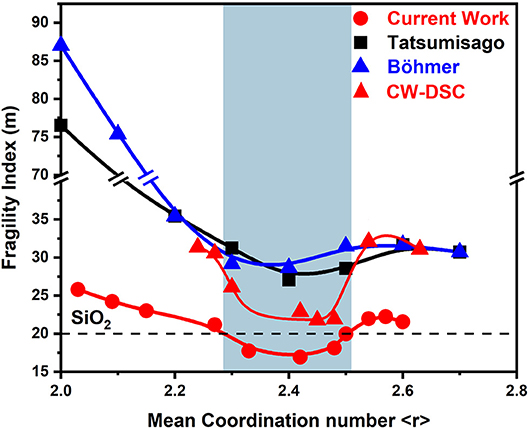
Figure 11. Variations in the fragility index of equimolar GexAsxSe100−2x ternary melts reported by Tatsumisago et al. (■) and by Böhmer and Angell () compared to those reported in the present work using MDSC () and DSC ().
On the other hand, the actual values of the fragility index, m, reported in the viscosity and flexure measurements are significantly greater from those measured in the present MDSC work. The difference is as large as 60 units in m near pure Se to about 30 units near <r> = 2.40 or x = 13.3 mole% and about eight units in m near the composition x = 20 in the stressed-rigid phase. We have also measured the fragility index of the present Ge-As-Se glasses using the Moynihan approach (Moynihan et al., 1974). If the Tg's in the DSC measurement are established from the inflection point of the heat flow, trends in m(x) (Figure 11) are quite similar to those found using MDSC (Figure 5C). In particular in the IP range m approach a value close to 20.
We can think of two possible factors contributing to this large disparity in melt fragility index on the same glass ternary system. The first factor could be the role of the experimental method. In viscosity and flexure, one probes the shear stress relaxation time, while in the calorimetric measurement the enthalpy relaxation time—and it has been suggested that different properties of glasses and melts may exhibit distinct relaxation times (Potuzak et al., 2011; Yu et al., 2015, 2017). On the other hand what is of relevance here is the variation in the T dependence of the relaxation time, and not the relaxation time magnitude itself. For example, fragility index of melts measured by Dielectric spectroscopy (Carpentier et al., 2003), Dynamic Light scattering (Fabian and Sidebottom, 2009), and MDSC (Mohanty et al., 2019), involve measuring different kinds of relaxation times, but when these are plotted against inverse Temperature close to Tg, yield nearly the same slope, i.e., fragility index. The second factor could be the sample make up. For small (1.5-g) batch sizes, as shown in Figures 1, 2, we noted at least 1.5 mole% spread in Ge stoichiometry near x = 9% for melts alloyed for 24 h at 950°C. In the viscosity (Tatsumisago et al., 1990) and flexure (Böhmer and Angell, 1992) measurements, which require much larger samples than the ones synthesized presently, the synthesis of homogeneous bulk glasses is unlikely to be achieved with the alloying treatment described (Tatsumisago et al., 1990; Böhmer and Angell, 1992). Melt heterogeneity would invariably lead to increased fragility index as noted in recent work as well (Ravindren et al., 2014). The large differences in the magnitude of m between the present work and these earlier reports at the same composition, x, probably result from glass sample make up. Heterogeneity of melts would invariably lead the fragile component to rapidly diffuse through a melt leaving the least mobile super-strong component to be largely localized in small pockets. The delayed homogenization of chalcogenide melts, such as those reported here in the present ternary, may well be a generic factor contributing to the large spread in fragility index at the same melt/glass composition.
Aging of the Reversibility Window in Fully–With Partially–Homogeneous GexAsxSe100-2X Glasses
The challenges in the synthesis of homogeneous chalcogenide glasses came to the fore when FT-Raman profiling measurements (Bhosle et al., 2012a,b) were first brought to bear on understanding how melt/glass batches actually homogenize in real time upon alloying of the starting materials. The delayed nature of the homogenization over 7–10 days of alloying rather than 1 or 2 days was subsequently found to be a fairly pervasive feature of all chalcogenides examined since. And it was traced to the super-strong nature of melts in the IP with fragility index m < 20 that slow down the diffusive mixing of the batch composition (Gunasekera et al., 2013). In 2003, we had synthesized GexAsxSe100−2x glasses by alloying the starting materials at 960°C for 48 h, which we now recognize only lead to partially homogeneous glasses- i.e., the variance, <Δ×>, of Ge stoichiometry across the 1.5 g batches are estimated near 1.5 mole% from the results of Figure 2. The reversibility window in these glasses displayed edges that were smeared when examined after 1 month of aging (Qu, 2004) for that reason. But upon long term aging (6 months, 3 years) at room temperature the reversibility window evolved and showed that, for glasses at x < 10%, the ΔHnr(x) term increased and the reversibility window edge near x = 10% sharpened up (Figure 10A).The aging induced increase of ΔHnr(x) at x > 17% was much less pronounced, understandably so because the Tg values of these stressed-rigid glasses are measurably greater than those of the flexible ones at x < 10% (Figure 5A), leading to substantially reduced kinetics of aging as determined by the T/Tg ratio. In spite of that limitation, one finds that both the rigidity- and stress- transitions became better defined upon aging, to closely approach the transitions observed in the especially homogenized glasses.
The aging behavior of the homogeneous glasses examined in the present work stands in sharp contrast to the findings on the partially homogenized glasses studied earlier. We could clearly observe sharp rigid- and stress- elastic phase transitions in the fresh rejuvenated glasses (Figure 5B). It helps one understand how homogeneity of melts/glasses is intimately tied to the observation of the IP in these glasses. Melt/glass homogenization is precursive to observation of a sharp square-well like reversibility window permitting one to fix the three TPs (Boolchand et al., 2018).
MDSC experiments also show that the non-ergodic enthalpy of relaxation ΔHnr(x), builds up significantly upon aging of non-IP glass compositions to about 2.0 cal/g after 3 years of room temperature aging (Qu, 2004) (Figure 10A). Thus, in fully relaxed glasses the underlying configurational entropy change associated with Tg, ΔSconf exceeds 0.08 cal/g/°C. In the estimate, we take the width of Tg to be 25°C. Finally, the heat capacity change at Tg, ΔCp(x) associated with the reversing heat flow of 0.015 cal/g/°C, suggests that the underlying change in vibrational entropy, ΔSvib, is nearly half that of ΔCp(x), a value of 0.008 cal/g/°C. Thus ΔSconf (= 80 mcal/g/°C) is an order of magnitude greater than ΔSvib (= 8 mcal/g/°C). A correlation of strong (fragile)- melts with a small (large) magnitude of ΔCp across Tg has been suggested (Angell, 2000). That correlation is also observed in the present findings (Figure 10B). But the present results also show a far more striking correlation of melt fragility with the enthalpy of relaxation, ΔHnr(x) of the glass.
We note that ΔHnr(x) is vanishingly small in glasses resulting from superstrong melts, but it increases by several orders of magnitude in glasses that result from fragile melts. The ΔHnr(x) term results from the non-reversing heat flow and it contributes an entropy change (ΔSconf) that is configurational, which far exceeds ΔSvib resulting from the jump in Cp across Tg, ΔCp, which comes from the reversing heat flow. We view the presence of the rather high value of ΔSconf term in the IP to suggest that the configurational entropy of IP melts decreases minimally (ΔHnr(x) = 0) for IP glasses, underscoring that networks characterizing the IP have a rather high entropy, i.e., a liquid-like entropy. On the other hand, the much higher value of ΔHnr(x) in the relaxed non-IP glass compositions constitutes a signature that their phases have undergone substantial reconstruction upon aging and possess a lower configurational entropy than their high-T melt counterparts (Figure 5C).
In the Flexible phase (x < 10%), the large increase in ΔHnr upon aging (Figure 5B), and in the projected melt configurational entropy Sc (Figure 5C), we trace to the polymeric Sen chains. As x decreases in the 0% < x < 10% range, the Sen chains grow in length with n ~ 250 in pure Se. The uncorrelated Sen chains characteristic of the fresh glass, particularly if they are long (n > 15) will reconstruct with each other and get correlated (Dash et al., 2017), while some of the long chains will transform to Se8 rings, as documented (Dash et al., 2017) in the Se-rich (x < 8%) phase of binary GexSe100−x glasses from Raman scattering. Specifically, the broad band near 250 cm−1 in Raman scattering of these Se-rich glasses is composed of a triad of modes identified respectively with (i) correlated Sen chains, (ii) uncorrelated Sen chains and (iii) Se8 rings, and aging induced changes in the scattering strength of these modes have assisted in identifying the microscopic origin of aging (Dash et al., 2017) and would understandably apply to the flexible phase of the present ternary as well.
In the Stressed-rigid phase of the present ternary glasses (x > 17.0%), the glass backbone is composed of high mean coordination number <r> local structures. These include CS- (2.40) and ES- GeSe2 (2.67) tetrahedra and Pyramidal As(Se1/2)3 (2.40). The backbone compacts as revealed by the steadily decreasing Molar volumes (Figure 5D). And aging will further lead to a compaction of the network resulting in the configurational entropy to decrease or ΔHnr to increase (Figure 5B). On the other hand, in the IP, quite remarkably, the presence of an isostatically rigid and stress-free backbone, endows glasses with a new functionality to adapt and self-organize. And aging is qualitatively suppressed in this phase.
Glass Molecular Structure and Intermediate Phases
One of the more challenging issues in glass science is to predict the compositional windows across which networks can self-organize to display IPs and the underlying molecular structure manifestations. Some important clues on the microscopic origin of self-organization effects can be sought by examining the molecular structure of glasses. The IPs in the Ge-Se and As-Se binary systems, and the present GexAsxSe100−2x ternary are established. It is useful to inquire if these windows display any correlations, and, if so, what one might learn on the molecular structure of the IP from such correlations. We comment on some of these issues next.
Reversibility Windows of As-Se, Ge-Se Binary Exhaust the Window of the Present GexAsxSe100−2x Ternary
Upon alloying traces of As- and Ge- in a base Se glass one expects the chains of polymeric Sen chains to be crosslinked by As-centered quasi-tetrahedra, Se = As(Se1/2)3 (<r> = 2.28) and As-centered pyramids, As(Se1/2)3, (<r> = 2.40), Ge centered corner-sharing (CS)- GeSe4 tetrahedra (<r> = 2.40), and Ge-centered edge sharing (ES)-GeSe2 tetrahedra (<r> = 2.67) progressively. A count of bond-stretching and bond-bending constraints shows that the four local structures, viz., Se = As(Se1/2)3, As(Se1/2)3, GeSe4, ES-GeSe2 are isostatically rigid (nc = 3). The presence of both As- centered and Ge-centered local structures leads to chemical disorder, increases the configurational entropy of the backbone and thus assists (Yan, 2018), in formation of the IP. The presence of chemical disorder suppresses NSPS effects and thereby a Tg maximum near the chemical threshold. The latter feature is observed in respective binary glasses as eluded earlier. And since the mean coordination numbers of these local structures steadily increase in the 2.28 < <r> < 2.67 range, one expects As-centered local structures to predominantly form in the 2.28 < <r> < 2.40 range and, at higher x, the Ge-centered local structures to form in the 2.40 < <r> < 2.51 range. In a qualitative fashion, one may thus view the superposition of both binary glass reversibility windows to broadly account for the wider reversibility window in the present ternary. What do we know about the IP in Ge-Se binary and As-Se binary glass systems?
Bhosle et al. (2012b), reported upon the reversibility window in homogeneous binary GexSe100−x glasses. They found the window to be abrupt and square-well like with the onset of rigidity near xr = 2.39 and onset of stress, xs = 2.52. That result was the culmination of an effort spread over 15 years, in which the shape of the reversibility window changed from triangular-like, to Gaussian-like to becoming Square-well like as melt/glass specimen were steadily homogenized (Bhosle et al., 2012b), and the variance in Ge-stoichiometry was systematically reduced from about 1.0–0.05% as the alloying time of melts at 950°C was increased from 2 days to about 7 days.
In the first MDSC study of As-Se glasses (Georgiev et al., 2001) where the existence of a reversibility window was observed (Figure 12) in the 29% < x < 37% range, binary melts were alloyed near 700°C for 3 days and then water quenched. The glasses were never Tg cycled after the quench but merely aged at room temperature, thereby offsetting the segregation effect of the eutectic. And the reversibility window observed is characteristic of glasses composed of As-centered pyramidal and quasi-tetrahedral local structures. Here, one must recall that the Eutectic temperature, TE (= 147 °C) is close to the Tg (= 104 °C) of glasses near x = 20% of As. It is for this reason that in aging studies of the reversibility window in subsequent studies (Golovchak et al., 2008; Ravindren et al., 2014) the integrity of the window was not preserved. In the more detailed study of Ravindren et al. (2014) where glasses were especially homogenized by alloying melts for extended periods, they were Tg cycled after a water quench. In that study, one also found the reversibility window to steadily smear, particularly near x = 20%, the eutectic composition (Figure 13), as glasses aged and steadily segregated (Ravindren et al., 2014). In a glass forming system wherein a eutectic is present close to the reversibility window, one expects thermodynamic considerations based on segregation to override self-organization effects, particularly suppression of aging of the enthalpy of relaxation due to segregation effects.
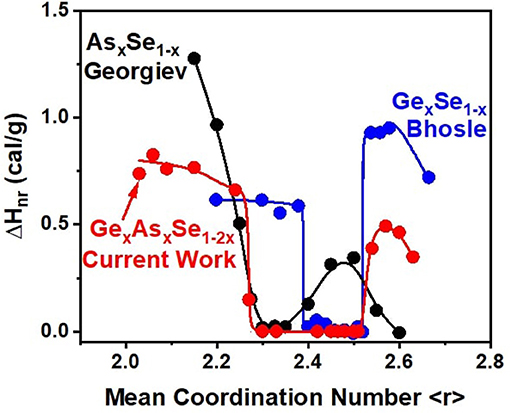
Figure 12. Reversibility window in GexAsxSe100−2x after 8 months of aging compared to the windows in As-Se and Ge-Se binary glasses taken from Georgiev et al. (2000) and Bhosle et al. (2012b).
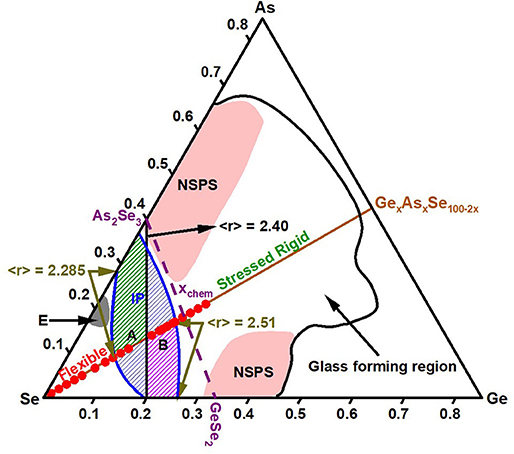
Figure 13. Topological phases observed in GexSe100−x binary (Bhosle et al., 2012b), AsxSe100−x binary (Georgiev et al., 2000) and GexAsxSe100−2x ternary projected on the Ge-As-Se compositional triangle. The glass forming region is taken from ref. Z.U. Borisova (Borisova, 1981). Starting from pure Se, as we move along the equimolar composition x, one spans the Flexible phase (0 < < r > < 2.285), the Intermediate Phase (2.285 < <r> < 2.51) followed by the stressed-rigid phase (<r> > 2.51), and with the red data points showing the 20 glass compositions examined in the present study. Note the black line joining the As2Se3 glass composition to the GeSe4 one, is the locus of glass compositions with <r> = 2.40, and it splits the IP of the equimolar ternary into almost nearly equal parts, labeled A (hashed green) and B (hashed purple), with the segment A (B) nearly overlapping with IPs observed in AsxSe100−x (GexSe100−x) binary systems, respectively. The broken line of purple color, joining As2Se3 to GeSe2 composition, represents the join of chemical threshold compositions (xchem), with NSPS setting in as x approaches xchem in both binary glass systems but not the present equimolar ternary as sketched. Feature E centered near x = 20% of As in the AsxSe100−x join is the Eutectic in that binary system. See text.
Although the existence of the Eutectic in As-Se binary, as well as P-Se binary, is well-recognized (Okamoto, 2000), the role of the eutectic on self-organization effects has received recognition only recently. And it may be helpful to add a few comments on that topic for completeness. The eutectic is signature of segregation of respective melts into Se-rich and As- rich regions. We believe that the As-rich regions consist of ethylene-like (As)2(Se1/2)4 local structures containing homopolar As-As bonds in a Se-rich glassy matrix. The evidence for these local structures have emerged recently (Ravindren, 2015) from close analogies in Raman scattering of the P-Se and As-Se binary systems. They have suggested that ethylene like (As)2(Se1/2)4 local structure in analogy to (P)2(Se1/2)4 local structure exist, for which independent confirmation is given by MD simulations (Bauchy and Micoulaut, 2013) and 31P NMR (Eckert, 1989).
To summarize, we illustrate in Figure 13, Topological phases of the GexSe100−x and AsxSe100−x binary systems and the present GexAsxSe100−2x ternary on the Ge-As-Se composition triangular plot (Qu et al., 2002; Wang et al., 2009). The IP in As-Se binary (green, label A) and the Ge-Se binary (purple, label B) when combined add up to the IP of the present ternary as illustrated by the vertical lines delineating the <r> markers at 2.28, 2.40, and 2.51. Noteworthy in the plot is the onset of NSPS in the binary glass systems near the stoichiometric chemical compositions (Boolchand et al., 2002) GeSe2 and As2Se3. In these NSPS regions it is unlikely that the network backbone connectivity has a unique value, often estimated by the usual 8-N bonding rule, taking the coordination number of Ge, As, and Se to be 4, 3, and 2, respectively.
Molecular Structure Evolution of Stressed-Rigid Networks in Binary Ge-Se and Ternary GexAsxSe100-2x Glasses Compared and Contrasted
The unusual nature of glass structure evolution in the binary GexSe100−x displaying molecular clustering in the Se-rich range (x < 33.3%) emerged from Mössbauer spectroscopy experiments using 129mTe tracer (Bresser et al., 1986). Both Te and Se atoms belong to the VIth column of the periodic table, are isovalent and take on a 2-fold coordination here. The larger covalent radius of Te (of 138 pm) than Se (of 120 pm) has profound consequences; Te selectively replaces available Se sites possessing a larger free volume, such as surface sites of characteristic molecular clusters rather than cluster interior sites (Bresser et al., 1986).
In these Mössbauer experiments, the 129I daughter A-site represents the chemically ordered site, formed from a parent 129mTe atom bonded to 2 Ge near neighbors (nns), while the 129I daughter B-site results from a 129mTe parent atom bonded to either two Se nns or a Se and a Ge nn (Bresser et al., 1986). In a continuous random network (CRN) description of these glasses, one expects the site intensity ratio NB/NA(x) as a function of Ge content “x” to show a smooth broken-line curve starting from an infinite value at x = 0, to approaching 0 at x = 33.3% for a chemically ordered stoichiometric GeSe2 glass (Figure 14B). At x = 0, all Te atoms would have two Se nns (i.e., only B sites are possible), while at x = 33.3% each Te atom would have only Ge nns if the GeSe2 glass is chemically ordered, so that only A sites are possible. In the Mössbauer effect experiments, on the other hand, trends in IB/IA(x) mimic the expectation of a CRN model only at low x < 15% of Ge, but, as x increases (> 15%), the site intensity ratio IB/IA(x) displays a local maximum near x = xc = 23%, corresponding to the centroid of the IP, where molecular clustering has evolved, and the IB/IA(x) ratio remains finite at 1.60(4) as x = 33.3%. The results underscore that the stoichiometric glass is not chemically ordered (Bresser et al., 1981, 1986; Boolchand et al., 1982; Boolchand and Bresser, 2000; Salmon and Petri, 2003). It is composed of large Se-rich clusters based on the high–T form of c-GeSe2 (α-GeSe2) (Bridenbaugh et al., 1979; Boolchand, 1985) whose surfaces are intrinsically reconstructed in the glass to form Se-Se dimers, which may be viewed as Topological defects. The late Dr. K. Murase correctly identified that the Raman stretch mode of Se-Se dimers on the surface of reconstructed clusters is near 246 cm−1 (Boolchand, 2000a).
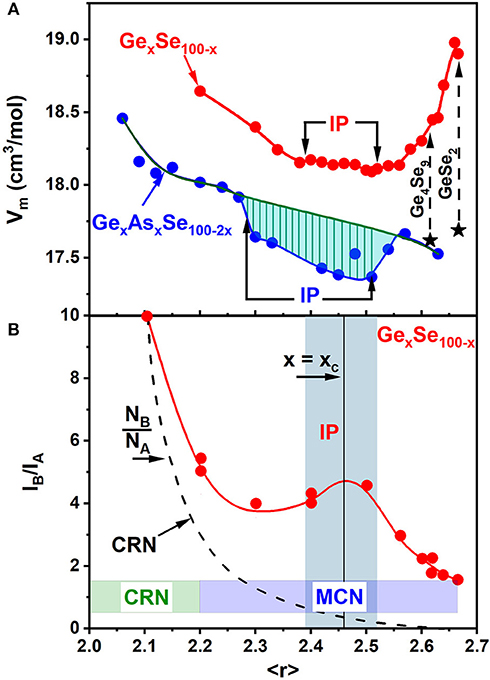
Figure 14. (A) Trends in molar volumes, Vm(x) of binary GexSe100−x glasses compared to those of the present GexAsxSe100−2x ternary glasses. (B) 129I Mössbauer site intensity ratios IB/IA (x), deduced from doping 129mTe tracer in GexSe100−x glasses reveal a Continuous Random network (CRN) type of a variation at low x (<10%). But at higher x (>15%) a Molecular Clustered Network (MCN) prevails as the observed site intensity ratios IB/IA (x) far exceed the expected NB/NA(x) site concentration ratio based on a CRN (Bresser et al., 1986). See text. Also note that as x increases to 33.3% of Ge, the finite value of the IB/IA ratio of 1.66 (10) shows the stoichiometric GeSe2 glass has an intrinsically broken chemical order (Bresser et al., 1986).
Presence of these Se-Se bonds, on grounds of stoichiometry, requires Ge-Ge bonds to exist in stoichiometric GeSe2 glass. Evidence of such bonds in small Ge-rich clusters based on ethane-like Ge2Se6 local molecular units, emerged from Raman scattering, and independently from 119Sn Mössbauer effect experiments. Since Sn is isovalent to Ge, 119Sn Mössbauer Effect experiments probe the chemically specific Ge-local structures (Boolchand and Bresser, 2000) formed in the glass, which includes both the tetrahedrally coordinated Ge sites as well as the non-tetrahedrally coordinated Ge sites as in the ethane-like Ge-rich cluster possessing Ge-Ge bonds.
The molecular clustering picture of binary GexSe100−x glasses developed above is elegantly corroborated in the measured Vm(x) results that show a qualitative increase in the stressed-rigid regime at x > 26%. That behavior in Vm(x) in Ge-Se binary differs qualitatively from the one observed in the present ternary chalcogenide. It raises the questions what is so special about the structure of these stressed-rigid binary Ge-Se glass compositions that their network structure leads to packing effects that are so different? The issue was at the center of controversy in the mid-1980s (Bridenbaugh et al., 1979; Bresser et al., 1981, 1986; Murase et al., 1983). In the equilibrium phase diagram of the Ge-Se binary there exist two crystalline phases of relevance here (i) a low T metastable structure of Ge4Se9 stoichiometry (x = 30.8%) of Vm = 17.62 cm3 (Fjellvåg et al., 2001), and a high-T form α- GeSe2 (x = 33.33%) of Vm = 17.69 cm3 (Burgeat et al., 1975). The α- GeSe2 phase consist of a stacking of 2D sheets, with each sheet composed of chains of CS GeSe2 tetrahedra that are laterally coupled by a pair of ES units (Phillips et al., 1980). The structure of Ge4Se9 is strikingly similar to that of α- GeSe2, except the pair of ES tetrahedra linking the CS chains are altered in a subtle way: these become CS tetrahedral units linked by an additional Se-Se dimer bond. Returning to the binary GexSe100−x glasses, once x > 31.5%, one observes ethane-like Ge-rich cluster to appear in 119Sn Mössbauer spectroscopy (Boolchand et al., 1982; Boolchand and Bresser, 2000), as well as in Raman scattering (Bhosle et al., 2012a) where evidence of a mode near 180 cm−1 associated with these Ge-rich cluster is observed. Clearly, as the Ge content of glasses x exceeds 31.5%, much of the Ge additive now goes into forming the Ge-rich clusters that decouple from the Se-rich backbone, thus arresting the growth of Tg(x), and one observes the slope dTg/dx to display a maximum at that composition (Bhosle et al., 2012b). The onset of backbone demixing as x > 31.5% leads the non-bonding van der Waals interaction between the clusters to grow. And we view the rapid increase of Vm(x) of binary GexSe100−x glasses in the 2.62 < <r> < 2.67 range (Figure 14A) as a direct consequence of demixing of the backbone into small Ge-rich and large Se-rich clusters. And as x = 33.3%, dTg/dx = 0, leading to a maximum of Tg, which constitutes direct evidence for the stoichiometric glass to be segregated or NSPS (Boolchand, 2000b; Boolchand et al., 2002). Such segregation is also observed in binary As-Se, Ge-S, and As-S glasses near the chemical threshold, but it notably absent in binary Si-Se glasses (Boolchand, 2000b).
In the present ternary, upon alloying As an additive in the Ge-Se binary, the NSPS effects are also completely suppressed. Trends in Vm(x) are qualitatively reversed. In the present ternary Vm(x) decreases with x (Figure 14A), as more connected local structures based on As-centered -QT units and -PYR units, Ge-centered -CS and -ES tetrahedral units emerge, and chemically disorder the network backbone. The presence of this chemical disorder precludes the growth of the 2D layer form of α-GeSe2 fragments or the 2D form As2Se3 like 6 membered rings (Kim and Boolchand, 1979; Phillips et al., 1980; Boolchand et al., 1986) to nucleate and form part of the backbone. It is for this reason the glassy backbone evolves in a topology that is Continuous Random Network (CRN) like steadily compacting with increasing x or <r>. And remarkably no evidence of NSPS is evidenced as suggested by the absence of a Tg maximum near the chemical threshold (x = 18.18% or <r>= 2.55). Furthermore, an additional reduction of Vm in the IP range (2.28 < <r> < 2.53) (Figure 14A) from the average value of Vm(x) outside the IP is observed. It emerges because the strong covalent bonding forces (bond-stretching and bond-bending) due to the known local structures satisfy the Maxwell-Phillips criteria (nc = 3) for rigidity, permitting the weaker and long range van der Waals forces to come into play and compact (Boolchand et al., 2013) glassy backbones formed in that isostatically rigid reversibility window (Figure 14A).
Intermediate Phase Glasses as Ideal Glasses
Adam-Gibbs (Adam and Gibbs, 1965) suggested that the viscosity of a melt increases as its excess configurational entropy (Sc) decreases as it is cooled to Tg described by the relation,
Since the viscosity of a melt is viewed to be a thermally-activated process,
and from the two relations above, one must then require that the inverse of the activation energy for shear relaxation time provides a measure of the excess entropy loss (Sc) upon cooling of a melt,
From Equation (9), one recognizes that the inverse of the activation energy for shear relaxation time provides a measure of the excess configurational entropy of the melt as it cools.
Since the fragility index deduced from calorimetric measurements are often correlated with those inferred from viscosity or shear relaxation times, one then expects the inverse activation energy, 1/Ea, from calorimetric measurements to provide a measure of configurational entropy loss as a melt is cooled.
The inverse activation energy for enthalpy relaxation (1/Ea) in the present Ge-As-Se chalcogenide melts as a function of composition, Figure 5C, displays a maximum near the center of the IP. The result unambiguously shows that as an IP melt cools from a high T to T = Tg, the configurational entropy Sc remains high, and indeed, that is also the reason the resulting glass has a near vanishing non-reversing enthalpy, ΔHnr(x). Such glass compositions are viewed as possessing liquid-like structures with a high Sc and for that reason show minimal aging (Boolchand and Goodman, 2017). The low propensity for aging of isostatic glasses also echoes the fact that isostatic systems have been shown to exhibit minimum creep deformations under sustained load (Pignatelli et al., 2016; Bauchy et al., 2017). On the other hand, the non-IP glass compositions have their structure evolve with either polymeric Sen chains (as in t-Se, entropy sinks) forming at x < 9.5% or CS and ES- GeSe2 tetrahedra and pyramidal As(Se1/2)3 units forming at x > 17%, and leading the ΔHnr(x) term to increase, and thus lower the configurational entropy of the melt/glass (Figures 5B,C). IP glass compositions display a high glass-forming tendency, show minimal aging, and are thus Ideal glasses. These ideas of IP glasses as ideal glasses are at variance with the notion that ideal network glasses possess low configurational entropy and form at T close to the Kauzmann temperature (Angell, 1995). On the other hand, the high configurational entropy of IP glass compositions and their functionality to adapt are much closer to the recent ideas of a competition between entropy and energy to stabilize the intermediate phase (Yan, 2018).
Conclusions
The specially homogenized nature of the bulk GexAsxSe100−2x glasses synthesized in the present work have lead the frequency corrected Enthalpy of relaxation at Tg, ΔHnr(x), to display a square-well-like reversibility window even in the fresh (rejuvenated) state. Upon room temperature aging for 8 months, the window gets substantially deeper. The reversibility window is bordered by an abrupt rigidity- transition, near xr = 9.5(2)% and an equally abrupt stress-transition near xs = 17.0(3) %.
The specially homogenized nature of the bulk glasses synthesized in the present work has also led molar volumes (Vm) across the IP composition range, 9.5% < x < 17%, to show an additional small but systematic reduction of 2.5% in Vm in the IP from the average behavior of Vm across the range of compositions examined. The result demonstrates the compacted nature (Boolchand et al., 2013) of the isostatic networks formed in that special phase.
The melt fragility index, m(x), deduced from MDSC experiments show a Gaussian-like global minimum with m(x) < 20 for IP compositions, defining the fragility window. The fragility window coinciding with the reversibility window, underscores that super-strong melts give rise to IP glasses, while fragile melts to either flexible or stressed-rigid glasses, leading to the conclusion that melt dynamics encode glass Topological phases.
Trends in the projected melt viscosity, η(x) using the measured fragility index, m(x), and the MYEGA formalism, show almost three orders of magnitude increase in η(x) in the 0 < x < 20% range. Trends in the inverse of the projected viscosity, 1/η(x), broadly parallel the melt diffusivities D calculated from ab-initio MD simulation. These results are strongly suggestive that the delayed homogenization of melts during synthesis is due to the low diffusivities or high viscosity of melts at 950°C in the 13% < x < 25% composition range.
Finally, the inverse of the activation energy for enthalpy relaxation time shows a maximum near x = 14%, the center of the IP melt compositions, strongly suggesting that such melts possess a high liquid-like configurational entropy, Sc, in the Adams-Gibbs picture. The optimization of the glass forming tendency for IP compositions, the stress-free nature of these structures in which three types of isostatically-rigid local structures proliferate, and the qualitative suppression of aging in that phase, the high configurational entropy of IP networks, each point to the ideal nature of glasses formed in the IP. Some of these exceptional functionalities of IP networks observed in experiments, appear to find support in recent ideas based on Statistical Mechanics modeling of the IP (Yan, 2018).
Data Availability
The datasets for this manuscript are not publicly available because much of the work comes from the Ph.D. dissertation of RC and it will be available when he defends his thesis. Requests to access the datasets should be directed to boolchp@ucmail.uc.edu.
Author Contributions
RC synthesized glasses and performed MDSC experiments, Raman scattering, and Molar volume experiments. He analyzed these data working closely with PB. MB and MM assisted with numerical simulations and extensive discussions on topological phases, melt dynamics, and ideal glasses. PB coordinated the experimental work performed at University of Cincinnati, and all co-authors RC, MB, MM, and PB assisted in writing the manuscript.
Funding
PB acknowledges support from NSF grant DMR 08-53957. MM acknowledges support of Agence Nationale de la Recherche(ANR) Grant No ANR-11-BS08-10012 from American Fulbright Commission and International Materials Institute (H. Jain). MB acknowledges support from NSF grants 1562066, 1762292, and 1826420.
Conflict of Interest Statement
The authors declare that the research was conducted in the absence of any commercial or financial relationships that could be construed as a potential conflict of interest.
Acknowledgments
It is a pleasure to thank Dr. Alan Jackson for assistance with simulation package NRLMOL to calculate Raman and Infrared vibrations from characteristic local structures. We acknowledge with much pleasure continued discussions with Dr. Bernard Goodman, Dr. Jim Phillips, and Dr. Sergey Mamedov on issues of glass science and Dr. Caleb McDonald for issues on MDSC. We are indebted to Leonard Thomas for providing crucial insights on the frequency correction effect of the enthalpy of relaxation at Tg that he discovered and presented at the September, 1995 NATAS Conference, San Francisco, CA.
Footnotes
1. ^Intel 3D XPointTM: A Breakthrough in Non-Volatile Memory Technology. Intel. Available online at: https://www.intel.com/content/www/us/en/architecture-and-technology/intel-micron-3d-xpoint-webcast.html (accessed February 14, 2019).
2. ^Malventano, A. How 3D XPoint Phase-Change Memory Works. Available online at: https://www.pcper.com/reviews/Editorial/How-3D-XPoint-Phase-Change-Memory-Works
References
Adam, G., and Gibbs, J. H. (1965). On the temperature dependence of cooperative relaxation properties in glass-forming liquids. J. Chem. Phys. 43, 139–146. doi: 10.1063/1.1696442
Angell, A. (2000). “Glass formation and the nature of the glass transitions,” in Insulating and Semiconducting Glasses Series on Directions in Condensed Matter Physics, ed P. Boolchand (Singapore: World Scientific), 1–51. doi: 10.1142/9789812813619_0001
Angell, C. A. (1995). Formation of glasses from liquids and biopolymers. Science 267, 1924–1935. doi: 10.1126/science.267.5206.1924
Barré, J., Bishop, A. R., Lookman, T., and Saxena, A. (2005). Adaptability and “intermediate phase” in randomly connected networks. Phys. Rev. Lett. 94:208701. doi: 10.1103/PhysRevLett.94.208701
Bauchy, M. (2019). Deciphering the atomic genome of glasses by topological constraint theory and molecular dynamics: a review. Comput. Mater. Sci. 159, 95–102. doi: 10.1016/j.commatsci.2018.12.004
Bauchy, M., and Micoulaut, M. (2013). Structure of As2Se3 and AsSe network glasses: evidence for coordination defects and homopolar bonding. J. Non Crystal. Solids 377, 34–38. doi: 10.1016/j.jnoncrysol.2013.01.019
Bauchy, M., and Micoulaut, M. (2015). Densified network glasses and liquids with thermodynamically reversible and structurally adaptive behaviour. Nat. Commun. 6:6398. doi: 10.1038/ncomms7398
Bauchy, M., Micoulaut, M., Boero, M., and Massobrio, C. (2013). Compositional thresholds and anomalies in connection with stiffness transitions in network glasses. Phys. Rev. Lett. 110, 165501. doi: 10.1103/PhysRevLett.110.165501
Bauchy, M., Wang, M., Yu, Y., Wang, B., Krishnan, N. M. A., Masoero, E., et al. (2017). Topological control on the structural relaxation of atomic networks under stress. Phys. Rev. Lett. 119:035502. doi: 10.1103/PhysRevLett.119.035502
Becke, A. D. (1988). Density-functional exchange-energy approximation with correct asymptotic behavior. Phys. Rev. A 38:3098. doi: 10.1103/PhysRevA.38.3098
Bestul, A. B., and Chang, S. S. (1964). Excess entropy at glass transformation. J. Chem. Phys. 40, 3731–3733. doi: 10.1063/1.1725086
Bhosle, S., Gunasekera, K., Boolchand, P., and Micoulaut, M. (2012a). Melt homogenization and self-organization in chalcogenides-part I. Int. J. Appl. Glass Sci. 3, 189–204. doi: 10.1111/j.2041-1294.2012.00093.x
Bhosle, S., Gunasekera, K., Boolchand, P., and Micoulaut, M. (2012b). Melt homogenization and self-organization in chalcogenides-part II. Int. J. Appl. Glass Sci. 3, 205–220. doi: 10.1111/j.2041-1294.2012.00092.x
Bhosle, S., Gunasekera, K., Chen, P., Boolchand, P., Micoulaut, M., and Massobrio, C. (2011). Meeting experimental challenges to physics of network glasses: assessing the role of sample homogeneity. Solid State Commun. 151, 1851–1855. doi: 10.1016/j.ssc.2011.10.016
Böhmer, R., and Angell, C. A. (1992). Correlations of the nonexponentiality and state dependence of mechanical relaxations with bond connectivity in Ge-As-Se supercooled liquids. Phys. Rev. B 45, 10091–10094. doi: 10.1103/PhysRevB.45.10091
Boolchand, P. (1985). “Mossbauer spectroscopy–a rewarding probe of morphological structure of semiconducting glasses,” in Physical Properties of Amorphous Materials Institute for Amorphous Studies Series, eds D. Adler, B. Schwartz, and M. C. Steele (Springer). Available online at: https://www.springer.com/us/book/9780306419072 (accessed January 13, 2019). doi: 10.1007/978-1-4899-2260-1_7
Boolchand, P. (2000a). Insulating and Semiconducting Glasses. Singapore: World Scientific. doi: 10.1142/9789812813619
Boolchand, P. (2000b). The maximum in glass transition temperature Tg near x = 1/3 in GexSe1−x glasses. Asian J. Phys. 9, 709–721.
Boolchand, P., Bauchy, M., Micoulaut, M., and Yildirim, C. (2018). Topological phases of chalcogenide glasses encoded in the melt dynamics. Phys. Status Solidi 255:1800027. doi: 10.1002/pssb.201800027
Boolchand, P., and Bresser, W. J. (2000). The structural origin of broken chemical order in GeSe2 glass. Philos. Magazine B 80, 1757–1772. doi: 10.1080/13642810008216504
Boolchand, P., Bresser, W. J., and Suranyi, P. (1986). The molecular structure of As2Se3 glass. Hyperfine Interact. 27, 385–388. doi: 10.1007/BF02354787
Boolchand, P., Enzweiler, R. N., Cappelletti, R. L., Kamitakahara, W. A., Cai, Y., and Thorpe, M. F. (1990). Vibrational thresholds in covalent networks. Solid State Ionics 39, 81–89. doi: 10.1016/0167-2738(90)90029-Q
Boolchand, P., Georgiev, D. G., and Goodman, B. (2001). Discovery of the intermediate phase in chalcogenide glasses. J. Optoelectron. Adv. Mater. 3, 703–720.
Boolchand, P., Georgiev, D. G., Qu, T., Wang, F., Cai, L., and Chakravarty, S. (2002). Nanoscale phase separation effects near r = 2.4 and 2.67, and rigidity transitions in chalcogenide glasses. Comptes Rendus Chimie 5, 713–724. doi: 10.1016/S1631-0748(02)01440-6
Boolchand, P., and Goodman, B. (2017). Glassy materials with enhanced thermal stability. MRS Bull. 42, 23–28. doi: 10.1557/mrs.2016.300
Boolchand, P., Grothaus, J., Bresser, W. J., and Suranyi, P. (1982). Structural origin of broken chemical order in a GeSe2 glass. Phys. Rev. B 25, 2975–2978. doi: 10.1103/PhysRevB.25.2975
Boolchand, P., Mauro, J. C., and Phillips, J. C. (2013). A note on compacted networks. Phys. Today 66:10. doi: 10.1063/PT.3.1932
Borisova, Z. (1981). Glassy Semiconductors. Springer. Available online at: https://www.springer.com/us/book/9781475708530 (accessed April 4, 2019). doi: 10.1007/978-1-4757-0851-6
Bouzid, A., Massobrio, C., Boero, M., Ori, G., Sykina, K., and Furet, E. (2015). Role of the van der Waals interactions and impact of the exchange-correlation functional in determining the structure of glassy GeTe4. Phys. Rev. B 92:134208. doi: 10.1103/PhysRevB.92.134208
Bresser, W., Boolchand, P., and Suranyi, P. (1986). Rigidity percolation and molecular clustering in network glasses. Phys. Rev. Lett. 56, 2493–2496. doi: 10.1103/PhysRevLett.56.2493
Bresser, W. J., Boolchand, P., Suranyi, P., and de Neufville, J. P. (1981). Direct evidence for intrinsically broken chemical ordering in melt-quenched glasses. Phys. Rev. Lett. 46, 1689–1692. doi: 10.1103/PhysRevLett.46.1689
Bridenbaugh, P. M., Espinosa, G. P., Griffiths, J. E., Phillips, J. C., and Remeika, J. P. (1979). Microscopic origin of the companion A1 Raman line in glassy Ge(S,Se)2. Phys. Rev. B 20, 4140–4144. doi: 10.1103/PhysRevB.20.4140
Briley, A., and Pederson, M. R. (1998). Vibrational frequencies and intensities of small molecules: all-electron, pseudopotential, and mixed-potential methodologies. Phys. Rev. B Condensed Matter Mater. Phys. 58, 1786–1793. doi: 10.1103/PhysRevB.58.1786
Burgeat, J., le Roux, G., and Brenac, A. (1975). Sur une nouvelle forme cristalline de GeSe2. J. Appl. Crystallogr. 8, 325–327. doi: 10.1107/S0021889875010527
Car, R., and Parrinello, M. (1985). Unified approach for molecular dynamics and density-functional theory. Phys. Rev. Lett. 55, 2471–2474. doi: 10.1103/PhysRevLett.55.2471
Carpentier, L., Desprez, S., and Descamps, M. (2003). From strong to fragile glass- forming systems: a temperature modulated differential scanning calorimetry investigation. Phase Trans. 76, 787–799. doi: 10.1080/01411590310001603708
Chakraborty, S., and Boolchand, P. (2014). Topological origin of fragility, network adaptation, and rigidity and stress transitions in especially homogenized nonstoichiometric binary GeS glasses. J. Phys. Chem. B 118, 2249–2263. doi: 10.1021/jp411823j
Chen, P., Boolchand, P., and Georgiev, D. G. (2010). Long term aging of selenide glasses: evidence of sub-Tg endotherms and pre-Tg exotherms. J. Phys.-Condes. Matter 22:065104. doi: 10.1088/0953-8984/22/6/065104
Chen, Z., Wang, G., and Wang, X. (2019). Physical mechanism and response characteristics of unsaturated optical stopping-based amorphous arsenic sulfide thin-film waveguides. IEEE Photon. J. 11, 1–10. doi: 10.1109/JPHOT.2019.2894741
Chubynsky, M. V., Brière, M.-A., and Mousseau, N. (2006). Self-organization with equilibration: a model for the intermediate phase in rigidity percolation. Phys. Rev. E 74:016116. doi: 10.1103/PhysRevE.74.016116
Dash, S., Chen, P., and Boolchand, P. (2017). Molecular origin of aging of pure Se glass: growth of inter-chain structural correlations, network compaction, and partial ordering. J. Chem. Phys. 146:224506. doi: 10.1063/1.4983480
Debenedetti, P. G., and Stillinger, F. H. (2001). Supercooled liquids and the glass transition. Nature 410, 259–267. doi: 10.1038/35065704
Descamps, M., and Decroix, A. A. (2014). Polymorphism and disorder in caffeine: dielectric investigation of molecular mobilities. J. Mol. Struct. 1078, 165–173. doi: 10.1016/j.molstruc.2014.04.042
Eckert, H. (1989). Structural characterization of non-oxide chalcogenide glasses using solid state NMR. Angew. Chem. Int. Edn. English 28, 1723–1732. doi: 10.1002/anie.198917231
Fabian, R., and Sidebottom, D. L. (2009). Dynamic light scattering in network-forming sodium ultraphosphate liquids near the glass transition. Phys. Rev. B 80:064201. doi: 10.1103/PhysRevB.80.064201
Fjellvåg, H., Kongshaug, K. O., and Stølen, S. (2001). Crystal structure of Ge4Se9: a new germanium selenide with Se2 pairs breaking the edge-sharing GeSe4 tetrahedra in GeSe2. J. Chem. Soc. Dalton Trans. 1043–1045. doi: 10.1039/b009794m
Fulcher, G. (1925). Analysis of recent measurements of viscosity of glasses. J. Am. Ceram. Soc. 8, 339–355. doi: 10.1111/j.1151-2916.1925.tb16731.x
Georgiev, D. G., Boolchand, P., and Micoulaut, M. (2000). Rigidity transitions and molecular structure of AsxSe1−x glasses. Phys. Rev. B 62, R9228–R9231. doi: 10.1103/PhysRevB.62.R9228
Georgiev, D. G., Mitkova, M., Boolchand, P., Brunklaus, G., Eckert, H., and Micoulaut, M. (2001). Molecular structure, glass transition temperature variation, agglomeration theory, and network connectivity of binary P-Se glasses. Phys. Rev. B 64:134204. doi: 10.1103/PhysRevB.64.134204
Golovchak, R., Jain, H., Shpotyuk, O., Kozdras, A., Saiter, A., and Saiter, J.-M. (2008). Experimental verification of the reversibility window concept in binary As-Se glasses subjected to a long-term physical aging. Phys. Rev. B 78:014202. doi: 10.1103/PhysRevB.78.014202
Goncalves, C., Kang, M., Sohn, B.-U., Yin, G., Hu, J., Tan, D. T. H., et al. (2018). New candidate multicomponent chalcogenide glasses for supercontinuum generation. Appl. Sci. 8:2082. doi: 10.3390/app8112082
Gueguen, Y., Rouxel, T., Gadaud, P., Bernard, C., Keryvin, V., and Sangleboeuf, J.-C. (2011). High-temperature elasticity and viscosity of GexSe1−x glasses in the transition range. Phys. Rev. B 84:064201. doi: 10.1103/PhysRevB.84.064201
Gunasekera, K., Bhosle, S., Boolchand, P., and Micoulaut, M. (2013). Superstrong nature of covalently bonded glass-forming liquids at select compositions. J. Chem. Phys. 139:164511. doi: 10.1063/1.4826463
Guo, X., Mauro, J. C., Allan, D. C., and Yue, Y. (2012). On the frequency correction in temperature-modulated differential scanning calorimetry of the glass transition. J. Non Crystal. Solids 358, 1710–1715. doi: 10.1016/j.jnoncrysol.2012.05.006
Hodge, I. M. (1996). Strong and fragile liquids — a brief critique. J. Non Crystal. Solids 202, 164–172. doi: 10.1016/0022-3093(96)00151-2
Jackson, K., Briley, A., Grossman, S., Porezag, D. V., and Pederson, M. R. (1999). Raman-active modes of a - GeSe2 and a - GeS2: a first-principles study. Phys. Rev. B 60, R14985–R14989. doi: 10.1103/PhysRevB.60.R14985
Jackson, K., and Pederson, M. R. (1990). Accurate forces in a local-orbital approach to the local-density approximation. Phys. Rev. B 42, 3276–3281. doi: 10.1103/PhysRevB.42.3276
Jacobs, D. J., and Thorpe, M. F. (1995). Generic rigidity percolation: the pebble game. Phys. Rev. Lett. 75, 4051–4054. doi: 10.1103/PhysRevLett.75.4051
Kamitakahara, W. A., Cappelletti, R. L., Boolchand, P., Halfpap, B., Gompf, F., Neumann, D. A., et al. (1991). Vibrational densities of states and network rigidity in chalcogenide glasses. Phys. Rev. B 44, 94–100. doi: 10.1103/PhysRevB.44.94
Kim, C. S., and Boolchand, P. (1979). Chemical bonding in sulfur, selenium, and tellurium from 129I and 125Te Mössbauer investigations. Phys. Rev. B 19, 3187–3197. doi: 10.1103/PhysRevB.19.3187
Lee, C., Yang, W., and Parr, R. G. (1988). Development of the Colle-Salvetti correlation-energy formula into a functional of the electron density. Phys. Rev. B 37:785. doi: 10.1103/PhysRevB.37.785
Mantisi, B., Bauchy, M., and Micoulaut, M. (2015). Cycling through the glass transition: evidence for reversibility windows and dynamic anomalies. Phys. Rev. B 92:134201. doi: 10.1103/PhysRevB.92.134201
Massobrio, C., Micoulaut, M., and Salmon, P. S. (2010). Impact of the exchange-correlation functional on the structure of glassy GeSe2. Solid State Sci. 12, 199–203. doi: 10.1016/j.solidstatesciences.2009.11.016
Massobrio, C., Pasquarello, A., and Car, R. (1999). Intermediate range order and bonding character in disordered network-forming systems. J. Am. Chem. Soc. 121, 2943–2944. doi: 10.1021/ja9808447
Mauro, J. C., Yue, Y., Ellison, A. J., Gupta, P. K., and Allan, D. C. (2009). Viscosity of glass-forming liquids. PNAS 106, 19780–19784. doi: 10.1073/pnas.0911705106
Maxwell, J. C. (1864). L. On the calculation of the equilibrium and stiffness of frames. Philos. Magazine Ser. 4 27, 294–299. doi: 10.1080/14786446408643668
Micoulaut, M. (2010). Linking rigidity transitions with enthalpic changes at the glass transition and fragility: insight from a simple oscillator model. J. Phys. 22:285101. doi: 10.1088/0953-8984/22/28/285101
Micoulaut, M., Kachmar, A., Bauchy, M., Le Roux, S., Massobrio, C., and Boero, M. (2013). Structure, topology, rings, and vibrational and electronic properties of GexSe1−x glasses across the rigidity transition: a numerical study. Phys. Rev. B 88:054203. doi: 10.1103/PhysRevB.88.054203
Micoulaut, M., and Naumis, G. G. (1999). Glass transition temperature variation, cross-linking and structure in network glasses: a stochastic approach. EPL. 47:568. doi: 10.1209/epl/i1999-00427-7
Micoulaut, M., and Phillips, J. C. (2003). Rings and rigidity transitions in network glasses. Phys. Rev. B 67:104204. doi: 10.1103/PhysRevB.67.104204
Micoulaut, M., Vuilleumier, R., and Massobrio, C. (2009). Improved modeling of liquid GeSe2: Impact of the exchange-correlation functional. Phys. Rev. B 79:214205. doi: 10.1103/PhysRevB.79.214205
Mohanty, C. (2018). Direct evidence for topological phases in sodium phosphate glasses from raman scattering, infrared reflectance and modulated DSC (Unpublished master's thesis). University of Cincinnati, Cincinnati, OH, United States.
Mohanty, C., Mandal, A., Gogi, V. K., Chen, P., Novita, D., Chbeir, R., et al. (2019). Linking melt dynamics with topological phases and molecular structure of sodium phosphate glasses from calorimetry, raman scattering, and infrared reflectance. Front. Mater. 6, 1–20. doi: 10.3389/fmats.2019.00069
Moynihan, C. T., Easteal, A. J., Wilder, J., and Tucker, J. (1974). Dependence of the glass transition temperature on heating and cooling rate. J. Phys. Chem. 78, 2673–2677. doi: 10.1021/j100619a008
Murase, K., Fukunaga, T., Yakushiji, K., Yoshimi, T., and Yunoki, I. (1983). Investigation of stability of (Ge, Sn)-(S, or Se)42 cluster vibrational spectra. J. Non Crystal. Solids 59–60, 883–886. doi: 10.1016/0022-3093(83)90311-3
Naumis, G. G. (2005). Energy landscape and rigidity. Phys. Rev. E 71:026114. doi: 10.1103/PhysRevE.71.026114
Pederson, M. R., and Jackson, K. A. (1990). Variational mesh for quantum-mechanical simulations. Phys. Rev. B 41, 7453–7461. doi: 10.1103/PhysRevB.41.7453
Pederson, M. R., and Jackson, K. A. (1991). Pseudoenergies for simulations on metallic systems. Phys. Rev. B 43, 7312–7315. doi: 10.1103/PhysRevB.43.7312
Phillips, J. C. (1979). Topology of covalent non-crystalline solids I: short-range order in chalcogenide alloys. J. Non Crystal. Solids 34, 153–181. doi: 10.1016/0022-3093(79)90033-4
Phillips, J. C., Beevers, C. A., and Gould, S. E. B. (1980). Molecular structure of As2Se3 glass. Phys. Rev. B 21, 5724–5732. doi: 10.1103/PhysRevB.21.5724
Pignatelli, I., Kumar, A., Alizadeh, R., Pape, Y. L., Bauchy, M., and Sant, G. (2016). A dissolution-precipitation mechanism is at the origin of concrete creep in moist environments. J. Chem. Phys. 145:054701. doi: 10.1063/1.4955429
Porezag, D. (1997). Development of ab-initio and approximate density functional methods and their application to complex fullerene systems (Master's thesis). Chemnitz University of Technology, Chemnitz, Germany.
Porezag, D., and Pederson, M. R. (1996). Infrared intensities and Raman-scattering activities within density-functional theory. Phys. Rev. B. 54, 7830–7836. doi: 10.1103/PhysRevB.54.7830
Potuzak, M., Welch, R. C., and Mauro, J. C. (2011). Topological origin of stretched exponential relaxation in glass. J. Chem. Phys. 135:214502. doi: 10.1063/1.3664744
Qu, T. (2004). Non-Aging And Self-Organization In Network Glasses. Available online at: https://etd.ohiolink.edu/pg_10?0::NO:10:P10_ACCESSION_NUM:ucin1075233143 (accessed October 12, 2018).
Qu, T., Georgiev, D. G., Boolchand, P., and Micoulaut, M. (2002). The intermediate phase in ternary GexAsxSe1−2x glasses. MRS Online Proc. Library Arch. 754, CC8.1.1–12. doi: 10.1557/PROC-754-CC8.1
Quong, A. A., Pederson, M. R., and Feldman, J. L. (1993). First principles determination of the interatomic force-constant tensor of the fullerene molecule. Solid State Commun. 87, 535–539. doi: 10.1016/0038-1098(93)90591-A
Raoux, S., and Wuttig, M. (eds),. (2009). Phase Change Materials: Science and Applications. Springer. Available online at: https://www.springer.com/us/book/9780387848730 (accessed February 14, 2019). doi: 10.1007/978-0-387-84874-7
Ravindren, S. (2015). New Insights Into the Glass Structure and Melt Dynamics of Ge-As-Se Alloys: Topological Phases, Eutectic Effects, Slow Homogenization Of Melts And Nanoscale Phase Separation Effects. Available online at: https://etd.ohiolink.edu/pg_10?0::NO:10:P10_ACCESSION_NUM:ucin1427798415 (accessed April 4, 2019).
Ravindren, S., Gunasekera, K., Tucker, Z., Diebold, A., Boolchand, P., and Micoulaut, M. (2014). Crucial effect of melt homogenization on the fragility of non-stoichiometric chalcogenides. J. Chem. Phys. 140:134501. doi: 10.1063/1.4869107
Salmon, P. S. (2007). Structure of liquids and glasses in the Ge–Se binary system. J. Non Crystal. Solids 353, 2959–2974. doi: 10.1016/j.jnoncrysol.2007.05.152
Salmon, P. S., and Petri, I. (2003). Structure of glassy and liquid GeSe2. J. Phys. 15:S1509. doi: 10.1088/0953-8984/15/16/301
Selvanathan, D., Bresser, W. J., Boolchand, P., and Goodman, B. (1999). Thermally reversing window and stiffness transitions in chalcogenide glasses. Solid State Commun. 111, 619–624. doi: 10.1016/S0038-1098(99)00248-3
Sipp, A., and Richet, P. (2002). Equivalence of volume, enthalpy and viscosity relaxation kinetics in glass-forming silicate liquids. J. Non Crystal. Solids 298, 202–212. doi: 10.1016/S0022-3093(02)00948-1
Stølen, S., Grande, T., and Johnsen, H.-B. (2002). Fragility transition in GeSe2–Se liquids. Phys. Chem. Chem. Phys. 4, 3396–3399. doi: 10.1039/b201396g
Tammann, G., and Hesse, W. (1926). Die abhängigkeit der viscosität von der temperatur bei unterkühlten flüssigkeiten. Zeitschrift Für Anorganische Und Allgemeine Chemie 156, 245–257. doi: 10.1002/zaac.19261560121
Tang, S., Karpov, I. V., Dodge, R., Klehn, B., Kalb, J. A., Strand, J., et al. (2009). “A stackable cross point Phase Change Memory,” in 2009 IEEE International Electron Devices Meeting (Baltimore, MD: IEDM), 1–4.
Tang, Z., Furniss, D., Fay, M., Sakr, H., Sójka, L., Neate, N., et al. (2015). Mid-infrared photoluminescence in small-core fiber of praseodymium-ion doped selenide-based chalcogenide glass. Opt. Mater. Express OME 5, 870–886. doi: 10.1364/OME.5.000870
Tatsumisago, M., Halfpap, B. L., Green, J. L., Lindsay, S. M., and Angell, C. A. (1990). Fragility of Ge-As-Se glass-forming liquids in relation to rigidity percolation, and the Kauzmann paradox. Phys. Rev. Lett. 64, 1549–1552. doi: 10.1103/PhysRevLett.64.1549
Thorpe, M. F. (1983). Continuous deformations in random networks. J. Non Crystal. Solids 57, 355–370. doi: 10.1016/0022-3093(83)90424-6
Thorpe, M. F. (1985). Rigidity percolation in glassy structures. J. Non Crystal. Solids 76, 109–116. doi: 10.1016/0022-3093(85)90056-0
Thorpe, M. F., Jacobs, D. J., Chubynsky, M. V., and Phillips, J. C. (2000). Self-organization in network glasses. J. Non Crystal. Solids 266–269, 859–866. doi: 10.1016/S0022-3093(99)00856-X
Tremblay, J.-É., Malinowski, M., Richardson, K. A., Fathpour, S., and Wu, M. C. (2018). Picojoule-level octave-spanning supercontinuum generation in chalcogenide waveguides. Opt. Express OE 26, 21358–21363. doi: 10.1364/OE.26.021358
Vaills, Y., Qu, T., Micoulaut, M., Chaimbault, F., and Boolchand, P. (2005). Direct evidence of rigidity loss and self-organization in silicate glasses. J. Phys. 17, 4889–4896. doi: 10.1088/0953-8984/17/32/003
Vogel, H. (1921). The law of relation between the viscosity of liquids and the temperature. Zeitschrift für Physik 22, 645–646.
Wang, R. P., Smith, A., Prasad, A., Choi, D. Y., and Luther-Davies, B. (2009). Raman spectra of GexAsySe1–x–y glasses. J. Appl. Phys. 106:043520. doi: 10.1063/1.3204951
Williams, M. L., Landel, R. F., and Ferry, J. D. (1955). The temperature dependence of relaxation mechanisms in amorphous polymers and other glass-forming liquids. J. Am. Chem. Soc. 77, 3701–3707. doi: 10.1021/ja01619a008
Yan, L. (2018). Entropy favors heterogeneous structures of networks near the rigidity threshold. Nat. Commun. 9:1359. doi: 10.1038/s41467-018-03859-9
Yannopoulos, S. N., and Andrikopoulos, K. S. (2004). Raman scattering study on structural and dynamical features of noncrystalline selenium. J. Chem. Phys. 121, 4747–4758. doi: 10.1063/1.1780151
Yildirim, C., Raty, J.-Y., and Micoulaut, M. (2016a). Anomalous diffusion and non-monotonic relaxation processes in Ge-Se liquids. J. Chem. Phys. 144:224503. doi: 10.1063/1.4953077
Yildirim, C., Raty, J.-Y., and Micoulaut, M. (2016b). Revealing the role of molecular rigidity on the fragility evolution of glass-forming liquids. Nat. Commun. 7:11086. doi: 10.1038/ncomms11086
Yu, Y., Wang, M., Smedskjaer, M. M., Mauro, J. C., Sant, G., and Bauchy, M. (2017). Thermometer effect: origin of the mixed alkali effect in glass relaxation. Phys. Rev. Lett. 119:095501. doi: 10.1103/PhysRevLett.119.095501
Keywords: modulated DSC (MDSC), Raman scattering, topological constraint theory (TCT), molar volume, 129I Mössbauer spectroscopy, fragility index, enthalpy of relaxation at Tg, melt homogenization
Citation: Chbeir R, Bauchy M, Micoulaut M and Boolchand P (2019) Evidence for a Correlation of Melt Fragility Index With Topological Phases of Multicomponent Glasses. Front. Mater. 6:173. doi: 10.3389/fmats.2019.00173
Received: 09 April 2019; Accepted: 04 July 2019;
Published: 24 July 2019.
Edited by:
Joachim Deubener, Clausthal University of Technology, GermanyReviewed by:
Jean-Marc Delaye, Commissariat à l'Energie Atomique et aux Energies Alternatives (CEA), FranceSindy Fuhrmann, Friedrich Schiller University Jena, Germany
Copyright © 2019 Chbeir, Bauchy, Micoulaut and Boolchand. This is an open-access article distributed under the terms of the Creative Commons Attribution License (CC BY). The use, distribution or reproduction in other forums is permitted, provided the original author(s) and the copyright owner(s) are credited and that the original publication in this journal is cited, in accordance with accepted academic practice. No use, distribution or reproduction is permitted which does not comply with these terms.
*Correspondence: Punit Boolchand, boolchp@ucmail.uc.edu