Three-Dimensional Fe3O4@Reduced Graphene Oxide Heterojunctions for High-Performance Room-Temperature NO2 Sensors
 Cheng Zou1 Jing Hu2
  Yanjie Su1* Feng Shao1 Zejun Tao1 Tingting Huo1 Zhihua Zhou1 Nantao Hu1
  Zhi Yang1 Eric Siu-Wai Kong1 Yafei Zhang1*
- 1Key Laboratory of Thin Film and Microfabrication (Ministry of Education), Department of Micro/Nano Electronics, School of Electronics, Information and Electrical Engineering, Shanghai Jiao Tong University, Shanghai, China
- 2School of Chemistry, Biology and Materials Engineering, Research Center for Nanophotonic and Nanoelectronic Materials, Suzhou University of Science and Technology, Suzhou, China
Metal oxide/reduced graphene oxide (RGO) heterojunctions have been widely used to fabricate room-temperature gas sensors due to large specific surface areas of RGO nanosheets and enhanced carrier separation efficiency at the interface. However, the sheet stacking of RGO nanosheets limits the full utilization of metal oxide/RGO heterojunctions. Herein, we demonstrate a high-performance room-temperature NO2 gas sensor based on 3D Fe3O4@RGO p-n heterojunctions with a core-shell structure, which were synthesized by self-assembly method and further reduction. The effects of different Fe3O4/RGO ratios and the relative humidity on the sensing performances have been investigated. The experimental results suggest that the 3D Fe3O4@RGO sensor exhibits a good selectivity and high sensitivity of 183.1% for 50 ppm NO2, which is about 8.17 times higher than that of the pure 2D RGO sensor. When exposed to 50 ppb of NO2, the response value still reaches 17.8%. This enhanced sensing performance is mainly ascribed to the formed heterojunctions and the larger surface area of RGO nanosheets. This 2D to 3D heterostructure strategy provides a general route to fabricating ultrahigh-performance room-temperature RGO-based gas sensors.
Introduction
Toxic gases in the environment pose a severe threat to human health, which has drawn increasing attention in the past few years. Therefore, the detection of toxic gases has become increasingly important (Tyagi et al., 2017; Zhang et al., 2018; Wang et al., 2019a,b). Among common toxic gases, nitrogen dioxide (NO2) is a corrosive common toxic gas with physiological irritants, which mainly derives from automobile exhaust (Wetchakun et al., 2011). NO2 is an important factor of the formation of photochemical smog, and it also causes respiratory injury and lung damage to the human body (Kim et al., 2013). So far, multiple sensors have been presented to monitor NO2 gas (Patil et al., 2016), but the majority of them require operating at high temperatures, have poor sensitivity and contain harmful components. Hence, developing good-performance room-temperature gas sensors based on environmentally friendly materials to detect NO2 is for both human health and environmental protection. Recently, reduced graphene oxide (RGO) has attracted increasing attention in the field of gas sensors due to its regulable functional groups, extremely large specific surface area and good room-temperature conductivity, and it has been used as sensitive materials to detect NO2 at room temperature (Li et al., 2011; Huang et al., 2017a; Hu et al., 2017).
However, 2D RGO generally suffers from agglomeration and overlap during the reduction of GO (Compton and Nguyen, 2010), which may result in a poor sensing performance and long-term response/recovery time under ambient conditions. Recently, more attention has been paid to the 3D RGO (Huang et al., 2017b; Wu et al., 2017). Compared with the traditional 2D RGO, 3D RGO has larger surface areas, which can provide more active sites for adsorbing gas molecules and enhance the sensing performance (Wu et al., 2016).
One the other hand, the sensing performances of pure RGO nanosheets are still suppressed due to the recombination of charged carriers in the RGO channel (Hu et al., 2013; Lipatov et al., 2013). It has been proven that the formation of the heterostructures between RGO and metal oxide semiconductors can accelerate the charge separation at the interface and the transportation process, improving effectively the sensing performance (Zhang et al., 2014; Xia et al., 2016). Moreover, the combination of RGO with metal oxide semiconductors results in a synergistic effect on enhancing the sensing properties of the gas sensors. For example, Zhang et al. (2017) fabricated CuO/rGO isotype heterojunction by a layer-by-layer self-assembly method, which is competent in sub-ppb-level CO gas detection. Wan et al. (2015) synthesized hierarchical In(OH)3 modified graphene p-n heterojunction via a microwave-assisted hydrothermal method, which showed enhanced NO2 sensing performances and excellent selectivity. Song et al. (2016) prepared SnO2/rGO nanocomposites by a one-step colloidal synthesis strategy and reported accelerative electron transfer across SnO2/RGO interfaces, which contributed to ultrasensitive H2S gas detection. Among these types of metal oxide/RGO heterojunctions, the 2D heterostructures not only limit the number of adsorption sites for gas molecules but also reduce the interface area between metal oxide and RGO nanosheets, limiting the maximization of the sensing performance.
In this work, a high-performance room-temperature NO2 gas sensor has been demonstrated using unique 3D Fe3O4@RGO core-shell heterostructures, which were synthesized by a self-assembly method and further reduced by ascorbic acid. The effect of different Fe3O4/RGO ratios and the relative humidity on the sensing performances have been investigated. The experimental results show that the 3D Fe3O4@RGO sensor exhibits more prominent sensitivity and selectivity than that of pure RGO, which demonstrates tremendous potential for practical application.
Experimental
Preparation of Modified Fe3O4 Nanospheres
The Fe3O4 nanospheres were synthesized by a hydrothermal method, which has been reported elsewhere (Deng et al., 2005). The as-synthesized Fe3O4 nanospheres were collected and washed by ethanol and water, and then dried at room temperature for further modification. The modification was conducted by adding aminopropyltriethoxysilane (APTES) into the Fe3O4 suspension (Ebrahiminezhad et al., 2013). In a typical procedure, the as-obtained Fe3O4 nanospheres (100 mg) were dissolved in a mixed solution of 15 ml of distilled water and 15 ml of ethanol, followed by the addition of 1 ml of APTES. After stirring for 6 h at an oil bath temperature of 40°C, the as-obtained modified Fe3O4 nanospheres were precipitated magnetically and washed with water and ethanol iteratively to remove redundant APTES.
Preparation of 3D Fe3O4@GO Heterojunctions
Since GO itself is negatively charged and the APTES-modified Fe3O4 nanospheres are positively charged, the 3D Fe3O4@GO heterojunctions with core-shell structure were synthesized by an electrostatic self-assembly method. Firstly, the as-obtained APTES-modified Fe3O4 nanospheres were dispersed in ethanol (10 ml), followed by the addition of 3, 6, 10 and 30 ml of GO suspension (1 mg mL−1), respectively. The mixture was stirred at room temperature for 12 h and the products were collected and washed with ethanol and water repeatedly for later use. The as-obtained products with different mass ratios were denoted as 3wt%-Fe3O4@GO, 6wt%-Fe3O4@GO, 10wt%-Fe3O4@GO, and 30wt%-Fe3O4@GO, respectively.
Fabrication of Fe3O4@RGO Sensors
Firstly, 2 μL of 3D Fe3O4@GO (10 mg/mL) with different mass ratios were dropped onto the interdigital electrodes to obtain a sensing layer, respectively. Afterwards, the electrodes were soaked in 20 mL of 2.5 mg/mL ascorbic acid, to which an appropriate amount of aqueous ammonia was added to make the solution pH≥7. The reduction reaction lasted 6 h in an oil bath at 60°C and was then washed with water and ethanol. The as-obtained devices were denoted as 3wt%-Fe3O4@RGO, 6wt%-Fe3O4@RGO, 10wt%-Fe3O4@RGO, and 30wt%-Fe3O4@RGO, respectively. For comparison, bare RGO without Fe3O4 was prepared by the same reduction process.
Characterization
The morphologies of samples were characterized by a transmission electron microscopy (TEM, Tecnai-G20 of FEI, USA) operating at 200 kV and a field-emission scanning electron microscope (SEM, Ultra 55 of Carl Zeiss, Germany) operating at 5 kV. X-ray diffraction (XRD) tests were used to characterize the crystallographic structure of the as-synthesized samples at a diffraction angle ranging from 5 to 80° and a scan speed of 3°/min using Bruker D8 ADVANCE (Germany, Cu Kα, λ = 0.154184 nm) X-ray diffractometer. The thermal stability of the samples was measured by a thermogravimetric analyzer (Pyris 1, Perkin-Elmer, USA) under flowing air and with a heating rate of 5°C/min (from 50 to 800°C). Raman spectra were recorded using an inVia Reflex confocal Raman microscope (RENISHAW, England) with a laser wavelength of 633 nm. The X-ray photoelectron spectra (XPS) analysis was acquired using an Escalab 250Xi (Thermo Fisher Scientific) spectrometer with a monochromatic source (Al Kα). The specific surface area was determined by Brunauer-Emmett-Teller (BET) measurement (Micromeritics Tristar 3020, USA).
Gas Sensing Measurement
For the sensing measurement, the sensing device was fixed on a closed test chamber, followed by connection with a dynamic gas mixer system for signal collecting. A semiconductor parameter tester (Agilent 4156C) was used to monitor the sensing signal at a test voltage of 0.5 V. As reported in our previous work (Hu et al., 2017), a homemade gas mixer system was used to obtain different concentrations of NO2 gas, which diluted NO2 standard gas (5,000 ppm) with high-purity dry air. In addition, before testing or during the period of the recovery phase, high-purity dry air was also used for the balance of the adsorption-desorption on the sensing materials surface. Mass flow controllers (MFC, Beijing Qixing Co., Ltd, China) were used to adjust the flow ratio of gases. The NO2 and the air gas mixtures were imported into the testing chamber at a rate of 0.1 L min−1 for sensing performance measurement. All the tests were performed at room temperature. The sensing response value (S) is valued by the electrical current change at a test voltage of 0.5 V, which is defined according to the following equation:
where Ia is the initial electrical current of the sensing device in air, and Ig is the electrical current of the sensing device in the gas mixtures of NO2 and air. Response time and recovery time of the gas sensor are defined as the time which was required to achieve 90% of the total electrical current change.
Results and Discussion
Microstructure Characterizations
The morphologies of the as-prepared materials were observed by SEM and TEM. Figure 1a shows the SEM image of Fe3O4 with a relatively uniform spherical structure. Figures 1b–f displays the morphologies of as-prepared Fe3O4@GO with different mass ratios. It can be clearly observed that GO is coated on the Fe3O4 nanospheres, indicating successful preparation of the 3D core-shell structure of GO by the electrostatic self-assembly method. As the mass ratio of GO in Fe3O4@GO increases, the coated GO becomes thicker and more numerous. However, when the GO mass ratio reaches as high as 30%, GO is stacked on the Fe3O4 nanospheres due to the excessive amount of GO, as exhibited in Figure 1f. Therefore, a suitable material mass ratio is beneficial to the formation of 3D core-shell structure of Fe3O4@GO. Among them, 10wt%-Fe3O4@GO exhibits a uniform coverage of GO on Fe3O4 nanospheres, as shown in Figure 1d. Figure 1e shows an enlarged view of the green region in Figure 1d, which demonstrates the uniformity of GO coating and the successful fabrication of 3D core-shell structures more intuitively.
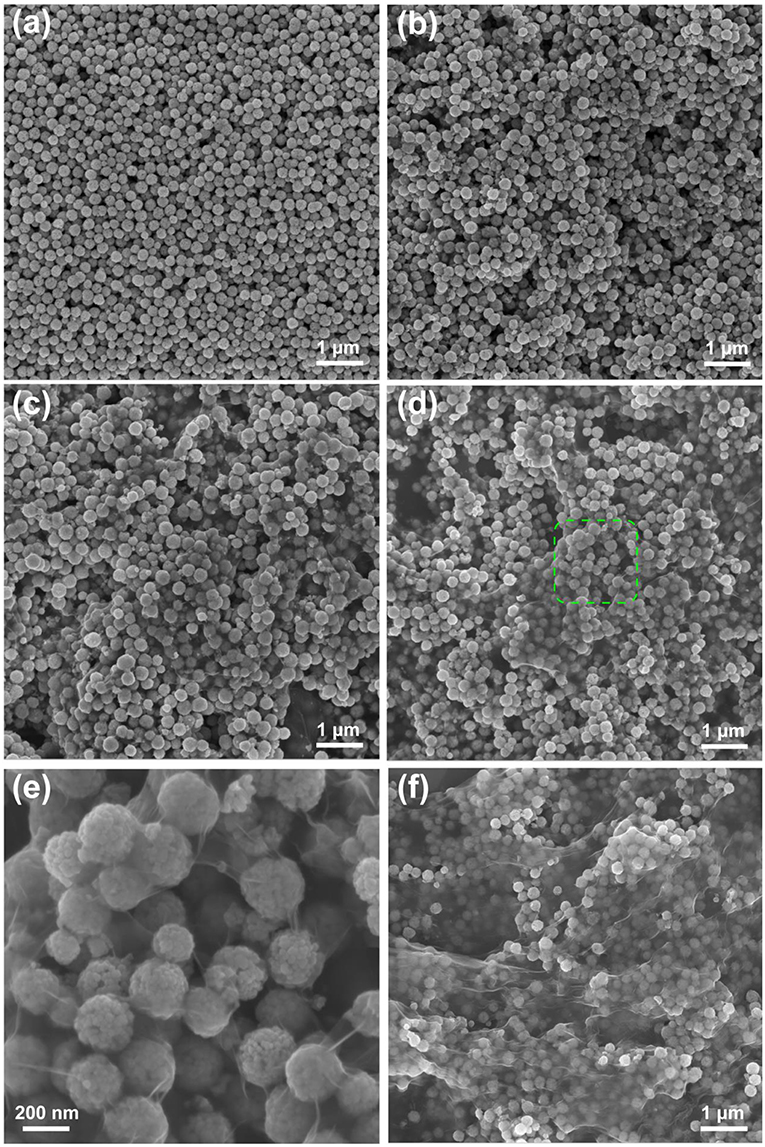
Figure 1. The SEM images of (a) pure Fe3O4, (b) 3wt%-Fe3O4@GO, (c) 6wt%-Fe3O4@GO, (d) 10wt%-Fe3O4@GO, (e) enlarged view of 10wt%-Fe3O4@GO, (f) 30wt%-Fe3O4@GO.
Figure 2 shows the SEM and TEM images of 10wt%-Fe3O4@RGO heterojunctions. The morphology of the RGO wrapped on the Fe3O4 nanospheres was maintained after the reduction process by ascorbic acid, indicating that this reduction method did not destroy the 3D core-shell structures of Fe3O4@RGO, as shown in Figure 2a (SEM image). TEM images of Fe3O4@RGO are shown in Figures 2b–d. The RGO nanosheets cladded on the Fe3O4 nanospheres cannot be observed so expressly because of the lack of electron contrast. However, the RGO junctions between Fe3O4 nanospheres demonstrate the electrostatic self-assembly contact between RGO nanosheets and Fe3O4 nanospheres. An enlarged view of Figure 2b is displayed in Figure 2c, where it can be clearly seen that RGO nanosheets are tightly attached to the surface of the Fe3O4 nanospheres. The 0.48 nm lattice fringe spacing in Figure 2d (HRTEM image) corresponds to the (111) crystal planes of Fe3O4 (Lu et al., 2009a).
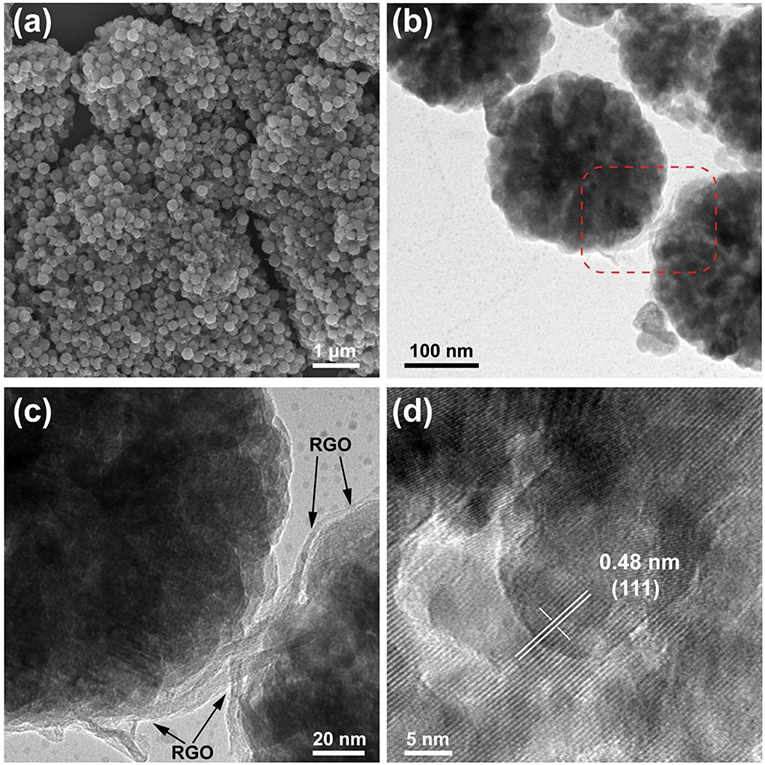
Figure 2. The SEM images of (a) 10wt%-Fe3O4@RGO,typical TEM images of (b) 10wt%-Fe3O4@RGO, (c) enlarged view of 10wt%-Fe3O4@RGO and (d) HRTEM image of 10wt%-Fe3O4@RGO.
XRD patterns and TGA curves of the as-prepared Fe3O4@RGO heterojunctions are illustrated in Figure 3 to confirm its crystallographic information and chemical composition. For XRD patterns in Figure 3A, the diffraction peaks of Fe3O4 are observed at 30.1, 35.4, 43.0, 57.0, and 62.6° which are assigned to the (220), (311), (400), (511), and (440) planes of Fe3O4 (JCPDS card 19-0629), respectively (Sun et al., 2009). The main XRD characteristic peaks for Fe3O4@GO and Fe3O4@RGO can be attributed to the inverse spinel structure of Fe3O4 (JCPDS card 19-0629). This is consistent with the results of TEM. However, the characteristic peaks of GO and RGO disappear in the patterns of the Fe3O4@GO and Fe3O4@RGO due to the relatively low contents.
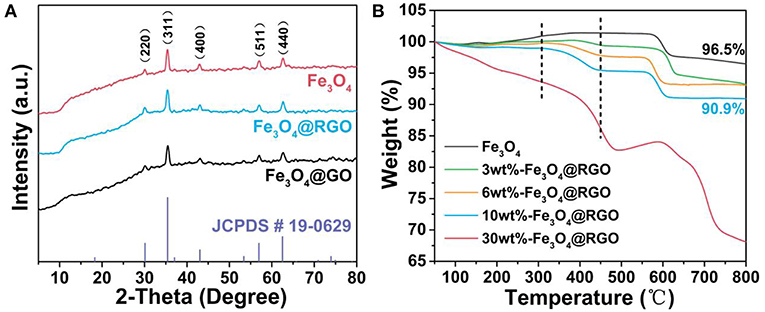
Figure 3. (A) XRD patterns of pure Fe3O4, 10wt%-Fe3O4@GO and 10wt%-Fe3O4@RGO, and the standard patterns of Fe3O4 phase (JCPDS card 19-0629). (B) TGA curves of pure Fe3O4 and the different material mass ratio of the Fe3O4@RGO.
TGA analysis was carried out to confirm the contents of RGO in the as-prepared Fe3O4@RGO heterojunctions, as exhibited in Figure 3B. For the Fe3O4 samples, the weight change can be segmented into three steps. The first stage of weight loss is occurring under 150°C, which is mainly ascribed to desorption of bond water on the surface of material. Subsequently, there is the formation of γ-Fe2O3 due to the oxidation process of Fe3O4 from 150 to 300°C, resulting in an increase in weight (Cao et al., 2008). Finally, the weight loss takes place again from 350–600°C, which can be ascribed to the phase conversion from γ-Fe2O3 to α-Fe2O3 (El Mendili et al., 2012). Notably, for the Fe3O4@RGO heterojunctions, the weight loss continues from about 300°C to about 450°C, which is attributed to the decomposition of RGO (Stankovich et al., 2007). Obviously, during the decomposition of RGO, there is more and more weight loss with the increase of the contents of RGO, indicating the successful preparation of different mass ratio of the Fe3O4@RGO. However, after the reduction process of GO, the weight of the RGO might be changed, resulting in a change in the mass ratio. For instance, the mass ratio of RGO in the 10wt%-Fe3O4@RGO is ~5.9% rather than 10%.
To characterize the surface areas of the as-prepared RGO and 10wt%-Fe3O4@RGO, nitrogen adsorption-desorption isotherm analysis was conducted (Figure S1). The BET surface area (34.5328 m2/g) of 10wt%-Fe3O4@RGO is larger than that of the RGO (2.7045 m2/g). The bare RGO has undergone heavy agglomeration in a large-scale preparation, resulting in its low BET surface area. In consideration of 10% content GO in Fe3O4@GO samples, the surface area is remarkably enhanced by forming 3D core-shell structures.
Raman spectra research was carried out to analyze graphene and its derivatives. Figure 4A shows the Raman spectra of Fe3O4@GO, Fe3O4@RGO and RGO. The D and G peaks of graphene are clearly observed in all curves. The peaks at about 660 cm−1 of Fe3O4@GO and Fe3O4@RGO can be attributed to the A1g mode of Fe3O4 (Sun et al., 2009). The appearance of the characteristic peaks of RGO and Fe3O4 indicates the successful modification of RGO on Fe3O4. The D band and G band of Fe3O4@RGO locate at 1324.9 cm−1 and 1595.9 cm−1, respectively, while that of RGO locates at 1327.1 cm−1 and 1601.1 cm−1, respectively (Liu et al., 2017), as shown in Figure 4B. The downshift of several wavenumbers indicates electron transfer from Fe3O4 nanospheres to 3D RGO, as illustrated in the literature (Rao et al., 2014; Hu et al., 2018b). This also confirms the formation of heterostructures between RGO and Fe3O4 in Fe3O4@RGO. In addition, the ID/IG value of Fe3O4@RGO (1.162) is higher than that of Fe3O4@GO (0.987), implying a decrease in the average size of the sp2 domain and an increase in domain numbers during the reduction process (Huang et al., 2017a). This in turn confirms the formation of Fe3O4@RGO by the reduction process of Fe3O4@GO.
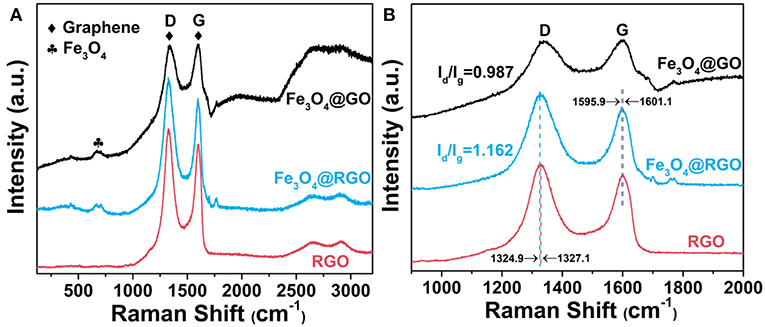
Figure 4. (A) Raman spectra and (B) enlarged Raman spectra of RGO, 10wt%-Fe3O4@GO and 10wt%-Fe3O4@RGO.
The surface structure of Fe3O4@RGO heterojunctions was further investigated by XPS technique. As shown in Figure 5A, the survey spectra identify the presence of Fe, C, N, and O elements in the Fe3O4@GO and Fe3O4@RGO. The existence of N 1s can be ascribed to the residual APTES left on the surface of Fe3O4 nanospheres. Figure 5B shows the Fe core level (Fe 2p) spectra of Fe3O4@RGO. The peaks at 708.6 eV and 716 eV correspond to the main peak and satellite peak of Fe2+ 2p3/2, respectively. The peaks at around 710.6 eV can be ascribed to the main peak of Fe3+ 2p3/2, while the peaks at around 724 eV are attributed to the main peak of Fe3+ 2p1/2. Additionally, the satellite peak of Fe3+ 2p3/2 appears at ~719 eV. All these results indicate the formation of Fe3O4 (Fujii et al., 1999). Figures 5C,D show the C 1s spectra of Fe3O4@GO and Fe3O4@RGO, these peaks can be grouped into four components: C-C/C=C (~284.6 eV), C-O (~285.8 eV), C=O (~286.8 eV), O-C=O (~288.4 eV) (Zhang et al., 2010; Zheng et al., 2018). It is apparent that the peak of the C=O tremendously decreases and that of C-C/C=C correspondingly increases after the reduction process, which indicates the successful reduction of the GO on the surface of Fe3O4 nanospheres.
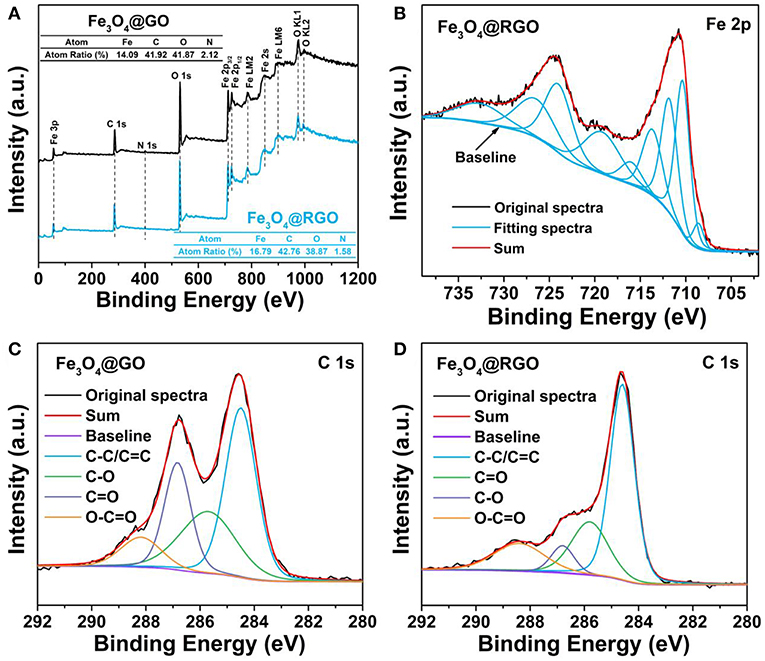
Figure 5. (A) XPS survey spectra of 10wt%-Fe3O4@GO and 10wt%-Fe3O4@RGO. (B) High resolution XPS spectrum of Fe 2p of 10wt%-Fe3O4@RGO. C 1s deconvoluted spectra of (C) 10wt%-Fe3O4@GO and (D) 10wt%-Fe3O4@RGO.
Gas Sensing Properties
The sensing performance of the Fe3O4@RGO heterojunctions was firstly investigated by monitoring their response to NO2 at room temperature. Figure 6A shows the single response curves of the devices toward 50 ppm NO2, and Figure S2 shows the resistance change of 10wt%-Fe3O4@RGO and pure RGO in this response process. When exposed to NO2, the continuous increase of current means that the resistance of the devices continues to decrease, indicating that RGO and Fe3O4@RGO exhibit the p-type semiconductor properties (Lu et al., 2009b). The response value in 1000 s for bare RGO, 3wt%-Fe3O4@RGO, 6wt%-Fe3O4@RGO, 10wt%-Fe3O4@RGO, and 30wt%-Fe3O4@RGO toward 50 ppm NO2 were 22.4, 39.5, 143.5, 183.1, and 165.1%, respectively. The greatly higher performance of Fe3O4@RGO heterojunctions than bare RGO could be ascribed to the optimized structures and the formed heterostructures. As shown in Figure 6B, the effect of the amount of RGO on the sensing performances was evaluated. As the amount of RGO increases, the response values increase initially and then decrease. 10wt%-Fe3O4@RGO possesses of the highest response value of 183.1%, which is 8.17 times higher than that of bare RGO. In consideration of the dramatic increases of the electrical current of the as-fabricated sensors in time of the initiatory detection period, an appropriate response time of 250 s was defined for the following tests.
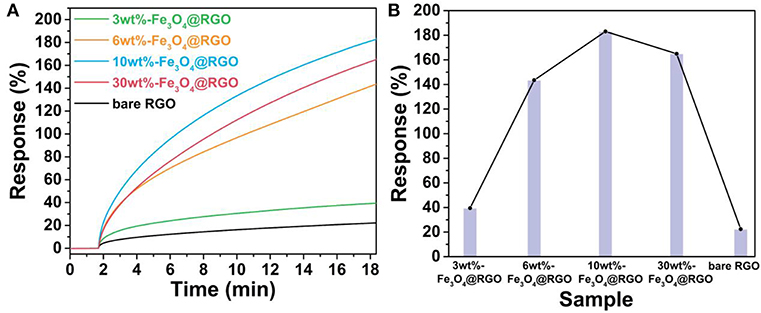
Figure 6. (A) Response curves and (B) comparison of response values of RGO and the different material mass ratio of the Fe3O4@RGO toward 50 ppm NO2.
Figure 7A shows the response-recovery curves of the 10wt%-Fe3O4@RGO upon successive exposure to NO2 concentrations ranging from 50 to 500 ppb and from 1 to 50 ppm at room temperature, respectively. It can be seen that the as-fabricated sensor exhibits a prominent response behavior over a wide range of NO2 concentrations. For example, the response value can still reach 17.8% when the as-fabricated sensor is exposed to 50 ppb of NO2, which indicates that the 10wt%-Fe3O4@RGO sensor has an excellent detecting ability toward NO2 with low concentration. It is interesting that the response value is linearly proportional to the concentration of NO2 in two stages, with the first stage being in the range of lower than 2 ppm and the other stage being from 5 to 50 ppm (Figure 7B). It is attributed to partial saturation at higher NO2 concentration, which causes the conductance response to diverge from linearity (Hu et al., 2017). The detection ability at lower concentration and the piecewise linear relationship between response values and NO2 concentrations both imply that the 10wt%-Fe3O4@RGO sensor is beneficial for practical application.
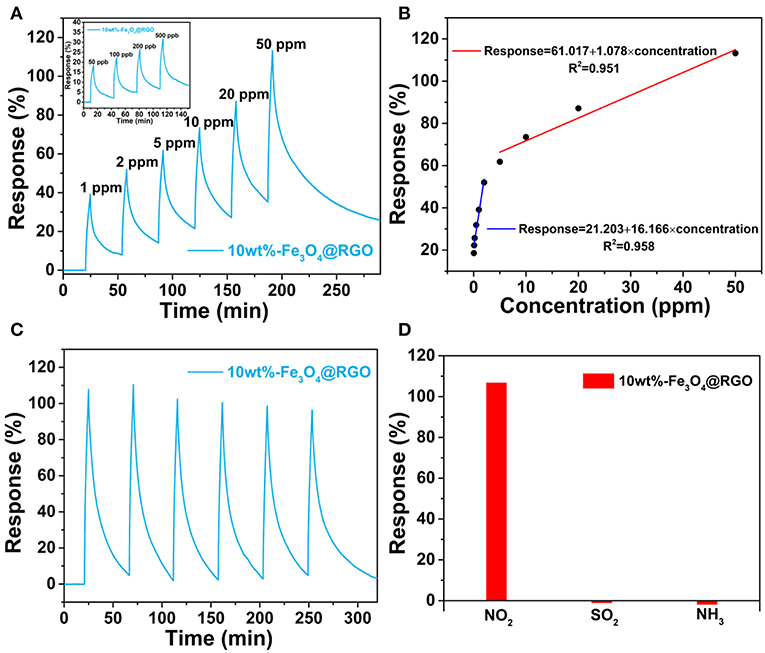
Figure 7. (A) Dynamic curves of 10wt%-Fe3O4@RGO to different NO2 concentrations. (B) Response variation of the 10wt%-Fe3O4@RGO sensor as a function of NO2 concentration. (C) Six successive sensing cycles of 10wt%-Fe3O4@RGO to 50 ppm NO2. (D) Selectivity of the as-fabricated sensor upon exposure to 50 ppm NO2, SO2 and NH3 gas.
To further evaluate the gas-sensing performance of 10wt%-Fe3O4@RGO heterojunctions, the curve of six sequential cycles of the as-fabricated sensor toward 50 ppm NO2 are recorded in Figure 7C, demonstrating an excellent reproducibility and cycle stability. Besides high sensitivity and good stability, gas sensors require selectivity for practical applications. From Figure 7D, it can be found that the 10wt%-Fe3O4@RGO sensor exhibits a prominent selectivity to NO2 gas among NH3, SO2, and NO2. When exposing the as-fabricated sensor to these gases with the same concentration (50 ppm) for 250 s, the 10wt%-Fe3O4@RGO sensor performs a 107% response to NO2, which is ~82 and ~51 times as much as the response to SO2 and NH3, respectively.
As a crucial factor of sensor properties, the influence of relative humidity (RH) is very important. In this work, the sensor device was exposed to varying levels of humidity, and the influence of humidity on sensing properties was investigated. Figure 8A shows the response-recovery curves of the 10wt%-Fe3O4@RGO sensor with different RHs (from 10 to 60% RH) at room temperature. The results suggest that the as-fabricated sensor shows a fast response-recovery to humidity. However, the response value is still low even if the RH reached 60%. Since the NO2 tests were carried out around 40% RH external environment, the as-fabricated sensor was repeatedly exposed to 40% RH. As shown in Figure S3, the 10wt%-Fe3O4@RGO sensor exhibited a stable response and fast recovery after six successive cycles, which indicates an excellent repeatability and cycle stability. Besides, rapid recovery means that the adsorbed water molecules can quickly desorb on the surface of the sensing materials. Hence, it can be concluded that humidity in the external environment has an acceptable impact on detecting NO2. That will be favorable for practical tests and providing credible signals. In addition, the effects of different RHs on NO2 detection (50 ppm) of the 10wt%-Fe3O4@RGO sensor at room temperature have also been studied, as shown in Figure 8B. The NO2 detection performance of the 10wt%-Fe3O4@RGO sensor gets worse as the RHs increases from 20 to 60%, which can be attributed to the consumption of NO2 molecules due to the reactions between NO2 and water vapor in moist air (Hu et al., 2018a). As the humidity increases, the sensing film is covered by water molecules, which decreases the sensing performance.
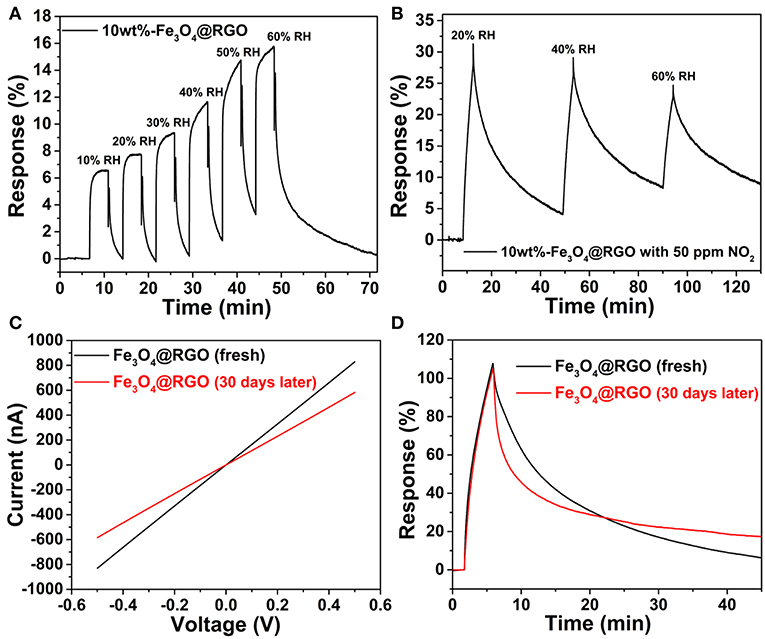
Figure 8. (A) Dynamic curves of 10wt%-Fe3O4@RGO to different relative humidity. (B) Response curve for 10wt%-Fe3O4@RGO sensor at different relative humidity for 50 ppm NO2. (C) I-V curves and (D) response-recovery curves toward 50 ppm NO2 of the fresh 10wt%-Fe3O4@RGO sensor and the sensor after 30 days of storage.
Long-term stability is also an important parameter in gas sensing. For the purpose of evaluating the stability of the Fe3O4@RGO gas sensor, the sensing device had been stored under ambient conditions for 1 month for testing. The current-voltage (I-V) curves are shown in Figure 8C, which demonstrates that the resistance of the sensing device increased from 0.602 to 0.856 MΩ. The sensing test results toward 50 ppm NO2 are shown in Figure 8D. It is noted that the response of the sensor did not decay after 1 month of storage. The only drawback is that the recovery capability became a little bit weaker, which may be ascribed to the effect of absorbed gas molecules in the air on the surface of the sensing material. In a word, the sensor based on Fe3O4@RGO exhibits an excellent stability.
Gas Sensing Mechanism
The enhancement of the NO2 sensing performances in 3D Fe3O4@RGO can be interpreted by the following aspects. Firstly, a possible surface electron depletion layer mechanism is used to explain the sensing mechanism, as shown in Scheme 1. As we know, Fe3O4 is a typical n-type semiconductor (Ai et al., 2010). When exposed to air, oxygen molecules contact the surface of the Fe3O4 and capture electrons from the semiconductor, producing chemisorbed oxygen species (O−, ) and causing a depletion layer on the surface of the Fe3O4 (Wagner et al., 2011; Hu et al., 2018b). Afterwards, when exposed to the oxidizing gases such as NO2, NO2 captures electrons from the surface electron depletion layer of the Fe3O4 and also reacts with to form ; the equations are as follows (Hu et al., 2017, 2018b):
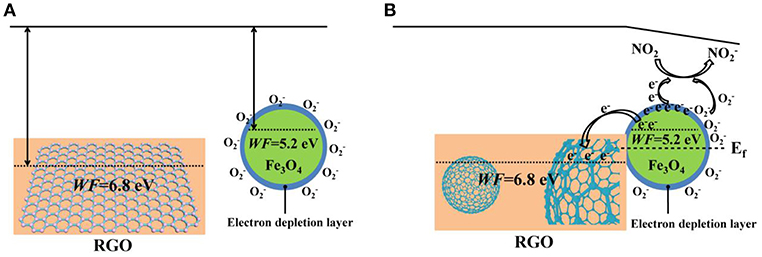
Scheme 1. (A) The schematic energy band structure of RGO and Fe3O4@RGO before forming the heterojunction state. (B) Schematic illustration of band bending, electron transfer process and NO2-sensing mechanism of the Fe3O4@RGO after constructing the heterostructure.
The process leads to a decrease in the number of electrons in the semiconductor (n-type), resulting in a decrease in electrical conductivity. On the contrary, for a p-type semiconductor such as RGO and the as-prepared Fe3O4@RGO, since their main carriers are holes rather than electrons, this process leads to an increase in electrical conductivity. When exposed to the reducing gas such as NH3, the electron of the adsorbed electron-donated NH3 is transferred to the p-type Fe3O4@RGO, which reduces the concentration of hole carriers, resulting in a decreased conductivity of the device (Huang et al., 2017b). The good selectivity for NO2 gas can be interpreted as follows: As a small-sized polar molecule with lone pair electrons and high affinity, NO2 can undergo fierce electron exchange with Fe3O4@RGO (Shaik et al., 2016). Hence, it is very easy for NO2 to capture electrons from p-type Fe3O4@RGO. This results in the formation of a large number of holes, which significantly changes the conductance of the device. Additionally, due to the presence of the Fe3O4@RGO heterojunctions, NO2 can adsorb selectively and react easily with the generated oxygen species (Hu et al., 2017).
The gas-sensing response enhancement brought by the 3D Fe3O4@RGO core-shell structures can be attributed to the well-known p-n heterojunction effect. According to the previous report, RGO has a work function (WF) of 6.8 eV (Kumar et al., 2013), which contains only carboxyl groups and has an oxygen content of 20%. In this work, it can be seen from the results of XPS that the oxygen content in RGO is approximately 27.8%. The work function of Fe3O4 is about 5.2 eV (Fonin et al., 2005), which is lower than that of RGO. When Fe3O4 and RGO are in contact with each other, a p-n junction is formed at the interface of Fe3O4 and RGO, and electrons are transferred from Fe3O4 to RGO until the Fermi level (Ef) reaches equilibrium, forming a built-in electric field (space charge region). When the Fe3O4@RGO heterojunctions are exposed to electron-withdrawing NO2, the electron concentration of Fe3O4 is lowered, and a large amount of holes are generated. These holes are rapidly transferred to RGO by the built-in electric field, which further enhances the electrical conductivity of the Fe3O4@RGO. It can be summarized that the formed heterojunctions promote the carrier transfer and further enhance the gas sensing properties (Miller et al., 2014; Song et al., 2016). Meanwhile, the high carrier mobility characteristics of RGO provide smooth and fast channels for carrier transport, which facilitates fast response of the sensor (Li et al., 2011; Feng et al., 2013).
In addition to the p-n junction, the 3D core-shell structure also plays a role in boosting the sensing properties of the Fe3O4@RGO heterojunctions. The 3D Fe3O4@RGO heterostructures prevent agglomeration during the reduction of RGO and can provide more adsorption sites than 2D RGO due to the larger surface area (Song et al., 2016; Huang et al., 2017a). The synergistic effect of Fe3O4 and RGO is also one of the reasons for promoting sensing performances. Therefore, these factors work together to have effects on the electrical properties at the interface of the 3D Fe3O4@RGO heterojunctions, dramatically improving the sensing performance.
Conclusion
Unique 3D Fe3O4@RGO core-shell heterostructures have been synthesized by self-assembly and further reduction, which can be used to fabricate high-performance room-temperature NO2 gas sensors. We have investigated the effect of different Fe3O4/RGO ratios and relative humidity on the sensing performances. The sensor based on 3D Fe3O4@RGO p-n heterojunctions exhibits a high sensitivity of 183.1% for 50 ppm NO2 at room temperature, which is about 8.17 times higher than that of the pure 2D RGO sensor. The as-formed heterojunctions and the larger surface area of RGO nanosheets with 3D structures are considered to play a key role in enhancing the sensing performance. We believe that this 2D to 3D core-shell heterostructures strategy enables us to enhance the sensing performance room-temperature RGO-based gas sensors.
Data Availability
All datasets generated for this study are included in the manuscript/Supplementary Files.
Author Contributions
CZ and YS contributed to all the experimental work. JH and FS analyzed the data. EK and NH contributed to the synthesis of Fe3O4@GO. ZZ and ZT contributed to the synthesis of Fe3O4@RGO. TH and ZY contributed to the characterization of device performance. YS and YZ designed and directed the study. CZ and YS wrote the manuscript. All authors reviewed the paper.
Funding
This work was supported by National Natural Science Foundation of China (No. 51402190) and Shanghai Natural Science Foundation (No. 19ZR1426900). The authors also acknowledge the analysis support from the Center for Advanced Electronic Materials and Devices of Shanghai Jiao Tong University.
Conflict of Interest Statement
The authors declare that the research was conducted in the absence of any commercial or financial relationships that could be construed as a potential conflict of interest.
Acknowledgments
We also acknowledge the analysis support from the Instrumental Analysis Center of Shanghai Jiao Tong University and the Center for Advanced Electronic Materials and Devices of Shanghai Jiao Tong University.
Supplementary Material
The Supplementary Material for this article can be found online at: https://www.frontiersin.org/articles/10.3389/fmats.2019.00195/full#supplementary-material
References
Ai, Z., Deng, K., Wan, Q., Zhang, L., and Lee, S. (2010). Facile microwave-assisted synthesis and magnetic and gas sensing properties of Fe3O4 nanoroses. J. Phy. Chem. C 114, 6237–6242. doi: 10.1021/jp910514f
Cao, S.-W., Zhu, Y. J., Ma, M.-Y., Li, L., and Zhang, L. (2008). Hierarchically nanostructured magnetic hollow spheres of Fe3O4 and γ-Fe2O3: preparation and potential application in drug delivery. J. Phy. Chem. C. 112, 1851–1856. doi: 10.1021/jp077468+
Compton, O. C., and Nguyen, S. T. (2010). Graphene oxide, highly reduced graphene oxide, and graphene: versatile building blocks for carbon-based materials. Small 6, 711–723. doi: 10.1002/smll.200901934
Deng, H., Li, X., Peng, Q., Wang, X., Chen, J., and Li, Y. (2005). Monodisperse magnetic single-crystal ferrite microspheres. Angew. Chem. 117, 2842–2845. doi: 10.1002/ange.200462551
Ebrahiminezhad, A., Ghasemi, Y., Rasoul-Amini, S., Barar, J., and Davaran, S. (2013). Preparation of novel magnetic fluorescent nanoparticles using amino acids. Coll. Surf. B Biointerf. 102, 534–539. doi: 10.1016/j.colsurfb.2012.08.046
El Mendili, Y., Bardeau, J.-F., Randrianantoandro, N., Grasset, F., and Greneche, J.-M. (2012). Insights into the mechanism related to the phase transition from γ-Fe2O3 to α-Fe2O3 nanoparticles induced by thermal treatment and laser irradiation. J. Phy. Chem. C 116, 23785–23792. doi: 10.1021/jp308418x
Feng, H., Cheng, R., Zhao, X., Duan, X., and Li, J. (2013). A low-temperature method to produce highly reduced graphene oxide. Nat. Commun. 4:1539. doi: 10.1038/ncomms2848
Fonin, M., Pentcheva, R., Dedkov, Y. S., Sperlich, M., Vyalikh, D. V., Scheffler, M., et al. (2005). Surface electronic structure of the Fe3O4 (100): Evidence of a half-metal to metal transition. Phys. Rev. B 72:104436. doi: 10.1103/PhysRevB.72.104436
Fujii, T., de Groot, F. M. F., Sawatzky, G. A., Voogt, F. C., Hibma, T., and Okada, K. (1999). In situ XPS analysis of various iron oxide films grown by NO2-assisted molecular-beam epitaxy, Phy. Rev. B 59, 3195–3202. doi: 10.1103/PhysRevB.59.3195
Hu, J., Zou, C., Su, Y., Li, M., Han, Y., Kong, E. S.-W., et al. (2018a). An ultrasensitive NO2 gas sensor based on a hierarchical Cu2O/CuO mesocrystal nanoflower. J. Mater. Chem. A 6, 17120–17131. doi: 10.1039/C8TA04404J
Hu, J., Zou, C., Su, Y., Li, M., Hu, N., Ni, H., et al. (2017). Enhanced NO2 sensing performance of reduced graphene oxide by in situ anchoring carbon dots. J. Mater. Chem. C 5, 6862–6871. doi: 10.1039/C7TC01208J
Hu, J., Zou, C., Su, Y., Li, M., Ye, X., Cai, B., et al. (2018b). Light-assisted recovery for a highly-sensitive NO2 sensor based on RGO-CeO2 hybrids. Sens Actuat. B Chem. 270, 119–129. doi: 10.1016/j.snb.2018.05.027
Hu, N., Yang, Z., Wang, Y., Zhang, L., Wang, Y., Huang, X., et al. (2013). Ultrafast and sensitive room temperature NH3 gas sensors based on chemically reduced graphene oxide, Nanotechnology 25:025502. doi: 10.1088/0957-4484/25/2/025502
Huang, D., Li, X., Wang, S., He, G., Jiang, W., Hu, J., et al. (2017a). Three-dimensional chemically reduced graphene oxide templated by silica spheres for ammonia sensing. Sens. Actuat. B Chem. 252, 956–964. doi: 10.1016/j.snb.2017.05.117
Huang, D., Yang, Z., Li, X., Zhang, L., Hu, J., Su, Y., et al. (2017b). Three-dimensional conductive networks based on stacked SiO2@graphene frameworks for enhanced gas sensing, Nanoscale 9, 109–118. doi: 10.1039/C6NR06465E
Kim, K.-H., Jahan, S. A., and Kabir, E. (2013). A review on human health perspective of air pollution with respect to allergies and asthma. Environ. Int. 59, 41–52. doi: 10.1016/j.envint.2013.05.007
Kumar, P. V., Bernardi, M., and Grossman, J. C. (2013). The impact of functionalization on the stability, work function, and photoluminescence of reduced graphene oxide. ACS Nano 7, 1638–1645. doi: 10.1021/nn305507p
Li, W., Geng, X., Guo, Y., Rong, J., Gong, Y., Wu, L., et al. (2011). Reduced graphene oxide electrically contacted graphene sensor for highly sensitive nitric oxide detection. ACS Nano. 5, 6955–6961. doi: 10.1021/nn201433r
Lipatov, A., Varezhnikov, A., Wilson, P., Sysoev, V., Kolmakov, A., and Sinitskii, A. (2013). Highly selective gas sensor arrays based on thermally reduced graphene oxide. Nanoscale 5, 5426–5434. doi: 10.1039/c3nr00747b
Liu, J., Zhao, Y.Z., Li, X., Wang, C., Zeng, Y., Yue, G., et al. (2017). CuCr2O4@rGO nanocomposites as high-performance cathode catalyst for rechargeable lithium-oxygen batteries. Nano-Micro Lett. 10:22. doi: 10.1007/s40820-017-0175-z
Lu, G., Ocola, L. E., and Chen, J. (2009b). Gas detection using low-temperature reduced graphene oxide sheets. Appl. Phys. Lett. 94, 083111. doi: 10.1063/1.3086896
Lu, J., Jiao, X., Chen, D., and Li, W. (2009a). Solvothermal synthesis and characterization of Fe3O4 and γ-Fe2O3 nanoplates. J. Phy. Chem. C 113, 4012–4017. doi: 10.1021/jp810583e
Miller, D. R., Akbar, S. A., and Morris, P. A. (2014). Nanoscale metal oxide-based heterojunctions for gas sensing: a review. Sens. Actuat. B Chem. 204, 250–272. doi: 10.1016/j.snb.2014.07.074
Patil, V. L., Vanalakar, S. A., Kamble, A. S., Shendage, S. S., Kim, J. H., and Patil, P. S. (2016). Farming of maize-like zinc oxide via a modified SILAR technique as a selective and sensitive nitrogen dioxide gas sensor. RSC Adv. 6, 90916–90922. doi: 10.1039/C6RA06346B
Rao, R., Pierce, N., and Dasgupta, A. (2014). On the charge transfer between single-walled carbon nanotubes and graphene. Appl. Phys. Lett. 105:073115. doi: 10.1063/1.4893698
Shaik, M., Rao, V. K., Gupta, M., Murthy, K. S. R. C., and Jain, R. (2016). Chemiresistive gas sensor for the sensitive detection of nitrogen dioxide based on nitrogen doped graphene nanosheets. RSC Adv. 6, 1527–1534. doi: 10.1039/C5RA21184K
Song, Z., Wei, Z., Wang, B., Luo, Z., Xu, S., Zhang, W., et al. (2016). Sensitive room-temperature H2S gas sensors employing SnO2 quantum wire/reduced graphene oxide nanocomposites. Chem. Mater. 28, 1205–1212. doi: 10.1021/acs.chemmater.5b04850
Stankovich, S., Dikin, D. A., Piner, R. D., Kohlhaas, K. A., Kleinhammes, A., Jia, Y., et al. (2007). Synthesis of graphene-based nanosheets via chemical reduction of exfoliated graphite oxide. Carbon 45, 1558–1565. doi: 10.1016/j.carbon.2007.02.034
Sun, X., Zheng, C., Zhang, F., Yang, Y., Wu, G., Yu, A., et al. (2009). Size-controlled synthesis of magnetite (Fe3O4) nanoparticles coated with glucose and gluconic acid from a single Fe(III) precursor by a sucrose bifunctional hydrothermal method. J. Phy. Chem. C. 113, 16002–16008. doi: 10.1021/jp9038682
Tyagi, P., Sharma, A., Tomar, M., and Gupta, V. (2017). A comparative study of RGO-SnO2 and MWCNT-SnO2 nanocomposites based SO2 gas sensors. Sens. Actuators B Chem. 248, 980–986. doi: 10.1016/j.snb.2017.02.147
Wagner, T., Hennemann, J., Kohl, C. D., and Tiemann, M. (2011). Photocatalytic ozone sensor based on mesoporous indium oxide: Influence of the relative humidity on the sensing performance. Thin Solid Films 520, 918–921. doi: 10.1016/j.tsf.2011.04.181
Wan, P., Yang, W., Wang, X., Hu, J., and Zhang, H. (2015). Reduced graphene oxide modified with hierarchical flower-like In(OH)3 for NO2 room-temperature sensing. Sens. Actuat. B Chem. 214, 36–42. doi: 10.1016/j.snb.2015.02.100
Wang, K., Li, J., Li, W., Wei, W., Zhang, H., and Wang, L. (2019b). Highly active Co-based catalyst in nanofiber matrix as advanced sensing layer for high selectivity of flexible sensing device. Adv. Mater. Technol. 4:1800521. doi: 10.1002/admt.201800521
Wang, L., Chen, S., Li, W., Wang, K., Lou, Z., and Shen, G. (2019a). Grain-boundary-induced drastic sensing performance enhancement of polycrystalline-microwire printed gas sensors. Adv. Mater. 31:1804583. doi: 10.1002/adma.201804583
Wetchakun, K., Samerjai, T., Tamaekong, N., Liewhiran, C., Siriwong, C., Kruefu, V., et al. (2011). Semiconducting metal oxides as sensors for environmentally hazardous gases. Sens Actuat. B Chem. 160, 580–591. doi: 10.1016/j.snb.2011.08.032
Wu, J., Tao, K., Guo, Y., Li, Z., Wang, X., Luo, Z., et al. (2017). A 3D chemically modified graphene hydrogel for fast, highly sensitive, and selective gas sensor. Adv. Sci. 4:1600319. doi: 10.1002/advs.201600319
Wu, J., Tao, K., Zhang, J., Guo, Y., Miao, J., and Norford, L. K. (2016). Chemically functionalized 3D graphene hydrogel for high performance gas sensing. J. Mater. Chem. A. 4, 8130–8140. doi: 10.1039/C6TA01426G
Xia, Y., Wang, J., Xu, J.-L., Li, X., Xie, D., Xiang, L., et al. (2016). Confined formation of ultrathin ZnO nanorods/reduced graphene oxide mesoporous nanocomposites for high-performance room-temperature NO2 sensors. ACS Appl. Mater. Inter. 8, 35454–35463. doi: 10.1021/acsami.6b12501
Zhang, D., Jiang, C., Liu, J., and Cao, Y. (2017). Carbon monoxide gas sensing at room temperature using copper oxide-decorated graphene hybrid nanocomposite prepared by layer-by-layer self-assembly. Sens. Actuat. B Chem. 247, 875–882. doi: 10.1016/j.snb.2017.03.108
Zhang, H., Feng, J., Fei, T., Liu, S., and Zhang, T. (2014). SnO2 nanoparticles-reduced graphene oxide nanocomposites for NO2 sensing at low operating temperature. Sens. Actuat. B Chem. 190, 472–478. doi: 10.1016/j.snb.2013.08.067
Zhang, J., Yang, H., Shen, G., Cheng, P., Zhang, J., and Guo, S. (2010). Reduction of graphene oxide vial-ascorbic acid. Chem. Commun. 46, 1112–1114. doi: 10.1039/B917705A
Zhang, Z., Haq, M., Wen, Z., Ye, Z., and Zhu, L. (2018). Ultrasensitive ppb-level NO2 gas sensor based on WO3 hollow nanosphers doped with Fe. Appl. Surf. Sci. 434, 891–897. doi: 10.1016/j.apsusc.2017.10.074
Keywords: Fe3O4@RGO heterojuntions, NO2 sensor, electrostatic self-assembly method, heterostructures, three-dimensional core-shell structure
Citation: Zou C, Hu J, Su Y, Shao F, Tao Z, Huo T, Zhou Z, Hu N, Yang Z, Kong ES-W and Zhang Y (2019) Three-Dimensional Fe3O4@Reduced Graphene Oxide Heterojunctions for High-Performance Room-Temperature NO2 Sensors. Front. Mater. 6:195. doi: 10.3389/fmats.2019.00195
Received: 24 May 2019; Accepted: 29 July 2019;
Published: 20 August 2019.
Edited by:
Xiaogan Li, Dalian University of Technology (DUT), ChinaReviewed by:
Qiuxia Feng, Dalian Neusoft University of Information, ChinaLili Wang, Jilin University, China
Copyright © 2019 Zou, Hu, Su, Shao, Tao, Huo, Zhou, Hu, Yang, Kong and Zhang. This is an open-access article distributed under the terms of the Creative Commons Attribution License (CC BY). The use, distribution or reproduction in other forums is permitted, provided the original author(s) and the copyright owner(s) are credited and that the original publication in this journal is cited, in accordance with accepted academic practice. No use, distribution or reproduction is permitted which does not comply with these terms.
*Correspondence: Yanjie Su, yanjiesu@sjtu.edu.cn; Yafei Zhang, yfzhang@sjtu.edu.cn