Comparison of Electrical Conductivity in Compounds of Carbon Black With Natural and Butadiene Rubbers
 Erol Sancaktar1*
  Satilmis Basan2
- 1Department of Polymer Engineering, University of Akron, Akron, OH, United States
- 2Department of Chemical Engineering, Hittite University, Corum, Turkey
Carbon black (CB) filled butadiene (BR) (Cis-1,4-polybutadiene) and natural (NR) (Cis-1,4-polyisoprene) rubber compounds containing CB in 60–100 per hundred (phr) proportions were investigated for their pressure/time-dependent electrical conductivity. Due to their high deformability, the percolation thresholds for CB–BR and CB-NR compounds were functions of pressures (compression loads) applied. Resistivity of such compounds decreased with time and compressive load levels. Storage moduli, G', as well as the loss moduli, G” and the dynamic viscosities, η* of the compounds were evaluated to assess viscoelastic response of the compounds' conductivities under pressure. The storage and loss moduli values for both the CB-BR and the CB-NR compounds decreased with increasing strain levels, indicating that the rate of increase in conductivity is expected to increase at higher compressive loads. The storage moduli increased with increasing frequency (rate), indicating that the rate of increase in conductivity should be lower at higher rates of compressive load application. Comparison of variations in conductivity between the CB–BR and CB-NR compounds as functions of time and pressure, however, revealed that, overall, the conductivity levels are also strongly dependent on the nature of the molecular structure of these rubber materials and their initial interactions with CB during compounding, and the resulting dispersion levels of CB. Once such dispersion structure is established, the overall difference in conductivity levels for the CB–BR and CB-NR compounds remain approximately unchanged for given time and pressure conditions for the cases where high CB fill levels (~90 phr) are used and asymptotic conductivity values are reached. The experimental results revealed that because of the presence of higher number (~2-fold) of hydrogen side atoms on the linear BR chains, CB–BR compound forms more physical crosslinks (mostly due to hydrogen bonding) in comparison to the CB-NR compound resulting in more effective CB dispersion and higher conductivity. Such higher efficiency in CB dispersion and percolation in BR is further implied by higher conductivities despite higher G' and η* values for the CB–BR compound in comparison to the CB-NR compound.
Introduction
Electrically conducting fillers are commonly used to induce conductivity in polymer-based composites, if added above their percolation threshold to form interconnected particle network. The percolation phenomenon is well-known and typically illustrated by either local inflection or terminal asymptotes in decreasing variation of resistivity. Sancaktar and Wei (1996); Wei and Sancaktar (1996); Sancaktar and Dilsiz (1999a,b), and Sancaktar and Bai (2011) reported on electrically conductive adhesives as a subset of polymer-based conductive composites. Sancaktar and Wei (Sancaktar and Wei, 1996; Wei and Sancaktar, 1996) developed a model for evaluating the relation between contact pressure and conductivity. This model used Holm's contact resistance theory (Holm, 1967) with conductive spherical powder fillers. The interparticle contact resistance among these fillers was modeled by adding the constriction resistance based on Hertz's contact stress equation (Timoshenko and Goodier, 1970) to the tunneling resistance. Experimental data by Sancaktar and Wei (1996) proved that powders' electrical resistance was dependent on the pressure applied on them. Applicability of Hertz's theory in their work proved that fillers' material properties, as well as their shape and size should also affect the constriction resistance. The tunneling resistance, however, is affected by presence of non-contact space as well as oxide layer on particle surfaces. The non-contact space is expected to decrease due to the deformations at particle contact points when compressive forces are applied on them. Thus, we expect the tunneling resistance to decrease and approach an asymptotic level (due to the presence of oxide layer and other non-conductive impurities) when compressive forces are applied.
Electrically conductive nanoparticles such as carbon black (CB) have large specific surface area which enhances interconnecting network formation as well as improving the mechanical properties of composites in which they are used as fillers and/or reinforcement agents (Sancaktar et al., 1996).
Unvulcanized butadiene (BR) (Cis-1,4-polybutadiene) and natural (NR) (Cis-1,4-polyisoprene) rubbers are tough linear polymers exhibiting large area under their stress-strain curves at room temperature. They flow plastically at higher temperatures (182–204°C). These rubbers are mixed with vulcanizing agents such as sulfur or peroxides at temperatures ≥100°C to crosslink them into molecular network which typically has one crosslink for every few hundred atoms of a polymer molecule. In the undeformed state, randomly coiled polymer molecules exist between the crosslinks. The Young's modulus for natural and synthetic rubbers range from 102 to 104 kPa. Vulcanized rubbers can be reversibly stretched more than 200% (Morton, 1987; White, 1995).
Basan and Sancaktar (2016) studied pressure-time dependent electrical resistivity/conductivity behavior of silicon rubber (SR) containing 40–100 phr (parts per hundred units of rubber) CB. Due to the high deformability of silicon rubber, the percolation thresholds for CB–SR compounds were functions of the applied pressure (compression load). Resistivity of such compounds decreased with time and compressive load levels. Storage moduli, G', as well as the loss moduli, G” and the dynamic viscosities, η* of the compounds were evaluated to assess viscoelastic response of the compounds' conductivities under pressure. The storage and loss moduli values for the CB-SR compounds decreased with increasing strain levels, indicating that the rate of increase in conductivity is expected to increase at higher compressive loads. The storage moduli increased with increasing frequency (rate) (Basan and Sancaktar, 2016), indicating that the rate of increase in conductivity should be lower at higher rates of compressive load application. Work by Basan and Sancaktar was performed using a single rubber compound, namely CB-SR, and as such, did not provide insight on the effects of the molecular structure of the rubber matrix on the conductivity behavior of the compound.
In this work, pressure-time dependent electrical resistivity/conductivity behavior of Carbon black (CB) filled butadiene (BR) (Cis-1,4-polybutadiene) and natural (NR) (Cis-1,4-polyisoprene) rubber compounds containing 60–100 phr CB are investigated. Storage moduli, G', as well as the loss moduli, G” and the dynamic viscosities, η* of the compounds are evaluated to assess viscoelastic response of the compounds' conductivities under pressure and at different rates. Variations in conductivity of the CB–BR and CB-NR compounds as functions of time and pressure are compared to assess whether the conductivity levels are also dependent on the nature of the molecular structure of these rubber materials, their initial interactions with CB during compounding, and the resulting dispersion levels of CB.
Materials and Methods
Preparation of Composite Materials
The CB filled BR (Cis-1,4-polybutadiene, 96% Cis1) and NR (Cis-1,4-polyisoprene) rubber composites we tested were prepared using Diene 645 high cis BR (now Diene 645S, Firestone Polymers, Akron, OH), and SMR-CV60 NR (Akrochem, Akron, OH2). N330 CB was utilized in 40, 60, 70, 80, 90 ve 100 phr (per hundred rubber) proportions as the conductive component (Basan and Sancaktar, 2016). CB-BR and CB-NR composites were compounded using the recipe shown in Table 1 for 50 phr CB. A Brabender compounder (C.W. Brabender Instruments Inc., South Hackensack, NJ) was employed using the compounding procedures shown in Table 2. The six different compounds obtained in this manner were press-cured into 2 mm thick sheets using 28 MPa pressure at 100°C over a 35 min period (Basan and Sancaktar, 2016). A hydraulic press (Carver Model 3912; Wabash, IN) was used for this purpose (Basan and Sancaktar, 2016).
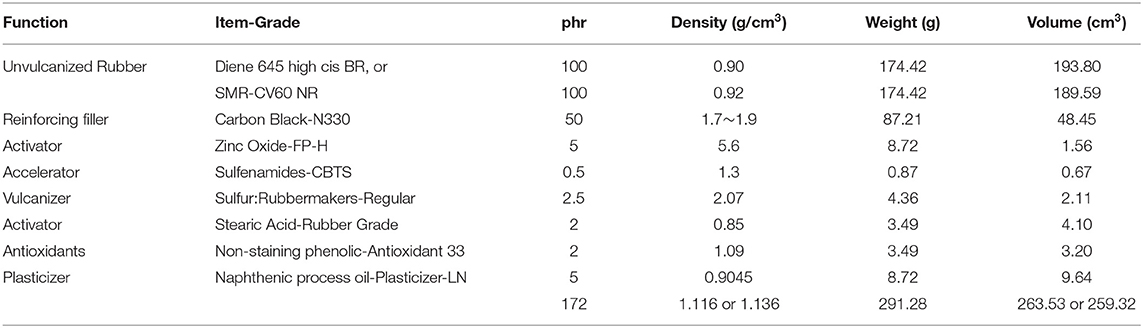
Table 1. Compound recipes.

Table 2. Compounding procedures.
Measurement of Electrical Conductivity
Twenty millimeter diameter, 2 mm thick circular samples were punch-cut (Basan and Sancaktar, 2016) using the composite sheets prepared as described in section Preparation of Composite Materials. These samples were placed in an insulating hollow cylinder fitted with conducting solid aluminum rods to apply compressive force to the samples (Sancaktar and Wei, 1996) and to measure the change in their resistivity with increasing pressure. A digital multimeter (Goldstar; DM-7241) was used to measure sample resistances (R) in kΩ.
The resistivity, ρ (Ω·cm) values for the composites were calculated using the equation:
where, A (cm2) represents the cross sectional area, and L (cm) the linear dimension (specimen thickness) in the direction of current flow (Basan and Sancaktar, 2016).
The specimen thickness is reduced due to the pressure applied on the specimen. The relationship between the specimen thickness and the applied pressure was assumed to be linear, with the proportionality constant, α:
where, Lo and L represent initial and final thicknesses during the loading cycle, t. Therefore, the final length can be calculated using the relation (Basan and Sancaktar, 2016):
The conductivity, σ (S·cm−1), is defined as the inverse of resistivity:
The resistance values were measured over a period of 60 min using eight different pressures (0, 50, 100, 150, 250, 375, 500, and 750 kPa) (Basan and Sancaktar, 2016).
Rheological Measurements
5 × 5 cm CB-rubber composite samples weighing ~5 g were prepared using the procedure described in section Preparation of Composite Materials and placed in between two PET (Mylar) film sheets for measurements of storage (G') and loss (G”) moduli, as well as the dynamic viscosity (η*) (Basan and Sancaktar, 2016). A Torque Rheometer (RPA 2000; Alpha Technologies, Hudson, OH) was used for this purpose. 0.5–100% strain sweep (0.03–7° rotation) was done at 60°C using 10.5 rad/s (1.67 Hz) frequency. 0.3–157 rad/s frequency sweep (0.5–25 Hz) at 60°C using 4.2% strain level (0.29° rotation) (Basan and Sancaktar, 2016).
Results and Discussion
Variation of Composite Resistivity With CB Fraction, Pressure, and Time
Figures 1A,B show the reductions in resistivity for CB–BR composites when the CB fill levels are increased from 70 to 100 phr. Such reductions in resistivity at 1 min pressure application is shown in Figure 1A and the same for 60 min pressure application is shown in Figure 1B. Locally asymptotic resistivity level appears to commence at ~90 phr CB fill level for the Ω-cm resistivity range depicted. Reductions in resistivity levels are clearly observed when the pressure levels are increased up to 750 kPa at constant CB phr levels less than ~90 phr.
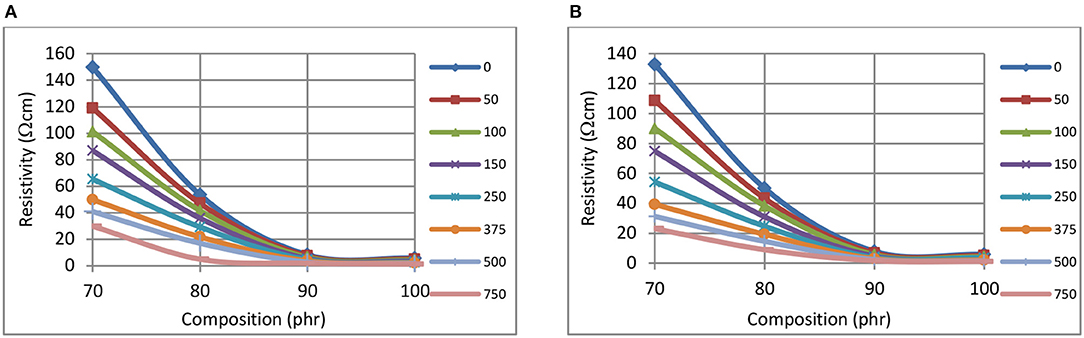
Figure 1. The variation of resistivity, at 1 min (A), and 60 min (B), with composition, for CB-BR composites using different pressures (kPa, inset right).
Figures 2A,B show the reductions in resistivity for CB–NR composites when the CB fill levels are increased from 60 to 70 phr, indicating the formation of percolated network. Such reductions in resistivity at 1 min pressure application are shown in Figure 2A and the same for 60 min pressure application are shown in Figure 2B. Examination of Figure 2 reveals that locally asymptotic resistivity level appears to commence at ~70 phr for the kΩ-cm range depicted even though some local fluctuations are observed. Reductions in resistivity levels are clearly observed when the pressure levels are increased up to 750 kPa at constant CB phr levels. Furthermore, the percolation transition is more clearly observed at lower pressures with the variation of resistivity with composition approaching linearity as the pressure level is increased.
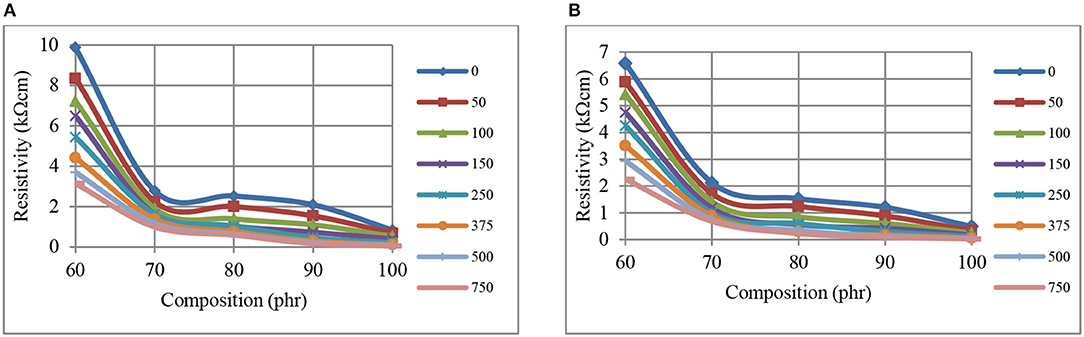
Figure 2. The variation of resistivity, at 1 min (A), and 60 min (B), with composition, for CB-NR composites using different pressures (kPa, inset right).
Figures 3(A- 1 min) and (B- 60 min) show the time dependent decrease in CB–BR composite resistivity levels beyond 70 phr CB level (at the initiation of percolated structure) when 0–750 kPa pressure levels are used. Asymptotic resistivity levels are reached at ~90 phr CB when using either pressure, with this level at 750 kPa being ~25% of that at 0 kPa (Figure 3).
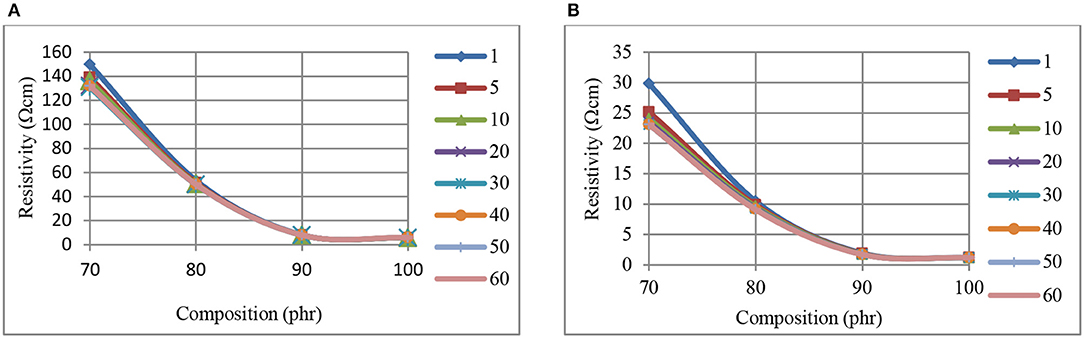
Figure 3. The variation of resistivity, at 0 kPa (A), and 750 kPa (B) pressure, with composition, for CB-BR composites measured at different times (min, inset right).
Figures 4A,B illustrate a stronger time dependence for the CB–NR composite resistivity levels, within the kΩ-cm range depicted, when compared with Figure 3 (CB-BR). We note that Figure 4 presents resistivity data for CB levels ≥70 phr, the range which appears to have reached approximately asymptotic levels for resistivity in Figure 2. It is interesting to note that within the Ω-cm range corresponding to the higher pressure application (750 kPa) part (b) of Figure 4, another asymptotic level appears to have been reached at 90 phr CB.
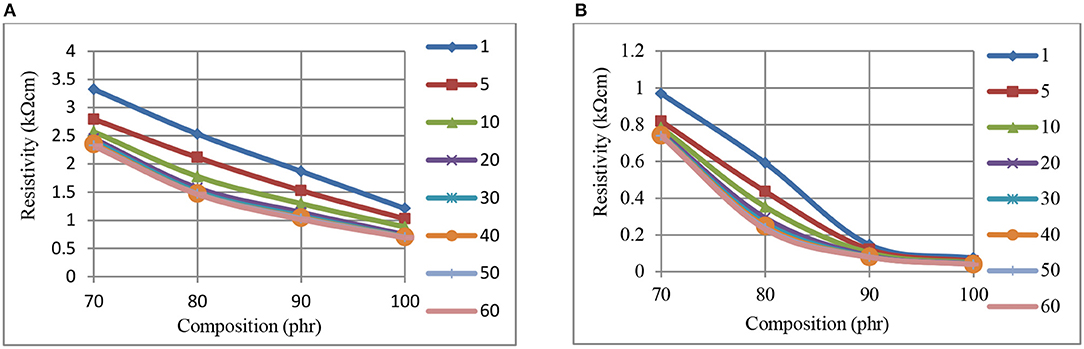
Figure 4. The variation of resistivity, at 0 kPa (A), and 750 kPa (B) pressure, with composition, for CB-NR composites measured at different times (min, inset right).
Comparison of Conductivity Levels for the CB–BR and CB-NR Compounds
Changes in conductivity with pressure and time, for BR (a), and NR (b) composites containing 70 phr CB are shown in Figures 5, 6, respectively. Increases in conductivity with pressure (Figure 5) and time (Figure 6) are clearly observed. Figure 5 reveals that the effect of pressure on conductivity increases at higher pressures where the time dependent conductivity curves diverge for both CB-BR and CB-NR composites. This increase becomes more or less constant beginning at 5 min pressure application time (t) (Figure 6). In other words, the slopes of conductivity vs. pressure curves are approximately constant for t ≥ 5 min. In comparison, the slopes of conductivity vs. pressure curves at 1 min pressure application time become relatively smaller. This may be attributed to viscoelastic behavior by the composites not being accurately represented in Equations (2) and (3) which are used to calculate the effective specimen length under pressure. Following initial high rate compressive load application, the specimen length after 1 min may be relatively higher than what is predicted by Equation (3).
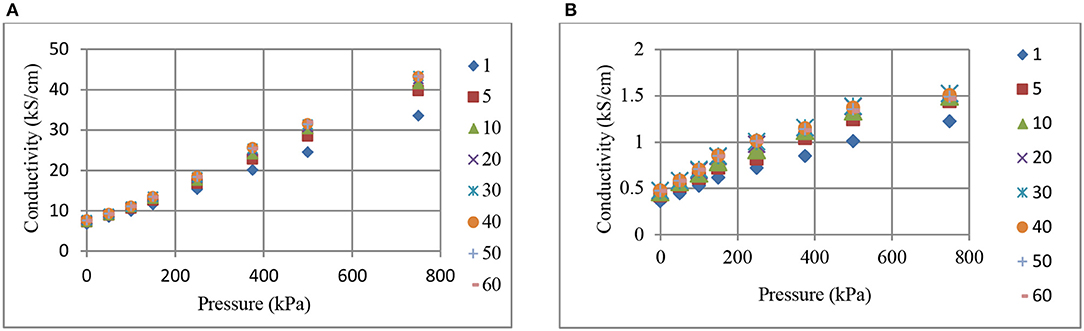
Figure 5. The change in conductivity with pressure and time (min, inset right), for BR (A), and NR (B) composites containing 70 phr CB.
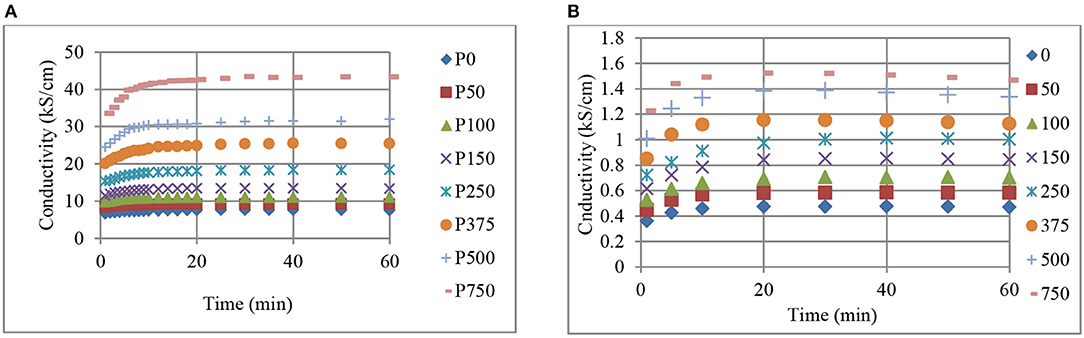
Figure 6. The change in conductivity with time and pressure (kPa, inset right), for BR (A), and NR (B) composites containing 70 phr CB.
Figure 6 reveals that the conductivity levels for both the CB-BR and CB-NR composites containing 70 phr CB remain relatively constant after about 20 min even if a high level of pressure (750 kPa) is applied. The incremental increase in conductivity with pressure seems to be relatively constant with CB-NR for different time values (Figure 6B), while it seems to remain relatively constant for pressure values between 150 to 500 kPa for the CB-BR composite (Figure 6A).
Comparison of Figures 1–6 reveal that, for the CB fill levels, pressures applied and their durations used, CB-BR compounds provide much higher electrical conductivity (σ) in comparison to the CB-NR compounds. The ratio of σCB−BR/σCB−NR seemed to vary in the range of ~18–28 when comparing different time and pressure conditions for 70 phr CB loading. This ratio was as high as ~50 for specimens filled at 90 phr level and pressurized to 750 kPa. The overall difference in conductivity levels for the CB–BR and CB-NR compounds remain approximately unchanged for given time and pressure conditions for the cases where such high CB fill levels (~90 phr) under high pressures (750 kPa) are used and asymptotic conductivity values are reached. These observations on conductivity variations between the CB–BR and CB-NR compounds as functions of time and pressure indicate that, overall, the conductivity levels are strongly dependent on the nature of the molecular structure of these rubber materials and their initial interactions with CB during compounding and the resulting dispersion levels of CB. Once such dispersion structure is established, a relatively constant conductivity ratio is obtained at high levels of CB fill and pressure as indicated by the σCB−BR/σCB−NR ratio of ~50 with 90 phr CB at 750 kPa. This ratio changes at lower CB fill levels and pressures (σCB−BR/σCB−NR ≅18 to ≅28) but the fact that σCB−BR > σCB−NR remains valid.
There are a large number of reactive double bonds as well as O and OH on surfaces of carbon black fillers as shown in Figure 7. The presence of sulfur, olefins, and radicals typically lead to the formation of covalent bonds between the CB surface and the rubber via these double bonds. O and OH sites provide hydrogen bonding. The hydrogen content built up in this manner correlates to reinforcement by carbon black (Papireb et al., 1969).
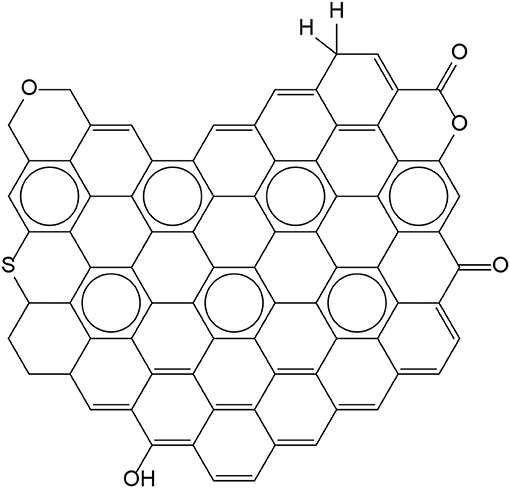
Figure 7. Possible chemical functionalities of carbon black surface.
Based on our experimental results and due to the presence of higher number (~2-fold) of hydrogen side atoms on the linear BR chains (Cis-1,4-polybutadiene, Figure 8), we believe that CB–BR compound forms more physical crosslinks (mostly due to hydrogen bonding) in comparison to the CB-NR (Cis-1,4-polyisoprene, Figure 9) compound resulting in more effective CB dispersion and higher conductivity. We note that for both Cis configurations, possible rotations about the C C bonds in CH2 groups allow the molecules to coil upon themselves, thus resulting in disordered molecular conformations for both types of rubber materials; however, the CB particles are able to establish more effective conductive network when used with Cis-1,4-polybutadiene due to the formation of more physical crosslinks between these particles and the Cis-1,4-polybutadiene molecules as inferred based on the comparison of our rheological experiments for the CB–BR and CB–NR compounds reported in the section Correlation of Conductivity Levels with Rheological Properties for the CB–BR and CB-NR Compounds.
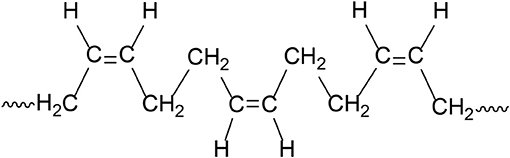
Figure 8. Cis-1,4-polybutadiene.
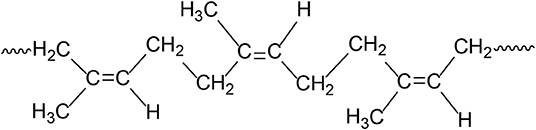
Figure 9. Cis-1,4-polyisoprene.
Correlation of Conductivity Levels With Rheological Properties for the CB–BR and CB-NR Compounds
Comparison of Figures 10, 11 reveals higher G' and η* values for the CB–BR compound in comparison to the CB-NR compound. 40 phr CB was used in making this comparison. Figures 10A, 11A reveal that the stiffnesses (storage moduli) for the CB-BR and CB-NR composites decrease at higher strain levels. Based on this result, we expect increases in the rate of increase in conductivity at higher pressure levels as observed in Figure 5 for 70 phr CB and inferred from Figures 1, 2. The storage modulus increases with increasing frequency (rate) for both CB-BR and CB-NR composites, as observed in Figures 10B, 11B, respectively. Thus, lower rates of conductivity increase should be observed when compressive forces are applied at higher rates. These observations lead to the conclusion that the magnitude and the rate of applied pressure control the conductive filler-induced resistivity/conductivity levels in rubber-based conductive devices.
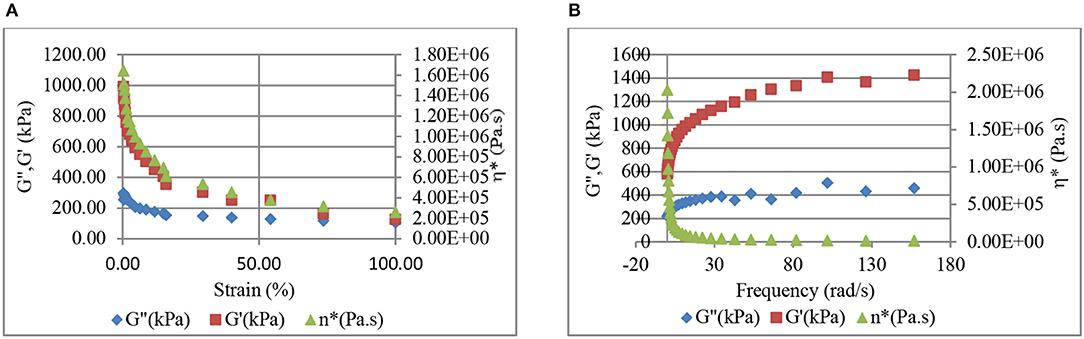
Figure 10. Strain level (A) and frequency (B) dependent variation of storage (G') and loss (G”) moduli, and dynamic viscosity (η*) in 40 phr CB-BR composite.
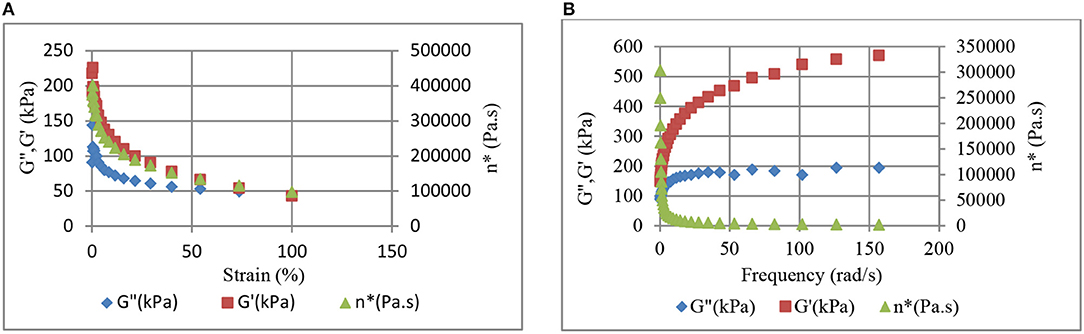
Figure 11. Strain level (A) and frequency (B) dependent variation of storage (G') and loss (G”) moduli, and dynamic viscosity (η*) in 40 phr CB-NR composite.
Comparison of Figures 10A, 11A reveal that the ratio of stiffnesses (storage modulus, G') for the CB-BR and CB-NR composites is G'CB-BR/G'CB−NR ≅ 4 at 100% strain, indicating that the CB-BR composites should have lower conductivity in comparison to the CB-NR composites at higher pressure levels if all other effects are ignored; but, our experimental results have shown that not to be the case with σCB−BR/σCB−NR ratio of ~50 with 90 phr CB at 750 kPa. Thus, higher efficiency in CB dispersion and percolation in BR is further implied by higher conductivities despite higher G' and η* values for the CB–BR compound in comparison to the CB-NR compound. Higher dynamic viscosities (η*) obtained for the CB-BR composites (Figure 10) in comparison to the CB-NR composites (Figure 11) should also be considered evidence of better CB dispersion in CB-BR composites in comparison to the CB-NR composites.
Conclusions
Pressure-time dependent electrical resistivity/conductivity behavior of Carbon black (CB) filled butadiene (BR) (Cis-1,4-polybutadiene) and natural (NR) (Cis-1,4-polyisoprene) rubber compounds containing 60–100 phr CB were investigated in this work. Storage moduli, G', as well as the loss moduli, G” and the dynamic viscosities, η* of the compounds were evaluated to assess viscoelastic response of the compounds' conductivities under pressure and at different rates. The storage and loss moduli values for both the CB-BR and the CB-NR compounds decreased with increasing strain levels, indicating that the rate of increase in conductivity is expected to increase at higher compressive loads. The storage moduli increased with increasing frequency (rate) indicating that the rate of increase in conductivity should be lower at higher rates of compressive load application. Variations in conductivities of the CB–BR and CB-NR compounds were compared as functions of time and pressure to assess whether the conductivity levels are dependent on the nature of the molecular structure of these rubber materials affecting initial rubber interactions with CB during compounding and the resulting dispersion levels of CB. Based on our experimental results, we inferred that the presence of higher number (~2-fold) of hydrogen side atoms on the linear BR chains (Cis-1,4-polybutadiene) in comparison to NR chains (Cis-1,4-polyisoprene) helps CB–BR compound to form more physical crosslinks, mostly due to hydrogen bonding, resulting in more effective CB dispersion and higher conductivity.
Higher efficiency in CB dispersion and percolation in BR is further implied by higher conductivities of its CB compounds despite higher G' and η* values for the CB–BR compound in comparison to the CB-NR compound. We also consider higher dynamic viscosities (η*) obtained for the CB-BR composites in comparison to the CB-NR composites as additional evidence of better CB dispersion in CB-BR composites in comparison to the CB-NR composites.
Based on our experimental findings, we conclude that the molecular structure of the rubber, and thus the rubber type (i.e., BR vs. NR), as well as the magnitude and the rate of applied pressure control the conductive filler-induced resistivity/conductivity levels in rubber-based, pressure/time sensitive conductive devices.
Data Availability Statement
All datasets generated for this study are included in the article/supplementary material.
Author Contributions
ES conceived the theme and the investigative plan, wrote the entire manuscript, and constructed the final versions of figures and tables. SB performed the experiments, processed, and plotted the data.
Conflict of Interest
The authors declare that the research was conducted in the absence of any commercial or financial relationships that could be construed as a potential conflict of interest.
Footnotes
1. ^https://na01.safelinks.protection.outlook.com/?url=http%3A%2F%2Fwww.firestonepolymers.com%2Fdiene_rubber.aspandamp;data=02%7C01%7Cerol%40uakron.edu%7C92e1aafc4d5e4e1dd29708d663b4aca8%7Ce8575dedd7f94ecea4aa0b32991aeedd%7C1%7C0%7C636806025988764877andamp;sdata = rqPc0DEVAATs%2BkNEa8H1bUNKYAvs9hgGJ702htfLQfc%3Dandamp;reserved=0
2. ^http://www.akrochem.com/pdf/technical_data_sheet/elastomers/smr_cv60-smr-l_smr-gp.pdf
References
Basan, S., and Sancaktar, E. (2016). Electrical conductivity of carbon black - silicon rubber nanocomposites: effects of strain, load and loading rate. Curr. Nanomater. 1, 195–200. doi: 10.2174/2468187306666160418164202
Morton, M. (1987). Rubber Technology. New York, NY: Von Nostrand Reinhold. doi: 10.1007/978-1-4615-7823-9
Papireb, E., Voet, A., and Given, P. H. (1969). Transfer of labeled hydrogen between elastomers and carbon black. Rubber Chem Technol 41, 1200–1208. doi: 10.5254/1.3539290
Sancaktar, E., and Bai, L. (2011). Electrically conductive epoxy adhesives. Polymers 3, 427–466. doi: 10.3390/polym3010427
Sancaktar, E., and Dilsiz, N. (1999a). Pressure dependent conduction behavior of various particles for conductive adhesive applications. J. Adhes. Sci. Technol. 13, 679–693. doi: 10.1163/156856199X00938
Sancaktar, E., and Dilsiz, N. (1999b). Thickness dependent conduction behavior of various particles for conductive adhesive applications. J. Adhes. Sci. Technol. 13, 763–771. doi: 10.1163/156856199X00992
Sancaktar, E., and Wei, Y. (1996). The effect of pressure on the initial establishment of conductive paths in electronically conductive adhesives. J. Adhes. Sci. Technol. 10, 1221–1235. doi: 10.1163/156856196X00201
Sancaktar, E., Wei, Y., and Gaynes, M. A. (1996). Conduction efficiency and strength of electronically conductive adhesive joints. J. Adhes. 56, 229–246. doi: 10.1080/00218469608010510
Wei, Y., and Sancaktar, E. (1996). Dependence of electric conduction on film thickness of conductive adhesives: modeling, computer simulation, and experiment. J. Adhes. Sci. Technol. 10, 1199–1219. doi: 10.1163/156856196X00193
Keywords: electrical conductivity, Cis-1,4-polybutadiene/carbon black rubber compound, Cis-1,4-polyisoprene/carbon black rubber compound, natural rubber, pressure dependent electrical conduction, percolation, carbon black dispersion, storage modulus—viscosity—electrical conduction relationships
Citation: Sancaktar E and Basan S (2019) Comparison of Electrical Conductivity in Compounds of Carbon Black With Natural and Butadiene Rubbers. Front. Mater. 6:265. doi: 10.3389/fmats.2019.00265
Received: 12 March 2019; Accepted: 11 October 2019;
Published: 31 October 2019.
Edited by:
Guilherme Mariz de Oliveira Barra, Federal University of Santa Catarina, BrazilReviewed by:
Gordana Markovic, Tigar A.D., SerbiaClaudia Merlini, Federal University of Santa Catarina, Brazil
Debora Pereira Schmitz, Federal University of Santa Catarina, Brazil
Copyright © 2019 Sancaktar and Basan. This is an open-access article distributed under the terms of the Creative Commons Attribution License (CC BY). The use, distribution or reproduction in other forums is permitted, provided the original author(s) and the copyright owner(s) are credited and that the original publication in this journal is cited, in accordance with accepted academic practice. No use, distribution or reproduction is permitted which does not comply with these terms.
*Correspondence: Erol Sancaktar, erol@uakron.edu