Thermal Treatment of γ-Al2O3 for the Preparation of Stereolithography 3D Printing Ceramic Slurries
 He Li
He Li Yongsheng Liu1*
 - 1Science and Technology on Thermostructural Composite Materials Laboratory, Northwestern Polytechnical University, Xi'an, China
- 2Institute of Metal Research, Chinese Academy of Sciences, Shenyang, China
Alumina (Al2O3) suspensions were prepared for the effective application in the stereolithography three-dimensional (3D) printing process. Thermal treatment of γ-Al2O3 could optimize the ceramic slurries to meet the requirements of stereolithography 3D printing technique. In this study, alumina powders were modified by thermal treatment at different temperatures for the preparation of well-dispersed ceramic slurries. The influence of thermal treatment on the raw powder, printed green bodies, and sintered alumina parts was systematically studied. Thermogravimetric analysis indicated that the decomposition temperature of photosensitive resin was between 390 and 460°C. The alumina powders became denser, the crystal grains changed from round sphere-shaped to long cylinder-shaped, and the pores disappeared with increasing thermal treatment temperature. After the 3D printing process, the microstructure of green bodies and sintered alumina ceramics exhibited significant variation. Decomposition and removal of photosensitive resin led to higher water absorption, higher porosity, and lower bulk density of alumina ceramics compared to the printed green bodies. The scattering phenomenon in ceramic slurries and layer-by-layer forming characteristic determined the different shrinkage in three directions. Experimental results suggested that 1,500°C was considered as the optimal thermal treatment temperature, with the water absorption of 107%, open porosity of 91%, and bulk density of 0.67 g cm−3. The higher thermal treatment temperatures would lead to clump and agglomerate of alumina powders.
Graphical Abstract. Alumina ceramic fabricated through 3D printing.
Highlights
- Stereolithography 3D printing alumina ceramic.
- Thermal treatment of γ-Al2O3 at different temperatures.
- Alumina powders used for prepare ceramic slurries for 3D printing.
- The ceramic slurries meet the requirements of stereolithography 3D printing technique.
Introduction
Aero-engines pursue extreme performance in extremely limited space and under extreme conditions (high temperature, high pressure, and high stress) to ensure long-term stability (Lukin et al., 1993; Xiao and Huang, 2016; Williams, 2017; Salpingidou et al., 2018). The performance requirements for aero-engines in the aerospace field are becoming increasingly rigorous, including the service life and the stability. In order to meet the requirements of temperature, innovative design advances for efficient and reliable cooling systems is the key problem (Kim et al., 2016; Popoola et al., 2016; Uysal et al., 2018). This technology utilizes the internal cooling channels to cool down the high-temperature blades in working conditions, which indirectly boosts the required utilization temperature of the blade. The ceramic cores could shape the complex cooling passage inside the blade, improve the blade cooling structures, and continuously improve the blade cooling efficiency. Therefore, ceramic cores play an extremely important role in molding hollow blades with complex cavities.
In traditional blade manufacturing process, inner cavity is mainly formed by investment casting method. The main problems associated with traditional investment casting include: Difficulty in making complex cores; difficulty in accurately positioning of cores and shells; low yield of finished products; long production cycle and high cost. For these reasons, a new method must be developed to meet the requirements of manufacturing high temperature alloy metal blade (Dong et al., 2011; Chen et al., 2012; Cendrowicz). Stereolithography is a 3D printing technology, which is used to fabricate the parts layer by layer through the exposure of ultraviolet (UV) light source on the slurries system containing photoinitiator, thus transforming the liquid slurries into a solid state. Considering the advantages of stereolithography based three-dimensional (3D) printing technology, it is suitable to prepare complicated ceramic cores with short production cycle and low cost in a convenient and efficient way due to the mold-free and accurate fabrication process (Halloran, 2016; Bae et al., 2019; Gold). After fabrication of parts by stereolithography, debinding and sintering processes are used subsequently to achieve ceramic parts. However, several technical challenges are associated with the process, which need to be solved. The powders in the ceramic slurry decreased the fluidity of ceramic slurry, which made the 3D printing process difficult to complete. The UV-cured ceramic slurries should have good fluidity and as much improved powder content as possible. Extensive research efforts have been devoted to improve the fluidity and powder content of the ceramic slurries. Zhang et al. (2019) reported that the suspension with 40 vol.% solid loading and 2 wt.% KO110 was the optimal ZrO2 ceramic slurries. Zhang et al. (2017) modified the surface of alumina with dicarboxylic acids to acquire stable ceramic suspensions with low viscosity and high solid loading and without yield stress. Wang and Dommati (2018) used slurries zirconia as the structural material, methyl alcohol as the solvent, a waterborne inorganic pigment as the dispersant, and a visible-light-curing resin was used as the organic binder for slurries formation to fabricated zirconia ceramic parts through stereolithography. The researchers using different pathways to prepare ceramic slurries, which could increase the fluidity of the slurries, and then complete the printing process successfully. Alumina was applied in this study due to that ceramic cores made from alumina have excellent metallurgical chemical stability and creep resistance, desired thermal properties, lack of reaction with the superalloy, low thermal expansion, and easy to remove, etc. The preparation of alumina ceramic slurries which meet the requirement for 3D printing is very difficult. Adding alumina powders would increase the viscosity and decrease the fluidity of the ceramic slurries which made the 3D printing process difficult to complete. Reduction in viscosity and increase in powder content of ceramic slurries are important to prepare photocurable ceramic slurries. The thermal treatment of γ-Al2O3 would affect the microstructure of alumina powders, then influence the preparation of stereolithography 3D printing ceramic slurries.
The objective of this study is to prepare ceramic slurries through thermal treatment of inorganic powders and fabricate ceramic cores through stereolithography based 3D printing technology. In this study, alumina was treated at different temperatures, and then used to prepare ceramic slurries. The stereolithography, debinding, and sintering processes were carried out. Furthermore, the influence of alumina obtained at different temperatures on the physical properties and microstructure of the obtained ceramics was studied.
Experimental Procedure
Thermal Treatment of γ-Al2O3
γ-Al2O3 was porous inorganic oxide with high activity, strong adsorption capacity, porous, high hardness, and good dimensional stability. It is easily dispersed in solvent, which can be dispersed evenly in ethanol, propanol, propanediol, isopropanol etc. γ-Al2O3 was selected as research object due to its desired performance, easily available and low cost. The γ-Al2O3 (YH-36, Yantai Henghui Chemical Co., Ltd.) was subjected to thermal treatment in a muffle furnace (Hefei Ke Jing Materials Technology Co., Ltd., China). The γ-Al2O3 was heated to the target temperature (T) with a heating rate of 5°C min−1 (T = 1,300, 1,350, 1,400, 1,450, 1,500°C), and then the heating was sustained for 2 h (The alumina transforms from γ- Al2O3 to α- Al2O3 at 1,200°C, and will agglomeration higher than 1,500°C, so the heating temperature were between 1,300 and 1,500°C). The thermal treatment profile is illustrated in Figure 1. The particle size distribution of the alumina powder acquired from laser particle size analysis (Master Sizer 2000, Malvern Instruments, England) is shown in Figure S1. The relevant particle parameters are listed in Table 1, which indicated that the particles have a bimodal distribution of 0.8 and 8 μm, respectively. With the increase in thermal treatment temperature, D10, D50, D90, Dv, and Dm have a tendency to decrease. After the thermal treatment process, the alumina powder was milled for 2 h in a planetary ball mill.
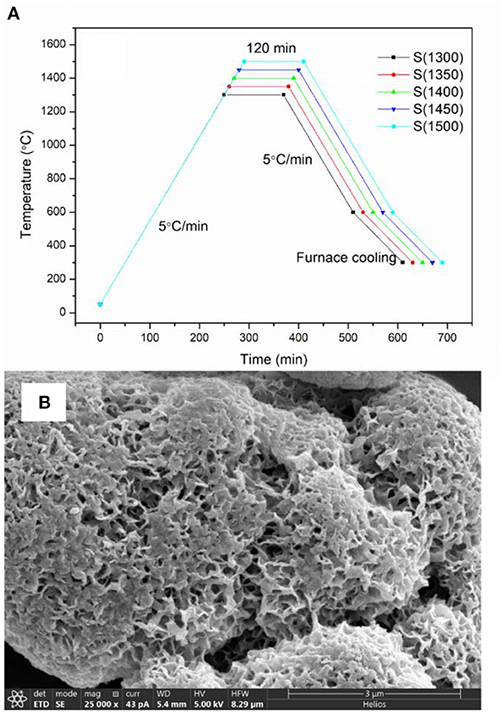
Figure 1. (A) The thermal treatment profile of γ-Al2O3; (B) SEM images of γ-Al2O3.
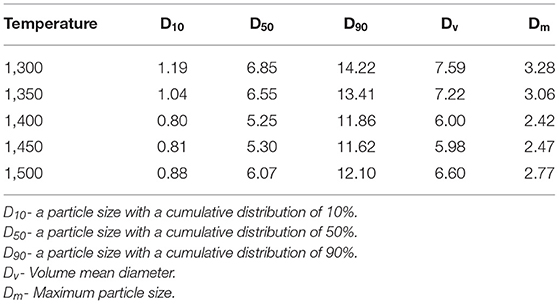
Table 1. The particle parameters of alumina powder thermally treated under different temperatures measured by laser particle size analysis (μm).
During the thermal treatment process, the alumina powders underwent a phase change from γ-Al2O3 to α-Al2O3, with structural changes and volumetric shrinkage. Different temperatures lead to different evolution in structural changes and subsequently lead to different particle size. A higher temperature may lead to more severe volume shrinkage, so the particle size has a decrease tendency as the heating temperature increases. The SEM images of γ-Al2O3 is shown in Figure 1B.
Preparation of the Ceramic Slurries
Ceramic slurries were a mixture obtained by adding the alumina powders into the photopolymer resin (Clear Flepcl 04, Formlabs, USA). The alumina powders were subjected to thermal treatment which is discussed in section Thermal Treatment of γ-Al2O3. The alumina powders (100 g) was added slowly to photopolymer resin (100 g) with vigorous stirring, followed by ball milling at 400 rpm for 2 h using a planetary ball mill. Then the mixture was vacuum defoamed for 30 min to obtain the final ceramic slurries.
Fabrication of the Ceramic Green Body
The cuboid model (40 × 10 × 4 mm) was drawn using UG software and exported into STL format (Figure S2). The model file was transferred to the 3D printer (Formlabs II, Formlabs, USA) (Figure S3). The ceramic slurries were then transported to the 3D printer. The layer thickness was set to 100 μm. Then the green bodies were printed. After the completion of the printing process, green bodies were transferred into isopropanol and soaked for 10 min. Then the green bodies were rinsed with absolute ethyl alcohol.
Debinding and Sintering Process
The green bodies were debinded in a muffle furnace (Hefei Ke Jing Materials Technology Co., Ltd., China). First, the green bodies were heated to 200°C with a heating rate of 2°C min−1. Second, the samples were heated to 550°C with a heating rate of 1°C min−1 and then maintained for 2 h. Finally, the samples were heated to 1,500°C with a heating rate of 5°C min−1. The heating was held for 2 h. The debinding and sintering profile are illustrated in Figure 2. The sample was denoted as S(T) (T = 1,300, 1,350, 1,400, 1,450, 1,500°C). T is the thermal treatment temperature of the alumina.
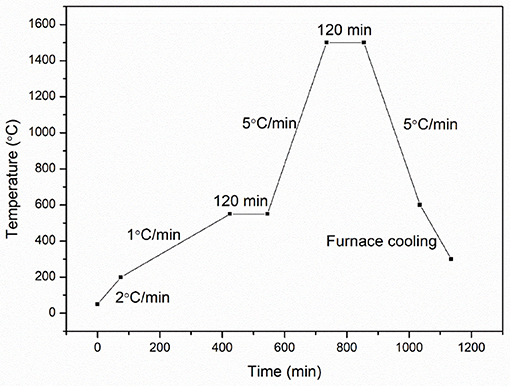
Figure 2. Debinding and sintering process of the green bodies.
Characterization
The samples have been tested with thermogravimetric analyses, X-ray diffraction (XRD), X-ray photoelectron spectroscopy (XPS), scanning electron microscopy (SEM), energy dispersive spectroscopy (EDS), transmission electron microscopy (TEM). Linear shrinkage, open porosity, water absorption, and bulk density were measured.
Thermogravimetric analyses (TG, 449F5 simultaneous TG-DSC apparatus Netzsch, Germany) for the green bodies were carried out under flowing argon at a heating rate of 10°C min−1 from 50 to 600°C. Powder X-ray diffraction (XRD) patterns were recorded using a Bruker D8 FOCUS (Bruker Corporation, Germany) X-ray diffractometer with Cu Kα radiation. The diffraction angle of 2θ was scanned in the range from 10° to 90°. The voltage was 40 kV and the generator current was 30 mA. The scan rate was 0.02° s−1 per step. The crystallite size of Al2O3 was calculated by using the following Scherrer's equation from the peak at 2θ = 35.3°.
where d is the average crystallite size of Al2O3 (nm), K is the Scherrer constant (0.89 in the present case), λ represents the wavelength of X-ray (0.154056 nm), and B denotes the peak width at half height of Al2O3. The Raman test of the samples was carried out using a Confocal Raman Microscope System (Alpha300R, WITec) with a laser source of 532 nm, power of 50 mW, and slit width of 50 μm. X-ray photoelectron spectroscopy (XPS) was performed using an Axis Supra (Shimadzu) photoelectron spectrometer. Scanning electron microscopy (SEM) images were obtained using Helios G4 CX (FEI Corporation). Energy dispersive spectroscopy (EDS) was also conducted to see the element mapping in the materials. Transmission electron microscopy (TEM) images were obtained using Tecnai G2 F20 transmission electron microscope (FEI Corporation).
The bulk density of the samples after sintering process was measured by the Archimedes' method. The accuracy of the balance was 0.0001 g (Mettler Toledo, Switzerland). The theoretical density of Al2O3 was calculated to be 3.95 g cm−3. The linear shrinkage of the sintered samples was measured by using the following formula:
where δ is the shrinkage of the sintered samples (%), L is the length of the samples before the sintering process (mm), and L1 is the length of the samples after the sintering process (mm). The mean value of the shrinkage and the standard deviation were calculated by using the following formula:
where is the mean value of the shrinkage (%), Xi is the certain value of the shrinkage (%), n is the number of the samples, and σ is the standard deviation.
The open porosity, water absorption, and bulk density were calculated by using the following formulas:
where B is the open porosity of the sintered samples (%), W is the water absorption of the sintered samples (%), d is the bulk density of the sintered samples (g cm−3), G1 is the mass of the dry samples (g), G2 is the mass of the wet weight of the samples (g), G3 is the mass of the buoyant weight of the samples (g), and dwater is the density of the water (g cm−3).
Results and Discussion
Thermogravimetric Analyses and SEM Analyses
Thermogravimetric analysis was carried out to study the decomposition temperature and heat change of green bodies during the debinding process. Figure 3 shows the TG profiles of the obtained green bodies. Obvious mass loss of the samples was observed between 45 and 55%. The decomposition of the green bodies was divided into three stages. First, from 50 to 390°C, a slight decomposition of the green bodies occurred and the mass loss was below 10%. Second, from 390 to 460°C, the sample decomposed rapidly and thoroughly and the mass loss reached 45–55%. Third, for temperature above 460°C, the quality of green bodies was stable and no further decomposition occurred. The green bodies consisted of photosensitive resin and alumina powder. The inorganic alumina powder was previously treated at high temperature (1,300–1,500°C), which prevented its decomposition at TGA temperature (50–600°C). Therefore, the decomposition reaction in the green bodies could only be caused by the photosensitive resin under heating conditions. TG curves show that the main decomposition temperature range of photosensitive resin is between 390 and 460°C. The photosensitized resin decomposed and released between 390 and 460°C, and a large number of gaseous products were produced in the decomposition process. Airflow was inevitable when the gaseous products spread to the outer surface of the sample. Reducing the heating rate would slow down the flow rate of the gas and prevent the sample from cracking in the debinding process. So, during the debinding process illustrated in section “Debinding and Sintering Process” the heating rate of the green bodies were rather low. DSC curves indicate the occurrence of endothermic reactions in the green bodies. This is attributed to the fact that the photosensitive resins are mainly composed of oligomer, photoinitiator, and diluents, and their main components are carbon, hydrogen, and oxygen; which undergo pyrolysis reactions and absorb heat in the absence of oxygen (the TG-DSC was conducted under argon; Salmoria et al., 2008; Furutani et al., 2015; Yoshida et al., 2018). The peaks of the DSC curves are located at 430°C, which means that the photosensitive resin reacts mostly at this temperature. So, the heating rate should be low during the debinding process to guarantee the quality of the samples.
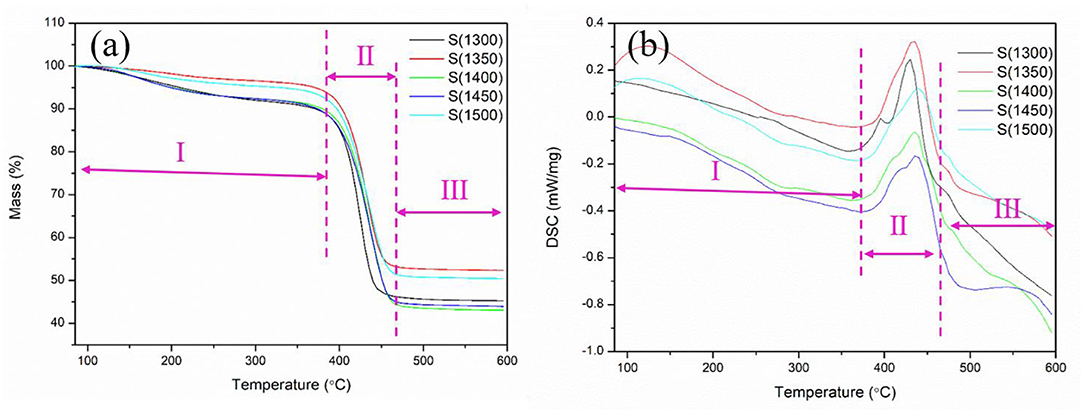
Figure 3. TG-DSC curves of the green bodies: (a) TG curve; (b) DSC curve.
The thermal treatment temperature first influences the microstructure of the alumina powders, then the effects have delivered to the printed green bodies and sintered ceramics. So, the SEM images of alumina powders have been addressed here. SEM images of alumina subjected to thermal treatment at different temperatures are shown in Figure 4. Clearly, the microstructures of alumina powder treated at different temperatures are different. After treatment at 1,300°C, the structure of alumina becomes relatively loose and the surface is piled up with a large number of smaller particles. When treatment was carried out at 1,350°C, part of the surface particles changed to form the long cylinder shape particles. Further these long cylindrical particles were arranged in an orderly manner and formed regular pores. When the thermal treatment temperature was continued to increase to 1,400°C, the structure of alumina powder underwent complete transformation from loose structure to regular ordered porous structure consisting of long cylinders. When the thermal treatment temperature reached 1,450°C, the long cylinder shape particles grew together and piled up tightly. Moreover, the intergranular porosity decreased significantly. With the further increase in the thermal treatment temperature to 1,500°C, alumina particles grew further and joined together, and the pores among the particles were significantly reduced. According to the increase of thermal treatment temperature, the microstructure of alumina particles changed obviously, from loose porous structure to densely stacked structure. The phase transformation of Al2O3 exhibited in Figure S4 indicates that when the thermal treatment temperature is above 1,200°C, all phases of alumina are converted to α-Al2O3, which is the most stable phase of alumina (Legros et al., 1999). This shows that during the thermal treatment of alumina process, only the microstructure changes, and the phase remains the same.
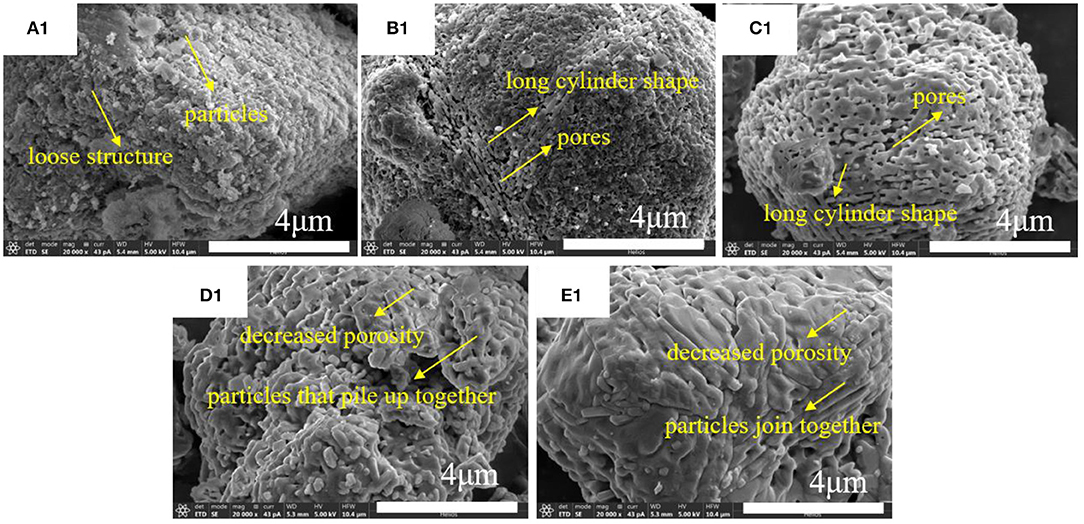
Figure 4. SEM images of alumina subjected to thermal treatment at different temperatures: (A1) 1,300°C; (B1) 1,350°C; (C1) 1,400°C; (D1) 1,450°C; (E1) 1,500°C.
SEM images of alumina with 2000 times magnification are shown in Figure S5. The particle size measured by SEM is presented in Table 2. The average particle size decreased with increasing thermal treatment temperature. Moreover, the minimum and maximum particle size also exhibited decreasing tendency with increasing thermal treatment temperature. The particle size distribution measured using laser particle analyzer presented in Table 1 indicates that the variation trend is the same. This proves that the higher treatment temperature of alumina powder leads to the smaller particle size of alumina.
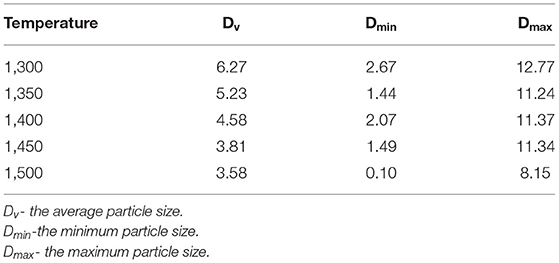
Table 2. The particle size of the powders measured by SEM (μm).
SEM images of printed green bodies with 200 times magnification are shown in Figure S6. The SEM images of printed green bodies with 20,000 times magnification are shown in Figure S7. Moreover, the SEM images of printed green bodies with 100,000 times magnification are presented in Figure S8. The images clearly indicate that the microscopic morphological characteristics of samples become significantly different with the increase of amplification. When the sample magnification is only 200 times, the surface of the sample shows smooth plane morphology. Stereolithography 3D printing is formed by points into lines, lines into layers, and piled up layers to finally complete the production of 3D objects (Chen et al., 2018). The 200 times magnified images present the surface layer of the printed green bodies. When the images of the samples were magnified by 20,000 times, the holes on the surface of the green bodies started to show up. In particular, for alumina treated at 1,300°C, the holes are randomly distributed on the surface of the sample, and the size of the holes is between 110 and 280 nm. With the increase of alumina treatment temperature, the holes on the surface of the samples tend to become fewer and smaller. This is attributed to the fact that with the increase of the thermal treatment temperature of alumina powder, the denser alumina powder structure (Figure 4) leads to the denser printing of the green body, thus reducing the number of holes. On the other hand, with the increase of magnification, the surface roughness of green bodies is also clearly exhibited. This indicates that the flat surface observed at the macro scale is very rough at the micro scale. When the magnification of the sample is increased to 100,000 times, significant change in the micromorphology is observed. Clearly, the surface of the sample is closely connected by nano-sized alumina crystals. Statistical analysis using software (Nano Measurer) indicated that the size distribution of nano-alumina crystal was between 28 and 71 nm, and the average crystal size was 48 nm (data acquired from Figure S8a3). Although the image is not very clear due to the large magnification, it can still be seen that the size of alumina crystals tended to decrease with the increase of thermal treatment temperature.
After the debinding and sintering process, SEM images of acquired alumina ceramics are shown in Figure 5 and Figure S9. The results show that alumina ceramics are composed of alumina particle aggregates which are connected with each other and most of the interspaces are formed. In fact, the cavities between these aggregates are caused by the volatilization of photosensitive resin which decomposed at temperature between 390 and 460°C (Figure 3). Moreover, these alumina particle aggregates are formed by the close connection of nano-micron alumina crystals. The size of these alumina crystals was measured to be around 800 nm (Figure 5a1). Analysis of the boundary lines between the crystals indicated that with the increase in the thermal treatment temperature of alumina powders, the boundary between the crystals became less and less clear, and the crystals were gradually connected to form large clusters of aggregates. Size of alumina particle aggregates was about 4.9 μm (Figure S9a2), which tended to increase with the increase of thermal treatment temperature. This indicates that the higher thermal treatment temperature is conducive to the connection and aggregation of alumina crystals (Rogach et al., 2000).
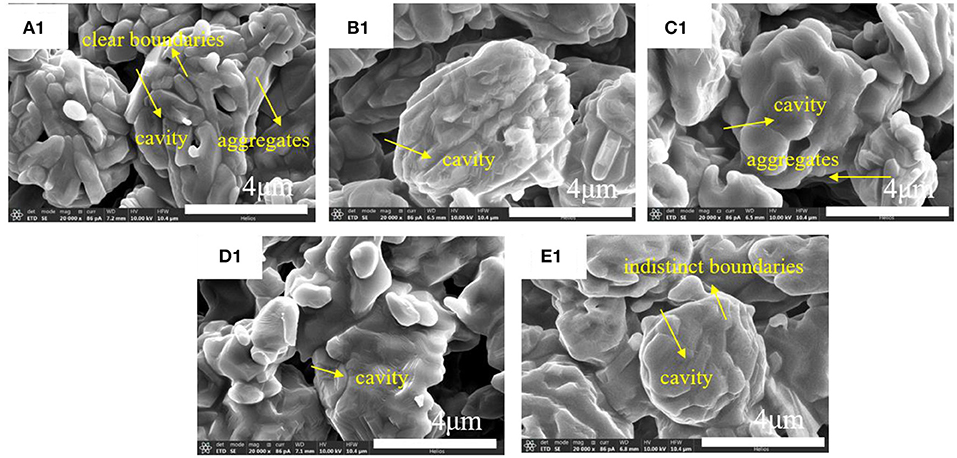
Figure 5. SEM images of alumina ceramics: (A1) 1,300°C; (B1) 1,350°C; (C1) 1,400°C; (D1) 1,450°C; (E1) 1,500°C.
XRD and Raman Analyses
XRD curves of the alumina powders, green bodies, and alumina ceramics are shown in Figure 6 and Figure S10. The XRD results indicate that their phase compositions are identical which belong to α-alumina. The peaks are located at 25.6°, 35.1°, 37.8°, 41.7°, 43.4°, 46.2°, 52.6°, 57.5°, 59.8°, 61.2°, 66.5°, 68.2°, 70.4°, 74.3°, 77.2°, 80.7°, 84.4°, and 86.4°, representing the (012), (104), (110), (006), (113), (202), (024), (116), (211), (122), (214), (300), (125), (208), (119), (220), (223), and (312) crystallographic planes of α-alumina, respectively (PDF#65-3103) (Wen et al., 1999). Although the phase composition of the green bodies is the same as that of the alumina ceramics, the figures reveal that the XRD peaks of the green bodies are slightly lower than those of the alumina ceramic. The weakening of the alumina peak may be due to the polymer contained in the green bodies which affects the strength of the signal. According to Figure S4 and the observation reported by Hyuk-Joon et al. (1999), the most stable α-alumina phase was formed at 1,200°C. This indicates that the transition between various phases of alumina occurs below 1,200°C (Mirjalili et al., 2010). The minimum thermal treatment temperature used in this research was 1,300°C; therefore, no phase transformation was observed with the increase of thermal treatment temperature and the final phase composition was similar to that of the initial samples. Sainz et al. (2000) provided the XRD microstructural analysis, which indicated that owing to the broadening of the peak compared to the standard peak, at higher temperature the apparent crystallite sizes are large and the XRD microstructural analysis becomes difficult. The XRD analysis indicating that thermal treatment temperature has little influence on the phase composition of alumina ceramics and there is no phase change of alumina ceramics due to thermal treatment temperature.
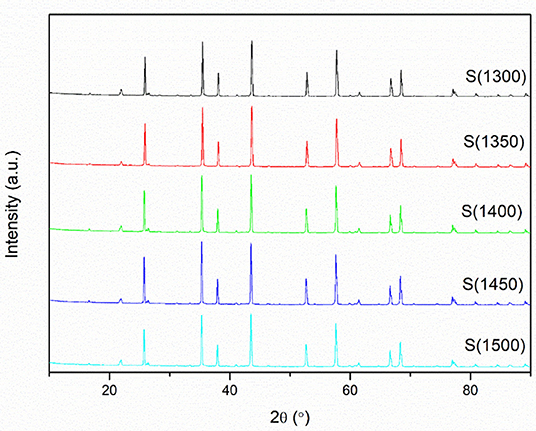
Figure 6. XRD curves of alumina ceramics.
The Raman curves of the alumina powders, green bodies, and alumina ceramics are shown in Figure 7 and Figure S11. The main strong bands in alumina powders are located at 255, 417, 460, and 566 cm−1; the main strong bands for green bodies are located at 255, 417, 460, 566, 925, 1003, 1455, 1610, and 1732 cm−1; and the main strong bands for alumina ceramics are located at 418, 460, and 566 cm−1. (Reyes-López et al., 2013) provided the analysis of the phase transformation by Raman spectroscopy, which indicated that the band at 460 cm−1 is attributed to the vibrations of aluminum with oxygen atoms and the wide band between 500 and 1,000 cm−1 corresponds to the vibrational frequencies of coordinated O–Al–O bonds. This demonstrates the existence of Al–O vibrational modes in the alumina powders, green bodies, and alumina ceramics in this research. Mariotto et al. (1990) studied the Raman spectroscopy of alumina transformation, and reported that the peaks at 733, 1,000, and 1,053 cm−1 are related to OH−. These peaks can be found in the samples of the alumina powders, green bodies, and alumina ceramics. Kadleiková et al. (2001) reported that the Raman spectrum of α-Al2O3 is expected to have seven peaks at 378, 418, 432, 451, 578, 645, and 751 cm−1, respectively, which is in accordance with the results obtained in this study. Noteworthy, some small deviations may be due to impurities and defects in the crystal. Owing to the complexity of alumina phase and crystal structure, impurities in other phases may be detected by Raman technology. Noteworthy, the Raman curves of green bodies are different from those of the alumina powders and alumina ceramics. In the entire band range, there are many uninterrupted small peaks, which are densely distributed. This may be due to the presence of undecomposed photosensitive resin (Baldacchini et al., 2009). Comparing each sample in green bodies, raw alumina powders, and sintered alumina ceramics, there are no obvious difference, which means the bonds are identical and the thermal treatment temperature have little influence on the chemical bonds.
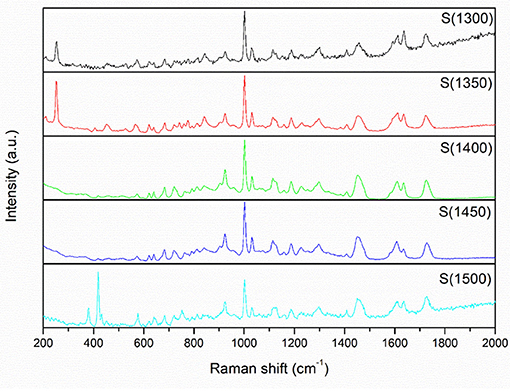
Figure 7. Raman curves of green bodies.
XPS and TEM Analyses
The XPS curves of alumina ceramics are shown in Figure 8. The peaks at 532, 285, 120, and 76 eV are attributed to O 1s, C 1s, Al 2s, and Al 2p, respectively. The peaks of alumina powders treated at different temperatures are identical, indicating that the composition of chemical bonds between different samples is also identical. Thus, the thermal treatment temperature of the powders does not affect the bonding composition of the prepared ceramics. Hirschauer et al. (1997) prepared and characterized highly oriented α-alumina films by pulsed laser deposition, and the results revealed that the peak at 74.4 eV is assigned to alumina and the peak at about 71.5 eV indicates the presence of metallic Al. Combining the enlarged curves shown in Figure S12 clearly reveals that the alumina ceramics obtained herein have no detectable peak near 71.5 eV, indicating that metallic Al does not exist in the alumina ceramics samples obtained in this study. Hoflund and Minahan (1996) studied α-alumina-supported silver ethylene-epoxidation catalysts and reported that the predominant O 1s feature obtained from the α-alumina support exhibited a binding energy of 531.6 eV, which is characteristic of O in Al2O3. Combined with the XPS data of alumina ceramics obtained in this study, the peak at 532 eV demonstrates the existence of O atoms in Al2O3. Noteworthy, C 1s peak appears at 285 eV. Franks and Meagher (2003) explored the isoelectric points of sapphire and α-alumina powder and presented that carbon was common in most XPS results due to the adsorption of gaseous carbon containing species from air. XPS is a kind of surface detection technology, which is very sensitive to the chemical composition of the sample surface. Therefore, the carbon detected in this research may be caused by the adsorption of carbon in the air by the surface of alumina ceramics. Then the XPS results indicating that thermal treatment temperature has little influence on the composition of chemical bonds of alumina ceramics.
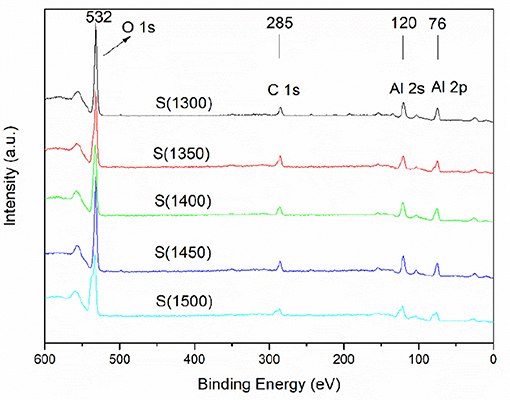
Figure 8. XPS curves of alumina ceramics.
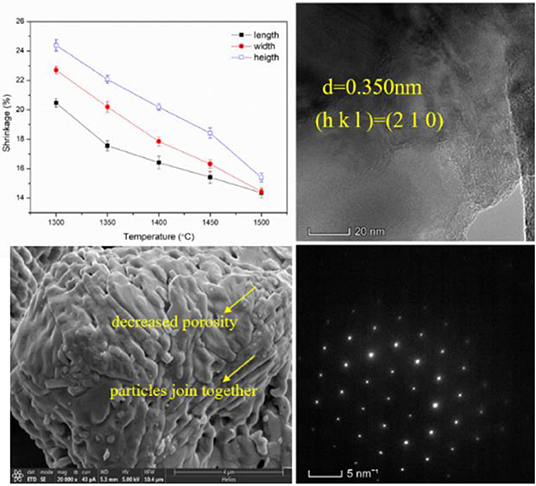
TEM images of the alumina ceramics are shown in Figure 9 and Figure S13. HRTEM images exhibit that the lattice spacing of different samples is not identical. This is due to the fact that the selected crystal faces are different during the process of acquisition of images. When the thermal treatment temperatures were 1,300, 1,350, 1,400, 1,450, and 1,500°C, the corresponding lattice spacing was 0.229, 0.345, 0.350, 0.226, and 0.348 nm. When these data were integrated with the XRD data, the crystal faces were (2 2 2), (0 1 2), (2 1 0), (1 0 4), and (0 1 2) respectively. TEM images presented in Figure S13 exhibit that the microstructure of alumina ceramics shows irregular polygon shape particles with size around 2 μm. This value is close to the values obtained from laser particle size analysis presented in Table 1 and SEM analysis summarized in Table 2. The selected area electron diffraction patterns of alumina ceramics shown in Figure S14 indicate that the sample is composed of single crystal, that is, the entire crystal is composed of the same spatial lattice in the 3D direction (Kortov et al., 2016). The HRTEM, TEM, and selected area electron diffraction patterns of alumina ceramics indicating that the thermal treatment temperature have little influence on the crystal structure of alumina. This is because that over 1,200°C, γ-Al2O3 have converted to α-Al2O3, which could not produce crystal structure change. And α-Al2O3 is more stable than other alumina crystal structure due to its [AlO6] octahedron. According to the research of deformation behavior and mechanical properties of single crystal alumina by Mao et al. (2011), it is difficult to investigate the deformation mechanism of alumina single crystal due to the fact that the onset of mechanical properties is strongly influenced by factors, such as crystal orientation, applied loading, loading rate, tip radius of the indenter, and temperature during tests. However, owing to the excellent high temperature resistance, hardness, and stable chemical properties of single crystal alumina, it is still a very important research object. The atom fractions obtained from EDS results are listed in Table 3 and the distribution of element in alumina ceramics is shown in Figures S15–S18. The EDS results indicate that all the samples are composed of alumina and very little content of C was detected, which may be due to the introduced carbon films when doing the TEM test. According to the mapping photos of alumina ceramics shown in Figures S15–S18, yellow represents the distribution of C element, red represents the distribution of Al element, and green represents the distribution of O element. Moreover, brighter colors indicate more corresponding elements content. Clearly, the Al atoms are distributed in synchronization with the O atoms, and the distribution of carbon atoms is relatively weak. The results showed that the obtained alumina ceramic materials were homogeneous and the alumina was uniformly distributed.
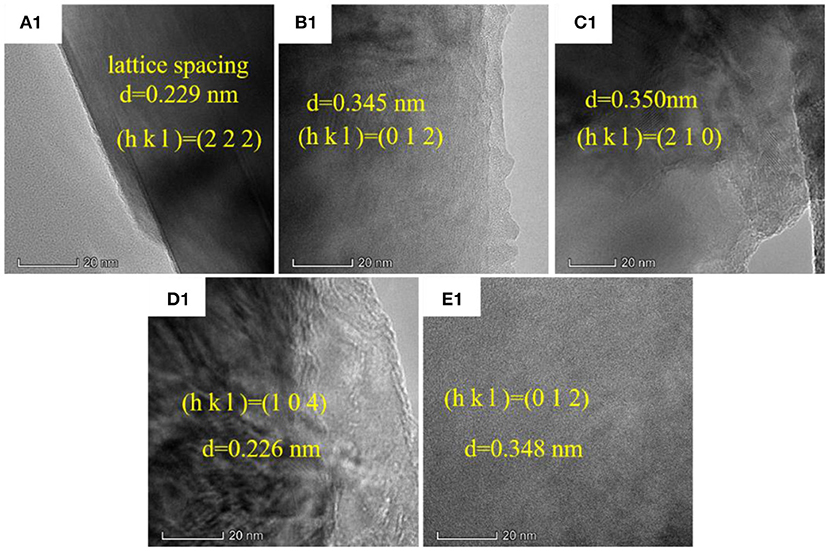
Figure 9. High resolution TEM images of alumina ceramics: (A1) 1,300°C; (B1) 1,350°C; (C1) 1,400°C; (D1) 1,450°C; (E1) 1,500°C.
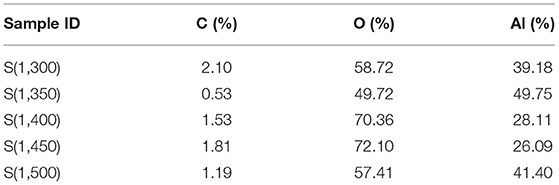
Table 3. Atomic fraction obtained from TEM.
Physical Properties
The physical properties such as water absorption, open porosity, and bulk density of the green bodies and alumina ceramics are shown in Figure 10. The water absorption of green bodies is between 12 and 19% and it increases with increasing thermal treatment temperature of alumina powders. However, the water absorption of alumina ceramics is between 53 and 108% and the values also increase with increasing thermal treatment temperature of alumina powders. The huge gap of water absorption between green bodies and alumina ceramics are caused by the removal of the photosensitive resin under the debinding and sintering process. After the removal of the photosensitive resin, a great number of pores are left in the alumina ceramics, which is beneficial to increase the water absorption values. The open porosity of the green bodies was between 17 and 23% and increased with increasing thermal treatment temperature of alumina powders. The open porosity of the alumina ceramics was between 73 and 92% and the change tendency was the same as that of the green bodies. Relatively large values of the alumina ceramics compared to those of the green bodies are due to the removal of the photosensitive resin under debinding and sintering process. Moreover, variation in water absorption tendency and open porosity may be due to the variation in microstructure of the alumina powders under increasing thermal treatment temperature as illustrated above. From the microstructural SEM images of γ-Al2O3 shown in Figure 1, it is known that the γ-Al2O3 was poriferous and of lax structure. After the thermal treatment at different temperatures, the microstructure has changed and underwent volumetric shrinkage which was shown in Figure 4. Figure 4 shows that the porosity was decreased as the increasing thermal treatment temperature in each particle. Comparing with the lower temperature treated alumina powders, when a large number of particles are added in photosensitive resin, there are few resins entered into the individual particles which have been treated at higher temperature alumina powders. This means that more resins have been existed among particles. After the debinding and sintering process, the resins-occupied space turns to pores. Then the open porosity is increasing with the increasing thermal treatment temperature. The bulk density of the green bodies was between 1.31 and 1.47 g cm−3 and the bulk density of the alumina ceramics was between 0.67 and 1.28 g cm−3. The values of bulk density for all samples decreased with increasing thermal treatment temperature of alumina powders, which is due to the variation tendency of the open porosity. The shrinkage of the alumina ceramics is shown in Figure S19, where it is observed to increase in all the three directions with the increase in the temperature. Along the length, width, and height directions, the shrinkage is in the range of 14.4–20.5, 14.4–22.7, and 15.4–24.4%, respectively. Moreover, it was also observed that the shrinkage along height direction was slightly larger than that along the width direction. Furthermore, the shrinkage along width direction was slightly larger than that along the length direction. This phenomenon may be due to the following two reasons: On the one hand, the height direction determined by the layer-by-layer molding characteristics is different from the X–Y directions and there are relatively large gaps which lead to larger shrinkage. On the other hand, the phenomenon of scattering in ceramic slurries lead to the increase in single curing line width and the decrease of layer thickness, which further deepens the change of shrinkage (Chen et al., 2010).
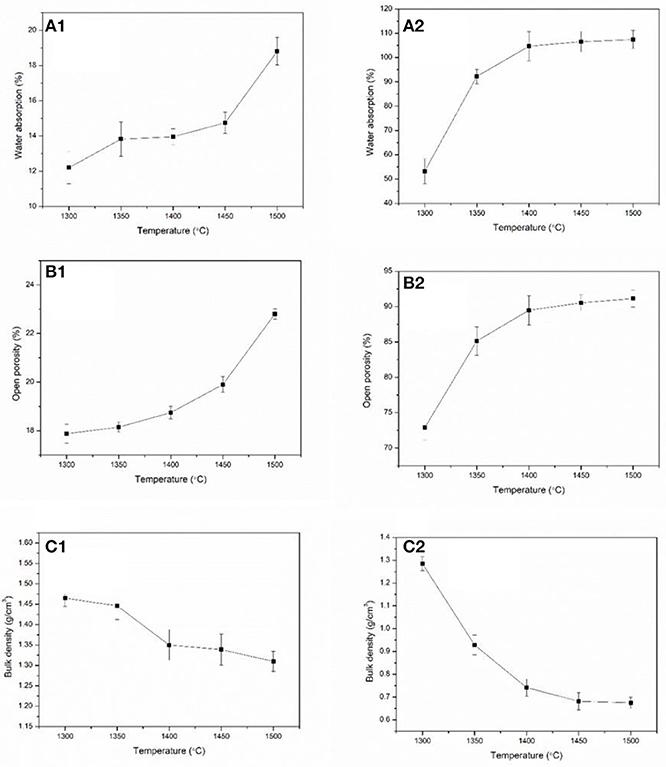
Figure 10. Physical properties of green bodies and alumina ceramics: (A1) green bodies; (B1) green bodies; (C1) green bodies; (A2) alumina ceramics; (B2) alumina ceramics; (C2) alumina ceramics.
In summary, the green bodies were mainly decomposed between 390 and 460°C, so that the heating rate should be slow to avoid the cracking occurred during the debinding process. For alumina powders, as the thermal treatment temperature increases, the microstructure of alumina particles changed from loose porous structure to densely stacked structure, and the particle size have a decrease tendency. For alumina ceramics, the higher thermal treatment temperature is conducive to the connection and aggregation of alumina crystals. Water absorption and open porosity increased as the increasing thermal treatment temperature. Bulk density decreased with the increasing thermal treatment temperature. And thermal treatment temperature has little influence on phase composition and chemical bond.
Conclusions
The effects of thermal treatment temperature of alumina powders on the microstructure, chemical composition, and physical properties of stereolithography 3D printing ceramics were investigated.
1) Alumina green bodies mainly decomposed between 390 and 460°C, the heating rate should be slow in this range. The alumina powders became denser, and the pores turns disappeared with increasing thermal treatment temperature of the alumina powders.
2) Compared to green bodies, the alumina ceramics with higher water absorption, higher porosity, and lower bulk density due to the removal of photosensitive resin. The water absorption and open porosity increased and the bulk density decreased with the increasing thermal treatment temperature both in green bodies and sintered ceramics. The shrinkage was different in three directions due to the layer-by-layer forming characteristic.
3) For γ-alumina, 1,500°C was considered as the optimal thermal treatment temperature, which could be used for prepare alumina ceramic slurries and fabricate green bodies through stereolithography based 3D printing technology. The alumina ceramics were obtained with a water absorption of 107%, open porosity of 91%, and bulk density of 0.67 g cm−3.
Data Availability Statement
All datasets generated for this study are included in the article/Supplementary Material.
Author Contributions
HL wrote the paper. YoL revised this paper. YaL, QZ, and JL assisted in finishing the work.
Funding
This work was supported by National Key Research and Development Program of China (No. 2018YFB1106600), the Chinese National Foundation for Natural Sciences under Contracts (No. 51672217), and the Research Fund of the State Key Laboratory of Solidification Processing (Grant No. 120-TZ-2015).
Conflict of Interest
The authors declare that the research was conducted in the absence of any commercial or financial relationships that could be construed as a potential conflict of interest.
Supplementary Material
The Supplementary Material for this article can be found online at: https://www.frontiersin.org/articles/10.3389/fmats.2019.00295/full#supplementary-material
References
Bae, C. J., Kim, D., and Halloran, J. W. (2019). Mechanical and kinetic studies on the refractory fused silica of integrally cored ceramic mold fabricated by additive manufacturing. J. Eur. Ceramic Soc. 39, 618–623. doi: 10.1016/j.jeurceramsoc.2018.09.013
Baldacchini, T., Zimmerley, M., Kuo, C. H., Potma, E. O., and Zadoyan, R. (2009). Characterization of microstructures fabricated by two-photon polymerization using coherent anti-stokes Raman scattering microscopy. J. Phys. Chem. B 113, 12663–12668. doi: 10.1021/jp9058998
Cendrowicz, A. M., and Welch, S. T. Ceramic Core for an Investment Casting Process. Great Britain: Ross Ceramics Ltd. U.S. Patent Application 15/879, 527 (accessed August 2, 2018).
Chen, Z., Li, D., and Zhou, W. (2012). Process parameters appraisal of fabricating ceramic parts based on stereolithography using the Taguchi method. Proc. Inst. Mech. Eng. Part B J. Eng. Manuf. 226, 1249–1258. doi: 10.1177/0954405412442607
Chen, Z., Li, D., Zhou, W., and Wang, L. (2010). Curing characteristics of ceramic stereolithography for an aqueous-based silica suspension. Proc. Inst. Mech. Eng. Part B J. Eng. Manuf. 224, 641–651. doi: 10.1243/09544054JEM1751
Chen, Z., Li, Z., Li, J., Liu, C., Lao, C., Fu, Y., et al. (2018). 3D printing of ceramics: a review. J. Eur. Ceramic Soc. 39, 661–687. doi: 10.1016/j.jeurceramsoc.2018.11.013
Dong, Y., Bu, K., Dou, Y., and Zhang, D. (2011). Determination of interfacial heat-transfer coefficient during investment-casting process of single-crystal blades. J. Mater. Process. Technol. 211, 2123–2131. doi: 10.1016/j.jmatprotec.2011.07.012
Franks, G. V., and Meagher, L. (2003). The isoelectric points of sapphire crystals and alpha-alumina powder. Colloids Surf. A Physicochem. Eng. Aspects 214, 99–110. doi: 10.1016/S0927-7757(02)00366-7
Furutani, M., Kobayashi, H., Gunji, T., Abe, Y., and Arimitsu, K. (2015). Base-amplifying silicone resins with photobase-generating side chains and their application to negative-working photoresists. J. Polym. Sci. Part A Polym. Chem. 53, 1205–1212. doi: 10.1002/pola.27551
Gold, S. A. Resin for Production of Porous Ceramic Stereolithography and Methods of Its Use. New York, NY: General Electric Company. U.S. Patent Application 15/634, 165 (accessed December 27, 2018).
Halloran, J. W. (2016). Ceramic stereolithography: additive manufacturing for ceramics by photopolymerization. Annu. Rev. Mater. Res. 46, 19–40. doi: 10.1146/annurev-matsci-070115-031841
Hirschauer, B., Söderholm, S., Chiaia, G., and Karlsson, U. O. (1997). Highly oriented α-alumina films grown by pulsed laser deposition. Thin Solid Films 305, 243–247. doi: 10.1016/S0040-6090(97)00151-X
Hoflund, G. B., and Minahan, D. M. (1996). Ion-beam characterization of alumina-supported silver catalysts used for ethylene epoxidation. Nucl. Instr. Methods Phys. Res. Sect. B Beam Interact. Mater. Atoms 118, 517–521. doi: 10.1016/0168-583X(96)00254-6
Hyuk-Joon, Y., Jin, W. J., Iu, T. K., and Kug, S. H. (1999). Temperature formation of alpha-alumina by doping of an alumina sol. J. Colloid Interf. Sci. 211, 110–113. doi: 10.1006/jcis.1998.5977
Kadleiková, M., Breza, J., and Veselý, M. (2001). Raman spectra of synthetic sapphire. Microelectr. J. 32, 955–958. doi: 10.1016/S0026-2692(01)00087-8
Kim, C. S., Kim, H. J., Cho, J. R., Park, S.-H., and Ha, M.-Y. (2016). Manufacturing and mechanical evaluation of cooled cooling air (CCA) heat exchanger for aero engine. Int. J. Precis. Eng. Manuf. 17, 1195–1200. doi: 10.1007/s12541-016-0143-4
Kortov, V., Zvonarev, S., Kiryakov, A., and Ananchenko, D. (2016). Carbothermal reduction synthesis of alumina ceramics for luminescent dosimetry. Mater. Chem. Phys. 170, 168–174. doi: 10.1016/j.matchemphys.2015.12.035
Legros, C., Carry, C., Bowen, P., and Hofmann, H. (1999). Sintering of a transition alumina: effects of phase transformation, powder characteristics and thermal cycle. J. Eur. Ceramic Soc. 19, 1967–1978. doi: 10.1016/S0955-2219(99)00016-3
Lukin, E. S., Popova, N. A., and Zdvizhkova, N. I. (1993). A strong ceramic based on aluminum oxide and zirconium dioxide. Glass Ceramics 50, 402–407. doi: 10.1007/BF00683587
Mao, W. G., Shen, Y. G., and Lu, C. (2011). Deformation behavior and mechanical properties of polycrystalline and single crystal alumina during nanoindentation. Scripta Mater. 65, 127–130. doi: 10.1016/j.scriptamat.2011.03.022
Mariotto, G., Cazzanelli, E., Carturan, G., Di Maggio, R., and Scardi, P. (1990). Raman and X-ray diffraction study of boehmite gels and their transformation to α-or β-alumina. J. Solid State Chem. 86, 263–274. doi: 10.1016/0022-4596(90)90142-K
Mirjalili, F., Hasmaliza, M., and Abdullah, L. C. (2010). Size-controlled synthesis of nano α-alumina particles through the sol–gel method. Ceramics Int. 36, 1253–1257. doi: 10.1016/j.ceramint.2010.01.009
Popoola, P., Farotade, G., Fatoba, O., and Popoola, O. (2016). Laser Engineering Net Shaping Method in the Area of Development of Functionally Graded Materials (FGMs) for Aero Engine Applications-A Review[M]//Fiber Laser. Vienna: IntechOpen.
Reyes-López, S. Y., Acuña, R. S., López-Juárez, R., and Rodríguez, J. S. (2013). Analysis of the phase transformation of aluminum formate Al (O2CH) 3 to α-alumina by Raman and infrared spectroscopy. J. Ceramic Process. Res. 14, 627–631. Available online at: https://www.researchgate.net/publication/260943186_Analysis_of_the_phase_transformation_of_aluminum_formate_AlO2CH3_to_a-alumina_by_Raman_and_infrared_spectroscopy
Rogach, A. L., Kotov, N. A., Koktysh, D. S., Ostrander, J., and Ragoisha, G. A. (2000). Electrophoretic deposition of latex-based 3D colloidal photonic crystals: a technique for rapid production of high-quality opals. Chem. Mater. 12, 2721–2726. doi: 10.1021/cm000274l
Sainz, M. A., Serrano, F. J., Amigo, J. M., Bastida, J., and Caballero, A. (2000). XRD microstructural analysis of mullites obtained from kaolinite–alumina mixtures. J. Eur. Ceramic Soc. 20, 403–412. doi: 10.1016/S0955-2219(99)00183-1
Salmoria, G. V., Klauss, P., Pires, A. T. N., Roeder, J., and Soldi, V. (2008). Investigations on cure kinetics and thermal degradation of stereolithography Renshape™ 5260 photosensitive resin. Polym. Test. 27, 698–704. doi: 10.1016/j.polymertesting.2008.05.008
Salpingidou, C., Tsakmakidou, D., Vlahostergios, Z., Misirlis, D., Flouros, M., Yakinthos, K., et al. (2018). Analysis of turbine blade cooling effect on recuperative gas turbines cycles performance. Energy 164, 1271–1285. doi: 10.1016/j.energy.2018.08.204
Uysal, S. C., Liese, E., Nix, A. C., and Black, J. (2018). A thermodynamic model to quantify the impact of cooling improvements on gas turbine efficiency. J. Turbomachin. 140:031007. doi: 10.1115/1.4038614
Wang, J. C., and Dommati, H. (2018). Fabrication of zirconia ceramic parts by using solvent-based slurry stereolithography and sintering. Int. J. Adv. Manuf. Technol. 98, 1537–1546. doi: 10.1007/s00170-018-2349-3
Wen, H. L., Chen, Y. Y., Yen, F. S., and Huang, C.-Y. (1999). Size characterization of θ-and α-Al2O3 crystallites during phase transformation. Nanostruct. Mater. 11, 89–101. doi: 10.1016/S0965-9773(99)00022-7
Williams, J. C. (2017). “Aero engine materials,” in Aerospace Materials and Applications, ed B. N. Bhat (Reston, VA: American Institute of Aeronautics and Astronautics, Inc.), 579.
Xiao, G., and Huang, Y. (2016). Equivalent self-adaptive belt grinding for the real-R edge of an aero-engine precision-forged blade. Int. J. Adv. Manuf. Technol. 83, 1697–1706. doi: 10.1007/s00170-015-7680-3
Yoshida, K., Amemiya, T., Yamada, S., and Nakagawa, M. (2018) Photosensitive Resin Composition, Method for Producing Cured Film, Cured Film, Liquid Crystal Display Device, Organic Electroluminescent Display Device, Touch Panel. Tokyo: Fujifilm Corporation. U.S. Patent Application 15/442, 935 (accessed June 15, 2017).
Zhang, K., He, R., Xie, C., Wang, G., Ding, G., Wang, M., et al. (2019). Photosensitive ZrO2 suspensions for stereolithography. Ceramics Int. 45, 12189–12195. doi: 10.1016/j.ceramint.2019.03.123
Keywords: stereolithography, alumina, temperature, shrinkage, three-dimensional
Citation: Li H, Liu Y, Liu Y, Zeng Q and Liang J (2019) Thermal Treatment of γ-Al2O3 for the Preparation of Stereolithography 3D Printing Ceramic Slurries. Front. Mater. 6:295. doi: 10.3389/fmats.2019.00295
Received: 22 July 2019; Accepted: 01 November 2019;
Published: 19 November 2019.
Edited by:
John L. Provis, University of Sheffield, United KingdomCopyright © 2019 Li, Liu, Liu, Zeng and Liang. This is an open-access article distributed under the terms of the Creative Commons Attribution License (CC BY). The use, distribution or reproduction in other forums is permitted, provided the original author(s) and the copyright owner(s) are credited and that the original publication in this journal is cited, in accordance with accepted academic practice. No use, distribution or reproduction is permitted which does not comply with these terms.
*Correspondence: Yongsheng Liu, yongshengliu@nwpu.edu.cn; Qingfeng Zeng, qfzeng@nwpu.edu.cn