Dynamic Wetting of Molten Polymers on Cellulosic Substrates: Model Prediction for Total and Partial Wetting
 Monica Francesca Pucci
 Benoît Duchemin
 Moussa Gomina1
  Joël Bréard
- 1CRISMAT, UMR 6508 CNRS, ENSICAEN, Caen, France
- 2LOMC, UMR 6294 CNRS, Normandie Univ ULH, Le Havre, France
This work consists in an experimental investigation of forced dynamic wetting of molten polymers on cellulosic substrates and an estimation of models describing this dynamic. A previous work of Pucci et al. (2018) showed that for totally wetting liquids (as paraffin oils), temperature-induced variations in dynamic wetting are included into the capillary number (Ca) and then a master curve of dynamic contact angle (θd) as a function of Ca can be obtained. The hydrodynamic theory (HDT) correctly describes the dynamic wetting for Ca>2·10−3. For lower Ca, a change in the dynamic wetting behavior was observed. Here, partially wetting liquids (polyethylene glycols, a.k.a. PEGs) at different molecular weight (Mn) were used at temperatures above their melting point to investigate the dynamic wetting behavior on cellulosic substrates for a large range of Ca. It was found that the dynamic curves of θd vs. Ca depend on Mn. Moreover, the HDT correctly describes the experimental measurements for Ca>2·10−3. Below this threshold the dynamic contact angle decreases toward the static one. A linear correlation between parameters obtained fitting the HDT and the molecular weight of polymer was found. The prediction of dynamic wetting for low Ca (Ca < 2·10−3) with the molecular kinetic theory (MKT) was also evaluated and discussed.
1. Introduction
Dynamic wetting occurs in many everyday situations, when water flows on a floor tile or pearl on a plant leaf for example. It concerns different industrial domains and among them, composite manufacturing (Bréard et al., 2003; Verrey et al., 2006; Park et al., 2011; Pucci et al., 2015, 2017b; Caglar et al., 2019). In this case, the flow of a molten polymer in a fibrous preform is governed by a competition of capillary and viscous effects that are included in the dimensionless capillary number Ca (Ruiz et al., 2006):
where v is the liquid velocity, η and γLV are the dynamic viscosity and the liquid surface tension, respectively. Dynamic wetting phenomena are described by a dynamic contact angle θd depending on the Ca. Forced dynamic wetting occurs when the liquid velocity v is set via an external force, in contrast to the spontaneous wetting where only capillary effects drive the flow (Sauer and Kampert, 1998; Mohammad Karim et al., 2016). In all cases, θd is defined as an advancing contact angle (θa), when the triple contact line advances on the dry solid surface with a positive convention of v and Ca, or a receding contact angle (θr) when it recedes from the wetted surface with a negative convention of v and Ca (De Gennes et al., 2013). For v≈0 m/s (at static conditions) the angle formed between the liquid and the solid is defined by an equilibrium contact angle (θe), according to the Young's law, for ideal substrates (Pucci et al., 2017a). In fact, substrates have morphological defects and chemical heterogeneities generating an angle hysteresis and at v≈0 m/s the equilibrium contact angle will be between a static advancing contact angle θa, s and a static receding one θr, s (Petrov et al., 2003; Bonn et al., 2009; Pucci et al., 2017a). Depending on the equilibrium or static contact angle, liquids can be classified as totally wetting (e.g., paraffin and silicon oils), for which the θe is ≈0° and as partially wetting (e.g., polyethylene glycols), when the θe is different from 0°.
In literature, to the best of our knowledge, the majority of experimental works investigated the dynamic wetting using totally wetting liquids and via a visual method, observing the spontaneous spreading of a drop (the speed of the liquid front is not constant), especially at room temperature (Tanner, 1979; Schneemilch et al., 1998; Prevost et al., 1999; Le Grand et al., 2005; Kumar and Deshpande, 2006; Seveno et al., 2009; Duursma et al., 2010; Duvivier et al., 2011). Some works using microfluidic techniques proved that, with partially wetting liquids, established models in literature are no longer valid (Wielhorski et al., 2012; Abdelwahed et al., 2014). A recent work studied molten polymers but in a spontaneous regime of drop spreading (Zhang et al., 2017). This procedure has been applied to rods or fibers with a large diameter (Zhang et al., 2019) but it turns out to be more difficult for thinner fibers (Hansen et al., 2017). Moreover, this method is not suitable to study the forced wetting at a specific range of Ca, since the liquid velocity v is not imposed but it depends on the liquid and on the spontaneous solid/liquid interactions.
In this work, a procedure easily applicable to different types of substrates and fibers and at different conditions of temperature and liquid viscosity was carried out at a large range of Ca, using the weight tensiometric method. This method, based on the Wilhelmy principle, becomes more interesting for studying forced wetting under different conditions for total and partial wetting, imposing the liquid velocity and in both advancing and receding modes (Pucci et al., 2018). Polyethylene glycols, a.k.a. PEGs, at different molecular weight (Mn) were characterized in terms of surface tension and viscosity as a function of temperature and used for tensiometric tests of forced wetting on cellulosic substrates having a very low roughness (<<100 nm) and with an homogeneous chemical composition of surface (Pucci et al., 2018), in order to validate this protocol. Results are then relevant for a better understanding of dynamic wetting behavior of molten polymers and to estimate the prediction of this behavior by existing models in literature. A discussion about models validity, the obtained physical parameters and their sensitivity deriving from experimental results is then presented. Moreover, the experimental protocol could be directly applied to study the dynamic wetting of these molten polymers on fibers.
2. Models of Forced Wetting: HDT vs. MKT
Two approaches are mostly used in literature to describe the dynamic wetting. The hydrodynamic theory (HDT) takes into account the viscous dissipation at the core of the liquid, far from the triple contact line. This approach describes forced dynamic wetting for high Ca (Ca > 10−3) at a macro-mesoscopic scale (in the order of mm-μm) where the unbalanced driving capillary force is equilibrated by the friction one (De Gennes, 1985). From this viscocapillary balance, the Tanner-De Gennes law was derived and then generalized by Cox and Voinov (C-V), obtaining the following equation (Cox, 1962; Voinov, 1976):
where xmax and xmin are two cutoff lengths employed to integer the energy dissipation. xmax was estimated by De Gennes (De Gennes et al., 2013) in the order of the capillary length k−1 (≈10−3 m), beyond which capillary effects are not meaningful, xmin is around a characteristic molecular size (≈10−9 m). The capillary length is defined as follows:
where ρ is the liquid density and g the acceleration of gravity. The Γ value is indeed defined as :
Two free parameters have to be identified in this approach (Equation 2): Γ and θe. Γ seems to be exclusively a characteristic of liquid properties according to the hydrodynamic approach, and experimental studies found a range of Γ approximately between 10 and 20 for total wetting liquids (De Gennes, 1985; Marsh et al., 1993; Bonn et al., 2009). However, the physical significance of Γ and particularly of the xmin was questioned, because this value was sometimes found to be less than atomic or molecular dimensions (Schneemilch et al., 1998; Petrov et al., 2003). For total wetting, the equilibrium contact angle can be set to 0 and then Γ is the only free parameter in the HDT. It was proven in a previous work (Pucci et al., 2018) with totally wetting liquids that this theory describes well dynamic wetting for Ca > 2·10−3 at different temperatures. In fact the effect of temperature is included in the Ca and physical parameters of Γ were found. Open issues remain about the dynamic behavior of totally wetting liquids at low Ca; the prediction with the MKT will be discussed in this work. For partial wetting, the static contact angles were measured and inserted in models predicting forced dynamic wetting, in order to have also in this case only one free parameter (Γ). The prediction with HDT and MKT will also be discussed.
The molecular kinetic theory (MKT) investigates dynamic wetting for low Ca at a microscopic scale (in the order of nm). The unbalanced driven capillary force is here equilibrated by a microscopic dissipation in the vicinity of the contact line (Snoeijer and Andreotti, 2013). Contact line motion is a thermally activated process, described by molecular displacements characterized by a jump length λ (of the order of nm) and a quasi-equilibrium displacement frequency k0 (of the order of 106 Hz) between adsorption sites of the solid surface (Blake and Haynes, 1969). Liquid velocity v is defined as follows:
where T is the absolute temperature [K] and kB is the Boltzmann constant, equal to 1.3806·10−23 J K−1. From a linear approximation for which sinh(x) ≈ x this equation becomes:
In this approach the free parameters are: θe, λ, and k0 (Ranabothu et al., 2005). Another simplified form of this equation can be written considering very small angles, for which and, as a consequence, a polynomial function is obtained:
The term in the Equations (6) and (7) was defined by Blake and De Coninck (Blake and De Coninck, 2002) as a contact line friction ξ and was related to the work of adhesion, as follows:
where vL is the molecular flow volume and Wa is the work of adhesion:
Then, if we replace the contact line friction in the linear (Equation 6) and in the simplified (Equation 7) equations, and we want to define the contact angles as a function of the capillary number, the equations become the followings:
It is interesting to note that, contrarily to the previous expressions (Equations 5–7) where free parameters were three (θe, k0, and λ) now, if θe is known, there will be only one free parameter (ξ), as in the HDT. Moreover, if vL can be determined, λ could be determined and then k0 (Equation 8). Another important observation has to be made about the polynomial form of MKT for very small angles (Equation 11): this equation is very similar to the HDT law proposed by Cox-Voinov (Equation 2), but with exponent 2 vs. 3 for the HDT.
The predictions of these models for totally and partially wetting liquids at different temperature and viscosity conditions were here evaluated.
3. Materials and Methods
3.1. Materials
3.1.1. Cellulosic Films
Cellulosic films, referenced as NatureFlex™ 23 NP and provided by Innovia films®, were used in this study. They were chosen as model substrates to analyse the wetting of plant fibers. Surface characterization of these films has been carried out in a previous work (Pucci et al., 2018). Before wetting tests, cellulosic films were immersed for 1 h in ethanol, to remove the glycerol on surface that had the function of plasticizer, and then they were ambient air-dried (23°C, 50% RH). To be able to carry out dynamic wetting tests (controlled liquid immersion and removal) on these films of thickness 23 μm while avoiding buckling when the sample touches the liquid, films of length 20 mm (along the immersion axis) and width 10 mm were used (Pucci et al., 2018).
3.1.2. Polymers
Polymers used to perform partial wetting tests in dynamic mode were three polyethylene glycols (PEGs). PEGs were chosen due to their large availability at different molecular weight and their quite low melting point. The first one with a molecular weight of 1450 g/mol (PEG1450) was provided by ACROS ORGANICS (ref. 418040010), its melting point was at 44−48°C. The second one with a molecular weight of 3,350 g/mol (PEG3350) was from DOW (ref. 19760), its melting point was at 53−57°C. The third one with a molecular weight of 10,000 g/mol (PEG10000) was from ALFA AESAR (ref. 10200251), its melting point was at 58−63°C. Their surface tension and viscosity beyond the melting point were measured as a function of temperature (sections 3.2.1, 3.2.2). Paraffin oil used to study the total wetting was provided by ACROS ORGANICS (ref. 171400010). Its melting point was at −24°C. Major details are reported in the previous work (Pucci et al., 2018).
3.2. Methods
3.2.1. Rheological Tests
A Physica MCR 501 rheometer from Anton Paar was used to measure viscosity of PEGs as a function of temperature. The used geometry was a standard cone/plate system with a 50 mm diameter, a 1° cone angle and a cone truncation of 50 μm. Preliminary tests were conducted varying the shear rate, assuring that liquids can be considered as Newtonian fluids at the tested conditions of dynamic wetting (Lu et al., 2016). Then, the shear rate was fixed at 100 s−1 and the temperature rate was set at 0.01 °C/s. Two rheological measurements for each liquid were performed in order to verify the repeatability.
3.2.2. Pendant and Sessile Drop Tests
A Krüss DSA100 tensiometer equipped with a thermalized syringe (DO3241) and a high temperature chamber (TC21) was used to measure surface tension of PEGs via the pendant drop method. This visual method permits measuring surface tension of liquids at very high temperatures (up to 400°C) (Berry et al., 2015), that is relevant for molten polymers. Knowing the needle diameter (it was of 1.65 mm in this study) and the liquid density, surface tension is determined from the fit of the pendant drop profile (Figure 1A) with the Laplace equation integrated in the Drop Shape Analysis 1.92.1.1 software (Song and Springer, 1996a,b). To determine liquid density at each test temperature, images of sessile drop on a microscope glass slide were acquired (Figure 1B) to obtain the volume of drop (this is also implemented in the software of DSA100) and each drop mass was measured. Test temperatures were 65, 75, 85, 95, and 105 °C. Three sessile drop tests were carried out to measure density and ten pendant drop tests to determine surface tension for each of these temperatures, in order to have reliable trend of surface tension vs. temperature. Supplementary details of this procedure are reported in Pucci et al. (2018).
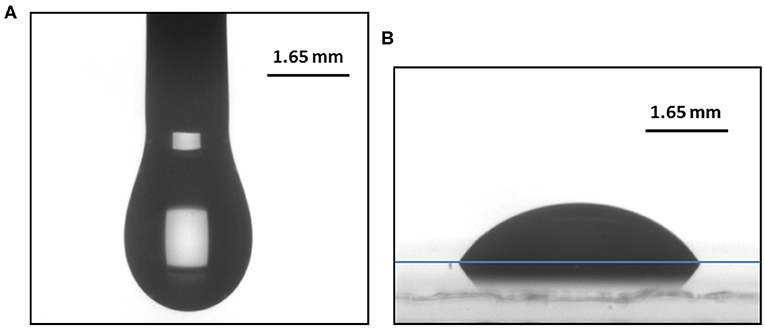
Figure 1. (A) Pendant drop of PEG10000 at T = 95°C. (B) Sessile drop of PEG10000 at 95°C on a microscope glass slide.
3.2.3. The Wilhelmy Method: Spontaneous and Forced Wetting
A Krüss K100SF tensiometer with a temperature generator and control unit was used to perform dynamic wetting tests with cellulosic films and PEGs. Polymers were heated in the tensiometer up to the highest temperature that can be achieved with this set-up: T = 75°C, i.e., above the melting point.
In order to measure a static contact angle, that is ideally the apparent equilibrium contact angle (θe), tensiometric tests of spontaneous wetting were performed. The vessel containing the molten polymer raises at a constant velocity until the detection of the film surface. At this moment, a meniscus is spontaneously formed on the perimeter of the film (the wetted length p), resulting in an increase of the liquid mass m that is recorded by the tensiometer. This increase occurs up to a constant value that defines the static condition of meniscus (equilibrium condition). Therefore, this mass can be used in the Wilhelmy equation to determine a static contact angle:
where F is the capillary force.
Figure 2 shows curves recorded by the tensiometer of spontaneous wetting on cellulosic substrates for PEG1450, 3350, and 10000. It is possible to observe that the time to reach the static condition (achieving a constant value of meniscus mass) increases with Mn. However, after 120 s static conditions were achieved for all PEGs.
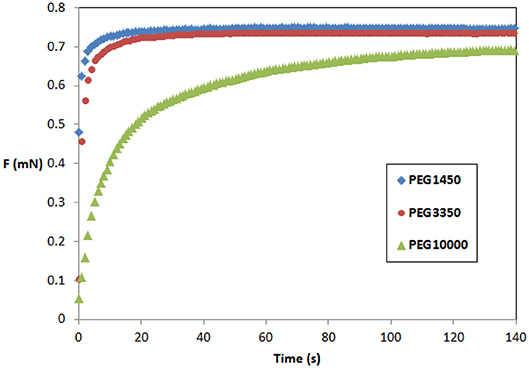
Figure 2. Spontaneous dynamic wetting curves obtained at the tensiometer.
To determine dynamic contact angles θd, forced wetting was also performed at the K100SF tensiometer. Different velocities were imposed for immersion and withdrawal of cellulosic film in liquid, from 0.1 to 500 mm/min, in order to obtain experimental measurements in a large range of capillary numbers. Cellulosic film was first immersed in the liquid vessel by the upward motion of the latter (advancing mode), then it was maintained at this position for 120 s (static advancing mode), and finally it was withdrawn from the bath up to the initial position (receding motion). Further details of test are described in Pucci et al. (2018). Buoyancy correction was neglected here (Pucci et al., 2017a). At very low velocities it can occur that the force referring to the static contact angle does not differ from the advancing and receding ones (as in Figure 3). Figure 3 shows a forced wetting test for PEG1450 on the cellulosic film at v= 0.5 mm/min. This static condition was then used to determine a static contact angle from forced wetting tests. Moreover, since the hysteresis is ≈0, this confirms that substrates can be approximated as ideal, that means physico-chemically homogeneous (Schneemilch et al., 1998).
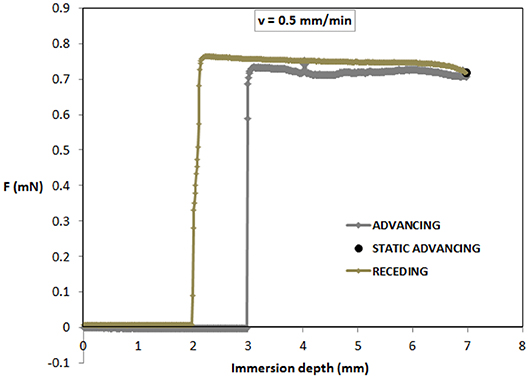
Figure 3. Forced dynamic wetting curve for PEG1450 on cellulosic film at v= 0.5 mm/min.
Mean values of capillary forces obtained at the tensiometer in the advancing, static and receding modes were used to find the advancing and receding contact angles by means of the Wilhelmy equation (Equation 12). Static contact angles obtained by the spontaneous wetting and the forced one at the lowest velocity were compared. These values can be inserted into models predicting dynamic wetting, in order to reduce the number of free parameters to fit.
4. Results and Discussion
4.1. Liquid Viscosity and Surface Tension
Viscosity was measured as a function of temperature from T = 70°C (above the melting point) to 90°C. Figure 4 shows results of experimental semi-logarithmic curves obtained by using the rheometer for the three PEGs as a function of 1/T. As expected, the higher molecular mass PEG has the highest viscosity. The dependence of viscosity on temperature is exponential and well described by the Arrhenius law.
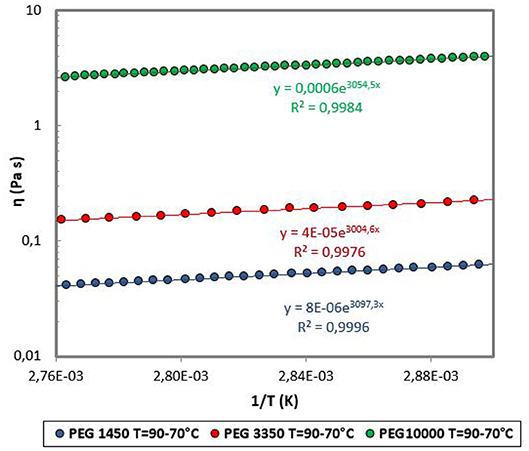
Figure 4. Viscosity as a function of 1/T for PEGs.
About surface tension determination, images of pendant and sessile drops were acquired at different temperatures and Figure 5 shows surface tension as a function of temperature. The surface tension decreases linearly as a function of temperature, according to the law of Eötvös (Sauer and Dipaolo, 1991; Grundke et al., 1996). Moreover, surface tension is higher for PEG with highest molecular weight. Another important observation is that the difference in surface tension due to Mn is more significant as temperature increases (Moreira and Demarquette, 2001).
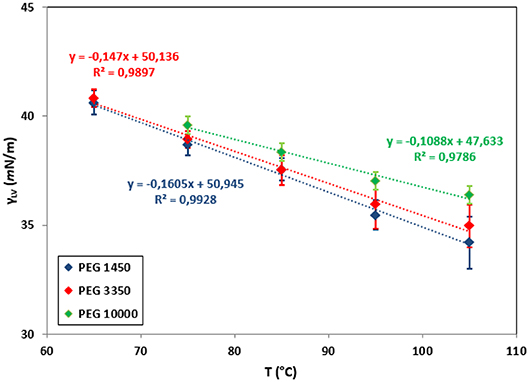
Figure 5. Surface tension as a function of temperature for PEGs.
Viscosities, densities and surface tensions values obtained for the PEGs at T = 75°C are given in Table 1. Comparing with paraffin oil used in a previous work at T = 75°C (Pucci et al., 2018), it is possible to observe that the range of viscosity is significantly different for PEGs, due to the molecular weight. The surface tension of PEGs is also higher than for paraffin oil, due to the fact that they are partially wetting liquids.
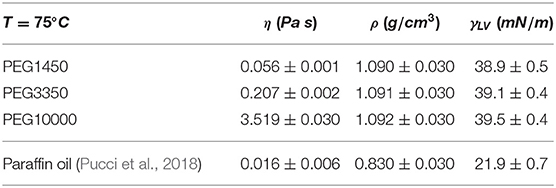
Table 1. Viscosity, density, and surface tension of polymers at T = 75°C.
4.2. Static Contact Angle
In order to determine a static contact angle from spontaneous wetting curves, the constant force value achieved at static conditions (beyond a hold for 120 s) was inserted into the Wilhelmy equation (Equation 12). In parallel, tensiometric curves of forced wetting with the lowest velocity were used to obtain the mass of meniscus in the static condition, 120 s after the advancing and just before the receding (as shown in Figure 3). The Wilhelmy equation was also used in this case. Table 2 shows static contact angle values obtained with both methods, from the spontaneous and the forced wetting. Values correspond to an average with a standard deviation over three measurements.
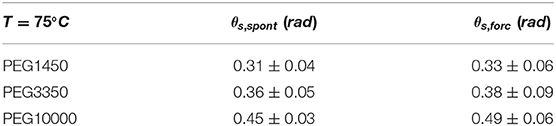
Table 2. Comparison of static contact angles obtained in spontaneous and forced wetting modes with PEGs at T = 75°C.
The two sets of values obtained with the two methods are in agreement. The angles obtained for the forced wetting are slightly higher due to the dependence on velocity, that makes them quasi-static contact angles or static advancing contact angles (Pucci et al., 2017b). Values obtained in the spontaneous configuration were then used as θe in models predicting dynamic wetting.
4.3. Advancing and Receding Contact Angles
The advancing and receding contact angles were determined according to the Wilhelmy principle as a function of the immersion and withdrawal velocity. Figure 6 shows the results obtained for PEGs at T = 75°C on cellulosic films at different velocities.
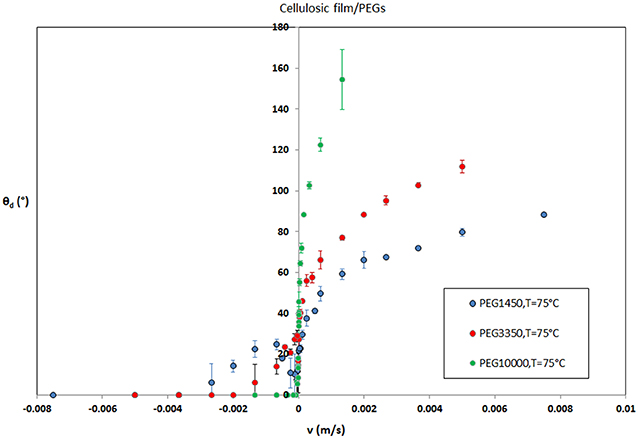
Figure 6. Dynamic contact angles as a function of the immersion and withdrawal velocity.
The advancing contact angle increases when the velocity of immersion is increased (Petrov et al., 2003). Moreover, for a given velocity, the larger the Mn of PEG, the higher the advancing contact angle. These results also correlate with higher viscosity and higher surface tension for large Mn, which implies a higher Ca (Equation 1). Therefore, it is relevant to further discuss the results as a function of the Ca (sections 4.4, 4.5).
On the other hand, the receding contact angle decreases when the withdrawal velocity increases, and at a given velocity, this parameter also decreases when Mn is increased. Moreover, for each polymer, there is a transition from partial to total wetting. This transition was reported in literature (Brochard-Wyart and De Gennes, 1992; Maleki et al., 2007, 2011). In this study, it appears that the transition occurs at lower velocity when Mn is higher. Modeling of dewetting was not carried out, but this issue could be addressed in future works. The prediction of advancing contact angle with the HDT and the MKT was then undertaken for PEGs and compared with the behavior of totally wetting liquids at different temperatures (i.e., paraffin oil Pucci et al., 2018).
4.4. HDT Prediction
To fit with models the experimental data of advancing contact angle as a function of Ca, parameters such as the capillary length k−1 and the ratio of viscosity on surface tension (η/γLV) were determined for each polymer. These parameters are compared with those of paraffin oil (Pucci et al., 2018) in Table 3.
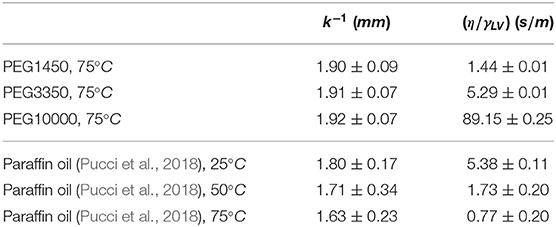
Table 3. Capillary length and viscosity to surface tension ratio for polymers.
For paraffin oils it has been proven in Pucci et al. (2018) that the HDT fits well the experimentally measured values of contact angles for Ca>2·10−3. In the same way, fits of experimental data for PEGs with Cox-Voinov law were carried out, imposing the measured static contact angle, in order to estimate the free parameter Γ. In addition, an analysis was undertaken to assess the sensitivity of Γ to the parameters determined experimentally. It was carried out in terms of the number of measurements of contact angles (N points in Figure 7, referring to the average values over three measurements) and Ca for each PEG, starting from the lowest Ca value and expanding to the higher values, then in the opposite direction. Histograms in Figure 7 show results of sensitivity analysis: the bars indicate the Γ values and the gray triangles represent the coefficients of determination (COD) R2. For all PEGs, we note that when Ca increases (graphs on the left side in Figure 7), Γ decreases continuously while COD increases from a low value (around 0.6 for Ca = 7·10−5 in the case of PEG1450) to reach a plateau of around 0.99 beyond Ca = 2·10−3 (case of PEG1450). Here we find the transition threshold mentioned above for paraffins. This threshold is more difficult to determine for PEG3350 and PEG10000, but the Ca = 2·10−3 is well at the limit of the zones of strong variation of R2. When Ca is varied from high values to low values (Figure 7—right side), the variation of Γ is much less pronounced than in the previous mode. For PEG1450 high and stable values of R2 are observed for Ca>2·10−3. The threshold is difficult to detect on the graphs of PEG3350 and PEG10000. However, the Γ value is stable and lower in the same range for all Mn values. Therefore, results confirm that this threshold is valid for totally and partially wetting polymers and at different temperatures. The HDT, and particularly Cox-Voinov (C-V) law, fits well forced wetting behavior for Ca>2·10−3, in agreement with results found in literature (Petrov et al., 2003).
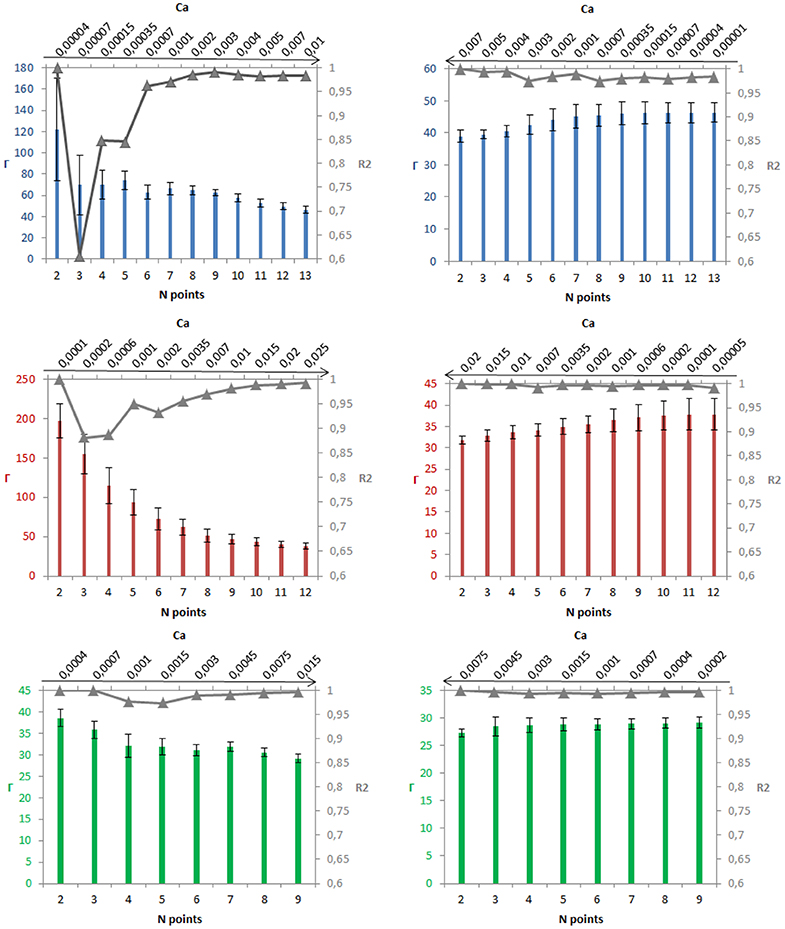
Figure 7. Sensitivity of Γ for PEG1450 (blue), PEG3350 (red), and PEG10000 (green): from the lowest Ca to the highest one (left); from the highest Ca to the lowest one (right).
Figure 8 shows experimental results of θd vs. Ca and HDT prediction for Ca>2·10−3. This graph shows well the difference between total and partial wetting (paraffin oil vs. PEGs). Paraffin oil at different temperatures is well-predicted by Cox-Voinov law for Ca>2·10−3 and a master curve was found (Pucci et al., 2018). Below the threshold, at low Ca, a change in slope occurs. For PEGs, fit curves are different as a function of Mn and well predict wetting behavior for Ca>2·10−3. At low Ca the θa tends to the static contact angle. Anyway, for all polymers a change of behavior was observed at the threshold of Ca = 2·10−3.
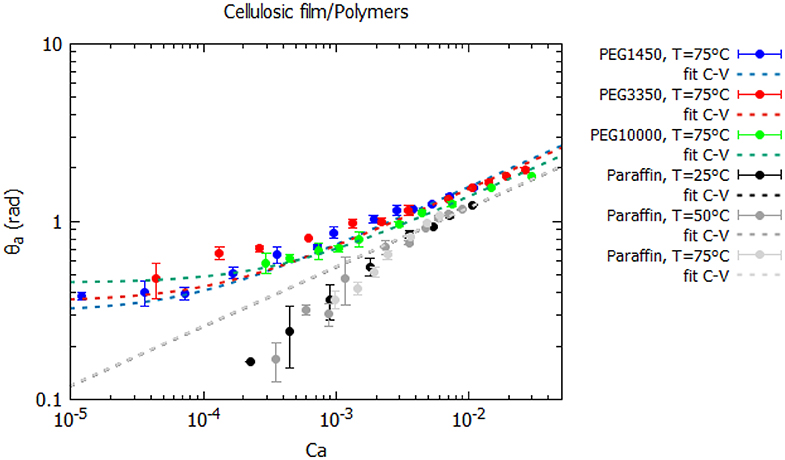
Figure 8. θa as a function of Ca for polymers at different temperatures on cellulosic films and prediction of Cox-Voinov law.
Γ and R2 values derived from the fits with imposed static contact angles for the PEGs are compared to previous results measured for paraffins (Pucci et al., 2018) at different temperatures in Table 4. Γ for paraffin oil was found to be consistent with estimated values from the molecular sizes (Pucci et al., 2018) and not dependent on temperature. For PEGs, the sizes of macromolecules depend on Mn and estimating xmin (in Equation 4) is a difficult question. However, Γ decreases with the increase of Mn, suggesting an increase of xmin.
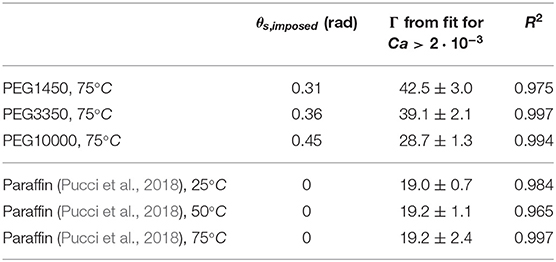
Table 4. Obtained parameters from HDT fit at high Ca for partially and totally wetting polymers.
Figure 9 shows the diminution of Γ as a function of Mn, which seems to be well described by a linear law. Further works would focus on the application of HDT in the case of partially wetting polymers as well as the linear dependence of Γ to Mn and how to include these results in the models to predict dynamic wetting behavior.
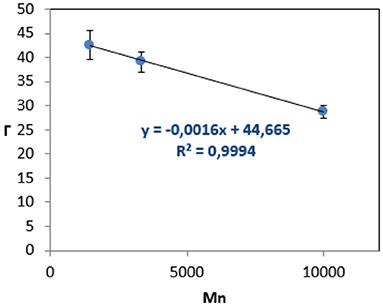
Figure 9. Γ obtained from the HDT fit for Ca>2·10−3 vs. Mn.
4.5. MKT Prediction
At low Ca (Ca < 2·10−3) the MKT was evaluated for total and partial wetting of polymers on cellulosic substrates. This theory may predict dynamic of wetting at a microscopic (or local) scale, considering microscopic contact angles (Petrov et al., 2003; Bonn et al., 2009).
In order to consider this theory for total wetting and particularly for paraffin, the static contact angle was assumed equal to 0 as in the case of the HDT. Regarding the dynamic contact angles, since the advancing contact angles at low velocity were found to be very small, the polynomial form of MKT (Equation 11) was applied to experimental data for Ca < 2·10−3. Figure 10 shows the results, indicating that for paraffin oil this law fits quite well the experimental data at different temperatures and at Ca < 2·10−3, allowing to obtain the coefficient of contact line friction ξ (Blake and De Coninck, 2002), shown in Table 5. The coefficient of contact line friction decreases as the temperature is increased, and then it is higher when the viscosity is higher, according to the literature (Zhang et al., 2017).
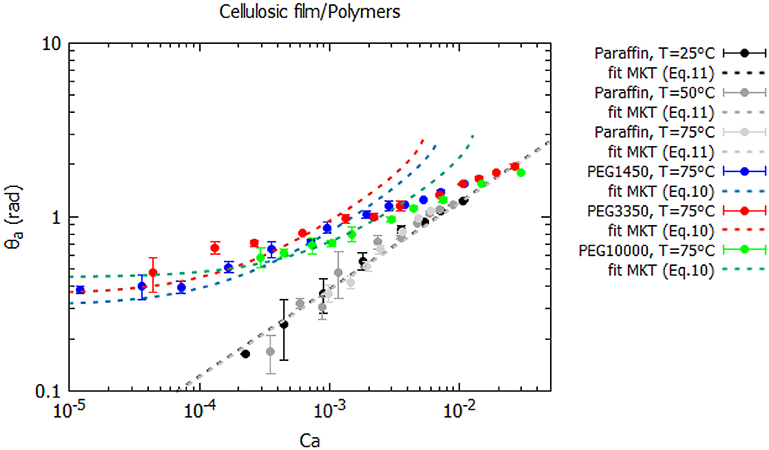
Figure 10. θa as a function of Ca for polymers at different temperatures on cellulosic films and prediction of MKT.
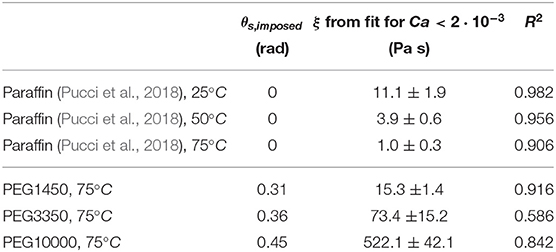
Table 5. Obtained parameters from MKT fit at low Ca for partially and totally wetting polymers.
Regarding the partial wetting with PEGs at low Ca, the assumption of very small contact angles does not hold, but the linear approximation of MKT (Equation 10) was used. Figure 8 shows the results of fit, indicating that the model do not predict well the wetting behavior of PEGs at low Ca, with aberrant results (ξ and R2 of fit are shown in Table 5). The reason could be related to the measurements of static contact angles that do not fulfill the MKT assumption of a microscopic contact angle. Measured values of apparent contact angles are better described by the HDT (Figure 8). However, further works should be carried out on the MKT and the meaning of microscopic contact angles, mainly with partially wetting liquids like molten polymers used for composites processing.
5. Conclusion
An experimental study of the forced dynamic wetting of molten polymers on cellulosic films was carried out, with comparisons to hydrodynamic and molecular kinetic models. The interest here was to test some conditions of wetting (low and high Ca at different T and Mn) and to find relevant parameters affecting the manufacturing of composites with a liquid resin, thermoset or thermoplastic. To the best of our knowledge, wetting with molten polymers is poorly known and little documented in literature. An experimental procedure was carried out to measure liquid properties and static and dynamic contact angles at different conditions. The results proved that HDT models can be applied to totally and partially wetting polymers for high Ca, but parameters found from models are surprising in the case of PEGs depending on the Mn. At low Ca, the total wetting can be described by the MKT because the contact angles are small, but this theory do not predict the dynamic behavior of partially wetting polymers. At low Ca for PEGs, the advancing contact angle decreases toward the static one and further analyses have to be developed, in order to establish new models describing this behavior. Reliable parameters of dynamic wetting could be then inserted into numerical models predicting flow processes.
Data Availability Statement
All datasets generated for this study are included in the article/supplementary material.
Author Contributions
All authors listed have made a substantial, direct and intellectual contribution to the work, and approved it for publication.
Funding
Authors would thank Bpifrance for the financial support in this study and the Depestele Group for providing materials.
Conflict of Interest
The authors declare that this study received funding from Bpifrance. The funder was not involved in the study design, collection, analysis, interpretation of data, the writing of this article or the decision to submit it for publication.
References
Abdelwahed, M. A. B., Wielhorski, Y., Bizet, L., and Bréard, J. (2014). Bubble formation and transport in t-junction for application to liquid composite molding: wetting effect. J. Compos. Mater. 48, 37–48. doi: 10.1177/0021998312467553
Berry, J. D., Neeson, M. J., Dagastine, R. R., Chan, D. Y., and Tabor, R. F. (2015). Measurement of surface and interfacial tension using pendant drop tensiometry. J. Colloid Interface Sci. 454, 226–237. doi: 10.1016/j.jcis.2015.05.012
Blake, T., and De Coninck, J. (2002). The influence of solid-liquid interactions on dynamic wetting. Adv. Colloid Interface Sci. 96, 21–36. doi: 10.1016/S0001-8686(01)00073-2
Blake, T., and Haynes, J. (1969). Kinetics of liquidliquid displacement. J. Colloid Interface Sci. 30, 421–423. doi: 10.1016/0021-9797(69)90411-1
Bonn, D., Eggers, J., Indekeu, J., Meunier, J., and Rolley, E. (2009). Wetting and spreading. Rev. Modern Phys. 81:739. doi: 10.1103/RevModPhys.81.739
Bréard, J., Henzel, Y., Trochu, F., and Gauvin, R. (2003). Analysis of dynamic flows through porous media. Part I: comparison between saturated and unsaturated flows in fibrous reinforcements. Polym. Compos. 24, 391–408. doi: 10.1002/pc.10038
Brochard-Wyart, F., and De Gennes, P. (1992). Dynamics of partial wetting. Adv. Colloid Interface Sci. 39, 1–11. doi: 10.1016/0001-8686(92)80052-Y
Caglar, B., Tekin, C., Karasu, F., and Michaud, V. (2019). Assessment of capillary phenomena in liquid composite molding. Compos. Part A Appl. Sci. Manufact. 120, 73–83. doi: 10.1016/j.compositesa.2019.02.018
Cox, B. (1962). On driving a viscous fluid out of a tube. J. Fluid Mech. 14, 81–96. doi: 10.1017/S0022112062001081
De Gennes, P.-G. (1985). Wetting: statics and dynamics. Rev. Modern Phys. 57:827. doi: 10.1103/RevModPhys.57.827
De Gennes, P.-G., Brochard-Wyart, F., and Quéré, D. (2013). Capillarity and Wetting Phenomena: Drops, Bubbles, Pearls, Waves. Springer Science & Business Media.
Duursma, G., Sefiane, K., and David, S. (2010). Advancing and receding contact lines on patterned structured surfaces. Chem. Eng. Res. Design 88, 737–743. doi: 10.1016/j.cherd.2009.10.004
Duvivier, D., Seveno, D., Rioboo, R., Blake, T., and De Coninck, J. (2011). Experimental evidence of the role of viscosity in the molecular kinetic theory of dynamic wetting. Langmuir 27, 13015–13021. doi: 10.1021/la202836q
Grundke, K., Uhlmann, P., Gietzelt, T., Redlich, B., and Jacobasch, H.-J. (1996). Studies on the wetting behaviour of polymer melts on solid surfaces using the wilhelmy balance method. Colloids Surf. A 116, 93–104. doi: 10.1016/0927-7757(96)03624-2
Hansen, D., Bomholt, N., Jeppesen, J. C., and Simonsen, A. C. (2017). Contact angle goniometry on single micron-scale fibers for composites. Appl. Surf. Sci. 392, 181–188. doi: 10.1016/j.apsusc.2016.09.018
Kumar, S. M., and Deshpande, A. P. (2006). Dynamics of drop spreading on fibrous porous media. Colloids Surf. A 277, 157–163. doi: 10.1016/j.colsurfa.2005.11.056
Le Grand, N., Daerr, A., and Limat, L. (2005). Shape and motion of drops sliding down an inclined plane. J. Fluid Mech. 541, 293–315. doi: 10.1017/S0022112005006105
Lu, G., Wang, X.-D., and Duan, Y.-Y. (2016). A critical review of dynamic wetting by complex fluids: from newtonian fluids to non-newtonian fluids and nanofluids. Adv. Colloid Interface Sci. 236, 43–62. doi: 10.1016/j.cis.2016.07.004
Maleki, M., Reyssat, E., Quéré, D., and Golestanian, R. (2007). On the landau- levich transition. Langmuir 23, 10116–10122. doi: 10.1021/la700822y
Maleki, M., Reyssat, M., Restagno, F., Quéré, D., and Clanet, C. (2011). Landau-levich menisci. J. Colloid Interface Sci. 354, 359–363. doi: 10.1016/j.jcis.2010.07.069
Marsh, J. A., Garoff, S., and Dussan, E. B. (1993). Dynamic contact angles and hydrodynamics near a moving contact line. Phys. Rev. Lett. 70:2778. doi: 10.1103/PhysRevLett.70.2778
Mohammad Karim, A., Davis, S., and Kavehpour, H. (2016). Forced versus spontaneous spreading of liquids. Langmuir 32, 10153–10158. doi: 10.1021/acs.langmuir.6b00747
Moreira, J. C., and Demarquette, N. R. (2001). Influence of temperature, molecular weight, and molecular weight dispersity on the surface tension of PS, PP, and PE. I. experimental. J. Appl. Polym. Sci. 82, 1907–1920. doi: 10.1002/app.2036
Park, C. H., Lebel, A., Saouab, A., Bréard, J., and Lee, W. I. (2011). Modeling and simulation of voids and saturation in liquid composite molding processes. Compos. Part A 42, 658–668. doi: 10.1016/j.compositesa.2011.02.005
Petrov, J. G., Ralston, J., Schneemilch, M., and Hayes, R. A. (2003). Dynamics of partial wetting and dewetting in well-defined systems. J. Phys. Chem. B 107, 1634–1645. doi: 10.1021/jp026723h
Prevost, A., Rolley, E., and Guthmann, C. (1999). Thermally activated motion of the contact line of a liquid 4 he meniscus on a cesium substrate. Phys. Rev. Lett. 83:348. doi: 10.1103/PhysRevLett.83.348
Pucci, M. F., Duchemin, B., Gomina, M., and Bréard, J. (2018). Temperature effect on dynamic wetting of cellulosic substrates by molten polymers for composite processing. Compos. Part A 114, 307–315. doi: 10.1016/j.compositesa.2018.08.031
Pucci, M. F., Liotier, P.-J., and Drapier, S. (2015). Capillary effects on flax fibers-modification and characterization of the wetting dynamics. Compos. Part A 77, 257–265. doi: 10.1016/j.compositesa.2015.03.010
Pucci, M. F., Liotier, P.-J., and Drapier, S. (2017a). Tensiometric method to reliably assess wetting properties of single fibers with resins: validation on cellulosic reinforcements for composites. Colloids Surf. A 512, 26–33. doi: 10.1016/j.colsurfa.2016.09.047
Pucci, M. F., Liotier, P.-J., Seveno, D., Fuentes, C., Van Vuure, A., and Drapier, S. (2017b). Wetting and swelling property modifications of elementary flax fibres and their effects on the liquid composite molding process. Compos. Part A 97, 31–40. doi: 10.1016/j.compositesa.2017.02.028
Ranabothu, S. R., Karnezis, C., and Dai, L. L. (2005). Dynamic wetting: hydrodynamic or molecular-kinetic? J. Colloid Interface Sci. 288, 213–221. doi: 10.1016/j.jcis.2005.02.074
Ruiz, E., Achim, V., Soukane, S., Trochu, F., and Bréard, J. (2006). Optimization of injection flow rate to minimize micro/macro-voids formation in resin transfer molded composites. Compos. Sci. Technol. 66, 475–486. doi: 10.1016/j.compscitech.2005.06.013
Sauer, B. B., and Dipaolo, N. V. (1991). Surface tension and dynamic wetting on polymers using the wihelmy method: applications to high molecular weights and elevated temperatures. J. Colloid Interface Sci. 144, 527–537. doi: 10.1016/0021-9797(91)90418-8
Sauer, B. B., and Kampert, W. G. (1998). Influence of viscosity on forced and spontaneous spreading: Wilhelmy fiber studies including practical methods for rapid viscosity measurement. J. Colloid Interface Sci. 199, 28–37. doi: 10.1006/jcis.1997.5319
Schneemilch, M., Hayes, R. A., Petrov, J. G., and Ralston, J. (1998). Dynamic wetting and dewetting of a low-energy surface by pure liquids. Langmuir 14, 7047–7051. doi: 10.1021/la980476k
Seveno, D., Vaillant, A., Rioboo, R., Adao, H., Conti, J., and De Coninck, J. (2009). Dynamics of wetting revisited. Langmuir 25, 13034–13044. doi: 10.1021/la901125a
Snoeijer, J. H., and Andreotti, B. (2013). Moving contact lines: scales, regimes, and dynamical transitions. Annu. Rev. Fluid Mech. 45, 269–292. doi: 10.1146/annurev-fluid-011212-140734
Song, B., and Springer, J. (1996a). Determination of interfacial tension from the profile of a pendant drop using computer-aided image processing: 1. theoretical. J. Colloid Interface Sci. 184, 64–76. doi: 10.1006/jcis.1996.0597
Song, B., and Springer, J. (1996b). Determination of interfacial tension from the profile of a pendant drop using computer-aided image processing: 2. experimental. J. Colloid Interface Sci. 184, 77–91. doi: 10.1016/S0021-9797(96)90598-6
Tanner, L. (1979). The spreading of silicone oil drops on horizontal surfaces. J. Phys. D 12:1473. doi: 10.1088/0022-3727/12/9/009
Verrey, J., Michaud, V., and Månson, J.-A. (2006). Dynamic capillary effects in liquid composite moulding with non-crimp fabrics. Compos. Part A 37, 92–102. doi: 10.1016/j.compositesa.2005.04.011
Wielhorski, Y., Abdelwahed, M. A. B., Bizet, L., and Bréard, J. (2012). Wetting effect on bubble shapes formed in a cylindrical t-junction. Chem. Eng. Sci. 84, 100–106. doi: 10.1016/j.ces.2012.08.008
Zhang, Y., Fuentes, C. A., Koekoekx, R., Clasen, C., Van Vuure, A. W., De Coninck, J., et al. (2017). Spreading dynamics of molten polymer drops on glass substrates. Langmuir 33, 8447–8454. doi: 10.1021/acs.langmuir.7b01500
Zhang, Y., Moins, S., Coulembier, O., Seveno, D., and De Coninck, J. (2019). Capillary rise of polydimethylsiloxane around a poly (ethylene terephthalate) fiber versus viscosity: existence of a sharp transition in the dynamic wetting behavior. J. Colloid Interface Sci. 536, 499–506. doi: 10.1016/j.jcis.2018.10.082
Keywords: dynamic wetting, capillary effects, molten polymer, molecular weight, cellulosic films
Citation: Pucci MF, Duchemin B, Gomina M and Bréard J (2020) Dynamic Wetting of Molten Polymers on Cellulosic Substrates: Model Prediction for Total and Partial Wetting. Front. Mater. 7:143. doi: 10.3389/fmats.2020.00143
Received: 17 March 2020; Accepted: 24 April 2020;
Published: 19 May 2020.
Edited by:
Patricia Krawczak, IMT Lille Douai, FranceReviewed by:
Veronique Michaud, Federal Institute of Technology in Lausanne, SwitzerlandChristophe Binetruy, Ecole Centrale de Nantes, France
Copyright © 2020 Pucci, Duchemin, Gomina and Bréard. This is an open-access article distributed under the terms of the Creative Commons Attribution License (CC BY). The use, distribution or reproduction in other forums is permitted, provided the original author(s) and the copyright owner(s) are credited and that the original publication in this journal is cited, in accordance with accepted academic practice. No use, distribution or reproduction is permitted which does not comply with these terms.
*Correspondence: Monica Francesca Pucci, monica.pucci@mines-ales.fr
†Present Address: Monica Francesca Pucci, LMGC, IMT Mines Alés, UMR 5508 CNRS, Univ Montpellier, Alés, France