Thermomechanical Characterization of Carbon Black Reinforced Rubbers During Rapid Adiabatic Straining
 William Amoako Kyei-Manu1*
  Lewis B. Tunnicliffe2
  Jan Plagge3 Charles R. Herd2
  Keizo Akutagawa1 Nicola M. Pugno1,4
  James J. C. Busfield1
- 1School of Engineering and Materials Science, Queen Mary University of London, London, United Kingdom
- 2Birla Carbon, Marietta, GA, United States
- 3School of Mathematics and Natural Sciences, Bergische Universität Wuppertal, Wuppertal, Germany
- 4Laboratory of Bio-Inspired, Bionic, Nano, Meta Materials & Mechanics, Department of Civil, Environmental and Mechanical Engineering, Università di Trento, Trento, Italy
The thermo-mechanical properties of carbon black reinforced natural and styrene butadiene rubbers are investigated under rapid adiabatic conditions. Eleven carbon black grades with varying surface area and structure properties at 40 parts per hundred (phr) loading are studied and the unreinforced equivalents are included for reference. The results show a strong correlation of the modulus, mechanical hysteresis, temperature rise and calculated crystallinity of the rubbers measured in tensile extension with strain amplification factors. This highlights the influence of matrix overstraining on microstructural deformations of the rubber upon extension. The strain amplification factors are calculated via the Guth-Gold equation directly from carbon black type and loading, allowing a correlation of the fundamental morphological properties of carbon black with thermal and mechanical properties of rubbers upon extension. Analysis of the thermal measurements of the rubber compounds upon extension and retraction and contrasting between crystallizing and non-crystallizing rubbers reveals that a substantial irreversible heat generation is present upon extension of the rubber compounds. These irreversible effects most likely originate from microstructural damage mechanisms which have been proposed to account for the Mullins Effect in particle reinforced rubbers.
Introduction
Particle reinforced rubbers are an important class of materials. Despite their ubiquity, there is still a lack of understanding of the mechanisms controlling their behaviors at both small and large strains. In this article we focus on effects at large strains (strains > ∼50%). Figure 1 illustrates the complex strain and strain history dependence of a typical particle reinforced rubber. The cyclic stress softening and strain history dependence are often referred to as the Mullins effect (Mullins, 1948). In addition, hysteresis and set effects are also present. Despite intensive investigation, the microstructural origins of this large strain behavior and the Mullins Effect are still not entirely clear. Theories to account for the pronounced stiffening (stress upturn) observed at very large strains include approaching the finite extensibility of the rubber network and also the self-reinforcement for rubber materials able to undergo strain induced crystallization. Strain history and hysteresis effects are commonly ascribed to several prosed microstructural damage mechanisms (Diani et al., 2009) which include: chain breakage at the interface between the rubber and reinforcing particulates, slippage of rubber macromolecules at the particle interface leading to a stress redistribution to neighbouring molecules, rupture of flocculated clusters of reinforcing particulates, progressive chain disentanglements, covalent bond scission and crosslink rupture (Clough et al., 2016) and yielding and rebirth of glass-like immobilized bridges between adjacent particles (Merabia et al., 2008) A common feature of all these proposed damage mechanisms is that they are associated with dissipation of strain energy in the form of heat.
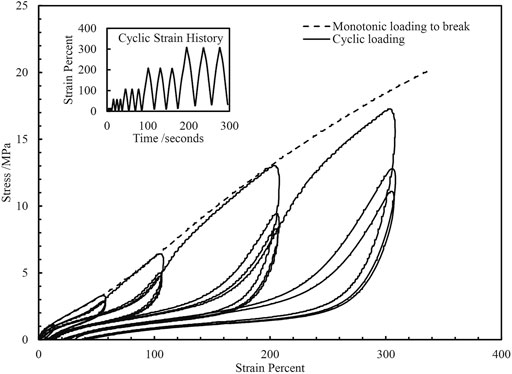
FIGURE 1. Complex stress-strain behavior observed in 50 parts per hundred (phr) N550 carbon black reinforced natural rubber under cyclic tensile extension. Tests were done at a rate of 500 mm/min at room temperature.
When particulate reinforced rubbers are deformed in uniaxial tension, the heat evolved (Gough, 1805; Joule, 1859) can be attributed, to various degrees, to the intrinsic entropic elasticity (Meyer and Ferri, 1935; Anthony et al., 1942) and viscoelasticity (Payne and Whittaker, 1972) of the rubber matrix and to the hysteretic breakdown of the particulate network within the rubber (Grosch et al., 1967). Where rubbers are amenable to strain induced crystallization (SIC), the heat of fusion of the crystallites at high global strains may also contribute substantially to the observed evolution of heat from the specimen. These effects are strain and strain rate dependent (Tosaka, 2007; Brüning et al., 2015).
More recent numerical (Behnke et al., 2016; Dhawan and Chawla 2019) and experimental (Samaca Martinez et al., 2013; Samaca Martinez et al., 2014; Spratte et al., 2017) thermomechanical studies have expanded on these concepts. Akutagawa et al. (2015) concluded that temperature changes during stretching and retraction of rubber can be reduced to two processes: reversible and irreversible processes. Entropy elasticity and SIC are reversible processes whereas the hysteretic breakdown of the particulate network (particle-particle and particle-polymer breakdown) are irreversible. Le et al. (2020) conducted thermo-mechanical experiments on rubber and developed a quantitative model for the temperature variation caused by isentropic, entropic and viscous dissipation effects under steady state uniaxial tensile cyclic loading. Le Cam et al. (2015) used a calorimetric approach to characterize several important effects such as entropic elasticity, reinforcement by particulates, strain-induced crystallization and Mullins effect of filled and unfilled natural rubber (NR) and styrene butadiene rubber (SBR). Similarly, Le Saux et al. (2013) used a calorimetric approach to detect the onset strains for SIC and correlated this with data from X-ray measurements in literature.
SIC significantly enhances a number of mechanical properties of rubber compounds including crack growth resistance and tear resistance and tensile failure properties. These improvements in compound properties are traced back to a retardation of catastrophic and/or incremental crack growth due to crystallization of a portion of the highly strained rubber ahead of a crack tip (Brüning et al., 2013). NR exhibits SIC because close to 100% of its poly-isoprene chains have cis-configuration (Huneau, 2011; Gent, 2012). This stereo-regular structure of NR enables the polymer chains to crystallize either at low temperatures and/or at high strains, leading to a pronounced self-reinforcement. Despite this intrinsic reinforcement mechanism, unfilled NR compounds are unable to provide sufficient mechanical reinforcement, notably abrasion resistance, to be of practical use in many engineering applications and is therefore further reinforced by incorporating fine particulates such as carbon black (CB). Both SIC and the inclusion of CB play critical roles in the reinforcement of rubber products.
Various researchers have investigated the effect of CB on SIC in NR. Lee and Donovan (1987) showed that the inclusion of CB facilitates SIC and increases the size of the crystallized zone at the stressed crack tip. Trabelsi et al. (2003) demonstrated that in NR reinforced with 50 parts per hundred rubber (phr) CB, the onset strain for SIC was 100%, versus 300% for unreinforced NR. This reduction in global onset strains for SIC was attributed to matrix strain amplification due to the presence of rigid CB within the rubber. This process was first proposed by Mullins and Tobin (1966) to explain the stiffening effect that reinforcing particles such as CB had on rubbers. The presence of rigid particles within the rubber causes local overstraining of the rubber matrix when compared with the applied macroscopic strain level. Trabelsi et al. (2003) observed two different regions of strain amplification: a lower strain region where SIC has not occurred and in which the strain amplification factor is independent of applied global strains and a region where SIC has occurred and strain amplification is weakly dependent on applied global strain. The reduction in onset strain of SIC due to the inclusion of reinforcing particulates was also observed by Chenal et al. (2007) who found that the extent of SIC and onset strain required for SIC also depends on the cyclic strain history of the reinforced rubber. Rault et al. (2006) studied SIC and reinforcement in CB reinforced rubbers in relation to strain amplification factors. From their analysis of the strain amplification factors, they observed that in rubbers that do not undergo SIC, reinforcement in filled rubbers has two causes: overstraining/strain amplification of the chains due to a purely geometrical effect and particles acting as new effective crosslinks within the rubber. The latter point of view is shared by Plagge and Lang (2021) who related the large-strain stiffening to the physicochemical compatibility of carbon black and rubber. When the samples crystallize, the crystallites act as giant cross-links causing the stress to increase drastically with macroscopic extension. Rault et al. (2006) also observed that the addition of small amounts (20 phr) of CB strongly decreases the onset strains required for SIC. They hypothesize that this is due to the CB particles acting as crystal nucleation sites. This point of view is supported by a recent work by Sotta and Albouy (2020), where the SIC-related hysteresis of NR is traced back to nucleation-limited crystallization during stretching.
Many of these aforementioned studies have utilized X-ray scattering techniques to directly study SIC. Recently, two research groups, M. Klüppel and co-workers (Plagge and Klüppel, 2018) and J. B. Le Cam and co-workers (Le Cam et al., 2020), have lead efforts to measure SIC from the increase in temperature upon extension of rubber. While such thermographic techniques do not necessarily provide details on the structure of the crystallites formed, it might potentially provide a much more accessible way to determine the degree of crystallization in stretched rubber. For the case of particle reinforced rubbers, thermal characterization during extension also captures the heat generated from non-SIC related mechanisms (particle network breakdown, polymer-particle de-cohesion etc.).
Furthermore, although there have been numerous previous studies on the effect of CB on mechanical and thermal properties of rubber, there has been limited effort to correlate these effects with the fundamental size and morphological properties of carbon black. This is an important step to make, since these CB properties are already extensively utilized by rubber compound designers to engineer various properties of their compounds to meet end user requirements. Further quantitative understanding of their effects on SIC and other thermomechanical properties of rubbers offer potential for enhancement of rubber product performance.
This study evaluates the evolution of mechanical and thermal properties of NR and SBR compounds reinforced with different types of CB subjected to rapid adiabatic cyclic stretching and retraction. The mechanical results are analyzed in the context of the well-established strain amplification model. The temperature changes during stretching and retraction are similarly analyzed and extraction of information on the crystallization process is attempted. By contrasting NR compounds which are amenable to SIC to those which are not–Styrene Butadiene Rubber (SBR), various contributions to the observed stress and temperature changes upon extension and retraction are qualitatively evaluated.
Materials and Methods
Materials
Compounds of SMR CV60 NR reinforced with eleven different CB grades at 40 parts per hundred rubber (phr) loading were prepared. An unreinforced NR counterpart was also included in the tests. The range of CBs used in this study was selected to cover a broad range of surface area and structure space as shown in Figure 2. The insert in Figure 2 shows a schematic representation of an aggregate of CB and representative images from TEM for N772, N330, N326 and N134 CBs using the same scale bar of 100 nm. The aggregate is comprised of a fused assembly of para-crystalline primary particles. The size of the primary particles is the key parameter determining the surface area of the CB while the number and spatial arrangement of the primary particles defines the structure level of CB. The surface area of carbon black is typically determined using nitrogen gas adsorption methods such as the nitrogen surface area (NSA) and statistical thickness surface area (STSA) methods (ASTM International, 2019) The structure level of CB is determined by measuring the amount of oil that is absorbed by a specific amount of carbon black-Oil absorption number (OAN) and compressed oil absorption number (COAN) methods (ASTM International, 2019; ASTM International, 2019).
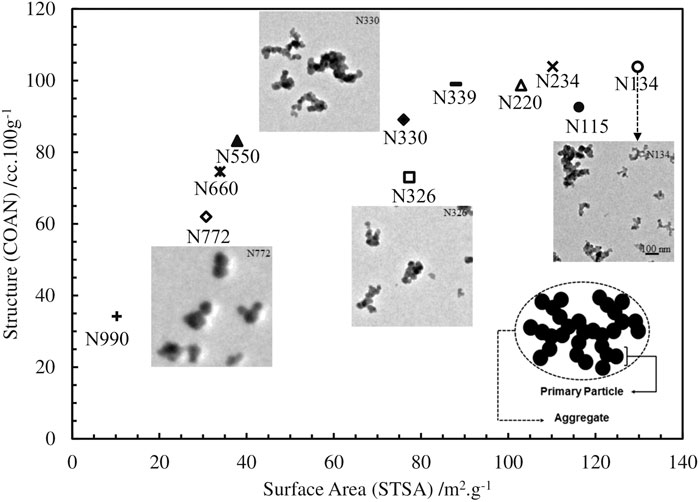
FIGURE 2. Colloidal plot of carbon blacks studied in this article. A measure of the structure (COAN) is plotted against a measure of the surface area (STSA). Insert: Schematic of the primary particle-aggregate hierarchical structure of carbon black and representative TEM images of N772, N326, N330 and N134.
Unreinforced emulsion SBR 1502 and SBR reinforced with N220 and N772 CBs at 40 phr were also prepared. These compounds were included to contrast with the NR compounds as SBR, unlike NR, does not undergo SIC. Table 1 shows the compositions of the various compounds used in this study. Table 2 gives the compound properties such as densities measured using a pycnometer and specific heat capacities measured using a differential scanning calorimeter. Interferometric microscope (IFM) dispersion index values are given in Table 2. IFM dispersion characterizes the level of incorporation of the CB into the rubber compounds on the macroscale and is a quantification of undispersed carbon black at a length scale greater than 5 µm diameter. Values of DI greater than 90 indicate an excellent dispersion. IFM DI measurements were performed according to ASTM D2663-14 (2019) method D.
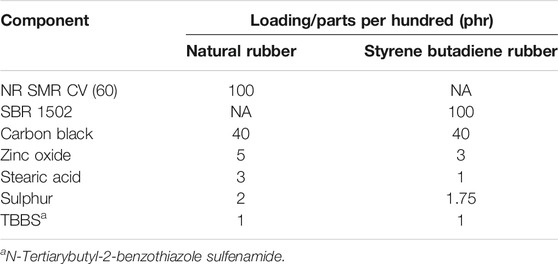
TABLE 1. Composition of tested compounds.
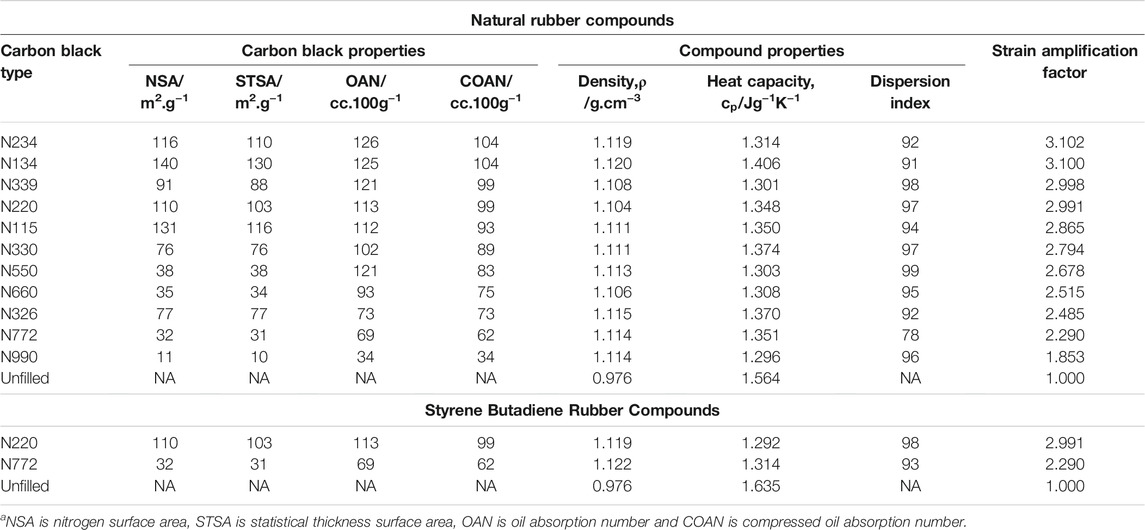
TABLE 2. Colloidala and compound properties and calculated strain amplification of tested compounds.
Table 2 also presents the surface area (NSA, STSA) and structure (OAN, COAN) properties of the CBs in the compounds. Compounds were prepared by Birla Carbon (Marietta, GA, United States) using a 1.6 L capacity Banbury mixer and vulcanized sheets measuring 11 mm × 11 mm × ∼2 mm were prepared by compression molding at 150°C for NR samples and 160°C for SBR samples to a time of T90+5mins where T90 (time taken at 150°C/160°C for the specimen to reach 90% of maximum torque) was measured using an Alpha Technologies moving die rheometer (MDR). The mixing procedure is included in the supplemental information.
Experimental Method
Dumbbells for uniaxial extension and retraction experiments were cut from vulcanized sheets using a hydraulic die press. The dumbbells had approximate gauge length, width and thickness of 45, 6 and 2 mm respectively. To investigate thermal responses under adiabatic conditions, the samples were deformed using an Instron 8801 hydraulic mechanical testing machine equipped with a 1 kN load cell. The tests were run in a position-control mode with the lower grip moving to the targeted position(s). The specimens were extended to target uniaxial strains of 150, 250 and 350% at speeds of 20,000 mm/min giving a strain rate of about 7.40 s−1 and a stretching time of 0.5 s for the maximum strain of 350%. For contrast, Candau et al. (2012) determined the time needed for NR to crystallize once samples are elongated above the critical elongation for SIC as 0.02 s during cyclic tensile tests at high strain rates from 8 s−1 to 280 s−1. After straining, the samples were held at the maximum strain for 2 min to regain thermal equilibrium before being rapidly retracted to zero strain at the same strain rate. This process was repeated 10 times for each specimen with three specimens being measured for each compound.
The specimen temperature was measured using a FLIR A35 (focal length = 9 mm) infrared camera. The camera has a thermal sensitivity/noise equivalent temperature difference (NETD) of <0.05°C at +30°C/50 mK and an IR resolution of 320 × 250 pixels. The camera was turned on 2 h prior to the measurements to ensure the internal temperature of the camera was stabilized. The acquisition frequency was set to the maximum rate of 60 Hz. The mean average temperature of a rectangle covering a pixel area of about 225 pixels was used to track and measure the temperature in the center of the specimen during straining and retraction using the FLIR Research IR software. The emissivity was set to 0.95 which is a reasonable approximation for CB reinforced rubber (Browne and Wickliffe, 1979; Luukkonen et al., 2009). The ambient room temperature was measured by placing a black body in the view of the camera and this was verified with a standard thermocouple.
The mechanical and temperature data were recorded on the 1st, 5th and 10th loading and unloading cycles to investigate the effect of Mullins softening on mechanical properties and temperature evolution. However, due to the high permanent set of the filled samples, particularly at high strains, the samples at 350% were re-gripped prior to the 5th and 10th cycles.
Strain Amplification
The results obtained from the thermomechanical experiments are quantitatively discussed using strain amplification factors, X. It is therefore necessary to discuss how these are calculated for the purpose of this paper. Mullins and Tobin (1966) proposed the general concept that when rigid particles are introduced into a rubber matrix they cause greater average deformation on the local scale,
X is therefore a strain amplification factor that quantifies the degree to which the applied global strain is amplified on average at the local scale level. Models with varying levels of sophistication can be used for calculating the strain amplification factor (Huber and Vilgis 1999; Klüppel 2003; Allegra et al., 2008; Domurath et al., 2012), with each having distinct advantages and limitations.
In this paper, we use the simple and widely used Guth-Gold equation which predicts the strain amplification in the compound from the effective volume fraction of particulates in the composite.
The Guth-Gold equation was developed for spherical particles at low to moderate volume fractions (Mullins and Tobin 1966). The Guth-Gold equation does not account for any substantial networking of particulates within the rubber-which commonly occurs at small to moderate strains-nor any breakdown of the particle-particle network or de-cohesion of the particle-rubber interface. This assumes therefore that X is independent of applied strain level.
The effective volume fraction of CB in each compound,
Tunnicliffe (2021a) recently demonstrated that the Guth-Gold strain amplification factor can be used to scale fatigue crack growth resistance of CB reinforced NR and showed good correlations between calculated strain amplification factors and the state of strain immediately ahead of crack tips in NR Liu et al., 2015. Trabelsi et al. (2003) also showed that experimentally measured strain amplification factors were in good agreement with the Guth-Gold equation. The calculated strain amplification factors of the tested specimen are listed in Table 2.
Calculating the Extent of Crystallinity from Thermal Measurements
The methods for calculating crystallinity directly from temperature measurements are described in detail in Plagge and Klüppel (2018) and Le Cam et al. (2020). Le Cam’s method is a four step approach that is based on quantitative calorimetry and temperature measurements. To date it currently has not been applied to reinforced rubber materials and will be the objective of subsequent studies. Plagge and Klüppel’s method depends on an energy balance process where the mechanical energy input
The resulting equation is similar to the first law of thermodynamics (written per volume) as follows:
The greatest uncertainty in using this approach is how to determine the amount of heat,
where
Heat Exchange Characterization
A fundamental solution to the heat diffusion equation (Plagge and Klüppel, 2018) is:
where
For rubber,
This implies that an inhomogeneous temperature field within the rubber strip (size = 2 mm) will equilibrate in approximately 2 s. Due to the rapid extension and retraction, the timescale of the experiments are of the order of milliseconds; well within the timescale of heat diffusion. The temperature measurements are therefore more likely the real localized temperature of the samples instead of an averaged one due to diffusion.
To characterize the adiabatic nature of the current experimental set up, a specimen similar to those used in the main experiments of this work was heated in an oven for about 3 h at 60°C to ensure a homogenous temperature distribution. The specimen was then quickly gripped in the testing machine and the natural return to room temperature was recorded as a function of time. A heat exchange equation (based on a best fit line with an R2 value of 0.97, see Supplemental Data sheet) which considers the experimental set up and environment was obtained from this graph as
where
Results
Mechanical Properties
Stress-Strain and Mooney-Rivlin Curves
Figures 3A–C shows the stress-strain curves for the 1st, 5th and 10th cycles of CB reinforced and unreinforced NR specimens when extended to 350% strain and retracted following a 2 min hold. There is a clear distinction between the initial extension curves depending on the CB types. The CBs with higher strain amplification factors, which is the result of higher structure level of the CB, have a higher incremental modulus response versus CBs with lower strain amplification factors and hence a lower structure. This is illustrated in Figure 3D where the measured stress at 300% strain is plotted versus the compound strain amplification factor. Strong linear correlations between the stress value at 300% and strain amplification factors are observed for each cycle level (R2 values are indicated in the Figure). Upon retraction of the specimens however, there is minimal distinction between the stress-strain curves of the different compounds. This is an interesting observation which requires additional investigation, including a further analysis of the polymer and CB-related stress relaxation occurring during the 2 min hold period. Subsequent papers, would attempt to decompose the contribution of the stress relaxation resulting from strain induced crystallization and post-stretch relaxation based on a model proposed by Tosaka et al. (2006).
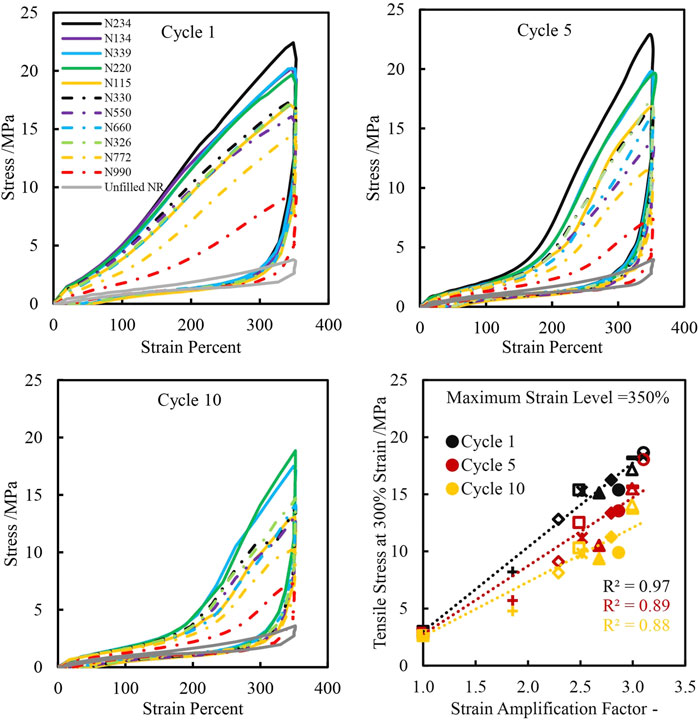
FIGURE 3. Stress-strain plots of carbon black reinforced and unreinforced natural rubber extended to 350% strain and retracted after a 2 min hold on cycles 1, 5 and 10. Tensile stress at 300% strain as a function of strain amplification factor for cycles 1, 5 and 10.
It has been shown by different authors (Mullins and Tobin 1966; Mark and Erman 2007) that the Mooney-Rivlin relation can be used to describe the stress-strain behavior of rubber at finite extensions. Typically stress-strain data plotted according to the Mooney-Rivlin model show a large and abrupt increase in modulus at high elongations which corresponds to a significant stiffening of the rubber. The molecular origin for this upturn is widely debated. Most attribute it to the limit of the finite extensibility of the network chain (Treloar 1975). Others have attributed it to crystallization upon stretching since experiments in NR showed the upturns diminish with increase in temperature and swelling (Su and Mark, 1977). The reduced stress is calculated and plotted as a function of the inverse of extension ratio in Figure 4 for cycles 1, 5 and 10.
where σ is the engineering stress and λ is the extension ratio.
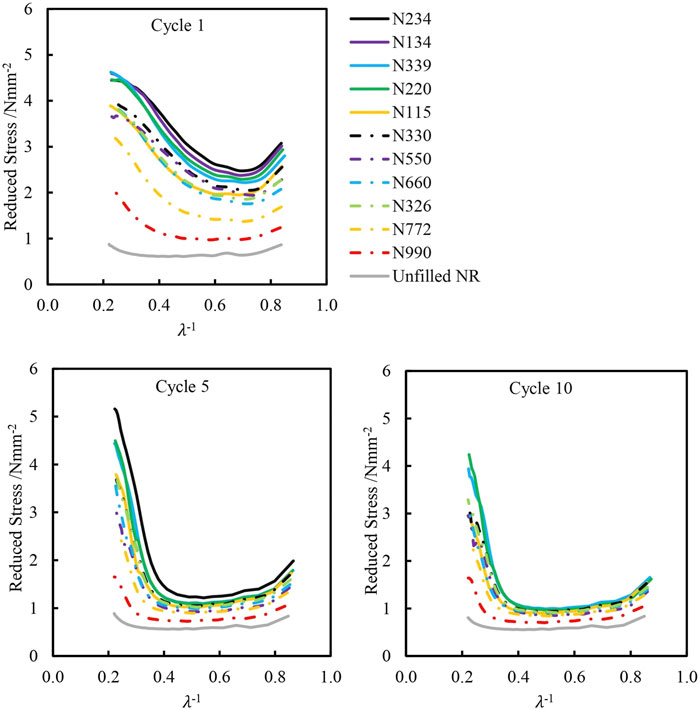
FIGURE 4. Mooney-Rivlin plots of carbon black reinforced and unreinforced natural rubber extended to 350% strain on cycles 1, 5 and 10.
The qualitative shapes of the stress-strain extension curves and Mooney-Rivlin curves differ between different cycles. Cycles 5 and 10 have a more distinct sigmoid shape with an upward inflection of the curve at strains greater than about 150% for the extension curves. The Mooney-Rivlin curves also show an upturn in stress on cycles 5 and 10 at higher strain values. This stress upturn is due to the progressive crystallization of the NR which stiffens the specimen and/or from the rubber macromolecules approaching finite extensibility. On the 1st cycle of the stress strain curve, however, this upturn is not as distinct. The upturn in stress on the 1st cycle is almost gradual and starts at lower strains compared to cycles 5 and 10 for the Mooney-Rivlin curves as well. These differences are likely due to the differences in microstructural damage history between the 1st and subsequent cycles. As discussed in the introduction, such “damage” could be the result of CB aggregate-aggregate network breakdown, polymer-particle de-cohesion and sliding, and disentanglement of the rubber network (Toki et al., 2013).
Mechanical Hysteresis
The hysteresis losses in rubber are an important factor influencing the rubber’s fracture properties. Hysteresis losses dissipate energy input into the rubber thereby increasing the threshold required for fracture. The mechanical hysteresis is calculated as the difference between the area under the loading and unloading curves and plotted as functions of the strain amplification factor in Figure 5. Similar to the tensile stress at 300%, the mechanical hysteresis strongly scales with the strain amplification factor. This observation indicates that selection of CB structure level is important in determining the moduli and mechanical hysteresis of the rubber compound at finite strains. Note that this contrasts with the effect of CB on hysteresis at small to medium strains (the strain range under consideration when examining the Payne Effect), where the surface area of the carbon black generally dictates the levels of hysteresis (Fröhlich et al., 2005, Tunnicliffe (2021b).
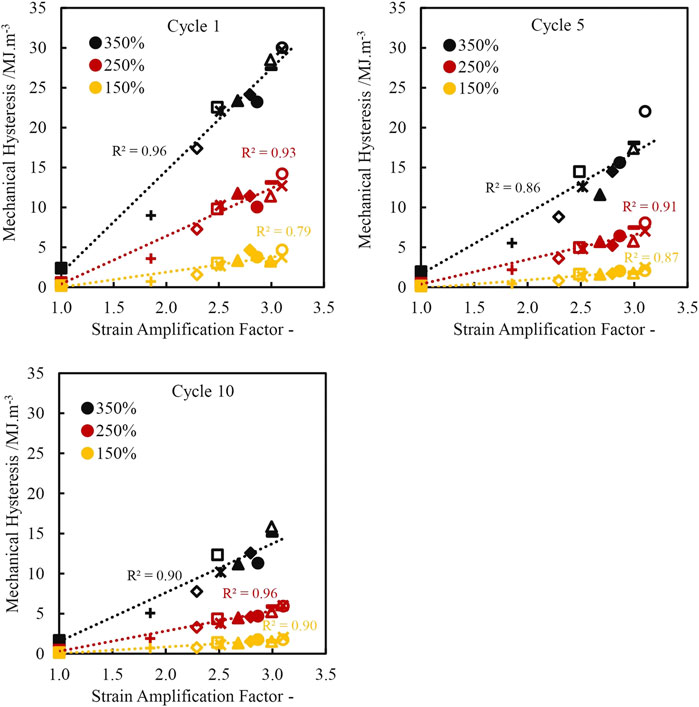
FIGURE 5. Mechanical hysteresis on cycles 1, 5 and 10 as a function of strain amplification factor of natural rubber samples extended to 350% strain.
Temperature Measurements
Figure 6 is the temperature, stress and strain as a function of time for the 1st cycle of the N234 CB reinforced NR strained to 350%, held for about 2 min and retracted. The significantly slower rate of cooling during the 2 min hold in comparison to the timescale of heating and cooling during extension and retraction highlights that the thermal measurements are conducted under adiabatic conditions. The stress drops significantly in the first few seconds of the 2 min hold, another interesting observation, which a further analysis of the polymer and CB-related stress relaxation during the 2 min hold period will help explain.
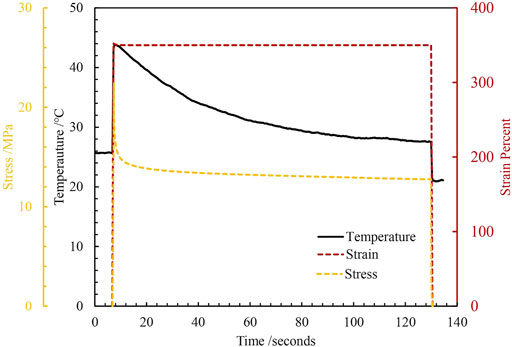
FIGURE 6. Temperature profile, stress and strain as a function of test time for N234 reinforced natural rubber rapidly extended to 350% strain, held for 2 min and rapidly retracted.
The rise and drop in temperature of the specimens extended to 350% and then retracted are plotted in Figure 7 for the first cycle. Analogous to the mechanical data, there is a clear distinction between the temperature rises upon extension depending on CB type, but minimal differences between the samples upon retraction. Processes such as breakdown of the CB network and strain-induced crystallization dissipate energy during extension causing the observed temperature rise.
The change in temperature for each compound is plotted as a function of the calculated strain amplification factor for strains of 350% (black), 250% (yellow) and 150% (red) for cycles 1, 5 and 10 in Figure 8. The data above Temperature Change = 0°C show a rise in temperature and those below 0°C reflect a drop in temperature. From the graph there is a strong correlation of the rise in temperature with strain amplification factor–mirroring the observation for the corresponding mechanical data. As strain amplification increases, the rise in temperature increases, as does the measured stress at a given strain level. There seems to be no apparent correlation with drop in temperature upon retraction. Again this is an area for further investigation. During repeated cycling of the materials, the maximum achieved temperature change upon extension is reduced–most notably between the 1st and 5th cycles. Conversely, the magnitude of temperature change upon retraction appears to be broadly unaffected by cycle number.
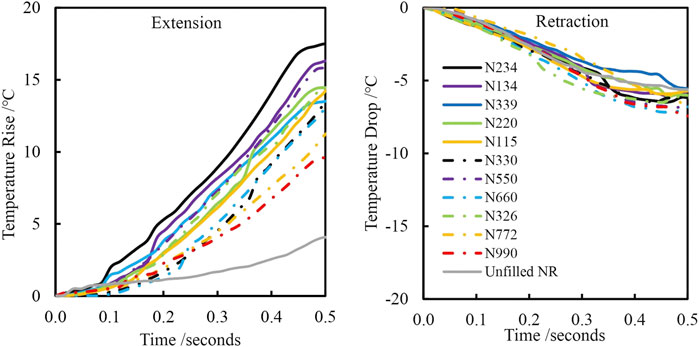
FIGURE 7. Temperature rise and temperature drop of carbon black reinforced and unreinforced natural rubber extended to 350% strain and retracted after a 2 min hold for 1st cycle.
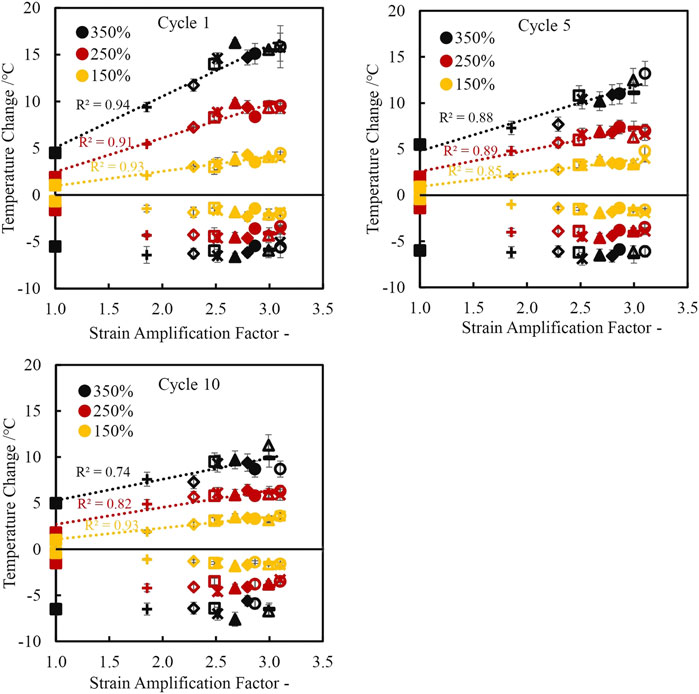
FIGURE 8. Temperature change as a function of strain amplification factor of carbon black reinforced and unreinforced natural rubber extended on cycles 1, 5 and 10. Positive values are the temperature rise upon extension and negative values are the corresponding temperature drop upon retraction.
Figure 9 plots the peak stress upon extension and the corresponding temperature rise upon extension for all strains and cycles for all NR compounds. All the points collapse on a master curve with reasonable correlation (R2 = 0.89), independent of the cycle number, strain level or CB type, suggesting the CB structure controls the maximum stress and corresponding temperature rise.
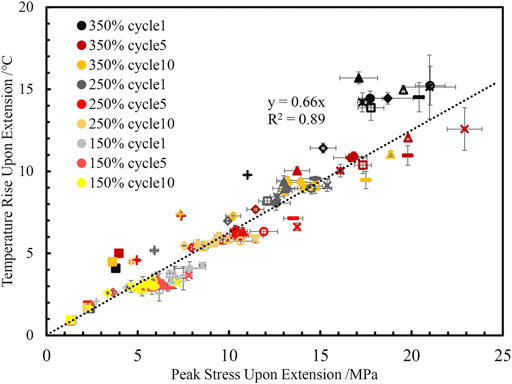
FIGURE 9. Master-line relating peak stress upon extension and corresponding temperature rise at all tested strain percent and cycles.
Strain Induced Crystallization Estimations
Using the approach detailed in Calculating the Extent of Crystallinity from Thermal Measurements Section, the apparent crystallinity percentage was estimated for NR specimens after the 1st, 5th and 10th cycles. Figures 10A,B show the graphs of the calculated apparent crystallinity percentage upon extension and retraction respectively to and from 350% strain on the 1st cycle. Mirroring the stress-strain and temperature change graphs discussed in Mechanical Properties Section and Temperature Measurements Section, there is a clear distinction between the calculated apparent crystallinity percentages formed upon extension dependent on the type of CB, but the extent of percentage crystallinity change upon retraction is largely indistinguishable between compounds. Figures 11A–C plots the peak apparent crystallinity for each compound at 150, 250 and 350% extension, for the 1st, 5th and 10th cycles, as a function of strain amplification factor. The calculated crystallinity extent correlates well with the strain amplification factors, with a higher strain amplification factor leading generally to a higher crystallinity value, as would be anticipated from a simple consideration of matrix overstraining. The calculated crystallinity extents are observed to decrease successively on each cycle. For contrast, in situ Wide Angle X-ray synchrotron (WAXS) experiments conducted on 45 phr N234 reinforced NR extended at a strain rate of 0.25 min−1(∼0.0042 s−1) produced similar decreasing crystallinity values upon successive cycles with maximum crystallinities of about 28, 22 and 21% on the first, second and third cycles at a peak strain of ∼250% (Chenal et al., 2007).
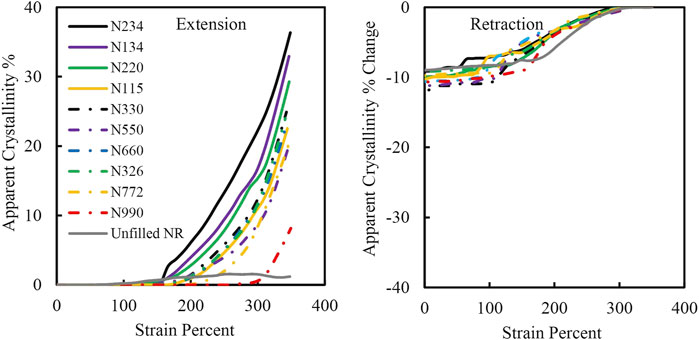
FIGURE 10. Apparent crystallinity percent of carbon black reinforced and unreinforced natural rubber extended and retracted at 350% strain during cycle 1.
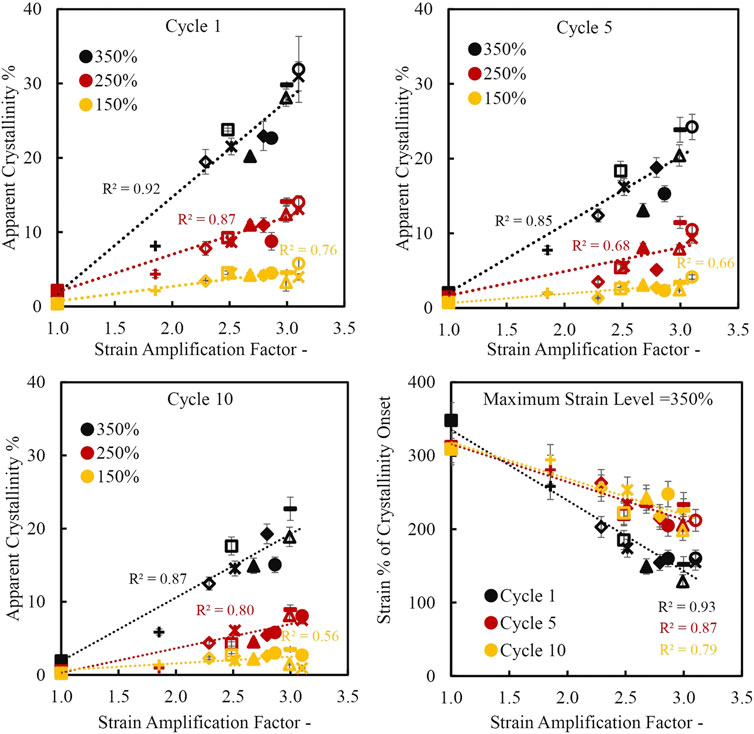
FIGURE 11. Apparent crystallinity percent and onset of crystallinity as a function of strain amplification factor of carbon black reinforced and unreinforced natural rubber extended on cycles 1, 5 and 10.
Figure 11D shows the onset strain percent for crystallite formation for each compound also plotted as a function of the strain amplification factor. Higher strain amplification generally leads to an earlier onset of the crystallinity. The onset strain percent for crystallinity also shows a slight increase (shift to higher strains) after the first cycle-similar to that reported by Chenal et al. (2007) who observed an increase in onset strain percent until a stable value is reached typically after three to five cycles.
It appears from Figure 10 that not all crystals formed upon extension are melted during retraction. The maximum percentage change in crystallinity upon retraction is always significantly lower than the maximum percentage change in crystallinity during extension. These findings are problematic for the following reasons: 1) even when accounting for the fact that crystallinity is known to persist for a while during retraction (Treloar 1975), the values in Figures 10A,B imply that the majority of crystallites persist in the fully relaxed state following full retraction. 2) while the crystallization extent upon extension appears to strongly depend on the type of CB, this dependence is lost in the retraction data, despite the fact that the final levels of crystallinity achieved upon maximum extension should persist or even increase during the 2 min hold period as the material progresses towards an equilibrium level of crystallinity (Tosaka, 2007).
Although the data reported in Figure 10A, and Figures 11A–C are in reasonable agreement with literature for direct measurements of SIC from X-ray scattering techniques, the inconsistency of the retraction data sets with known phenomenological behavior of SIC implies that additional thermal effects both upon extension and retraction are likely influencing the crystallinity values obtained here. For filled rubber samples, it is challenging to use thermography alone to accurately measure the extent of crystallinity due to the irreversible heat generating mechanisms such as particle-particle and particle-polymer breakdown during extension which are difficult to de-convolute from reversible SIC effects.
Styrene Butadiene Rubber Samples
SBR is a non-crystallizing rubber and provides a useful contrast to the NR materials. Figures 12A,B show the stress-strain curves and Mooney-Rivlin plots for the SBR compounds strained to 350% for cycles 1, 5 and 10. Similar to the NR stress-strain data, the reinforced SBR compounds show a sigmoid-like curve with distinct stress upturns at high strains, which is especially noticeable for cycles 5 and 10, despite the absence of SIC for SBR. This highlights the pronounced reinforcement effects of CB in non-crystallizing rubbers. Also note that the modulus/stress builds for the SBR compounds scale as expected according to strain amplification factors (with N220 being greater than N772).
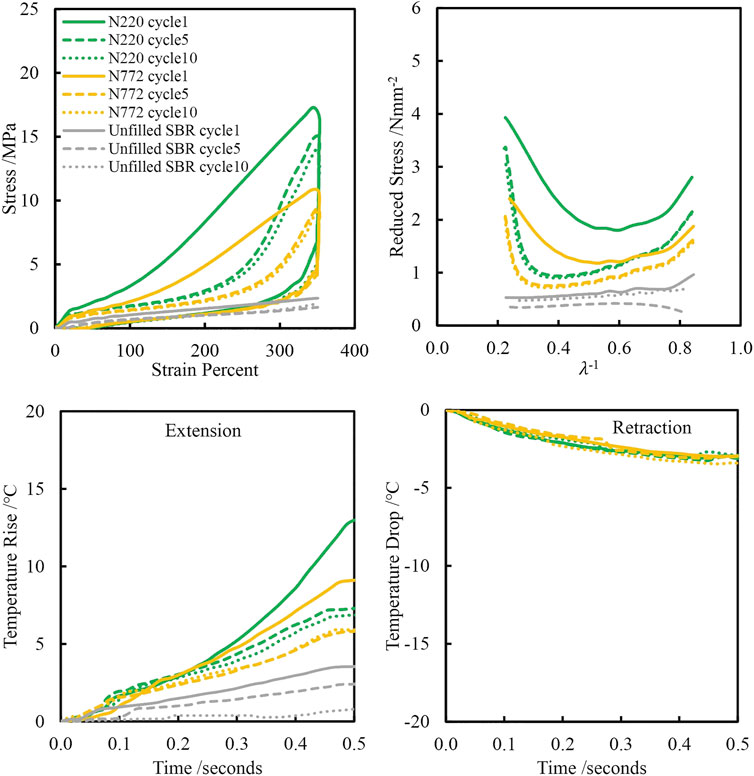
FIGURE 12. Stress-strain, Mooney-Rivlin and temperature change plots of reinforced and unreinforced styrene butadiene rubber extended to 350% strain.
The unreinforced SBR does not exhibit any stress upturn. It is also worth noting that the unreinforced SBR specimens failed during the 2 min hold period after initial extension and hence, there is no retraction data for this compound. In comparison, the unreinforced NR displays a moderate stress upturn (Figure 2), and did not fail during the 2 min hold period, again highlighting the intrinsic reinforcing effects of SIC in NR.
The Mooney-Rivlin plots also display similar trends to those observed in the NR compounds. On the 1st cycle, the upturn in reduced stress is observed at relatively low strain levels (∼100%). However, the stress upturn shifts to higher strains (∼200%) after cycles 5 and 10. The unreinforced SBR shows no stress upturn even at higher strains unlike the unreinforced NR specimen at 350% strain. Since the stress-strain and Mooney-Rivlin plots of reinforced styrene butadiene rubber specimens show similar behavior to the particulate reinforced NR specimens, it is difficult to conclusively attribute the upturn in stress and reduced stress observed in the NR specimens solely to the onset of SIC. Effects of particle-particle and particle-polymer interactions are clearly influencing the stiffening of the materials examined here.
Figures 12C,D show the temperature rise and drop for the SBR compounds. Again the observed temperature rise mirrors the evolution of stress during extension. The maximum observed temperature rise is ∼13°C for the SBR compounds, which cannot be attributed to SIC but rather to entropic elasticity and particle-particle and particle-polymer mechanisms. When comparing analogous SBR and NR materials head to head as shown in Figures 13A–C, the NR specimens consistently show a higher change in temperature versus the SBR specimens. The temperature rise of N220 reinforced NR extended to 350% strain on the 1st cycle is ∼16°C while the temperature rise of the N220 reinforced SBR is ∼13°C. The drops in temperature when retracted from 350% strain on the 1st cycle is ∼6°C and 4°C for the N220 reinforced NR and SBR respectively. While the temperature drops of the SBR specimens are lower compared to the NR specimens, it is worth highlighting the temperature drops of the SBR specimens which are entirely due to entropic elasticity are still relatively large. The difference in temperature evolution between the NR and SBR specimens may be due to the additional contribution from SIC in the NR compounds, but it is not possible to quantitatively attribute this difference in the temperature between the two analogous compounds directly to SIC due to inherent differences in polymer molecular architectures, viscoelasticity and crosslink densities. Nevertheless, these results demonstrate that entropic elasticity and particle-particle and particle-polymer mechanisms can contribute substantially to thermal evolution in strained rubbers and would need to be appropriately incorporated into quantitative evaluations of SIC from thermal measurements in reinforced NR compounds.
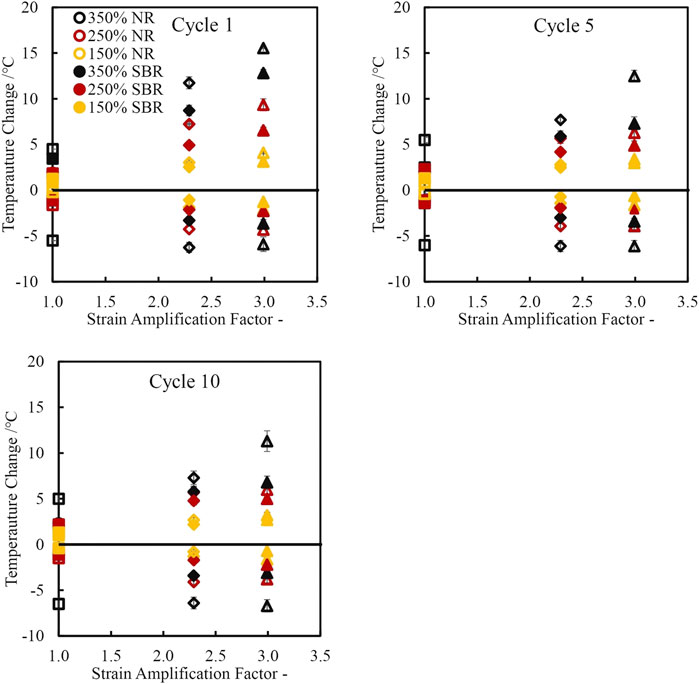
FIGURE 13. Temperature change as a function of strain amplification factor comparing SBR (filled shapes) and NR (unfilled shapes) extended to 350% (black), 250% (red) and 150% (yellow) and retracted after 2 min.
Discussion
The tensile extension moduli of both the NR and SBR compounds scale linearly with strain amplification factors. This is due to matrix overstrain effects; with the CBs with higher aggregate structure enhancing the local strain levels. The mechanical retraction data following the 2 min hold collapse onto each other-independent of the type of CB. This requires further investigation but it may be due to particle-particle and particle-polymer breakdown effects during extension and the 2 min hold which are absent upon retraction. Further analysis to de-convolute the contributions to the stress relaxation during the 2 min hold will provide more insight into this.
Mechanical hysteresis scales with strain amplification factors as well, which is most likely a reflection of these experiments being strain controlled, therefore a stiffer compound naturally gives higher hysteresis at fixed strain.
The thermal data for the NR compounds mirrors the mechanical data with the temperature rise upon extension scaling linearly with the strain amplification factor. Similar to the mechanical data, this is due to matrix overstrain effects where the carbon black aggregates with higher structure CBs enhance microstructural heat dissipation process such as the particle-particle and particle-polymer breakdown and SIC for the NR compounds during extension. The peak stress upon extension scales linearly with the corresponding temperature rise independent of cycle number, strain level and CB type. Upon retraction, the temperature drops show similar values, independent of the CB type.
The temperature data of the non-crystallizing SBR suggests that significant temperature generation upon extension must be related to reversible heat generation from entropic elasticity as well as particle-particle and particle-polymer irreversible heat generation. Substantial temperature drops upon retraction for the SBR compounds is related primarily to entropy elasticity and the values of the temperature drop is also very similar between the unreinforced and reinforced SBR compounds.
The calculation of the SIC extent of the NR compounds using the Plagge-Klüppel method shows some consistency with literature data for direct measurement of SIC from X-ray scattering but also produces some crucial differences. The lack of agreement between calculated crystallinity extents upon extension and then retraction, implies that additional, irreversible thermal effects arising from the inclusion of reinforcing particles are as important or maybe even dominate over the SIC contribution to heat evolution upon extension at these high strain rates. Further studies at varied strain rates could help to characterize the rate dependent nature of this dissipation in non-strain crystallizing rubbers. For particle reinforced rubbers, it will be necessary to quantitatively account for all these different effects in the future analysis of thermal data sets. Direct measurement of the SIC by X-ray scattering is planned to help de-convolute these thermal effects.
Conclusion
The thermomechanical properties of CB reinforced and unreinforced rubber compounds at large strains were characterized under adiabatic conditions. Two major conclusions can be drawn from the experiments:
1) Matrix overstrain effects play a significant role on microstructure mechanisms such as entropy elasticity, particle-particle and particle-polymer breakdown and SIC during extension. The modulus and temperature rise of the compounds during extension correlated well with calculated strain amplification factors for the various compounds. The calculated strain amplification factors were derived from the morphological properties of CB and based on our results show that the CB aggregate structure influences these microstructural mechanisms at large strain deformations.
2) Observed thermal effects upon extension are influenced and maybe even dominated by irreversible particle-particle and particle-polymer damage effects based on comparison of the results from non-crystallizing SBR and NR. This makes it difficult to accurately decompose the reversible contribution of SIC from the thermal measurements alone. Direct measurements of SIC by X-Ray scattering are planned as a next step in this work.
From a practical standpoint, the correlation of the mechanical and thermal effects with morphological properties of CB is significant since it can be a useful tool in the design of rubber compounds for engineering applications.
Data Availability Statement
The original contributions presented in the study are included in the article/Supplementary Material, further inquiries can be directed to the corresponding author.
Author Contributions
WK-M conducted the experiments, analyzed the results and contributed to the preparation of the manuscript. LT, JP, CH, KA, NP, and JB provided significant intellectual input and guidance in conducting the experiments, analyzing and interpreting the results and contributed to the preparation of the manuscript.
Funding
The PhD project for which this research work was conducted is sponsored by Birla Carbon. NP is supported by the European Union within the project LIFE19 ENV/IT/000213–LIFE GREEN VULCAN.
Conflict of Interest
Authors LT and CH were employed by company Birla Carbon, United States.
The remaining authors declare that the research was conducted in the absence of any commercial or financial relationships that could be construed as a potential conflict of interest.
Publisher’s Note
All claims expressed in this article are solely those of the authors and do not necessarily represent those of their affiliated organizations, or those of the publisher, the editors and the reviewers. Any product that may be evaluated in this article, or claim that may be made by its manufacturer, is not guaranteed or endorsed by the publisher.
Acknowledgments
The authors would like to thank Birla Carbon for funding and providing the materials studied in this article.
Supplementary Material
The Supplementary Material for this article can be found online at: https://www.frontiersin.org/articles/10.3389/fmats.2021.743146/full#supplementary-material
References
Akutagawa, K., Hamatani, S., and Nashi, T. (2015). The New Interpretation for the Heat Build-Up Phenomena of Rubbery Materials during Deformation. Polymer 66 (1), 201–209. doi:10.1016/j.polymer.2015.04.040
Allegra, G., Raos, G., and Vacatello, M. (2008). Theories and Simulations of Polymer-Based Nanocomposites: From Chain Statistics to Reinforcement. Prog. Polym. Sci. 33 (7), 683–731. doi:10.1016/j.progpolymsci.2008.02.003
Anthony, R. L., Caston, R. H., and Guth, E. (1942). Equations of State for Natural and Synthetic Rubber-like Materials. I. Unaccelerated Natural Soft Rubber. J. Phys. Chem. 46 (8), 826–840. doi:10.1021/j150422a005
ASTM D2663-14 (2019). “Standard Test Methods for Carbon Black—Dispersion in Rubber,” in Annual Book of ASTM Standard.
ASTM International (2019). “ASTM Standard D2414-19,” in Standard Test Method for Carbon Black–Oil Absorption Number (OAN). (West Conshohocken, Pennsylvania: Annu. Book ASTM Stand. 09.01.
ASTM International (2019). “ASTM Standard D3493-19a,” in Standard Test Method for Carbon Black–Oil Absorption Number of Compressed Sample (COAN). (West Conshohocken, Pennsylvania: Annu. Book ASTM Stand. 09.01.
ASTM International (2019). “ASTM Standard D6556-19a,” in Standard Test Method for Carbon Black—Total and External Surface Area by Nitrogen. (West Conshohocken, Pennsylvania: Annu. Book ASTM Stand. 09.01.
Behnke, R., Kaliske, M., and Klüppel, M. (2016). Thermo-mechanical Analysis of Cyclically Loaded Particle-Reinforced Elastomer Components: Experiment and Finite Element Simulation. Rubber Chem. Techn. 89, 154–176. doi:10.5254/rct.15.84852
Browne, A. L., and Wickliffe, L. E. (1979). Rubber Emissivity and the Thermal State of Tires. Tire Sci. Techn. 7 (3), 71–89. doi:10.2346/1.2151015
Brüning, K., Schneider, K., Roth, S. V., and Heinrich, G. (2015). Kinetics of Strain-Induced Crystallization in Natural Rubber: A Diffusion-Controlled Rate Law. Polymer 72, 52–58. doi:10.1016/j.polymer.2015.07.011
Brüning, K., Schneider, K., Roth, S. V., and Heinrich, G. (2013). Strain-induced Crystallization Around a Crack Tip in Natural Rubber under Dynamic Load. Polymer 54, 6200–6205. doi:10.1016/j.polymer.2013.08.045
Candau, N., Chazeau, L., Chenal, J.-M., Gauthier, C., Ferreira, J., Munch, E., et al. (2012). Characteristic Time of Strain Induced Crystallization of Crosslinked Natural Rubber. Polymer 53, 2540–2543. doi:10.1016/j.polymer.2012.04.027
Chenal, J.-M., Gauthier, C., Chazeau, L., Guy, L., and Bomal, Y. (2007). Parameters Governing Strain Induced Crystallization in Filled Natural Rubber. Polymer 48, 6893–6901. doi:10.1016/j.polymer.2007.09.023
Clough, J. M., Creton, C., Craig, S. L., and Sijbesma, R. P. (2016). Covalent Bond Scission in the Mullins Effect of a Filled Elastomer: Real-Time Visualization with Mechanoluminescence. Adv. Funct. Mater. 26, 9063–9074. doi:10.1002/adfm.201602490
Dhawan, M., and Chawla, R. (2019). A Computational Study on Thermo-Mechanical Characterization of Carbon Nanotube Reinforced Natural Rubber. MRS Adv. 4, 1161–1166. doi:10.1557/adv.2018.680
Diani, J., Fayolle, B., and Gilormini, P. (2009). A Review on the Mullins Effect. Eur. Polym. J. 45, 601–612. doi:10.1016/j.eurpolymj.2008.11.017
Domurath, J., Saphiannikova, M., Ausias, G., and Heinrich, G. (2012). Modelling of stress and strain amplification effects in filled polymer melts. J. Nonnewton Fluid. Mech. 171–172, 8–16. doi:10.1016/j.jnnfm.2012.01.001
Fröhlich, J., Niedermeier, W., and Luginsland, H.-D. (2005). The Effect of Filler-Filler and Filler-Elastomer Interaction on Rubber Reinforcement. Compos. A: Appl. Sci. Manuf. 36, 449–460. doi:10.1016/j.compositesa.2004.10.004
Gent, A. N. (2012). Engineering with Rubber: How to Design Rubber Components. Cincinnati, Munich: Hanser.
Gough, J. (1805). A Description of a Property of Caoutchouc, or Indian Rubber. Mem. Literaci Philos. Soc. Manch. 1, 288–295.
Grosch, K., Harwood, J. A. C., and Payne, A. R. (1967). Breaking Energy of Rubbers. Rubber Chem. Techn. 40 (3), 815–816. doi:10.5254/1.3539096
Houwink, R. (1956). Slipping of Molecules during the Deformation of Reinforced Rubber. Rubber Chem. Techn. 29 (3), 888–893. doi:10.5254/1.3542602
Huber, G., and Vilgis, T. (1999). Universal Properties of Filled Rubbers: Mechanisms for Reinforcement on Different Length Scales. Kautschuk Gummi Kunststoffe 52, 102–107.
Huneau, B. (2011). Strain-induced Crystallization of Natural Rubber: A Review of X-Ray Diffraction Investigations. Rubber Chem. Technol. 84, 425–452. doi:10.5254/1.3601131
Joule, J. (1859). V. On Some Thermo-Dynamic Properties of Solids. Phil. Trans. R. Soc. 149, 91–131. doi:10.1098/rstl.1859.0005
Klüppel, M. (2003). The Role of Disorder in Filler Reinforcement of Elastomers on Various Length Scales. Adv. Polym. Sci. 164, 1–86. doi:10.1007/b11054
Le Cam, J.-B., Albouy, P.-A., and Charlès, S. (2020). Comparison between X-ray Diffraction and Quantitative Surface Calorimetry Based on Infrared Thermography to Evaluate Strain-Induced Crystallinity in Natural Rubber. Rev. Scientific Instr. 91, 044902. doi:10.1063/1.5141851
Le Cam, J.-B., Samaca Martinez, J. R., Balandraud, X., Toussaint, E., and Caillard, J. (2015). Thermomechanical Analysis of the Singular Behavior of Rubber: Entropic Elasticity, Reinforcement by Fillers, Strain-Induced Crystallization and the Mullins Effect. Exp. Mech. 55, 771–782. doi:10.1007/s11340-014-9908-9
Le Saux, V., Marco, Y., Calloch, S., and Charrier, P. (2013). Contribution of Accurate thermal Measurements to the Characterisation of Thermomechanical Properties of Rubber-like Materials. Plast. Rubber Compos. 41 (7), 277–284. doi:10.1179/1743289812Y.0000000015
Le, T. H., Yoshikawa, T., Kurokawa, Y., and Inoue, H. (2020). A Quantitative Study on Temperature Variation of Rubber under Steady State Uniaxial Tensile Cyclic Loading. Mech. Mater. 148, 103523. doi:10.1016/j.mechmat.2020.103523
Lee, D. J., and Donovan, J. A. (1987). Microstructural Changes in the Crack Tip Region of Carbon-Black-Filled Natural Rubber. Rubber Chem. Techn. 60, 910–923. doi:10.5254/1.3536164
Liu, C., Dong, B., Zhang, L.-Q., Zheng, Q., and Wu, Y.-P. (2015). Influence of Strain Amplification Near Crack Tip on the Fracture Resistance of Carbon Black-Filled SBR. Rubber Chem. Techn. 88 (2), 276–288. doi:10.5254/rct.15.85956
Luukkonen, A., Sarlin, E., Villman, V., Hoikkanen, M., Vippola, M., Kallio, M., et al. (2009). Heat Generation in Dynamic Loading of Hybrid Rubber-Steel Composite Structure. In ICCM17 Conference Proceedings. (Edinburgh: International Conference on Composite Materials.)
Mark, J. E., and Erman, B. (2007). “Strain-induced Crystallization and Ultimate Properties,” in Rubberlike Elasticity: A Molecular Primer. Editors J. E. Mark, and B. Erman. 2nd ed. (Cambridge: Cambridge University Press), 117–130. doi:10.1017/CBO9780511541322.014
Medalia, A. I. (1972). Effective Degree of Immobilization of Rubber Occluded within Carbon Black Aggregates. Rubber Chem. Techn. 45 (5), 1171–1194. doi:10.5254/1.3544731
Merabia, S., Sotta, P., and Long, D. R. (2008). A Microscopic Model for the Reinforcement and the Nonlinear Behavior of Filled Elastomers and Thermoplastic Elastomers (Payne and Mullins Effects). Macromolecules 41, 8252–8266. doi:10.1021/ma8014728
Meyer, K. H., and Ferri, C. (1935). The Elasticity of Rubber. Rubber Chem. Techn. 8, 319–334. doi:10.5254/1.3539443
Mooney, M. (1940). A Theory of Large Elastic Deformation. J. Appl. Phys. 11 (9), 582–592. doi:10.1063/1.1712836
Mullins, L. (1948). Effect of Stretching on the Properties of Rubber. Rubber Chem. Techn. 21, 281–300. doi:10.5254/1.3546914
Mullins, L., and Tobin, N. R. (1966). Stress Softening in Rubber Vulcanizates. Part I. Use of a Strain Amplification Factor to Describe Elastic Behavior of Filler-Reinforced Vulcanized Rubber. Rubber Chem. Techn. 39 (4), 799–813. doi:10.5254/1.3547144
Payne, A. R., Whittaker, R. E., and Smith, J. F. (1972). Effect of Vulcanization on the Low-Strain Dynamic Properties of Filled Rubbers. J. Appl. Polym. Sci. 16, 1191–1212. doi:10.1002/app.1972.070160513
Plagge, J., and Klüppel, M. (2018). Determining Strain-Induced Crystallization of Natural Rubber Composites by Combined Thermography and Stress-Strain Measurements. Polym. Test. 66, 87–93. doi:10.1016/j.polymertesting.2017.12.021
Plagge, J., and Lang, A. (2021). Filler-polymer Interaction Investigated Using Graphitized Carbon Blacks: Another Attempt to Explain Reinforcement. Polymer 218, 123513. doi:10.1016/j.polymer.2021.123513
Rault, J., Marchal, J., Judeinstein, P., and Albouy, P. A. (2006). Stress-Induced Crystallization and Reinforcement in Filled Natural Rubbers: 2H NMR Study. Macromolecules 39, 8356–8368. doi:10.1021/ma0608424
Rivlin, R. (1948). Large Elastic Deformations of Isotropic Materials IV. Further Developments of the General Theory. Phil. Trans. R. Soc. Lond. A. 241 (835), 379–397. doi:10.1098/rsta.1948.0024
Samaca Martinez, J. R., Balandraud, X., Toussaint, E., Le Cam, J.-B., and Berghezan, D. (2014). Thermomechanical Analysis of the Crack Tip Zone in Stretched Crystallizable Natural Rubber by Using Infrared Thermography and Digital Image Correlation. Polymer 55, 6345–6353. doi:10.1016/j.polymer.2014.10.010
Samaca Martinez, J. R., Le Cam, J.-B., Balandraud, X., Toussaint, E., and Caillard, J. (2013). Mechanisms of Deformation in Crystallizable Natural Rubber. Part 1: Thermal Characterization. Polymer 54, 2717–2726. doi:10.1016/j.polymer.2013.03.011
Sotta, P., and Albouy, P.-A. (2020). Strain-Induced Crystallization in Natural Rubber: Flory's Theory Revisited. Macromolecules 53 (8), 3097–3109. doi:10.1021/acs.macromol.0c00515
Spratte, T., Plagge, J., Wunde, M., and Klüppel, M. (2017). Investigation of Strain-Induced Crystallization of Carbon Black and Silica Filled Natural Rubber Composites Based on Mechanical and Temperature Measurements. Polymer 115, 12–20. doi:10.1016/j.polymer.2017.03.019
Su, T.-K., and Mark, J. E. (1977). Effect of Strain-Induced Crystallization on the Elastomeric Properties of Cis-1,4-Polybutadiene Networks. Macromolecules 10 (1), 120–125. doi:10.1021/ma60055a025
Toki, S., Che, J., Rong, L., Hsiao, B. S., Amnuaypornsri, S., Nimpaiboon, A., et al. (2013). Entanglements and Networks to Strain-Induced Crystallization and Stress-Strain Relations in Natural Rubber and Synthetic Polyisoprene at Various Temperatures. Macromolecules 46, 5238–5248. doi:10.1021/ma400504k
Tosaka, M., Kawakami, D., Senoo, K., Kohjiya, S., Ikeda, Y., Toki, S., et al. (2006). Crystallization and Stress Relaxation in Highly Stretched Samples of Natural Rubber and its Synthetic Analogue. Macromolecules 39, 5100–5105. doi:10.1021/ma060407
Tosaka, M. (2007). Strain-Induced Crystallization of Crosslinked Natural Rubber as Revealed by X-ray Diffraction Using Synchrotron Radiation. Polym. J. 39 (12), 1207–1220. doi:10.1295/polymj.PJ2007059
Trabelsi, S., Albouy, P.-A., and Rault, J. (2003). Effective Local Deformation in Stretched Filled Rubber. Macromolecules 36, 9093–9099. doi:10.1021/ma0303566
Tunnicliffe, L. B. (2021a). Fatigue Crack Growth Behavor of Carbon Black-Reinforced Natural Rubber. Rubber Chem. Techn 94 (3), 494–514. doi:10.5254/rct.21.79935
Tunnicliffe, L. B. (2021b). Thixotropic Flocculation Effects in Carbon Black-Reinforced Rubber: Kinetics and Thermal Activation. Rubber Chem. Techn. 94, 298–323. doi:10.5254/rct.21.79896
Keywords: carbon black, strain amplification, thermomechanical characterization, strain induced crytallization, elastomer, Mullins effect, thermography, hysteresis
Citation: Kyei-Manu WA, Tunnicliffe LB, Plagge J, Herd CR, Akutagawa K, Pugno NM and Busfield JJC (2021) Thermomechanical Characterization of Carbon Black Reinforced Rubbers During Rapid Adiabatic Straining. Front. Mater. 8:743146. doi: 10.3389/fmats.2021.743146
Received: 17 July 2021; Accepted: 23 September 2021;
Published: 15 October 2021.
Edited by:
Dong Xiang, Southwest Petroleum University, ChinaReviewed by:
Sanjay Mavinkere Rangappa, King Mongkut’s University of Technology North Bangkok, ThailandXiaodong Qi, Southwest Jiaotong University, China
Copyright © 2021 Kyei-Manu, Tunnicliffe, Plagge, Herd, Akutagawa, Pugno and Busfield. This is an open-access article distributed under the terms of the Creative Commons Attribution License (CC BY). The use, distribution or reproduction in other forums is permitted, provided the original author(s) and the copyright owner(s) are credited and that the original publication in this journal is cited, in accordance with accepted academic practice. No use, distribution or reproduction is permitted which does not comply with these terms.
*Correspondence: William Amoako Kyei-Manu, w.a.kyei-manu@qmul.ac.uk