Laser-induced breakdown spectroscopy of aqueous silicone rubber in an argon environment
 Yu Deng
 Bo Peng2
 - 1State Key Laboratory of Power Grid Environmental Protection (China Electric Power Research Institute), Beijing, China
- 2State Grid Corporation of China, Beijing, China
In a high humidity environment, the absorption of water in silicone rubber results in a significant decline or even loss in insulation performance, and the detection of the moisture content of silicone rubber is conducive to timely measuring the water absorption of silicone rubbers. Currently, the moisture content of silicone rubber can only be detected through manual sampling and laboratory analysis, which lack electric field analysis methods. Therefore, this paper proposes using laser-induced breakdown spectroscopy for the rapid qualitative and quantitative analysis of the moisture content of silicone rubber. Experiments were conducted on 50 silicone rubber samples with different moisture contents, with argon gas sprayed onto the sample surfaces to eliminate the interference of H and O elements in the air; a better argon gas flow rate of 3 L/min was determined. The information comprising the intensity and intensity ratio of the elemental spectral lines in the LIBS spectra of silicone rubber with moisture content was analyzed, with the results indicating that H elemental intensity increased as moisture content increased. Compared with the dry silicone rubber, the variation range of H/O and Al/H elements in the samples with different moisture contents was larger. Multivariate analysis was performed using a partial least squares regression model for the aqueous silicone rubber samples, and the model fit was obtained as 0.8088. The model prediction was better for the samples with moisture contents greater than 0.4%. The results indicated that the LIBS technique quantitatively analyzes the moisture content of silicone rubber, which is significant for improving the operation and maintenance of electric transmission lines.
Introduction
Silicone rubber composites, as a new generation of insulation materials, have a wide range of applications in high-voltage transmission and substation equipment, with excellent resistance to high and low temperatures, surface hydrophobicity, and good electrical insulation properties, and other advantages. The application of silicone rubber is significant for improving the stability and safety of power systems. However, with the increase in operating life, under the influence of humidity, surface discharge, UV exposure, and other factors, the gradual operational failures indicate the weaknesses of silicone rubber materials, including the fracturing of composite insulator core bar, umbrella skirt aging, and end heating (Janssen et al., 1999). In 2013, a provincial branch of a power grid company conducted an infrared temperature measurement inspection of 4,692 lines using composite insulators across the grid, with the results revealing that four lines exhibited abnormal heating. In high humidity climates, polarization of the molecules from water, polar groups of material and the interlayer resulted in the abnormal heating (Cheng et al., 2016).
Moisture can affect the operational performance of composite insulators and cables, and the study of water absorption and permeability of silicone rubber can aid in investigating the methods to inhibit water intrusion into silicone rubber and explore the mechanism of operational failures. Several researchers have studied the water absorption patterns of silicone rubber and its performance changes from the perspectives of environmental factors (temperature and humidity, solution composition and concentration) and sample properties (inorganic filler composition and ratio, sample thickness). Gao et al. conducted water absorption experiments on homemade high tensile vulcanizing (HTV) silicone using the weighing method, obtained and analyzed the curve of sample weight with water absorption time, and analyzed the parameters such as the water diffusion coefficient of the material (Gao et al., 2015). Gong et al. conducted moisture absorption experiments on the umbrella skirts of insulators in the operating state and found that the values of dielectric loss factor and conductivity are rising, thus accelerating degradation of mechanical and insulating properties (Gong et al., 2013). Wang et al. investigated the water absorption of silicone rubber in deionized water and different concentrations of NaCl and
Currently, the moisture content of silicone rubber can only be determined by weighing the mass change of the sample before and after water absorption, which cannot be applied to insulator operation sites. Laser-induced breakdown spectroscopy (LIBS) focuses a high-powered pulsed laser onto the sample surface through an optical device to ablate the sample, with plasma generated under the high-energy laser. The atomic or ionic spectrum of the plasma is captured by the spectrometer, while the wavelength and intensity of the spectrum line are analyzed to obtain the elements and contents of the sample. Thus, in this manner, the qualitative and quantitative analysis of the sample can be completed. The LIBS technique does not require complex sample preparation and has the advantages of being in-situ, online, fast, and accurate. It can be used at a distance using an optical system consisting of a telescope, is nearly non-destructive, and has no effect on the electrical insulation properties of the composite insulator (Wang et al., 2016a). As a result, the LIBS technique has been widely researched and applied in fields such as deep-sea exploration (Guirado et al., 2012; Li et al., 2012), cultural relic identification (Li et al., 2020; Yu et al., 2021), coal mine steel (Dong et al., 2020; Li et al., 2021), and biomedicine (Zheng et al., 2020; Guo et al., 2021). Using LIBS technology to detect the moisture content of silicone rubber is useful for promptly measuring the water absorption of silicone rubber and providing more information to operation and maintenance personnel.
This study investigated the effect of sample moisture content on the spectral information of LIBS elements to exclude the interference of hydrogen and oxygen in the air environment on the measurement results. The elements, such as the intensity and intensity ratio of spectral lines, were investigated by blowing argon gas on the sample surface and analyzing Fe, Al, Si, H, O, and Ar—the main constituent elements in silicone rubber and the environment—to establish the quantitative relationship between the moisture content and the normalized intensity of spectral lines.
Experiment
LIBS experimental setup
Figure 1 shows the schematic diagram of the LIBS device, comprising a laser source, optical focusing system, signal acquisition system, spectrometer, signal delay generator, and computer (Wang et al., 2018). Its basic principle is that the high-energy laser emitted by the pulsed laser generator is reflected by the dielectric film reflector and enters the focusing lens to be focused on the sample surface to produce ablation and excite the plasma spectral signal. The plasma emitting the spectral signal is a point source, and part of the spectral signal is coupled to the fiber optic probe connected to the spectrometer after being focused by a short focal length lens. LIBS spectra have apparent spatio-temporal characteristics, the digital delay generator controls the timing of laser excitation and spectral acquisition by the spectrometer, and the linear spectral signal is acquired by the spectrometer and transmitted to the computer for storage to obtain information on the composition and state of the sample for subsequent analysis (Gruber et al., 2001).
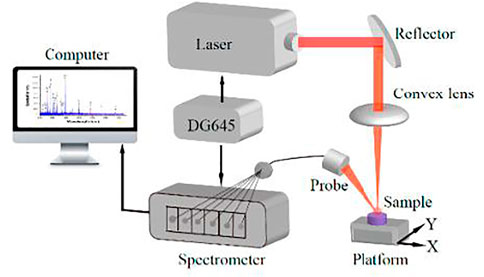
FIGURE 1. Schematic diagram of LIBS device.
The laser generates laser pulses to provide energy for the entire excitation process. The experiments were performed using a nanosecond Nd: YAG laser generator model Nimma-900 from Beamtech Optronics (Beijing, China), which can output four different wavelengths of 1,064, 532, 355, and 266 nm through switching. The laser wavelength was selected as 1,064 nm in the experiments because the energy of this wavelength laser is stable and has a low decay rate in air. Moreover, 1,064 nm does not overlap with the measurement wavelength range of the spectrometer and does not affect the collected spectrum.
We selected two spectrometers for simultaneous acquisition to obtain the wavelength range from 200 to 1,000 nm. Spectrometer 1 was an Avantes AVS-RACKMOUNT-USB2, with a wavelength range of 200–640 nm and resolution of 0.09–0.13 nm. Spectrometer 2 was an Ocean Insight Ocean Optics MX2500+, with a wavelength range of 600–1,000 nm and resolution of 0.03–0.1 nm. Under a collecting angle of 45°, the collected spectral signal was stronger, a convex lens with a diameter of 6 cm was selected, and the distance between the convex lens and the sample ablation point was adjusted to collect as much optical signal from the plasma as possible, and the fiber optic probe was placed at the focal point of the convex lens concentrating laser rays. Subsequently, Avasoft 8.8 and MaxLIBS were used to convert and store the signals collected, respectively.
The digital delay generator was an eight-channel digital delay generator DG645, with a delay resolution of all channels of 5 ps, channel-to-channel jitter of fewer than 25 ps, and a delay control precision of 1 ns. Using this generator to set the delay of the laser and the spectrometer, we generated the Q-switch switch signals of the laser generator and the external trigger signals of the spectrometer, thus controlling the timing.
Sample configuration
The HTV silicone rubber used for the experiments was a sheet silicone rubber produced by Dongguan High Energy, comprising the main components of methyl vinyl siloxane, fumed silica, and aluminum hydroxide (Xing and Wang, 2000), with dimensions of 100 × 120 × 2 mm, which was divided into 50 × 50 × 2 mm using a knife to prepare samples with different moisture contents. The sample surfaces were first wiped with anhydrous ethanol and deionized water in turn, placed in an oven at 120°C, removed after 5 days, and set to cool. The initial mass of the samples
The saturated water absorption of silicone rubber was determined as follows: the rate of change of the sample mass was measured at intervals of 30 days, and if the value obtained from the latter measurement was within 98–102% of the previous one, the sample was considered saturated with water absorption; after the preliminary experiments, we observed that the saturated water absorption of the experimental silicone rubber was about 0.8–0.9%.
According to the experimental method of water absorption of silicone rubber, 50 samples with moisture content ranging from 0 to 0.85% were obtained, and the experimental parameters were set to the laser energy of 44.7 mJ and the delay time of 3 μs. During the experiment, five points were randomly selected on the surface of the samples, and the data obtained from 10 consecutive shots at each point were averaged as the spectral value of that point.
Argon flow rate optimization
Blowing and purging argon gas onto the sample surface excludes the effect of air and improves the quality of the spectrum. As shown in Figure 2, two gas tubes were tilted at 45° above the sample, with the gas nozzle as close to the sample surface as possible without interfering with the vertically incident laser pulse and without affecting the spectrometer’s light collection; different argon gas flow rates were set through the gas reduction valve.
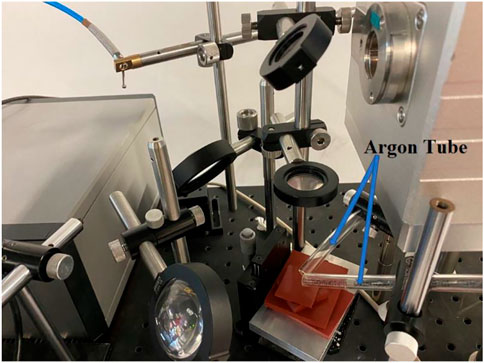
FIGURE 2. Argon tube purging sample surface device diagram.
When the argon flow rate is exceedingly low, the air cannot be completely isolated; when the argon flow rate is too high, it may interfere with the plasma formation. The effect of argon flow rate on the quality of the spectrum must be explored and a suitable argon flow rate selected.
The spectra of silicone rubber were collected at argon flow rates of 0, 3, 5, 10, and 15 L/min, respectively, as shown in Figures 3A,B. The intensity of the H-element spectra was significantly higher in the argon environment than in the air environment; the intensity of the O-element spectra was relatively low and not significantly affected by the gas factor. The relative spectral line intensities varied slightly as the argon flow rate increased.
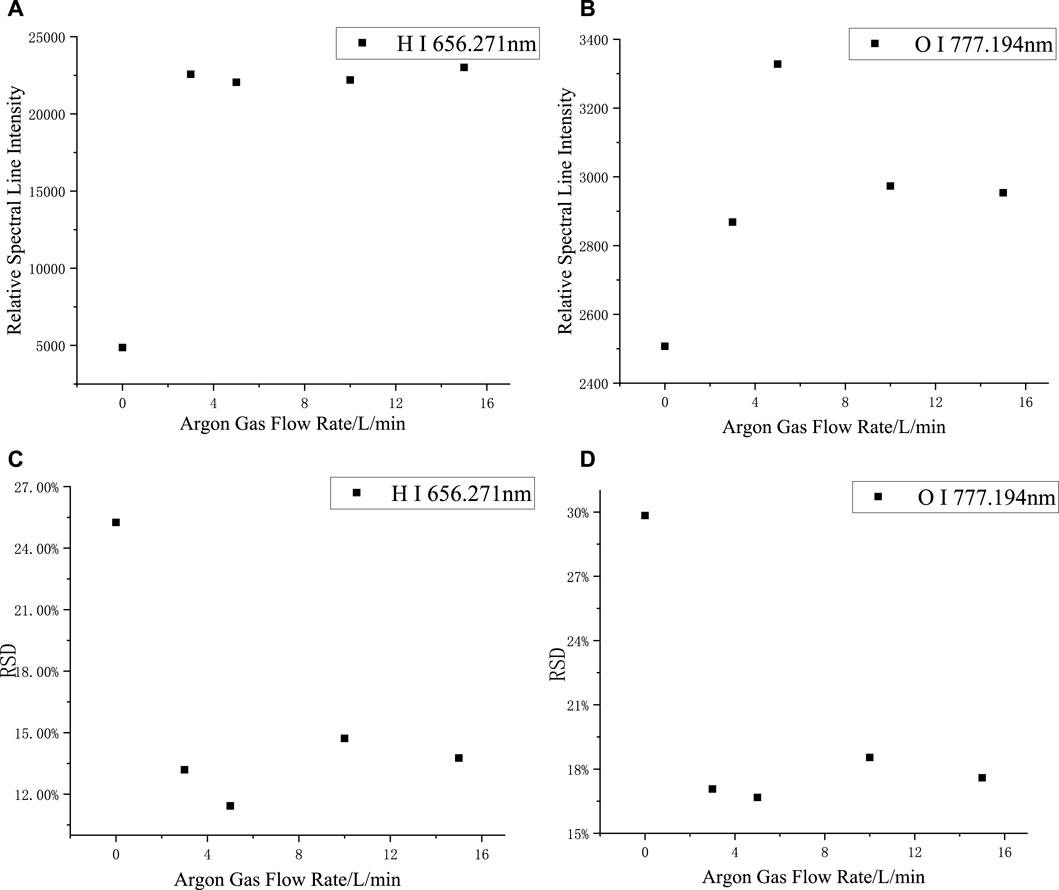
FIGURE 3. Changes of relative spectral line intensity and RSD with Argon flow rate: (A) H I 656.271 nm, (B) O I 777.194 nm, (C) O I 656.271 nm, (D) O I 777.194 nm.
When the argon flow rate is small, although the relative intensity of the spectra is larger, the output argon flow rate is not completely stable. For smaller argon flow rates, the effect on the spectra may be greater when the gas flow amount fluctuates. As shown in Figures 3C,D, the relative standard deviation (RSD) of the H and O spectral lines reflected the magnitude of the fluctuation of the spectrum; the smaller the RSD, the more stable the spectra. Compared with the air environment, the RSD in the argon environment was significantly reduced, and when the flow rate of argon varied, the RSD was always within the range of 12–14%, thus confirming that a more stable spectrum can be obtained in an argon environment. Considering gas conservation, the Argon flow rate was selected to be 3 L/min.
Results and discussion
Effect of moisture content on the intensity of the spectral lines
The changes in the relative spectral line intensities of the elements can most directly reflect the effect of sample moisture content on the LIBS experiment. As shown in Figure 4, when the moisture content increased, the relative spectral line intensities of Fe, Al, Si, and O all decreased initially and then increased, and the turning point of the spectral line intensities corresponded to the moisture content of about 0.4%; larger data dispersion of the spectral line intensities of Ar elements is shown; the spectral line intensities of H elements continued increasing and the increase slowed after the moisture content exceeded 0.4%.
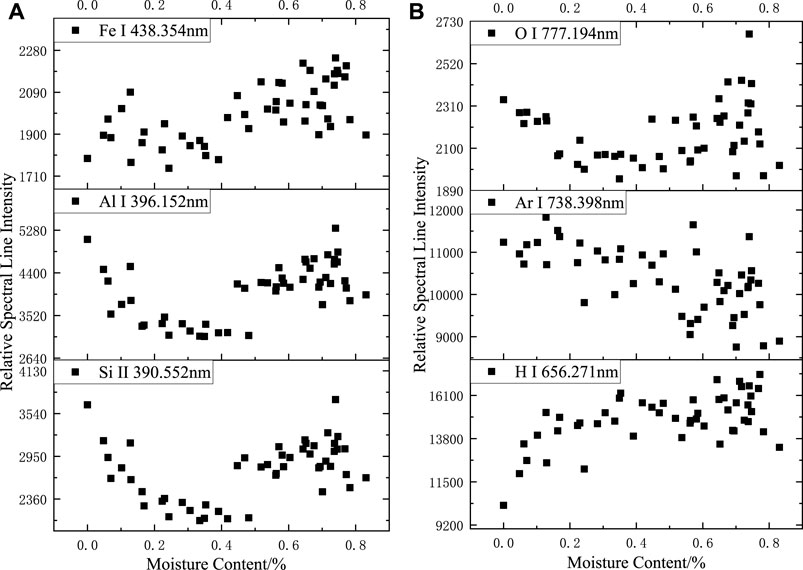
FIGURE 4. Relationship between relative spectral line intensity and sample moisture content in argon: (A) Fe I 438.354 nm; Al I 396.152 nm. Si II 390.552 nm, (B) O I 777.194 nm; Ar I 738.398 nm. (B) O I 777.194 nm; Ar I 738.398 nm. H I 656.271 nm.
Based on the results of the analysis of LIBS spectra of deionized water in the argon environment, the O-element spectral lines were more likely produced by the ablation of siloxane and aluminum hydroxide in the silicone rubber body, which explains the similarity of the trend of the O-element spectral lines with the variation trend of Fe, Al, and Si. The spectral intensities of the Fe, Al, and Si spectral lines before and after the turning point were clearly divided, and when the moisture content was high, the spectral intensity including the O-element spectral lines tended to be more randomly distributed within a certain range.
The trend of the Fe, Al, Si, and O elemental spectral line intensity change was similar to that of the H, O, and N spectral lines in the air environment: when the moisture content was low, the water absorbed energy, which resulted in lower overall laser energy absorption by the silicone rubber, smaller volume of ablation pits, and lower spectral intensity; when the moisture content increased further, the shallower ablation pits had a confining effect on the plasma, causing a relative increase in spectral intensity. When the moisture content was high, the stability of the spectrum was weakened with larger fluctuations in relative spectral intensity.
The relative spectral intensity of the Ar element fluctuated continuously as the moisture content changed, and no apparent pattern was observed. The argon gas was continuously delivered to the surface of the sample through the argon tube; thus, it participated in the laser ablation process. For different samples at different times, the argon gas content above the sample was different, which directly affected the magnitude of the Ar atomic line intensity, resulting in no apparent pattern of Ar atomic line change when the moisture content was different.
When the moisture content of the sample increased, the H-element content of the plasma produced by ablating the sample increased. Accordingly, the H atomic spectral line intensity increases; the H atomic spectral line intensity did not increase linearly with increasing moisture content owing to the presence of the H element in the silicone rubber body and because moisture content had an effect on the overall spectral stability.
After the normalization of the full spectrum, as shown in Figure 5, no apparent pattern was observed in the variation in the spectral intensity of Fe, Al, and Si at different moisture contents, and the fluctuation of the spectral data resulted more from the irregular distribution of the elemental content in silicone rubber at this time. The trend of spectral line intensity variation with moisture content after normalization of H, O, and Ar element spectral lines was more significant than that before normalization. When the moisture content of the sample increased, the intensity of H element after normalization increased and then remained unchanged, the intensity of O element after normalization decreased and then remained unchanged, and the intensity of Ar element after normalization decreased.
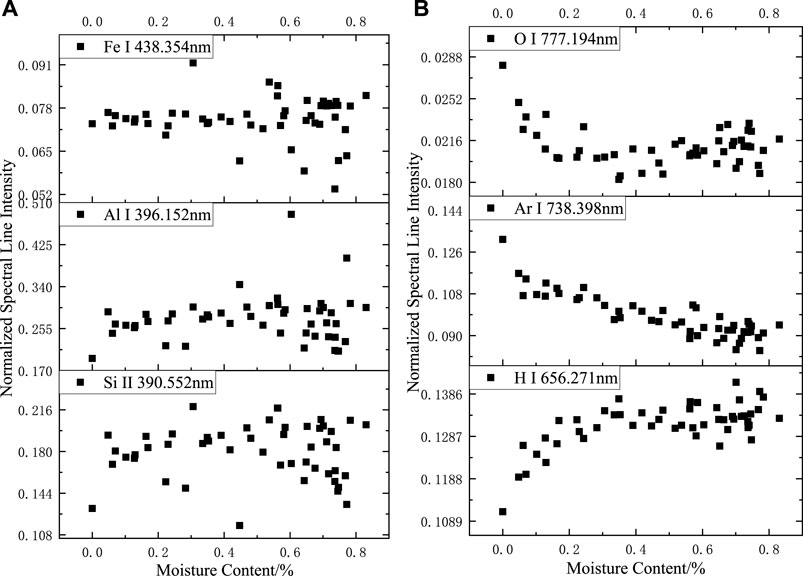
FIGURE 5. Relationship between normalized spectral line intensity and sample moisture content in argon: (A) Fe I 438.354 nm; Al I 396.152 nm. Si II 390.552 nm, (B) O I 777.194 nm; Ar I 738.398 nm. H I 656.271 nm.
Figure 6 shows the variation trend of the full-spectra intensity with moisture content. The spectra collected by spectrometer 1 were primarily from metallic elements in the body of silicone rubber. As the reference signal in the full-spectra normalization, the trend of the full-spectra intensity from spectrometer 1 was similar to the trend of the relative spectral intensity of Fe, Al, Si, and O, which all increased and then decreased with the increase in moisture content; this indicated that most of the emission spectra of silicone rubber were affected to a similar extent by the moisture content of the sample after the plasma was generated by ablation, and the normalizing data in the argon environment could, to a certain extent, eliminate the effect of moisture content on the silicone rubber spectral data.
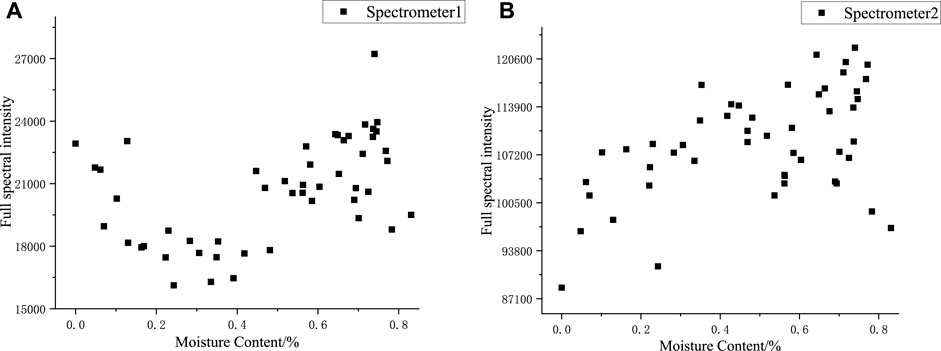
FIGURE 6. Full spectral intensities of samples with different moisture content: (A) 200–640nm, (B) 600–1000 nm.
The spectra collected by spectrometer 2 were primarily from non-metallic elements, and the spectral peaks of the full spectra of spectrometer 2 were identified, which included one H elemental spectral line, three O elemental spectral lines, and fifteen Ar elemental spectral lines. From the variation pattern of the relative intensities of H, O, and Ar spectral lines as moisture content changed, the relative spectral intensity of H and Ar elements was higher, five to six times that of O elements, and the variation pattern of the Ar elemental spectral intensity was not apparent; thus, the trend of the full spectral intensity from spectrometer 2 was similar to the trend of the relative spectral intensity of H elements. The spectral data did not only contain the information on the sample element concentration but also revealed the change in the physical and chemical properties of the sample or the detection environment. The normalized spectral line intensities of H, O, and Ar elements are well correlated with the moisture content, and the normalized spectral line intensities could be used to characterize the moisture content.
Effect of moisture content on the spectral intensity ratio
Researchers have classified different compositions of each organic in plastics according to their different C/H spectral intensity ratios using LIBS (Anzano et al., 2000; Anzano et al., 2008). Based on this analytical logic, the large presence of H and O elements in silicone rubber and the ATH in the silicone rubber filler
As the silicone rubber body material consists of more than one composition, the spectral intensity ratios at different shot numbers were used to reveal the data fluctuations of the dried samples due to composition changes. The values of the spectral intensity ratio with moisture content were compared with the range of data variation in the dried silicone rubber. If most of the spectral intensity values were not within the range of data variation in the dried silicone rubber, we could assume that the two elements corresponding to the two spectral intensity ratios in this case were not entirely from the dried silicone rubber; conversely, it indicated that the two elements at different moisture contents were from a source which is in the same state as the dried state.
For the intensity of the elemental spectral lines of Al, Si, H, O, and Ar in an argon environment, Si and Al represent elements from the body of silicone rubber and Ar elements from the experimental environment. In addition to comparing the intensity ratios of the three elemental spectral lines of Al, O, and H, the intensity ratios of Si to Al contained in the silicone rubber, and Ar to Ar in the environment were used as controls.
Figures 7, 8 show the double x-coordinate plots, where the “square” represents the variation in the spectral intensity ratio with moisture content, and the “triangle” represents the variation in the spectral intensity ratio with the shot number for dry silicone rubber. As shown in the figure, when the moisture content changed, the composition of the argon gas and the silicone rubber body did not change, and their spectral intensity ratios changed with moisture content in the same range as in the dried silicone rubber. At different moisture contents, only the H I 656.271 nm/O I 777.194 nm and Al I 396.152 nm/H I 656.271 nm spectral intensity ratios were outside the range of the dried silicone rubber data. Thus, the H-element emission spectral intensity was considered to more likely result from ablation of the water absorbed by the silicone rubber, which caused the Al/H spectral intensity ratio to indicate a difference when the moisture content changed from that in the dry silicone rubber. For the Al I 396.152 nm/O I 777.194 nm spectral intensity ratio, when the moisture content was high, more than 70% of the data points corresponded to the dry silicone rubber data points, and the O elemental spectral lines were derived from the silicone rubber.
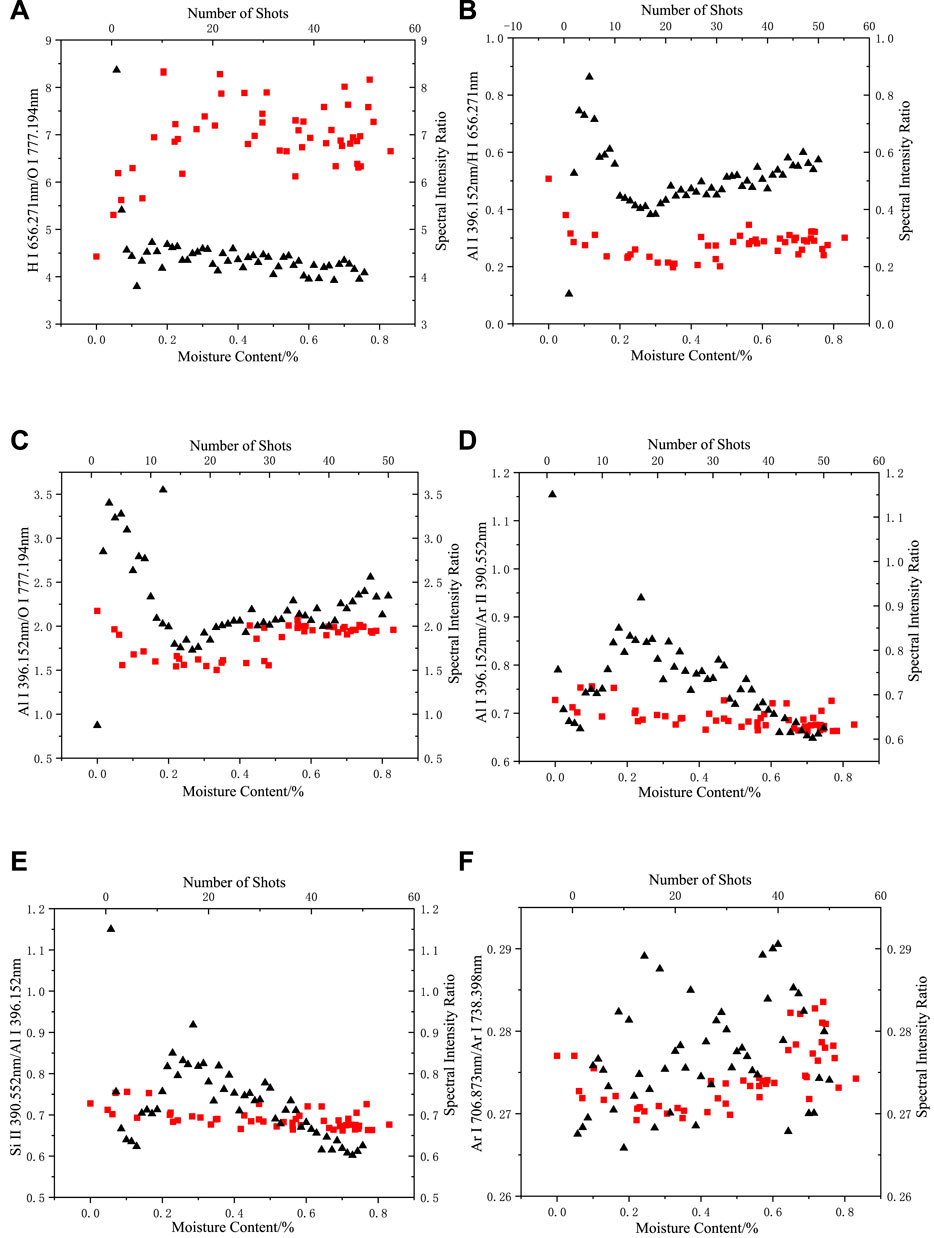
FIGURE 7. Changes in spectral intensity ratio with moisture content and number of shots in an argon environment: (A) H I 656.271 nm/O I 777.194 nm, (B) Al I 396.152 nm/H I 656.271 nm, (C) Al I 396.152 nm/O I 777.194 nm, (D) Al I 396.152 nm/Ar II 390.552 nm, (E) Si II 390.552 nm/Al I 396.152 nm (F) Ar I 706.873 nm/Ar I 738.398 nm (the “square” represents the change of spectral intensity ratio with moisture content, “triangle” represents the change in the spectral intensity ratio of dried silicone rubber with the number of shots).
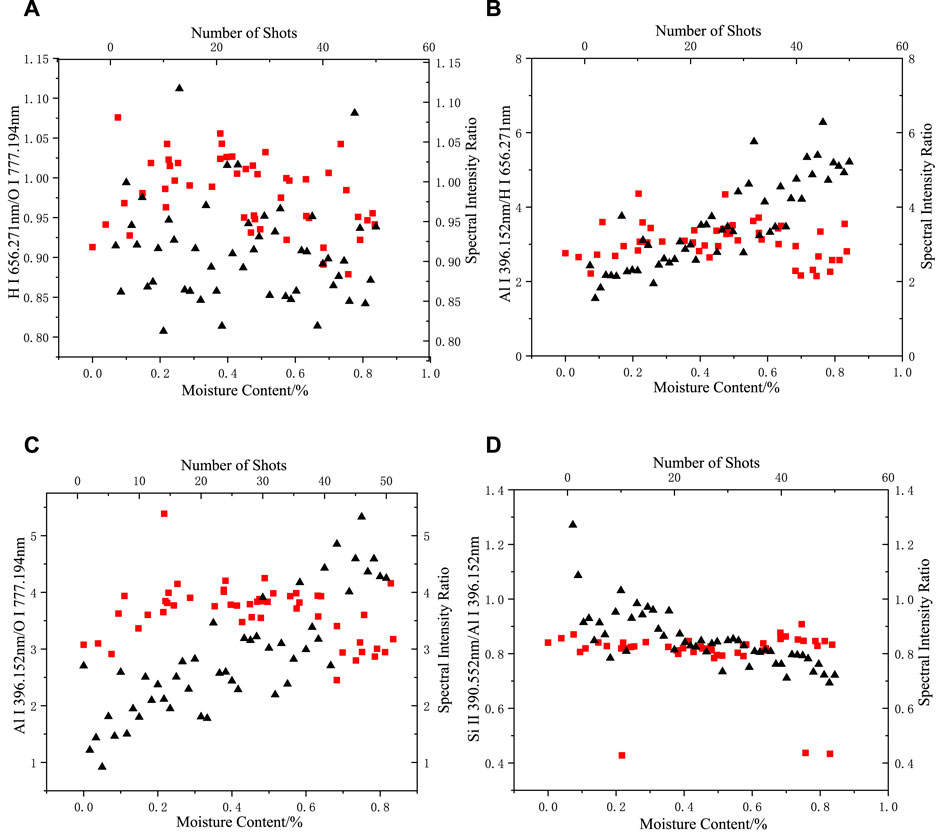
FIGURE 8. Changes in the spectral intensity ratio with moisture content and number of shots in an air environment: (A) H I 656.271 nm/O I 777.194 nm, (B) Al I 396.152 nm/O I 656.271 nm, (C) Al I 396.152 nm/O I 777.194 nm, (D) Si II 390.552 nm/Al I 396.152 nm (the square represents the change of spectral intensity ratio with moisture content, and the triangle represents the change of spectral intensity ratio with the number of shots).
As shown in Figure 8, the range of variation in the intensity ratios of the Al, Si, H, and O elemental spectra when the moisture content of the sample was varied in an air environment was not slightly different from that of the dry silicone rubber, indicating that the intensity of the H and O elemental spectral lines produced by direct ablation of the moisture absorbed by the silicone rubber was a small percentage of the spectral data or even not effectively collected compared with the H and O emission spectral lines produced by the silicone rubber and air ablation. At this point, the moisture indirectly changed the H and O elemental spectral line intensity by affecting the energy absorption process when the laser interacted with the substance.
Quantitative analysis model of the moisture content of silicone rubber
The results of the previous qualitative analysis indicated a correlation between the moisture content of silicone rubber and specific spectral intensity values, such as between the spectral intensities of the element Ar after normalization. Partial least squares regression (PLSR) was used for the multivariate analysis of the aqueous silicone rubber samples. For 50 silicone rubbers with different moisture contents, five points were randomly selected on the surface of each sample, the spectral data were averaged after 50 shots, and a total of 250 samples (spectra) were obtained, of which 200 were selected as the training set and 50 as the test set. The moisture content of the samples in the test set was different to ensure the comprehensiveness of the test set.
Thousands of data points in the LIBS spectra were obtained from each sample, and the feature selection algorithm SelectkBest was used to score the spectral feature data points with the moisture content in samples as the regression target. In the experiment, the optimal number of feature quantities were selected in descending order of score, and the feature quantities were input into the PLSR model for training, after which the feature quantities from the test set were input into the trained model. The evaluation indexes of the model were obtained, and these indexes revealed the prediction accuracy of the model.
Combining consideration of the goodness-of-fit
where
The optimal number of input features was determined by varying the number of features of the input into the quantitative model and comparing the prediction results from the PLSR model under different parameters, as shown in Table 1, with the number of features input into the model between 1 and 20. The values of the model fit, RMSE, and average relative deviation were relatively better than the other number of features when the number of input features was between 6 and 8.
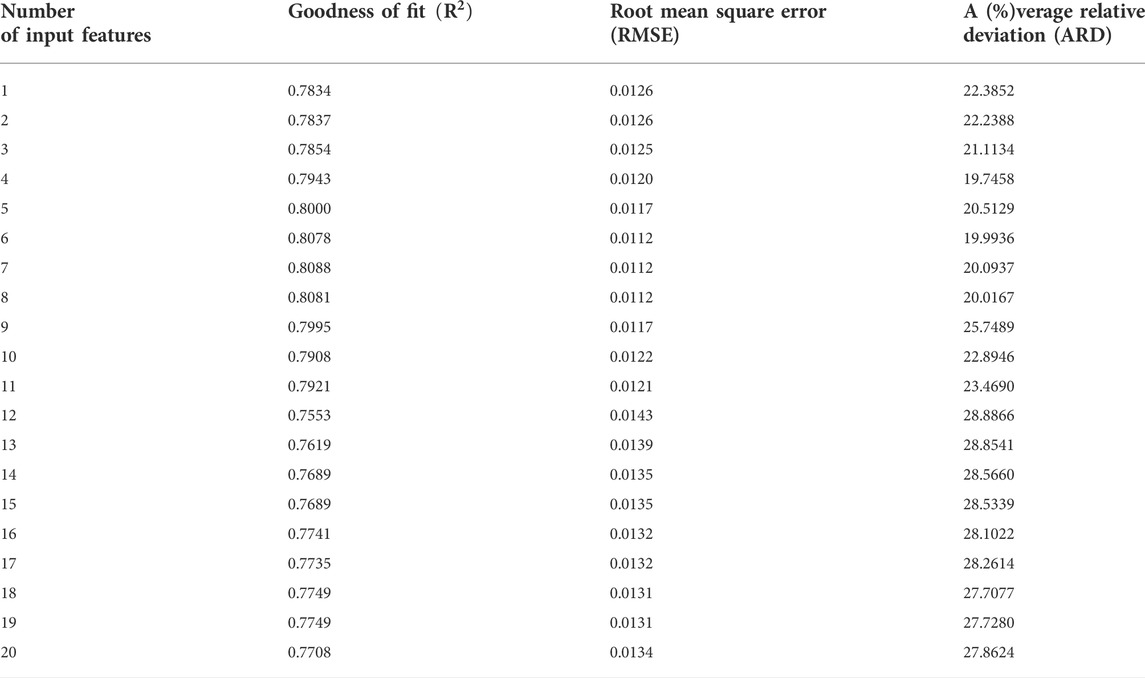
TABLE 1. Optimization of feature number for the PLSR model.
Figure 9 shows a comparison between the true and predicted values of the moisture content of the samples when the number of input features was 7. The predicted value of the sample without water was also 0. When the moisture content was 0.0613%, the predicted value given by the model was 0.379%, which was the largest deviation from the predicted value among the 50 samples, indicating some similarity between the spectra of samples with moisture content between 0.0613 and 0.4%. Accordingly, using the sample moisture content of 0.4% as the cut-off point, when the actual moisture content of the sample was greater than 0.4%, the gap between the predicted value trend of moisture content and the 1:1 ideal fit line was smaller and the data were better fitted.
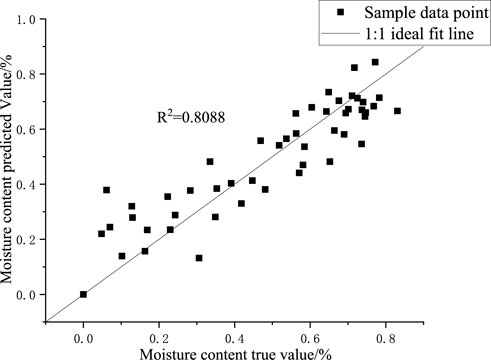
FIGURE 9. PLSR model prediction results.
For samples with low moisture content, the rate of mass change was relatively small and a certain error occurred in the weighing process, resulting in an unideal prediction of sample moisture content. However, when the moisture content increased, the effect of moisture on LIBS ablation samples increased and could more apparently distinguish the LIBS spectra of samples under different moisture contents.
Conclusion
In this study, a LIBS experimental platform was built, and the qualitative and quantitative analysis of silicone rubber samples with different moisture contents was conducted by blowing argon gas onto the sample surface to exclude the effect of air, combined with a partial least squares algorithm. With the gradual lightening of the laser, in the future it will be possible to use the unmanned aerial vehicle (UAV) and telescope to blow argon gas, shot and collect the plasma, thus completing remote in-situ detection of the moisture content of silicone rubber. The following were the conclusions drawn.
1) The H-element spectral intensity and spectral stability were significantly increased under the argon environment compared with the air environment. Comparing the LIBS spectra of silicone rubber at different argon flow rates, we observed that the relative spectral intensities did not differ significantly as argon flow rates increased.
2) As a part of the laser energy was absorbed by the moisture in the silicone rubber sample, which affects the plasma formation process, the results showed that with the increase in moisture content, where H-element spectral intensity increased, and Fe, Al, Si, and O-element spectral intensities decreased and then increased.
3) The range of variation in H/O and Al/H elemental spectral intensity ratios in silicone rubber samples with different moisture contents falls outside of that in dry silicone rubber, indicating that the H element is more likely to originate from moisture.
4) Full-spectra normalization offsets the effect of sample moisture content on the ablation process of LIBS, and normalized spectral intensity of H and Ar elements correlates well with the moisture content, with the moisture content of the sample calculated using partial least squares regression with a fit of 0.8088. A better model fit can be obtained for samples with larger moisture content.
Data availability statement
The raw data supporting the conclusions of this article will be made available by the authors, without undue reservation.
Author contributions
YD: conceptualization, project administration, resources, writing—original draft. BP: data curation. YH: formal analysis, funding acquisition. YD: investigation, methodology. SZ: software. CG: supervision. JZ: writing—review and editing.
Funding
This work was supported by the Science and Technology Program of SGCC “Reliability evaluation of composite materials and littoral pollution flashover applied in outdoor insulation” (5500-202155502A-0-5-ZN).
Conflict of interest
The authors declare that the research was conducted in the absence of any commercial or financial relationships that could be construed as a potential conflict of interest.
Publisher’s note
All claims expressed in this article are solely those of the authors and do not necessarily represent those of their affiliated organizations, or those of the publisher, the editors and the reviewers. Any product that may be evaluated in this article, or claim that may be made by its manufacturer, is not guaranteed or endorsed by the publisher.
References
Ali, M., and Hackam, R. (2008). Effects of saline water and temperature on surface properties of HTV silicone rubber. IEEE Trans. Dielectr. Electr. Insul. 15, 1368–1378. doi:10.1109/tdei.2008.4656246
Anzano, J., Lasheras, R. J., Bonilla, B., and Casas, J. (2008). Classification of polymers by determining of C-1 : C-2 : CN : H : N : O ratios by laser-induced plasma spectroscopy (LIPS). Polym. Test. 27, 705–710. doi:10.1016/j.polymertesting.2008.05.012
Anzano, J. M., Gornushkin, I. B., Smith, B. W., and Winefordner, J. D. (2000). Laser-induced plasma spectroscopy for plastic identification. Polym. Eng. Sci. 40, 2423–2429. doi:10.1002/pen.11374
Cheng, L., Wang, L., Zhang, Z., and Zhang, F. (2016). Mechanism of fracture related heating for 500‐kV composite insulators in highly humid areas. Int. Trans. Electr. Energy Syst. 26, 641–654. doi:10.1002/etep.2102
Dong, M., Wei, L., Zang, Y., and Lu, J. (2020). Quantitative analysis of hydrogen content in coal by LIBS based on dominant factors combined with deviation correction model. Proc. Chin. Soc. Electr. Eng. 40, 6617–6624.
Gao, Y., Wang, J., Yan, Z., Liang, X., and Liu, Y. (2015). Investigation on water diffusion property into HTV silicone rubber. Proc. Chin. Soc. Electr. Eng. 35, 231–239.
Gong, B., Tu, Y., Zhou, Y., Li, R., Zhang, F., Xu, Z., et al. (2013). “Moisture absorption characteristics of silicone rubber and its effect on dielectric properties,” in 2013 Annual Report Conference on Electrical Insulation and Dielectric Phenomena (Chenzhen, China: IEEE), 430–433. doi:10.1109/CEIDP.2013.6748283
Gruber, J., Heitz, J., Strasser, H., Bäuerle, D., and Ramaseder, N. (2001). Rapid in-situ analysis of liquid steel by laser-induced breakdown spectroscopy. Spectrochim. Acta Part B At. Spectrosc. 56, 685–693. doi:10.1016/s0584-8547(01)00182-3
Guirado, S., Fortes, F. J., and Laserna, J. J. (2012). Chemical analysis of archeological materials in submarine environments using laser-induced breakdown spectroscopy. On-site trials in the Mediterranean Sea. Spectrochim. Acta Part B At. Spectrosc. 74-75, 137–143. doi:10.1016/j.sab.2012.06.032
Guo, M., Zhang, R., Zhu, R., and Duan, H. (2021). Quantitative determination of water-soluble P in biochar based on NELIBS technology and EN-SVR model. Spectrosc. Spect. Anal. 41, 2301–2306.
Janssen, H., Seifert, J. M., and Karner, H. C. (1999). Interfacial phenomena in composite high voltage insulation. IEEE Trans. Dielectr. Electr. Insul. 6, 651–659. doi:10.1109/94.798121
Li, C., Qu, L., Gao, F., Duan, H., Guan, M., Liu, H., et al. (2020). Composition analysis of the surface and depth distribution of metal and ceramic cultural relics by laser-induced breakdown spectroscopy. Chin. Opt. 13, 1239–1248. doi:10.37188/co.2020-0112
Li, W., Chen, G., Zeng, Q., Yuan, M., He, W., Jiang, Z., et al. (2021). Rapid classification of steel by a mobile laser-induced breakdown spectroscopy based on optical fiber delivering laser energy. Spectrosc. Spect. Anal. 41, 2638–2643.
Li, Y., Wang, Z., Wu, J., Lu, Y., and Zheng, R. (2012). Effects of laser wavelength on detection of metal elements in water solution by laser induced breakdown spectroscopy. Spectrosc. Spect. Anal. 32, 582–585.
Tao, H., Jiang, H., Yu, Q., Yu, S., and Zeng, Z. (2020). “Water absorption, low-molecular dissolution and moisture-induced electrical properties of liquid silicone rubber,” in The 16th IET International Conference on AC and DC Power Transmission (ACDC 2020) (IET), 1103–1108. doi:10.1049/icp.2020.0288
Wang, N., Wang, X., Chen, P., Jia, Z., Wang, L., Huang, R., et al. (2018). Metal contamination distribution detection in high-voltage transmission line insulators by laser-induced breakdown spectroscopy (LIBS). Sensors 18, 2623. doi:10.3390/s18082623
Wang, Z., Jia, Z., Fang, M., Li, Y., and Guan, Z. (2016b). Moisture absorption desorption, and moisture-induced electrical performances of high-temperature vulcanized silicone rubber. IEEE Trans. Dielectr. Electr. Insul. 23, 410–417. doi:10.1109/tdei.2015.005452
Wang, Z., Jia, Z., Jiao, J., and Guan, Z. (2016a). Influence of water NaCl solution, and HNO3 solution on high-temperature vulcanized silicone rubber. IEEE Trans. Dielectr. Electr. Insul. 23, 1164–1173. doi:10.1109/tdei.2015.005633
Xing, S., and Wang, Y. (2000). Organic silicon synthesis technology and product application. Beijing: Chemical Industry Press.
Yu, J., Li, N., Qiu, X., Li, C., and Chen, H. (2021). Experimental study on laser cleaning of bronze cultural relics with evaluation of laser-induced breakdown spectroscopy. Appl. Sci. 41, 71–76.
Keywords: moisture content, laser-induced breakdown spectroscopy, silicone rubber, partial least squares regression, quantitative analysis
Citation: Deng Y, Peng B, Hao Y, Du Y, Zhou S, Gu C and Zhou J (2022) Laser-induced breakdown spectroscopy of aqueous silicone rubber in an argon environment. Front. Mater. 9:1016209. doi: 10.3389/fmats.2022.1016209
Received: 10 August 2022; Accepted: 06 September 2022;
Published: 23 September 2022.
Edited by:
Jiefeng Liu, Guangxi University, ChinaReviewed by:
Junhao Li, Xi’an Jiaotong University, ChinaGuo-ming Ma, North China Electric Power University, China
Copyright © 2022 Deng, Peng, Hao, Du, Zhou, Gu and Zhou. This is an open-access article distributed under the terms of the Creative Commons Attribution License (CC BY). The use, distribution or reproduction in other forums is permitted, provided the original author(s) and the copyright owner(s) are credited and that the original publication in this journal is cited, in accordance with accepted academic practice. No use, distribution or reproduction is permitted which does not comply with these terms.
*Correspondence: Yu Deng, dengyu8931@163.com