 Jiacheng Zhang
 Andrew Heath
 Richard J. Ball
 Kevin Paine
- Department of Architecture and Civil Engineering, University of Bath, Bath, United Kingdom
Carbon fibre incorporated smart cement-based composite has great potential for the multifunctional health monitoring of concrete structures. This paper presents the microstructural, electrical, and mechanical properties of smart cement-based composites incorporating chopped carbon fibres from low dosages at 0–0.1% by volume (vol%) with detailed intervals, to high dosages up to 2.4 vol%. In comparison to a plain mortar, smart cement-based composites at all fibre contents had higher flexural strength. A 95% improvement in flexural strength was obtained at a fibre content of 0.3 vol%, whereas compressive strength increased up to a fibre content of 1.0 vol%, with the highest improvement, 105%, at 0.2 vol%. The bulk conductivity of smart cement-based composites underwent a double percolation process where the percolation zone of the fibres was identified at fibre contents of 0–0.1 vol% and the percolation zone of the capillary pores resided at fibre contents of 2.1–2.4 vol% indicating an extremely low durability. This study presents the laboratory characterization on smart cement-based composites where the fundamentals of the transitional behaviours of the mechanical properties and the percolation in electrical property through fibre loading were studied, which is a necessary step prior to the assessment of the self-sensing performance. The impact of this study will enable the physical properties of carbon fibre incorporated smart cement-based composites to be optimized through the design and manufacturing process. This will lead to robust performance and superior in-situ multi-functional health monitoring of concrete structures.
1 Introduction
The deterioration of concrete structures inevitably occurs because concrete is naturally porous, brittle, and quasi-homogenous. Since the beginning of its service life, a composite such as concrete can be subject to environmental influences including thermal stresses, chemical attack, corrosion, and other actions (Mindess et al., 2003). Therefore, concrete structures should be properly and timely evaluated to assess their deterioration so that remedial action can be taken if required. Visual inspection has long been a common way to achieve this but with the development of the semi-conductor industry the use of structural health monitoring (SHM) techniques has allowed a step change forward towards automation. Traditional SHM is achieved by externally employing measures such as strain gauges, strain sensors, optical fibres, piezoceramic sensors, and so on for the monitoring of strain/stress, cracking, temperature, and corrosion of concrete structures (Fuhr and Huston, 1998; Benmokrane et al., 2007; Gaumet et al., 2021; Ramachandran et al., 2022; Taha et al., 2022). However, these measures are expensive, delicate, not necessarily compatible with concrete structures, and complicated to operate. While in use, extra maintenances need to be performed to ensure their longevity, which are again labour-intensive, expensive and have potential for increased environmental impact. To address this issue, smart cement-based composites (or conductive cement-based materials) have attracted the attention of many researchers and practitioners. Smart cement-based composites are easy-shaped and can present excellent mechanical robustness, high electrical conductivity, sound piezoresistivity, low drying shrinkage, and natural compatibility with the surrounding concrete structure, which allow for a variety of self-sensing (or self-monitoring) purposes for the health monitoring of concrete structures (e.g., strain/stress, damage, crack, temperature, and healing) (Chen and Chung, 1993a, 1996; Sun et al., 1998; Chung, 2000; Peled et al., 2001; Wen and Chung, 2006; Han and Ou, 2007; Azhari and Banthia, 2012; Yildirim et al., 2015; Dong et al., 2019). Smart cement-based composites form an integral part of the structure and do not normally require extra maintenance like the embedded or externally applied sensors.
A smart cement-based composite is made by dispersing highly conductive fillers (e.g., carbon fibres, carbon nanotubes, conductive aggregates) into the less conductive cementitious matrix hence an electrically conductive network is formed for multifunctional self-sensing works (Chen and Chung, 1993a; Han et al., 2010, 2015; Al-Dahawi et al., 2016; Lu et al., 2022a; 2022c; 2022b). With the addition of conductive fillers from lower to higher dosages, transitional processes can take place in such a heterogenous composite, where different electrical and mechanical properties were exhibited, in turn affecting the in-situ self-sensing performance.
This transitional process, in electrical conductivity, can be described by the percolation law. Xie et al. (1996) proposed three types of system through percolation according to the geometric presence of carbon fibres (as the electrically conductive filler) in a mortar matrix and suggested that each system reacted differently to the microstructural changes of cement matrix. In the percolation process, the most important parameter, percolation threshold, refers to the content where a continuously connected pathway has just been formed by the conductive fillers contacting each other within the less conductive matrix (Zallen, 1998). There exists a percolation zone at the vicinity of this threshold where the sharp change in electrical properties was consistent due to the pronounced tunnelling effect between adjacent filler tips (non-ohmic conduction) and the contact conduction between touched fibres (ohmic conduction) (Sun et al., 1998; Han et al., 2010; Nan et al., 2010). Chen et al. (2004) determined that the percolation zone was located at fibre contents of 0.4–0.8 vol%, where a continuous sharp increase in electrical conductivity of the carbon fibre (aspect ratio = 667: 1) reinforced cement mortar occurred. Later, Wen and Chung (2007) reported a double percolation phenomenon of electrical conductivity in carbon fibre (aspect ratio = 333: 1) reinforced mortar that under different sand/cement ratios the fibres percolated at a zone of 0.3–0.8% by volume of the paste and the cement paste percolated at 70%–76% by volume of the mortar. Baeza et al. (2013) suggested that under the same material and scale, a lower filler content is required to reach the percolation threshold for fillers with higher aspect ratio.
This transitional process can also take place in mechanical properties. Toutanji et al. (1994) found that incorporating 1, 2, and 3 vol% of carbon fibres in cement paste all resulted in the enhancement of tensile and flexural strengths. Similar outcomes regarding the development of the flexural strength with the increasing fibre content were also reported in a recent research by Donnini et al. (2018). However, the effect on compressive strength is less clear with either no obvious effect (Wang and Aslani, 2021) or a decrease in compressive strength with increasing fibre content (Park and Lee, 1993; Donnini et al., 2018). While testing with nano-scale fillers, Ding et al. (2022) reported that incorporating carbon nanotubes (CNTs) 5% by mass of cement had the highest compressive strength, which reduced with further increase of the dosage. Al-Dahawi (Al-Dahawi et al., 2016) discovered that cement mortar incorporating CNTs exhibited the highest compressive strength in comparison to plain mortar and other mortars incorporated with macro-scale fillers. Although having superior self-sensing performance than normal gauges (Zhang et al., 2020), nano-scale fillers can be carcinogenic due to their special geometry and small scale, which can have substantial health and safety implications during manufacturing processes (Jones et al., 2019). As the authors considered it unacceptable to include fillers with potentially high risks to health, macro-scale fillers were favoured for their practicality to be used in smart cement-based composites, as also noted by other researchers (Banthia et al., 1992; Chung, 2000; Han et al., 2007; Roopa and Hunashyal, 2021; Zhang et al., 2022).
Therefore, the transitional behaviours of electrical and mechanical properties through filler loadings, were primarily dependent on the physical properties of the fillers (e.g., scale, aspect ratio, material, etc). Variations in the transitional processes can be influenced by the basic condition of the cement matrix (e.g., water/cement ratio, sand/cement ratio, chemical additives, degree of compaction, etc), as well as the associated microstructural changes from the filler inclusion (Chung, 2000). Determination and understanding the mechanisms of these transitional processes can be critical because the self-sensing behaviour is an integrated response from the electrical and mechanical properties. While in SHM, it was suggested by researchers that the piezoresistivity is the most remarkable within the percolation zone where the proportion of the tunnelling effect was the highest among all conduction mechanisms because the tunnelling effect can take place as long as the adjacent fillers are within the tunnelling range hence easily influenced by the deformation of the cement matrix (Chung, 2000; Xu et al., 2011; Wang and Aslani, 2021). For filler loadings above the percolation zone, although the electrical conductivity is higher, the sensing effectiveness is reduced (Chung, 2021). Also, the self-sensing functionality of smart cement-based composite is associated with the mechanical interactions between the filler and cement matrix, as well as the reversible/irreversible changes in the geometry. Reversible strain leads to reversible piezoresistive response and irreversible damage leads to irreversible piezoresistivity (Wen and Chung, 2006; Chung, 2021). It was suggested that the peak stress for self-sensing of cyclic compression should be less than 30% of the ultimate compressive strength in order to ensure the reversible piezoresistive response (Galao et al., 2014; Xu et al., 2021).
Despite numerous research on the self-sensing performance of smart cement-based composites, the has been a lack of thorough laboratory characterizations. The interval of filler content was not always detailed enough, and the range of the fibre content was not always wide enough to fully reveal the transitional behaviours. The underlying mechanisms of the influence of manufacturing process and mix design on the transitional processes of electrical and mechanical properties with filler contents were rarely investigated. In this paper, macro-scale chopped carbon fibres, which is the most comprehensively studied filler for self-sensing performance, was used. As a cheap and common product which has been widely used in the industries such as aerospace and automobile, carbon fibres are high in mechanical strength and electrical conductivity, flexible, less prone to thermal expansion, and most importantly, chemically stable in the highly alkaline cement matrix in comparison to metal fibres (e.g., steel fibres) which are susceptible to corrosion (Chen and Chung, 1993a; Han et al., 2007, 2015; Park, 2018; Dong et al., 2019). Carbon fibres with volume percentages 0–2.4 vol% was employed to make sure a full range of behaviour was revealed from extremely low, 0.001 vol%, to what can be considered a very high fibre content, 2.4 vol%, with detailed intervals. The transitional processes of electrical and mechanical properties are discussed based on classical percolation theory, Griffith’s theory, and the findings of microstructural investigations.
This research elucidates the transitional behaviours of microstructural, electrical, and mechanical properties of carbon fibre incorporated smart cement-based composite over a wide range of fibre dosages. The results and underlying mechanisms revealed through the laboratory characterization in this study provides understanding on the optimization of physical properties through the improvement of manufacturing process and mixing design hence facilitates the multifunctional use of cement-based sensors under realistic sensing scenarios.
2 Experimental programme
2.1 Materials and proportioning design
The materials used in this study were CEM Ⅰ 42.5R conforming to BS EN 197-1, standard sand with maximum size <2 mm conforming to BS EN 196-1, and tap water. For each specimen, the mortar matrix was made with a fixed composition with the water/cement ratio of 0.45 and the sand/cement ratio of 3.0. Cement-based sensors were fabricated by admixing PAN-based chopped carbon fibres (SGL Carbon Fibers Ltd., Wiesbaden, Germany) with different volume percentages from 0 to 2.4 vol% into the mortar matrix (Table 1). Polycarboxylate superplasticizer (PERAMIN® COMPAC, Upplands Vasby, Sweden) with 0.4% by mass of cement was used on every mix for improving the fibre dispersion and consistence of the mixture. Tributyl phosphate (Sigma-Aldrich, Dorset, United Kingdom) was used as defoamer to reduce air bubbles while mixing and the dosage was 3 ml which was tested to be the lowest dosage to effectively reduce air bubbles. Throughout the study, specimens are named as plain mortar and “CF + fibre content”. For example, smart cement-based composite containing 0.2 vol% of carbon fibre was named as “CF0.2 vol%”.
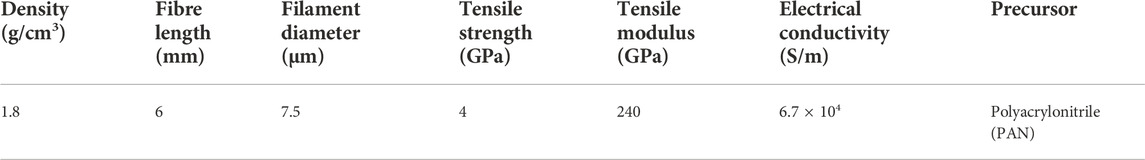
TABLE 1. Nominal properties of the chopped carbon fibres from supplier.
2.2 Manufacturing
The manufacturing of smart cement-based composite can be classified into three types based on the chronological sequence of the fibres and cement being admixed (Han et al., 2015): the first mixing method, the synchronous mixing method, and the latter mixing method. In this study, the mixing sequence was a combination of the first mixing method and the standard method conforming to BS EN 196-1 with the extended time of blending for improved matrix homogenization. The fibres were initially dispersed into the polycarboxylate solution before blending with the cement powder and the standard sand. The physical properties of smart cement-based composite can be influenced by the manufacturing process, therefore the manufacturing process is introduced in detail:
Step 1: The full portion of the polycarboxylate superplasticizer (powder form) and the defoamer (liquid form) were dissolved into the whole mixing water (tap water, 21°C). The solution was hand stirred for at least 10 min until no powder or bubbles were visible.
Step 2: The full portion of the carbon fibres was added into the solution. The mixture in a beaker was then placed in an ultrasonicator (Shesto Ltd., Watford, United Kingdom) for 30 min, during which hand stirring continued.
Step 3: The mixture was blended with the whole portion of cement in an electronic mixer (CONTROLS Ltd., Hertfordshire, United Kingdom) for 5 min at low speed conforming to BS EN 196-1.
Step 4: The whole portion of sand was added and the whole mix was mixed for another 3 min at high speed conforming to BS EN 196-1.
Step 5: The electronic mixer was stopped for 90 s, during which the parts of the mix adhering to the wall and the bottom of the bowl was scraped and the mix was manually blended with a metallic scraper.
Step 6: The electronic mixer was restarted, and the mixing continued for an extended mixing time of 5 min at high speed.
Step 7: A stainless-steel mould conforming to BS EN 196-1 was used to cast the fresh mix, which can produce three 40 × 40 × 160 prismatic specimens for each batch. The fresh mix was compacted by vibrating for 2 min. Then, a pair of electrodes (stainless-steel, rod-shape) with 3 mm of diameter and 50 mm of length, were inserted into the mix along the centre line with a distance of 40 mm between them and a depth of 30 mm into the mix (Figure 1A).
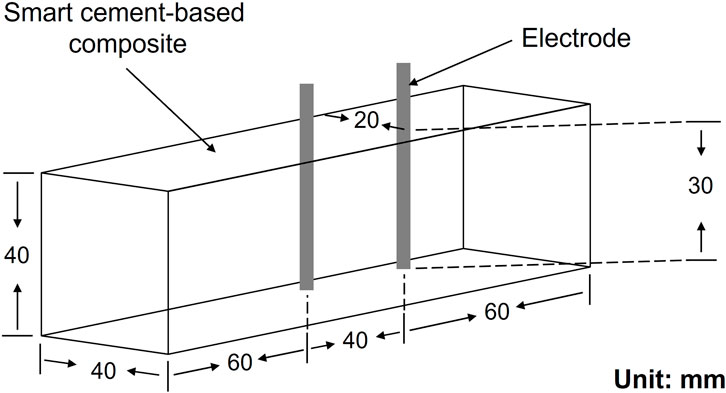
FIGURE 1. Dimension of smart cement-based composite and electrode arrangement.
Step 8: The mould was wrapped with kitchen film for the mitigation of moisture exchange and carbonation and kept at laboratory temperature (20 ± 2°C).
Specimens were demoulded 24 h after casting, and then cured under water in a water tank at 21°C for 97 days until testing to ensure any variation in electrical properties with time were minimised (Taylor, 1987).
In this study, in addition to mixing carbon fibres at various volume percentages into the mortar matrix for the fabrication of smart cement-based composites, carbon fibres were also mixed into a diluted calcium hydroxide (CH) solution (i.e., CH dissolved in distilled water with a mass concentration of 4 × 10⁻³ wt%). This enabled the percolation zone of smart cement-based composites to be determined by comparing the different percolation behaviours between: 1) a simple two-phase mixture of “electrolyte–fibre” (i.e., diluted CH solution) where the classic percolation law applies, and 2) a triple-phase mixture of “cement–pore fluid–fibre” (i.e., smart cement-based composite) where the percolation behaviour was affected by the complex microstructure of cement matrix.
2.3 Methods
2.3.1 Electrical measurement
2.3.1.1 Electrochemical impedance spectroscopy (EIS)
In this study, the Nyquist plot has been used as the formalism to pick up the electrical properties of smart cement-based composites, The complex impedance
where the
Under two-point EIS, it has been well-documented that the Nyquist plot of a mortar matrix containing carbon fibres consists of three responses: the bulk arc, the mid arc, and the electrode “spur” (Torrents et al., 2001; Suryanto et al., 2016; Díaz et al., 2021), whereas the Nyquist plot of the plain mortar only contains two responses: the bulk arc and the electrode “spur” (McCarter and Brousseau, 1990; Christensen et al., 1994) (Figure 2).
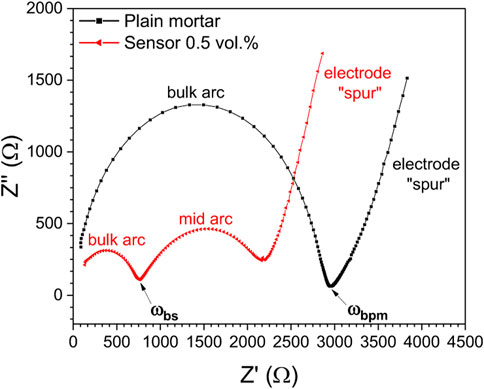
FIGURE 2. Nyquist plot of smart cement-based composite (CF0.5 vol% as an example) and plain mortar both at the age of 97 days and water-saturated condition, ωbs refers to the angular frequency for the bulk resistance of the smart cement-based composite, ωbpm refers to the angular frequency for the bulk resistance of the plain mortar.
The electrode “spur” is produced by the charge transfer resistance and double layer capacitance at the electrode-pore fluid interface. The mid arc is produced by a strong surface effect of double layer capacitance and surface resistance at the fibre-pore fluid interface (Schwarz, 1962; Schurr, 1964; Mason et al., 2002; Suryanto et al., 2016; Zhang et al., 2022). Most importantly, the bulk arc is the bulk response produced by the bulk conduction mechanism and the interfacial polarization (Christensen et al., 1994; McCarter et al., 2009). The bulk conductivity σ, as the parameter of interest in this study, situates at the transitional location where the double layer effect is diminished and the bulk response dominates (Zhang et al., 2022). For the plain mortar, it is the intersection of the electrode “spur” and the bulk arc, while for the smart cement-based composite, it is the intersection of the mid arc and the bulk arc (Figure 2). The bulk conductivity σ was calculated through
where
2.3.1.2 Instrumentation and data acquisition
The impedance responses were measured under two-point EIS with the PSM 3750 frequency response analyser (Newtons4th Ltd., Leicester, United Kingdom). Measurement voltage was configured to an RMS of 707.107 mV. The sweeping mode was logarithmic at frequencies 1 Hz–10 MHz with 10 points per log cycle. All specimens were water-saturated to ensure the ionic conduction through the continuously connected pores were fully revealed (Song, 2000). Before each measurement, the specimens was slightly wiped on the surface with paper towel so the influence of the surface current via random surface moisture on the measurement on the volumetric impedance was minimized. The impedance measurement was conducted within 2 min after the specimen being taken out of the water tank to prevent the specimen from drying internally. The measurement environment was 20 ± 2°C and 50% RH.
2.3.2 Testing of mechanical properties
After the measurement of impedance, specimens were stored in the laboratory condition (20 ± 2°C and 50% RH) for 1 day before the mechanical tests. The flexural strength was tested on the specimen pre-notched at the mid span by three-point bending in a hydraulic frame (Instron, Buckinghamshire, United Kingdom), over a span of 100 mm, which was in accordance with BS EN 196-1. After the specimen was ruptured, both halves were tested for compressive strength by uniaxial compression (40 × 40 mm contact area) in a compression machine (CONTROLS Ltd., Hertfordshire, United Kingdom). The testing processes and configurations were all aligned with BS EN 196-1. Calculations of the arithmetic mean and standard deviation also conformed to BS EN 196-1.
2.3.3 Microstructural investigation
After the mechanical tests, backscattered electron (BSE) imaging and digital microscopy were performed to study the condition of the fibres at the fracture surface using a HITACHI SU-3900 SEM machine (HITACHI, Tokyo, Japan) and a VHX6000 digital microscope (Keyence Ltd., Hounslow, United Kingdom), respectively. The digital microscopy was operated in the laboratory condition (20 ± 2°C and 50% RH), where the lightings and magnifications were manually adjusted in order to obtain an optimal picture of the fibres and mortar matrix. For the BSE imaging, the acceleration voltage was configured to 20 kV as suggested in the literature (Huang et al., 2013; Scrivener et al., 2016).
To study the microstructural changes resulting from the fibre incorporation, mercury intrusion porosimetry (MIP) was used. Smart cement-based composites from the same batch, but which had not undergone mechanical testing were used, as this can induce microcracking leading to changes in measured pore size distribution. Before MIP, fragments were taken from the centre location of the specimen and were dried in the oven at 60°C until mass equilibrium. Low- and high-pressure intrusion were conducted using Pascal 140 and Pascal 440 machines respectively (Thermo Fisher Scientific Inc., Milan, Italy). The intrusion pressure was 0–400 MPa and the Hg contact angle was 140° for all specimens.
3 Results and discussions
3.1 Microstructural properties
3.1.1 Digital microscopy and backscattered electron (BSE) imaging
Digital microscopy and BSE imaging were conducted on the fracture surfaces of smart cement-based composites for the investigation of the fibres’ geometric presence and the condition of mortar matrix. The presence of the fibres can be differentiated with bare eyes for the cement-based composite with the highest fibre incorporation 2.4 vol% (Figure 3A), therefore the digital microscope with a relatively low magnification was used. Whilst the fibres on the fracture surface of the composite with a lower fibre content, 0.2 vol%, cannot be visually confirmed (Figure 3B), hence the BSE imaging was used for its higher magnification and the ability to differentiate thin fibre filaments from mortar matrix by backscattered electrons.
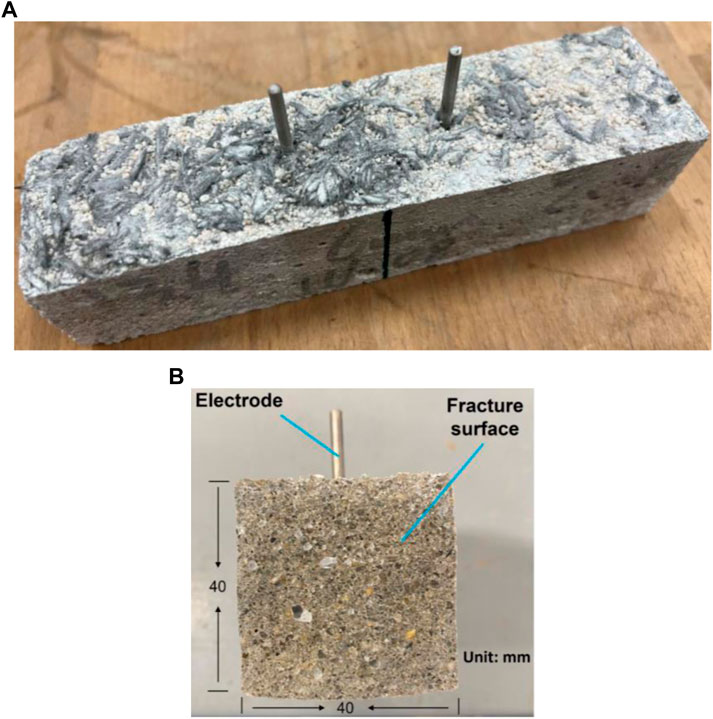
FIGURE 3. Physical appearances of smart cement-based composites (A) appearance of the composite with the highest fibre content 2.4 vol% showing segregation and clumping of fibres which can be visually confirmed (B) fracture surface of composite with a relatively low fibre content 0.2 vol% showing no fibres were visible to the naked eye.
Figure 4 shows presence of the fibres and the condition of mortar matrix on the fracture surface of CF2.4 vol% with two representative locations, locations A and B, presented. In Figure 4A, at location A, the clumped fibre bunches were bonded by hardened cement and showed segregation. The sands were poorly bonded showing segregation as well, the air voids were visually noticeable, and the mortar matrix showed poor homogeneity. This indicates that at the highest fibre content 2.4 vol%, even with an extended mixing process in Steps 3–6, there is no guarantee that the fibres will be uniformly distributed and the mortar matrix will be homogenous. This phenomenon was common across the fracture surface. In Figure 4B, at location B, it is evident that still the mortar matrix showed a poor homogeneity. Surprisingly, the fibres were uniformly dispersed at this location but this was a scarce occurrence on the fracture surface.
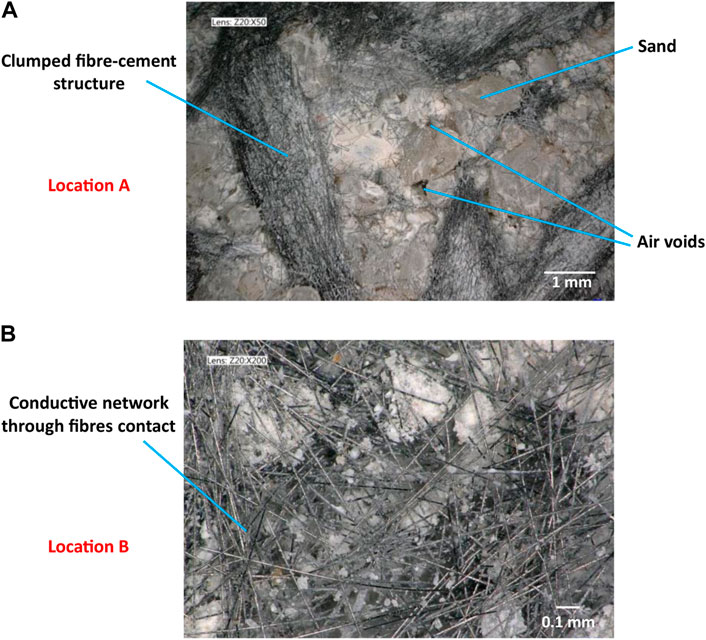
FIGURE 4. Digital microscope investigation on the fracture surface of CF2.4 vol% (A) location A where the fibres were clumped, the sands were poorly bonded, and the mortar matrix showed poor homogeneity (B) location B where the fibres were uniformly dispersed but still the mortar matrix showed poor homogeneity.
In Figure 5, the BSE images of the fracture surface of smart cement-based composite with low fibre content of 0.2 vol% is presented. As normally observed with backscattered SEM images, materials with higher atomic numbers appear to be brighter (Scrivener et al., 2016). Therefore, the carbon fibres exhibited darker colour than the mortar matrix (grey and white). The fibres were uniformly distributed throughout the plane but with fewer fibre-fibre contacts (Figure 5A) in comparison to CF2.4 vol% (Figure 4). Most importantly, CF0.2 vol% exhibited a more homogenized and compact matrix than what was observed on CF2.4 vol% (Figure 4). Trace of fibre pullout was also spotted at the fracture surface (Figure 5B) and the tips showed no sign of breakage after the fracture (Figure 5C). Also, in CF2.4 vol%, no fibre breakages were observed throughout the fracture surface (Figure 4B). This evidence indicates that the failure mode of the fibres in the composites was fibres pullout rather than fibres breakage even in a more compact matrix of CF0.2 vol% because of the high mechanical strength of the PAN-based carbon fibres used in this study (Table 1). While using pitch-based carbon fibres with lower mechanical strength, both fibres pullout and breakage were reported (Akihama et al., 1986; Safiuddin et al., 2018).
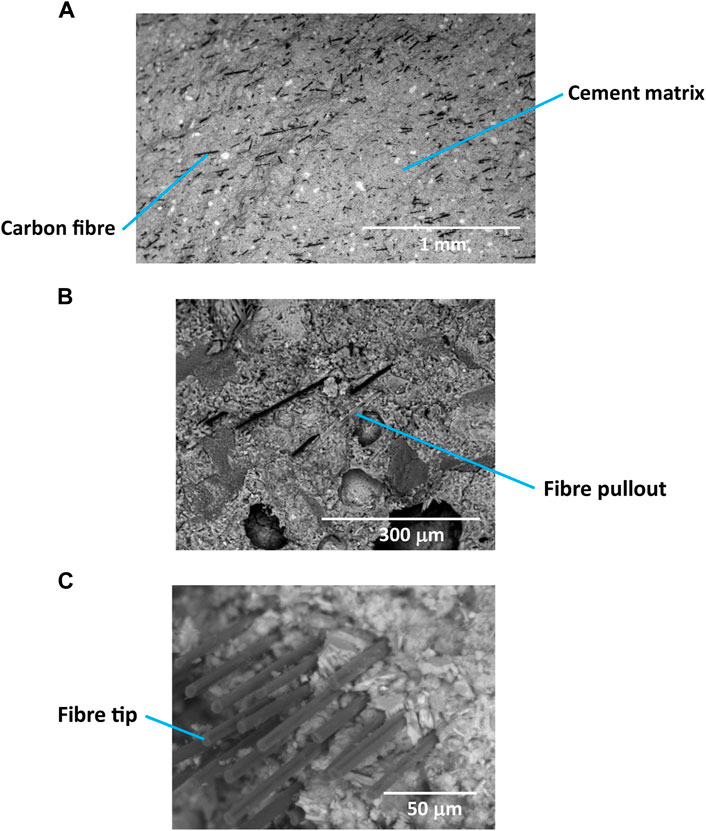
FIGURE 5. BSE images of the fibres at the fracture surface of CF0.2 vol% (A) uniform dispersion of the fibres (B) trace of fibre pullout (C) exposed fibre tips after fracture.
The possible reasons behind the large difference of observed mortar matrixes between smart cement-based composite with high (Figure 4A) and low fibre contents (Figure 5A) are discussed below. The surface of a carbon fibre is naturally hydrophobic (Park, 2018) and since water is one of the constituents, it could have been expected that hydrophilicity of the carbon fibres could aid the degree of fibre dispersion in mortar matrix. For this purpose, the polycarboxylate superplasticizer was used. In comparison to other dispersants such as cellulose which can only make the surface of carbon fibres hydrophilic, and sodium-based superplasticizer which can only make the surface of cement grain hydrophilic, polycarboxylate superplasticizer has superior dispersion ability thanks to its “double dispersion” feature for improving the wettability of both the surfaces of carbon fibres and cement grain (Han et al., 2012; Metaxa, 2015; Chuang et al., 2018; Papanikolaou et al., 2021). The anchorage group on the superplasticizer can adsorb on the surfaces via intermolecular forces. Whilst the side chains, as the hydrophilic part, would form a layer outside of the surfaces to attract water molecules via steric stabilization, and to create repulsion force via steric hindrance hence facilitating the dispersion of carbon fibres and cement grain (Figure 6).
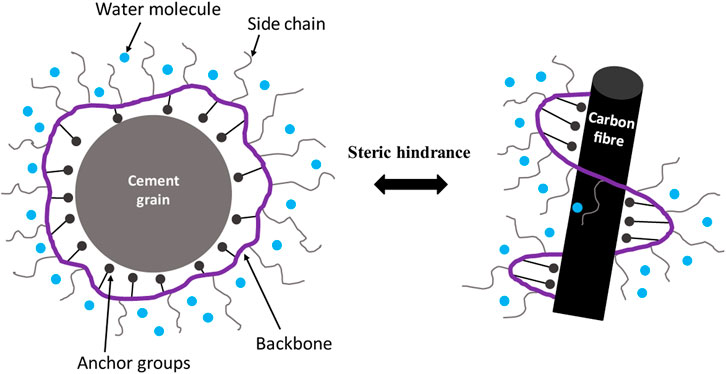
FIGURE 6. The “double dispersion” mechanism by polycarboxylate superplasticizer in the matrix of smart cement-based composite.
Therefore, the surface of the carbon fibre can be hydrophilic after treatment of the polycarboxylate superplasticizer. In Figure 4A, considering the high surface area provided by the 2.4 vol% fibre content, most of the water molecules from the mixing water could have stabilized onto the fibre surface via the polycarboxylate groups after Steps 1 and 2, causing little effective water remaining. In turn, in Step 3 of mixing, the cement powder may have reacted with the adsorbed water on the surface of the carbon fibres. The effective water/cement ratio can therefore be very low resulting in a poorly homogenised mortar matrix hence a poor bonding of the sand. In comparison, it can be seen in Figure 5 that CF0.2 vol% had a more homogenised mortar matrix indicating the sufficient effective water for the reaction with the remaining cement powder. It can therefore be proposed that under a fixed mixing proportion of water, cement, sand, and polycarboxylate superplasticizer, the fibre content is positively proportional to the amount of adsorbed water, and most importantly, inversely proportional to the remaining effective water. This phenomenon was also reported in other scientific researches, where the workability of the fresh mix was also found to reduce with the increasing fibre content (Ouda, 2015; Wang et al., 2021; Wang and Aslani, 2022). The effective water in such a phenomenon was also referred to as the “free water” or “net water” by concrete practitioners while mixing concrete on a site (Neville, 2011). It can be postulated that this indirect change of “effective water/cement ratio” would alter not only the appearances of the specimen just like what have been observed, but also the physico-chemical properties, which will be investigated in detail in the following context.
3.1.2 MIP
The development of capillary porosity (ϕ) with the increasing fibre content (f) was examined by MIP as plotted in Figure 7A. The porosity had a positive correlation with the fibre content, as stated in other studies (Chung, 2000; Wang et al., 2008; Díaz et al., 2020).
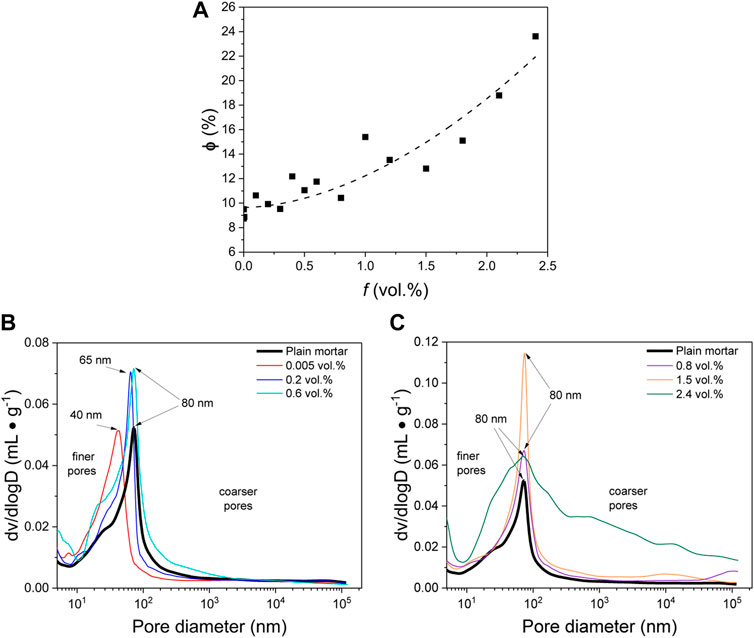
FIGURE 7. MIP results of the specimens at the curing age of 97 days (A) Development of capillary porosity ϕ with the increasing fibre loading f (B) differential pore size distribution at lower fibre contents, CF0.005 vol%, CF0.2 vol%, and CF0.6 vol% as examples (C) differential pore size distribution at higher fibre contents, CF0.8 vol%, CF1.5 vol%, and CF2.4 vol% as examples.
To determine how the fibre content affects the connected porosity, the differential pore size distribution was plotted at relatively low fibre contents 0 < f ≤ 0.6 vol% (Figure 7B) (Plain mortar, CF0.005 vol%, CF0.2 vol%, and CF0.6 vol% as examples) and relatively high fibre contents 0.6 < f ≤ 2.4 (Figure 7C) (CF0.8 vol%, CF1.5 vol%, and CF2.4 vol% as examples). As marked on the plot, while increasing the fibre content from 0.005 vol% to 0.6 vol%, the critical pore diameter increased from approximately 40–80 nm reaching the same value as the plain mortar (Figure 7B). This value then remained constant at approximately 80 nm despite increasing the fibre content from 0.6 vol% to 2.4 vol% (Figure 7C). For the ease of identification, pore sizes <80 nm were defined as finer pores and those >80 nm were defined as coarser pores.
At low fibre contents, 0.005 vol% and 0.2 vol%, smart cement-based composites had higher volume of the finer pores, lower critical diameter, and lower volume of the coarser pores than the plain mortar (Figure 7B). This indicates that the quality of fibre dispersion was high according to what were suggested in the literature that more air voids formed due to more fibres clumping (Wang et al., 2008; Díaz et al., 2020), which also reasonably connects to the BSE results in Figure 5A that the fibres were uniformly dispersed in CF0.2 vol%. It can also be postulated that the relative contents of the polycarboxylate superplasticizer and the mixing water were sufficient in comparison to the fibre loading here, which aided the dispersion of the fibres and the workability of the mix. The higher volume of the finer pores in the CF0.005 vol% and CF0.2 vol% was caused by the small air bubbles while mixing, as well as the gaps between the fibre and the mortar matrix due to the plasticity and shrinkage of cement, which naturally occurred as inevitable flaws (Chung, 1995, 2005; Chen and Chung, 1996; Wen and Chung, 2006). It was also found that all smart cement-based composites had higher volume of the finer pores than the plain mortar, which can also be ascribed to the increasing amount of the natural flaws (Figures 7B, C). Furthermore, increasing the fibre content to 2.4 vol% led to both the finer and coarser pores continuously increasing by volume (Figures 7B, C) and achieving the highest porosity of 23.6% at 2.4 vol% (Figure 7A).
In particular, the fibre content 0.6 vol% was a boundary content below which the volume of the coarser pores and the critical diameter were both lower than that of the plain mortar (Figure 7B). At and above this boundary content, the volume of the coarser pores was higher than that of the plain mortar but the critical diameter remained at 80 nm which was equivalent to that of the plain mortar (Figure 7C). The amount of polycarboxylate superplasticizer was sufficient for making the surface of the carbon fibres hydrophilic even at the highest fibre content 2.4 vol% because it was observed that most of the surface of the carbon fibres were covered with hardened cement which reacted with the adsorbed water in Step 3. Reasonably, it is safe to assume that the at fibre contents <2.4 vol%, the amount of polycarboxylate superplasticizer at 0.4% by mass of cement was effective for wetting the surface of the carbon fibres. Therefore, it can be proposed that the reason why at fibre contents >0.6 vol% the volume of the coarser pores was higher, is mostly associated with the indirectly changed effective water/cement ratio rather than the dosage of the polycarboxylate superplasticizer. As mentioned previously, the fibre content is positively proportional to adsorbed water on the fibre surface, but inversely proportional to the effective water. At fibre contents >0.6 vol% which is above the boundary fibre content, the effective water/cement ratio was insufficient for the reaction with cement resulting in more coarser pores. This MIP observation can also be confirmed in the above microstructural images that the smart composite with a low fibre content of 0.2 vol% exhibited a more compacted and homogenised mortar matrix (Figure 5A) with uniformly dispersed fibres in comparison to that with the highest fibre content 2.4 vol% which had segregated mixing components (Figure 4A) with noticeable air voids and poorly dispersed fibres.
While at fibre contents <0.6 vol%, the volume of the coarser pores, although lower than that of the plain mortar, but was still progressively increasing as the fibre increases (Figure 7A). It can be proposed that here the effective water was sufficient for reacting with cement and dispersing the fibres hence lower volume of the coarser pores in comparison to the plain mortar, where the increase of the volume of the coarser pores can be caused by the natural agglomeration of the fibres for high aspect ratio (ratio of fibre length to the diameter = 800 : 1).
Taking the volume of the coarser pores in the plain mortar as a standard, the above findings can be summarized in Table 2.
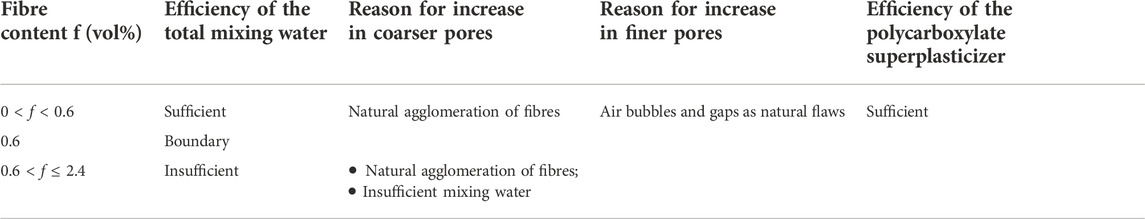
TABLE 2. Factors to dominate the increase of finer pores and coarser pores with the increasing fibre dosage.
3.2 Electrical properties
As noted in the previous section, the microstructure of mortar matrix is influenced by the fibre content. Therefore, as increasing the fibre content in smart cement-based composite, the development of the bulk conductivity σ is a result of a “dual action” which depends on the development of the electronic conduction through the fibres, as well as the consequent changes to the ionic conduction through the pore fluid in capillary pores.
In Figure 8, bulk conductivities of the mixtures have been plotted against the increasing fibre content. In Figure 8A, it is evident that while increasing the fibre content in the diluted CH solution, the relationship between bulk conductivity σ and fibre content obeyed an explicit power law:
where
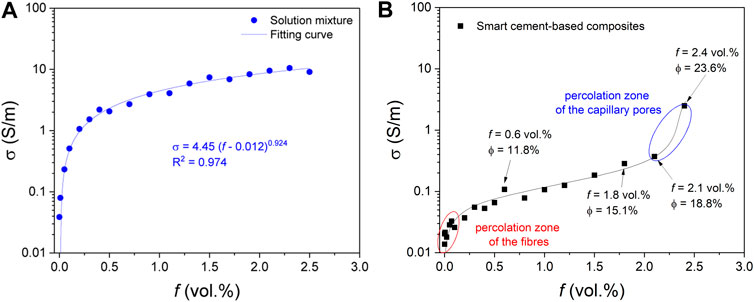
FIGURE 8. Development of bulk conductivity σ with the increasing fibre content f in different substrates (A) the solution mixture (with diluted CH solution as a continuum substrate) (B) the smart cement-based composites (with water-saturated mortar matrix as an inhomogeneous substrate).
In Figure 8A, the two most important parameters, the percolation threshold
Strictly speaking, the classic percolation law can only be applied under the following two principles, where the percolation threshold is solely dependent on the conductive filler to use (Zallen, 1998):
• the substrate should be homogenous and continuous
• the electrical conductivity of the substrate should be far lower than that of the filler used.
Referring back to Figure 8A, the diluted CH solution can be considered as a continuum and homogenous substrate. The electrical conductivities of the carbon fibre and the diluted CH solution differ by six orders of magnitude, at 6.7×10⁴ S/m (Table 1) and 0.04 S/m, respectively. Therefore, it is anticipated that Eq. 3 is well-fitted in Figure 8A. The obtained percolation threshold
The carbon fibre is a conductive filler for electronic conduction, while the pore fluid in the connected pores can be taken as a conductive filler of alternative form (i.e., electrolytically conductive filler), both being dispersed in a less conductive substrate, the cement skeleton. Therefore, it is proposed that there exists a “double percolation” in a smart cement-based composite: the percolation through the fibres and the percolation through the liquid filled connected pores. With reference to Figure 8B, on the “quasi-percolation” curve, two distinctive zones of sharp increase in the bulk conductivity can be identified: one located at the beginning of the curve, and the other at the end. The bulk conductivity had a sharp turn at fibre content 2.1 vol% where a connected porosity of 18.8% was detected, and then increased almost vertically thereafter until at 2.4 vol% with a porosity of 23.6%. Given the fact that the percolation threshold of capillary pores in cement matrix ranges from 16–20% (Garboczi and Bentz, 1992; Bejaoui and Bary, 2007; Li et al., 2016; He et al., 2018), it is likely that the percolation zone of the connected pores lay between the fibre contents 2.1–2.4 vol% (Figure 8B). Since the fitted
3.3 Mechanical properties
The average values of the compressive strength Rc and flexural strength Rf of smart cement-based composites with fibre contents 0–2.4 vol% are depicted in Figure 9 along with their standard deviations. The Rc and Rf for the plain mortar as reference strengths were obtained to be 43.8 MPa and 4.8 MPa, respectively. While increasing the fibre content, the Rc increased to the peak strength 90.1 MPa at 0.2 vol%, and then gradually decreased reaching the lowest strength of 17.4 MPa at 2.4 vol% (Figure 9A). The Rc exhibited marginal increase at lower fibre contents 0–0.1 vol%. But at the two lowest fibre additions, 0.001 vol% and 0.005 vol%, the Rc had fluctuational values (Figure 9B). The Rf increased with an increase in fibre content, until a peak strength of 9.4 MPa at 0.3 vol% and then progressively decreased to 5.3 MPa at 2.4 vol%.
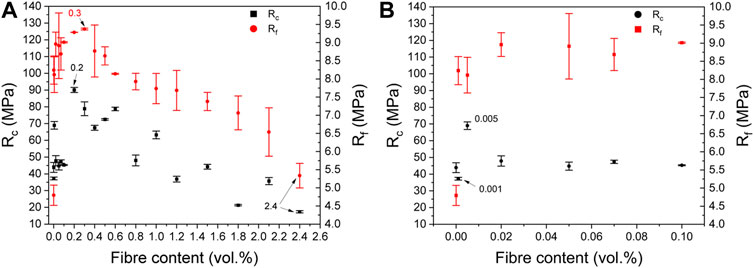
FIGURE 9. Arithmetic means and standard deviations of compressive strength Rc and flexural strength Rf for (A) smart cement-based composites with fibre contents 0–2.4 vol% (B) magnified plot for smart cement-based composites with near-zero fibre contents 0–0.1 vol%.
In comparison to the literature using the macro-scale chopped carbon fibres with the same aspect ratio as this study (around 800:1), a continuously increasing Rf with the increasing fibre content was reported by Wang and Aslani (Wang and Aslani, 2021), where the fibre contents increased from 0 to 0.7% by mass of cement (i.e., equivalent to around 0.2 vol% in this study). This trend was consistent with what was found in this study at lower fibre contents 0–0.2 vol% in Figure 9A. Therefore, the employment of large fibre dosage range in this study from 0 to 2.4 vol%, has fully revealed the growing fashion of the mechanical properties. The increasing Rf with the increasing fibre content was also reported by Donnini et al. with the maximum fibre content of 1.03 vol% (Donnini et al., 2018). However, they increased the amount of the mixing water as the fibre content increased, which was different from this study where the mixing water/cement ratio was fixed at all fibre contents resulting in the decreased Rf at fibre contents ≥0.3 vol% (Figure 9A). It is worth noting that this growing fashions of Rc and Rf, which both firstly increased then decreased, were consistent with what was reported in a study using carbon fibres with a lower aspect ratio (10 : 1) where the peak mechanical properties were determined at a higher fibre content 0.5 vol% (Garcés et al., 2005).
To explain the reasons why both Rc and Rf increased and then decreased with the continuously increasing fibre content in Figure 9A, the mechanism of failure should be primarily understood. It has been observed on the fracture surface that the carbon fibres were unlikely to break (Figures 5B, C), which can be ascribed to its high strength (Table 1). The strength of the common rocks for the use as aggregates has large variations from 117 to 530 MPa according to the record in the literature (Neville, 2011), which were still higher than the highest compressive strength 90.1 MPa detected on CF0.2 vol% with the (Figure 9A). Most importantly, the quality and strength of the standard sand in this study conformed to BS EN 196-1, which requires no influence on the mortar strength. Therefore, it is unlikely for the strength of the mixing components, the carbon fibre and the sand, to affect the strength outcomes in this study. Concrete is inhomogeneous and naturally carries flaws throughout the matrix. In Griffith’s theory, individual flaws lead to high stress concentrations in a very small volume while under loading, ultimately resulting in a micro crack (or micro failure). These microscopic cracks, through propagation and coalescence, become macro cracks with a consequent failure of concrete (Griffith, 1921). Therefore, more flaws normally lead to earlier failure. In the matrix of smart cement-based composite, failure in compression and bending occurs at the locations where stresses are highest and where the flaws are most likely to reside: gels and crystals, and the bonding of the mixing components (i.e. the bonding of cement-sand, and the bonding of cement-fibre). Fibres are bonded together in areas of interfacial stress produced by the shrinkage strain of cement hydration. This interfacial stress far exceeds the boundary necessary to result in cracking (Banthia and Sheng, 1996; Bindiganavile and Banthia, 2001; Zanotti et al., 2014). Dispersed fibres can bridge across the flaws and the micro cracks hence providing reinforcement and being able to limit crack propagation and coalescence by this interfacial constriction. The increase in fibre content can increase this bonding stress.
Also, the indirectly changed effective water/cement ratio with the change of fibre content is another reason. Commonly, the water/cement ratio has a limit, that, at or above the limit the cement is sufficiently hydrated and water/cement ratio can be inversely proportional to the strength, while below the limit the cement cannot be fully hydrated where flaws are easy to form. In this study, it has been demonstrated that cement can harden through the adsorbed water on the fibres, thereby bonding the fibres. If the remaining effective water is still above the limit, the mixing components can be bounded by a lower “effective water-cement” ratio which produced higher cement-sand bonding strength (Ouda, 2015; Wang and Aslani, 2022). This effective water-cement ratio which was still above the limit, as stated above, was inversely proportional to the fibre content, hence making a stronger matrix.
To summarize, the two main reasons why Rc increased with the increasing fibre content 0–0.2 vol%, and the Rf increased with the increasing fibre content 0–0.3 vol% (Figures 9A, B) were:
• the additional reinforcement by the bonding of the fibres:
• and the indirectly reduced effective water-cement ratio due to fibre inclusion, which was still above the limit ensuring full hydration and compaction
Further increasing the fibre content, the Rc and Rf decreased from the peak strengths at 0.2 vol% and 0.3 vol% respectively, to the lowest at 2.4 vol% (Figures 9A, B). Griffith’s theory can be extended to explain this phenomenon because for a unit cross-sectional area, the mechanical strength lowers as long as the number of flaws increased. It can be proposed that at this stage, the effective water/cement ratio was below the limit, which allowed the flaws to increase in the hydration products and the cement-sand bonding. Also, the presence of increased fibres and possible fibre clumping (Figure 3A) further increased the flaws. This weakening effect undermined the interfacial bonding produced by the cement-fibre, which can also be proved by Figure 4 showing a poorly bonded matrix with the lowest “effective water-cement ratio” for having the highest fibre content. To summarize, the mechanical properties of smart cement-based composites were a result of a dual effect related to the incorporation of the carbon fibres:
• the strengthening effect: the matrix was strengthened via the additional cement-fibre interfacial bonding and the indirectly reduced effective water/cement ratio which was still above the limit;
• the weakening effect: once the effective water/cement ratio was below the limit, the mechanical strengths of the hydration products and the cement-sand bonding were weakened, where flaws easily formed. The flaws also readily formed due to fibres clumping.
As anticipated, the peak values of Rc and Rf were obtained at relatively consistent fibre contents, which were 0.2 vol% and 0.3 vol% respectively. There was a marginal increase in Rc at fibre contents 0–0.1 vol% where the strength fluctuated. Hence from a conventional perspective of concrete testing, it is possible that statistical probability is the reason, which requires sufficient samples to refine the curve at fibre contents 0–0.3 vol%. Based on the MIP results which demonstrated that the coarser pores were positively related to the fibre content, it can be concluded that the weakening effect has already existed from lower to higher fibre contents, which continuously enhanced. The overall mechanical property is the collective works of the weakening and the strengthening effects, that, at fibre contents 0–0.2/0.3 vol% the strengthening effect predominated leading to increased strengths with increased fibre contents, while at fibre contents 0.2/0.3–2.4 vol%, the weakening effect developed faster than the strengthening effect leading to the decreasing mechanical strength. The limit of the effective water-cement ratio was near fibre contents 0.2 or 0.3 vol% but this will change if the mix design (and particularly the water content) is altered. Such a phenomenon is schematically depicted in Figure 10, where the collective strength firstly increased to maximum at somewhere between fibre contents 0.2 vol% and 0.3 vol%, and then reduced.
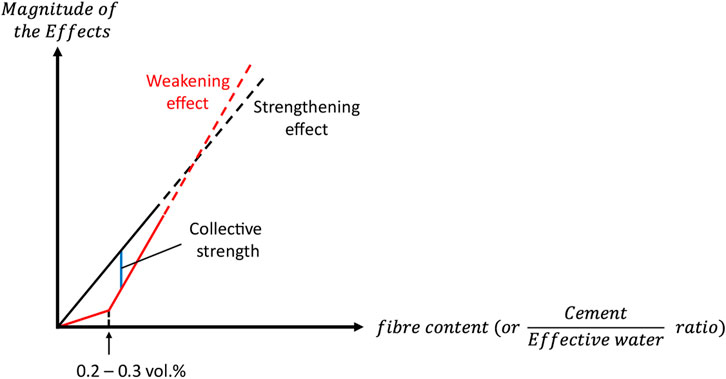
FIGURE 10. Schematic illustration for the development of the strengthening and weakening effects with the increasing fibre content (which is inversely proportional to the effective water/cement ratio). The collective strength can be calculated by subtracting the magnitude of the weakening effect from the strengthening effect.
The underlying mechanisms for the mechanical strength which firstly increased then decreased with the continuously increasing fibre content has been investigated based on the absolute values in Figure 9. To better categorize the properties at all fibre contents, the percentage of increase in comparison to the plain mortar was plotted in Figure 11, which was calculated through
where
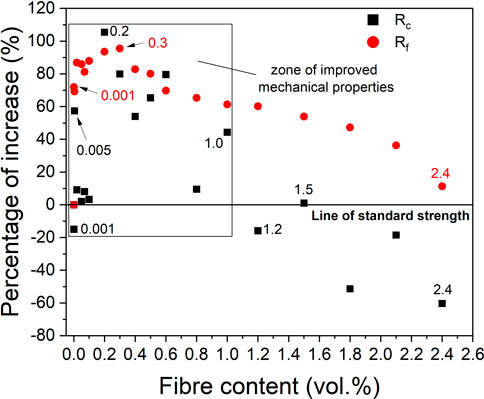
FIGURE 11. Percentage change in the mechanical performances Rc and Rf of smart cement-based composites at fibre contents 0–2.4 vol% relative to the plain mortar (marked as line of standard strength).
In comparison to the standard strength of plain mortar, the peak Rc was found to have an increase of 105% at fibre content 0.2 vol%, while the lowest Rc at fibre content 2.4 vol% showed a reduction of 60% (Figure 11). The Rf of the smart cement-based composite was found to be higher than that of the plain mortar at all fibre contents. The peak Rf was found to have an increase of 95% for sensor 0.3 vol%. This result was consistent with what was reported in the study by Chen and Chung (1993b). Even the lowest incorporation of carbon fibres, 0.001 vol%, enhanced the Rf by 72%, while the highest incorporation, 2.4 vol%, enhanced the Rf only by 11%.
4 Conclusion
In this present study, smart cement-based composite containing carbon fibres at dosages ranging from 0–2.4 vol% in a standard mortar matrix with fixed proportions of water, cement, sand, and polycarboxylate superplasticizer were manufactured. This is the first time a large range and small increments in fibre contents were assessed for both electrical and mechanical properties. The associated changes in the electrical and mechanical properties with changing fibre content were reported and discussed based on the microstructural observations and existing theories. The findings can be summarized as follows:
• At lower fibre contents, smart cement-based composite showed a uniform dispersion of the fibres but with fewer fibre-fibre contact points, whereas at higher fibre contents, smart cement-based composite had relatively lower quality of fibre dispersion but with more fibre-fibre contact points.
• As the fibre content increased, more mixing water was adsorbed onto the surface of the carbon fibres, resulting in less effective water remaining. This phenomenon indirectly changed the “effective water-cement” ratio, which alters the appearance, microstructural, electrical, and mechanical properties of smart cement-based composites. It is suggested that the amount of the mixing water should be increased to an appropriate extent as the fibre content increases in order to compensate this adverse effect.
• As the fibre content increased, the electrical conductivity of water-saturated smart cement-based composite underwent a double percolation process: the percolation of the carbon fibres and the percolation of the connected pores. The percolation zone of the carbon fibres was determined to be 0–0.1 vol% while the percolation zone of the connected pores was located at the fibre loadings 2.1–2.4 vol%.
• Both the compressive and flexural strengths firstly increased to the peak and then decreased to the lowest with increasing fibre content. This phenomenon was contributed by a dual effect of increasing the fibre content: the matrix was strengthened via the interfacial cement-fibre bonding and indirectly reduced effective water/cement ratio, while the matrix was weakened once the effective water/cement ratio was below a limit which did not produce sufficient cement hydration and also promoted fibre clumping.
• In comparison to the plain mortar, smart cement-based composites of all fibre contents had higher flexural strengths, whereas the compressive strength was higher at fibre contents 0–1.0 vol% and lower at fibre contents 1.2–2.4 vol%. The peak compressive strength was obtained at the fibre content 0.2 vol% with a value of 90.1 MPa showing an increase of 105%, whereas the peak flexural strength was found at 0.3 vol% with a value of 9.4 MPa showing an increase of 95%. The incorporation of fibres 0–1.0 vol% resulted in the improved mechanical performances of smart cement-based composites in comparison to the plain mortar.
This study presents a full laboratory characterization on the physico-chemical properties of electrically conductive smart cement-based composite, which is a necessary step prior to the evaluation of self-sensing performances. In general conclusion, smart cement-based composites containing relatively low fibre contents (≤0.3 vol%) had bulk conductivity at or near the zone of percolation, better mechanical performance, and better quality of fibre dispersion. Based on the outcomes of the transitional processes and the underlying mechanisms discussed in this pilot research, further improvements on the composite’s physical properties can be accomplished by improving the manufacturing process and mix design, which allows for the assessment of the multifunctional self-sensing performances of the more optimized and robust carbon fibre reinforced cement-based sensors.
Data availability statement
All data created during this research is openly available from the University of Bath Research Data Archive at: Zhang et al. (2022). Dataset for “Effect of fibre loading on the microstructural, electrical, and mechanical properties of carbon fibre incorporated smart cement-based composites”. Bath: University of Bath Research Data Archive. https://doi.org/10.15125/BATH-01202.
Author contributions
JZ: Conceptualization, Methodology, Investigation, Writing and Editing; AH: Conceptualization, Methodology, Supervision, Writing and Editing; RJB: Supervision, Review and Editing; KP: Funding acquisition, Supervision, Review and Editing.
Acknowledgments
The authors gratefully acknowledge the technical staff within Department of Architecture and Civil Engineering and the Material and Chemical Characterization Facility (MC2) at the University of Bath (doi.org/10.15125/mx6j-3r54) for the technical support and assistance in this work. For the purpose of open access, the author has applied a Creative Commons Attribution (CC-BY) licence to any Author Accepted Manuscript version arising. The Engineering and Physical Sciences Research Council (EPSRC) is thanked for funding the Resilient Materials for Life (RM4L) project [grant number EP/PO 2081X/1].
Conflict of interest
The authors declare that the research was conducted in the absence of any commercial or financial relationships that could be construed as a potential conflict of interest.
Publisher’s note
All claims expressed in this article are solely those of the authors and do not necessarily represent those of their affiliated organizations, or those of the publisher, the editors and the reviewers. Any product that may be evaluated in this article, or claim that may be made by its manufacturer, is not guaranteed or endorsed by the publisher.
References
Akihama, S., Suenaga, T., and Banno, T. (1986). Mechanical properties of carbon fibre reinforced cement composites. Int. J. Cem. Compos. Lightweight Concr. 8, 21–33. doi:10.1016/0262-5075(86)90021-7
Al-Dahawi, A., Sarwary, M. H., Öztürk, O., Yıldırım, G., Akın, A., Şahmaran, M., et al. (2016). Electrical percolation threshold of cementitious composites possessing self-sensing functionality incorporating different carbon-based materials. Smart Mat. Struct. 25, 105005. doi:10.1088/0964-1726/25/10/105005
Azhari, F., and Banthia, N. (2012). Cement-based sensors with carbon fibers and carbon nanotubes for piezoresistive sensing. Cem. Concr. Compos. 34, 866–873. doi:10.1016/j.cemconcomp.2012.04.007
Baeza, F. J., Galao, O., Zornoza, E., and Garcés, P. (2013). Effect of aspect ratio on strain sensing capacity of carbon fiber reinforced cement composites. Mater. Des. 51, 1085–1094. doi:10.1016/j.matdes.2013.05.010
Ball, R. J., Allen, G. C., Starrs, G., and McCarter, W. J. (2011). Impedance spectroscopy measurements to study physio-chemical processes in lime-based composites. Appl. Phys. A 105, 739–751. doi:10.1007/s00339-011-6509-7
Banthia, N., Djeridane, S., and Pigeon, M. (1992). Electrical resistivity of carbon and steel micro-fiber reinforced cements. Cem. Concr. Res. 22, 804–814. doi:10.1016/0008-8846(92)90104-4
Banthia, N., and Sheng, J. (1996). Fracture toughness of micro-fiber reinforced cement composites. Cem. Concr. Compos. 18, 251–269. doi:10.1016/0958-9465(95)00030-5
Bejaoui, S., and Bary, B. (2007). Modeling of the link between microstructure and effective diffusivity of cement pastes using a simplified composite model. Cem. Concr. Res. 37, 469–480. doi:10.1016/j.cemconres.2006.06.004
Benmokrane, B., El-Salakawy, E., El-Gamal, S., and Goulet, S. (2007). Construction and testing of an innovative concrete bridge deck totally reinforced with glass FRP bars: Val-alain bridge on highway 20 east. J. Bridge Eng. 1212, 6325–6645. doi:10.1061/(asce)1084-0702(2007)12:5(632)
Bindiganavile, V., and Banthia, N. (2001). Polymer and steel fiber-reinforced cementitious composites under impact loading—Part 1: Bond-slip response. MJ 98. doi:10.14359/10155
Chen, B., Wu, K., and Yao, W. (2004). Conductivity of carbon fiber reinforced cement-based composites. Cem. Concr. Compos. 26, 291–297. doi:10.1016/S0958-9465(02)00138-5
Chen, P.-W., and Chung, D. D. L. (1993a). Carbon fiber reinforced concrete for smart structures capable of non-destructive flaw detection. Smart Mat. Struct. 2, 22–30. doi:10.1088/0964-1726/2/1/004
Chen, P.-W., and Chung, D. D. L. (1993b). Concrete reinforced with up to 0.2 vol% of short carbon fibres. Composites 24, 33–52. doi:10.1016/0010-4361(93)90261-6
Chen, P.-W., and Chung, D. D. L. (1996). Low-drying-shrinkage concrete containing carbon fibers. Compos. Part B Eng. 27, 269–274. doi:10.1016/1359-8368(95)00020-8
Christensen, B. J., Coverdale, T., Olson, R. A., Ford, S. J., Garboczi, E. J., Jennings, H. M., et al. (1994). Impedance spectroscopy of hydrating cement-based materials: Measurement, interpretation, and application. J. Am. Ceram. Soc. 77, 2789–2804. doi:10.1111/j.1151-2916.1994.tb04507.x
Chuang, W., Lei, P., Bing-liang, L., Ni, G., Li-ping, Z., and Ke-zhi, L. (2018). Influences of molding processes and different dispersants on the dispersion of chopped carbon fibers in cement matrix. Heliyon 4, e00868. doi:10.1016/j.heliyon.2018.e00868
Chung, D. D. (2005). Dispersion of short fibers in cement. J. Mat. Civ. Eng. 1717, 3794–4383. doi:10.1061/(asce)0899-1561(2005)17:4(379)
Chung, D. D. L. (2000). Cement reinforced with short carbon fibers: A multifunctional material. Compos. Part B Eng. 31, 511–526. doi:10.1016/S1359-8368(99)00071-2
Chung, D. D. L. (2021). Self-sensing concrete: From resistance-based sensing to capacitance-based sensing. Int. J. Smart Nano Mater. 12, 1–19. doi:10.1080/19475411.2020.1843560
Chung, D. D. L. (1995). Strain sensors based on the electrical resistance change accompanying the reversible pull-out of conducting short fibers in a less conducting matrix. Smart Mat. Struct. 4, 59–61. doi:10.1088/0964-1726/4/1/009
Díaz, B., Freire, L., Nóvoa, X. R., Puga, B., and Vivier, V. (2010). Resistivity of cementitious materials measured in diaphragm migration cells: The effect of the experimental set-up. Cem. Concr. Res. 40, 1465–1470. doi:10.1016/j.cemconres.2010.05.004
Díaz, B., Guitián, B., Nóvoa, X. R., and Pérez, C. (2020). Analysis of the microstructure of carbon fibre reinforced cement pastes by impedance spectroscopy. Constr. Build. Mater. 243, 118207. doi:10.1016/j.conbuildmat.2020.118207
Díaz, B., Guitián, B., Nóvoa, X. R., and Pérez, C. (2021). Conductivity assessment of multifunctional cement pastes by impedance spectroscopy. Corros. Sci. 185, 109441. doi:10.1016/j.corsci.2021.109441
Ding, S., Xiang, Y., Ni, Y.-Q., Thakur, V. K., Wang, X., Han, B., et al. (2022). In-situ synthesizing carbon nanotubes on cement to develop self-sensing cementitious composites for smart high-speed rail infrastructures. Nano Today 43, 101438. doi:10.1016/j.nantod.2022.101438
Dong, W., Li, W., Tao, Z., and Wang, K. (2019). Piezoresistive properties of cement-based sensors: Review and perspective. Constr. Build. Mater. 203, 146–163. doi:10.1016/j.conbuildmat.2019.01.081
Donnini, J., Bellezze, T., and Corinaldesi, V. (2018). Mechanical, electrical and self-sensing properties of cementitious mortars containing short carbon fibers. J. Build. Eng. 20, 8–14. doi:10.1016/j.jobe.2018.06.011
Fuhr, P. L., and Huston, D. R. (1998). Corrosion detection in reinforced concrete roadways and bridges via embedded fiber optic sensors. Smart Mat. Struct. 7, 217–228. doi:10.1088/0964-1726/7/2/009
Galao, O., Baeza, F. J., Zornoza, E., and Garcés, P. (2014). Strain and damage sensing properties on multifunctional cement composites with CNF admixture. Cem. Concr. Compos. 46, 90–98. doi:10.1016/j.cemconcomp.2013.11.009
Garboczi, E. J., and Bentz, D. P. (1992). Computer simulation of the diffusivity of cement-based materials. J. Mat. Sci. 27, 2083–2092. doi:10.1007/BF01117921
Garcés, P., Fraile, J., Vilaplana-Ortego, E., Cazorla-Amorós, D., Alcocel, E. G., and Andión, L. G. (2005). Effect of carbon fibres on the mechanical properties and corrosion levels of reinforced portland cement mortars. Cem. Concr. Res. 35, 324–331. doi:10.1016/j.cemconres.2004.05.013
Gaumet, A. V., Ball, R. J., and Nogaret, A. (2021). Graphite-polydimethylsiloxane composite strain sensors for in-situ structural health monitoring. Sensors Actuators A Phys. 332, 113139. doi:10.1016/j.sna.2021.113139
Griffith, A. A. (1921). The phenomena of rupture and flow in solids. Phil. Trans. R. Soc. Lond. A 221, 163–198. doi:10.1098/rsta.1921.0006
Han, B., Ding, S., and Yu, X. (2015). Intrinsic self-sensing concrete and structures: A review. Measurement 59, 110–128. doi:10.1016/j.measurement.2014.09.048
Han, B., Guan, X., and Ou, J. (2007). Electrode design, measuring method and data acquisition system of carbon fiber cement paste piezoresistive sensors. Sensors Actuators A Phys. 135, 360–369. doi:10.1016/j.sna.2006.08.003
Han, B., and Ou, J. (2007). Embedded piezoresistive cement-based stress/strain sensor. Sensors Actuators A Phys. 138, 294–298. doi:10.1016/j.sna.2007.05.011
Han, B., Yu, X., and Ou, J. (2010). Effect of water content on the piezoresistivity of MWNT/cement composites. J. Mat. Sci. 45, 3714–3719. doi:10.1007/s10853-010-4414-7
Han, B., Zhang, K., Yu, X., Kwon, E., and Ou, J. (2012). Fabrication of piezoresistive CNT/CNF cementitious composites with superplasticizer as dispersant. J. Mat. Civ. Eng. 24, 658–665. doi:10.1061/(ASCE)MT.1943-5533.0000435
He, R., Ma, H., Hafiz, R. B., Fu, C., Jin, X., and He, J. (2018). Determining porosity and pore network connectivity of cement-based materials by a modified non-contact electrical resistivity measurement: Experiment and theory. Mater. Des. 156, 82–92. doi:10.1016/j.matdes.2018.06.045
Huang, H., Ye, G., and Damidot, D. (2013). Characterization and quantification of self-healing behaviors of microcracks due to further hydration in cement paste. Cem. Concr. Res. 52, 71–81. doi:10.1016/j.cemconres.2013.05.003
Jones, W., Gibb, A., Goodier, C., Bust, P., Song, M., and Jin, J. (2019). Nanomaterials in construction – what is being used, and where? Proc. Institution Civ. Eng. - Constr. Mater. 172, 49–62. doi:10.1680/jcoma.16.00011
K. Scrivener, R. Snellings, and B. Lothenbach (Editors) (2016). A practical guide to microstructural analysis of cementitious materials (Boca Raton London New York: CRC Press).
Li, Q., Xu, S., and Zeng, Q. (2016). The effect of water saturation degree on the electrical properties of cement-based porous material. Cem. Concr. Compos. 70, 35–47. doi:10.1016/j.cemconcomp.2016.03.008
Lu, D., Shi, X., Wong, H. S., Jiang, Z., and Zhong, J. (2022a). Graphene coated sand for smart cement composites. Constr. Build. Mater. 346, 128313. doi:10.1016/j.conbuildmat.2022.128313
Lu, D., Shi, X., and Zhong, J. (2022b). Understanding the role of unzipped carbon nanotubes in cement pastes. Cem. Concr. Compos. 126, 104366. doi:10.1016/j.cemconcomp.2021.104366
Lu, D., Wang, D., and Zhong, J. (2022c). Highly conductive and sensitive piezoresistive cement mortar with graphene coated aggregates and carbon fiber. Cem. Concr. Compos. 134, 104731. doi:10.1016/j.cemconcomp.2022.104731
Mason, T. O., Campo, M. A., Hixson, A. D., and Woo, L. Y. (2002). Impedance spectroscopy of fiber-reinforced cement composites. Cem. Concr. Compos. 24, 457–465. doi:10.1016/S0958-9465(01)00077-4
McCarter, W. J., and Brousseau, R. (1990). The A.C. response of hardened cement paste. Cem. Concr. Res. 20, 891–900. doi:10.1016/0008-8846(90)90051-X
McCarter, W. J., Starrs, G., Chrisp, T. M., and Banfill, P. F. G. (2009). Complex impedance and dielectric dispersion in carbon fiber reinforced cement matrices. J. Am. Ceram. Soc. 92, 1617–1620. doi:10.1111/j.1551-2916.2009.03057.x
McLachlan, D. S., Blaszkiewicz, M., and Newnham, R. E. (1990). Electrical resistivity of composites. J. Am. Ceram. Soc. 73, 2187–2203. doi:10.1111/j.1151-2916.1990.tb07576.x
Metaxa, Z. S. (2015). Polycarboxylate based superplasticizers as dispersant agents for exfoliated graphene nanoplatelets reinforcing cement based materials. JESTR 8, 1–5. doi:10.25103/jestr.085.01
Mindess, S., Young, J. F., and Darwin, D. (2003). Concrete. 2nd ed. Upper Saddle River, NJ: Prentice-Hall.
Nan, C.-W., Shen, Y., and Ma, J. (2010). Physical properties of composites near percolation. Annu. Rev. Mat. Res. 40, 131–151. doi:10.1146/annurev-matsci-070909-104529
Ouda, A. S. (2015). Development of high-performance heavy density concrete using different aggregates for gamma-ray shielding. Prog. Nucl. Energy 79, 48–55. doi:10.1016/j.pnucene.2014.11.009
Papanikolaou, I., Ribeiro de Souza, L., Litina, C., and Al-Tabbaa, A. (2021). Investigation of the dispersion of multi-layer graphene nanoplatelets in cement composites using different superplasticiser treatments. Constr. Build. Mater. 293, 123543. doi:10.1016/j.conbuildmat.2021.123543
Park, S. B., and Lee, B. I. (1993). Mechanical properties of carbon-fiber-reinforced polymer-impregnated cement composites. Cem. Concr. Compos. 15, 153–163. doi:10.1016/0958-9465(93)90004-S
Peled, A., Torrents, J. M., Mason, T. O., and Shah, S. P. (2001). Electrical impedance spectra to monitor damage during tensile loading of cement composites. MJ 98. doi:10.14359/10400
Pichór, W., Frąc, M., and Radecka, M. (2022). Determination of percolation threshold in cement composites with expanded graphite by impedance spectroscopy. Cem. Concr. Compos. 125, 104328. doi:10.1016/j.cemconcomp.2021.104328
Ramachandran, K., Vijayan, P., Murali, G., and Vatin, N. I. (2022). A review on principles, theories and materials for self sensing concrete for structural applications. Materials 15, 3831. doi:10.3390/ma15113831
Roopa, A. K., and Hunashyal, A. M. (2021). Evaluating self-sensing property of carbon fibre cement composite by experimental study and finite element modelling for structural health monitoring applications. IOP Conf. Ser. Mat. Sci. Eng. 1070, 012041. doi:10.1088/1757-899X/1070/1/012041
Safiuddin, Md., Yakhlaf, M., and Soudki, K. A. (2018). Key mechanical properties and microstructure of carbon fibre reinforced self-consolidating concrete. Constr. Build. Mater. 164, 477–488. doi:10.1016/j.conbuildmat.2017.12.172
Schurr, J. M. (1964). On the theory of the dielectric dispersion of spherical colloidal particles in electrolyte Solution1. J. Phys. Chem. 68, 2407–2413. doi:10.1021/j100791a004
Schwarz, G. (1962). A theory of the low-frequency dielectric dispersion of colloidal particles in electrolyte Solution1, 2. J. Phys. Chem. 66, 2636–2642. doi:10.1021/j100818a067
Song, G. (2000). Equivalent circuit model for AC electrochemical impedance spectroscopy of concrete. Cem. Concr. Res. 30, 1723–1730. doi:10.1016/S0008-8846(00)00400-2
Sun, M., Li, Z., Mao, Q., and Shen, D. (1998). Study on the hole conduction phenomenon in carbon fiber-reinforced concrete. Cem. Concr. Res. 28, 549–554. doi:10.1016/S0008-8846(98)00011-8
Suryanto, B., McCarter, W. J., Starrs, G., and Ludford-Jones, G. V. (2016). Electrochemical immittance spectroscopy applied to a hybrid PVA/steel fiber engineered cementitious composite. Mater. Des. 105, 179–189. doi:10.1016/j.matdes.2016.05.037
Taha, H. M., Ball, R. J., Heath, A., and Paine, K. (2022). Crack growth and closure in cementitious composites: Monitoring using piezoceramic sensors. Sensors Actuators A Phys. 333, 113221. doi:10.1016/j.sna.2021.113221
Taylor, H. F. W. (1987). A method for predicting alkazi ion concentrations in cement pore solutions. Adv. Cem. Res. 1, 5–17. doi:10.1680/adcr.1987.1.1.5
Torrents, J. M., Mason, T. O., Peled, A., Shah, S. P., and Garboczi, E. J. (2001). Analysis of the impedance spectra of short conductive fiber-reinforced composites. J. Mat. Sci. 36, 4003–4012. doi:10.1023/A:1017986608910
Toutanji, H. A., El-Korchi, T., and Katz, R. N. (1994). Strength and reliability of carbon-fiber-reinforced cement composites. Cem. Concr. Compos. 16, 15–21. doi:10.1016/0958-9465(94)90026-4
Wang, C., Li, K.-Z., Li, H.-J., Jiao, G.-S., Lu, J., and Hou, D.-S. (2008). Effect of carbon fiber dispersion on the mechanical properties of carbon fiber-reinforced cement-based composites. Mater. Sci. Eng. A 487, 52–57. doi:10.1016/j.msea.2007.09.073
Wang, L., and Aslani, F. (2021). Mechanical properties, electrical resistivity and piezoresistivity of carbon fibre-based self-sensing cementitious composites. Ceram. Int. 47, 7864–7879. doi:10.1016/j.ceramint.2020.11.133
Wang, L., and Aslani, F. (2022). Self-sensing performance of cementitious composites with functional fillers at macro, micro and nano scales. Constr. Build. Mater. 314, 125679. doi:10.1016/j.conbuildmat.2021.125679
Wang, W., Shen, A., Lyu, Z., He, Z., and Nguyen, K. T. Q. (2021). Fresh and rheological characteristics of fiber reinforced concrete——a review. Constr. Build. Mater. 296, 123734. doi:10.1016/j.conbuildmat.2021.123734
Wen, S., and Chung, D. D. L. (2007). Double percolation in the electrical conduction in carbon fiber reinforced cement-based materials. Carbon 45, 263–267. doi:10.1016/j.carbon.2006.09.031
Wen, S., and Chung, D. D. L. (2006). Model of piezoresistivity in carbon fiber cement. Cem. Concr. Res. 36, 1879–1885. doi:10.1016/j.cemconres.2006.03.029
Xie, P., Gu, P., and Beaudoin, J. J. (1996). Electrical percolation phenomena in cement composites containing conductive fibres. J. Mater. Sci. 31, 4093–4097. doi:10.1007/BF00352673
Xu, J., Yao, W., and Wang, R. (2011). Nonlinear conduction in carbon fiber reinforced cement mortar. Cem. Concr. Compos. 33, 444–448. doi:10.1016/j.cemconcomp.2010.10.007
Xu, J., Yin, T., Wang, Y., and Liu, L. (2021). Anisotropic electrical and piezoresistive sensing properties of cement-based sensors with aligned carbon fibers. Cem. Concr. Compos. 116, 103873. doi:10.1016/j.cemconcomp.2020.103873
Xu, J., Zhong, W., and Yao, W. (2010). Modeling of conductivity in carbon fiber-reinforced cement-based composite. J. Mat. Sci. 45, 3538–3546. doi:10.1007/s10853-010-4396-5
Yildirim, G., Aras, G. H., Banyhussan, Q. S., Şahmaran, M., and Lachemi, M. (2015). Estimating the self-healing capability of cementitious composites through non-destructive electrical-based monitoring. NDT E Int. 76, 26–37. doi:10.1016/j.ndteint.2015.08.005
Zanotti, C., Banthia, N., and Plizzari, G. (2014). A study of some factors affecting bond in cementitious fiber reinforced repairs. Cem. Concr. Res. 63, 117–126. doi:10.1016/j.cemconres.2014.05.008
Zhang, J., Heath, A., Abdalgadir, H. M. T., Ball, R. J., and Paine, K. (2022). Electrical impedance behaviour of carbon fibre reinforced cement-based sensors at different moisture contents. Constr. Build. Mater. 353, 129049. doi:10.1016/j.conbuildmat.2022.129049
Keywords: smart cement-based composite, fibre content, porosity, impedance spectroscopy, electrical conductivity, double percolation, compressive strength, flexural strength
Citation: Zhang J, Heath A, Ball RJ and Paine K (2022) Effect of fibre loading on the microstructural, electrical, and mechanical properties of carbon fibre incorporated smart cement-based composites. Front. Mater. 9:1055796. doi: 10.3389/fmats.2022.1055796
Received: 28 September 2022; Accepted: 04 November 2022;
Published: 22 November 2022.
Edited by:
Siqi Ding, Harbin Institute of Technology, ChinaReviewed by:
Dong Lu, Hong Kong Polytechnic University, Hong Kong SAR, ChinaXinyue Wang, Dalian University of Technology, China
Copyright © 2022 Zhang, Heath, Ball and Paine. This is an open-access article distributed under the terms of the Creative Commons Attribution License (CC BY). The use, distribution or reproduction in other forums is permitted, provided the original author(s) and the copyright owner(s) are credited and that the original publication in this journal is cited, in accordance with accepted academic practice. No use, distribution or reproduction is permitted which does not comply with these terms.
*Correspondence: Jiacheng Zhang, Si5aaGFuZ0BiYXRoLmFjLnVr
†ORCID: Jiacheng Zhang, orcid.org/0000-0001-5380-0050; Andrew Heath, orcid.org/0000-0003-0154-0941; Richard J. Ball, orcid.org/0000-0002-7413-3944; Kevin Paine, orcid.org/0000-0001-7455-7002