Airfoil Anemometer With Integrated Flexible Piezo-Capacitive Pressure Sensor
 Arun K. Ramanathan
  Leon M. Headings
 Marcelo J. Dapino
- NSF IUCRC on Smart Vehicle Concepts, Department of Mechanical and Aerospace Engineering, The Ohio State University, Columbus, OH, United States
Demand is expected to accelerate for autonomous air vehicles that transport people and goods, making wind sensors on these vehicles and in the air space where they operate critical to ensure safe control of many simultaneous take-offs and landings. Conventional anemometers such as pitot tubes as well as rotating, heated-element, acoustic, and drag technologies have drawbacks for small and micro-aerial vehicles including high power consumption, high aerodynamic drag, complex signal processing, and high cost. This paper presents an airfoil-shaped anemometer that provides low drag while integrating sensors for measuring wind speed and direction on tethered kites, balloons, and drones. Wind speed is measured by an integrated dual-layer capacitive pressure sensor with a polyvinylidene fluoride (PVDF) diaphragm while wind direction is measured by a 3D digital magnetometer that senses the orientation of the airfoil relative to the earth’s magnetic field. A model is presented for a dual-layer capacitive sensor and validated through quasistatic pressure chamber testing. The capacitive sensor as well as a commercial digital magnetometer are integrated into a NACA 2412 profile airfoil and tested in a laboratory-scale wind tunnel. The capacitive sensor provides a sensitivity of 1.84 fF m2s−2 and the airfoil exhibits a unique stable angle-of-attack to within ±2° as measured by the magnetometer.
1 Introduction
Anemometers for monitoring wind speed and direction are critical for trajectory optimization and control of tethered airborne systems such as kites, balloons, and drones. Wind speed measurements are important in the energy sector for energy forecasting and optimizing the performance of wind turbines Lackner et al. (2007). Both manned and unmanned aerial vehicles currently use pitot tubes to measure airspeed; however, pitot tubes require electrical heaters to prevent blockages due to icing. These electrical heaters negatively impact the efficiency and flight time of small and micro-aerial vehicles. There is also a growing demand for small, efficient, low-cost distributed sensors for wind monitoring as part of the Internet of Things (IoT) Wang et al. (2018).
The most common type of anemometer for non-aerial applications is the cup and vane Wang et al. (2018); Sanz-Andrés et al. (2014). These are widely used in weather observatories and wind farms as a reliable instrument for measuring wind speed and direction. However, their size, weight, and aerodynamic drag make cup and vane anemometersill-suited for aerial applications. In addition, they have a limited ability to measure rapid changes in wind speed and direction due to rotational inertia and friction between components.
Thermal anemometers measure wind speed based on the heat loss and/or temperature distribution of heated elements Gao et al. (2019). In the hot wire type, heat loss to the air flow is measured by a thermistor as part of a bridge circuit and correlated to the wind speed. For the calorimetric type, wind speed and direction are determined based on temperature gradients measured by multiple sensing elements. While thermal anemometers are small and highly accurate, the heated elements are heated continuously, resulting in high energy consumption for remote applications that rely on batteries or harvested energy. They are also susceptible to temperature drift and rapid fluctuations due to turbulent airflow Matova et al. (2003); Foss et al. (2006).
Acoustic anemometers measure wind speed based on the time-of-flight of ultrasonic pulses Han et al. (2008). Ultrasonic transducers act both as transmitters and receivers of acoustic waves to measure the transit time between transducers Ghahramani et al. (2019). Wind direction can be determined by utilizing more than two transducers and calculating their relative difference in transit times or the phase difference between the signals. While they offer good dynamic response, they require complex signal processing and the configuration of the transducers can cause high aerodynamic drag.
Finally, drag anemometers measure wind speed based on deformation caused by the airflow. The deformation may be measured using active materials such as piezoelectric Bian et al. (2015) or piezoeresistive Al-Rubaiai et al. (2019) materials, or by sensors such as fiber Bragg grating sensors Cho et al. (2013). Depending on the material and design, these anemometers can be small and lightweight with low power consumption; however, they may have limited sensing range and accuracy, and require countermeasures for temperature sensitivity. The features of the main types of anemometers described above are summarized in Table 1.
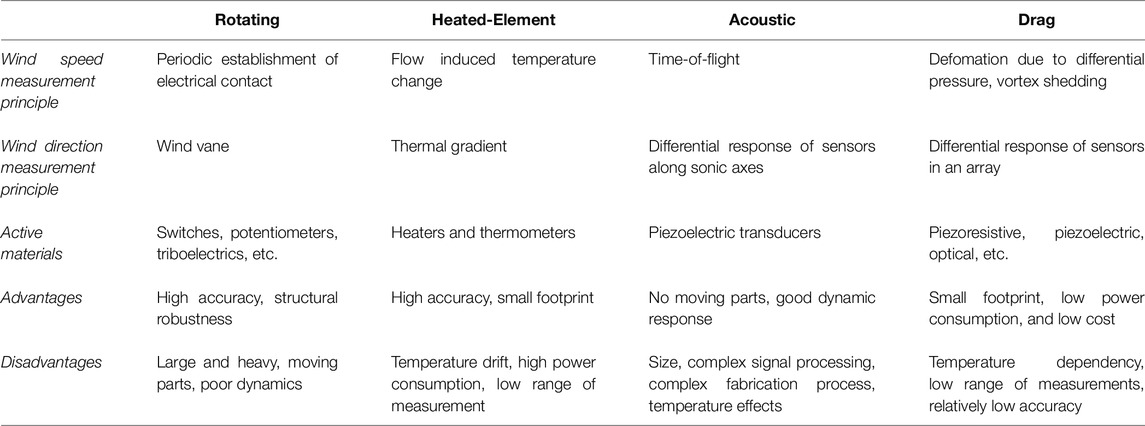
TABLE 1. Features of different anemometer technologies Ramanathan et al. (2022).
2 Airfoil Anemometer Design
2.1 Airfoil Anemometer Concept
This paper presents an airfoil anemometer for use in a smart tether system as illustrated in Figure 1 Ramanathan et al. (2022). The airfoil-shaped sleeve fits over the tether to reduce aerodynamic drag while integrating sensing, data processing, wireless communications, and energy harvesting for fully autonomous operation. An airfoil sleeve with the same frontal area as a circular profile can reduce the aerodynamic drag to as little as 1/10 of the circular profile Adel (2019). Airfoil segments along the tether can be free to rotate independently or be designed with a high torsional compliance such that the airfoil can align with the direction of airflow at all locations along the tether.
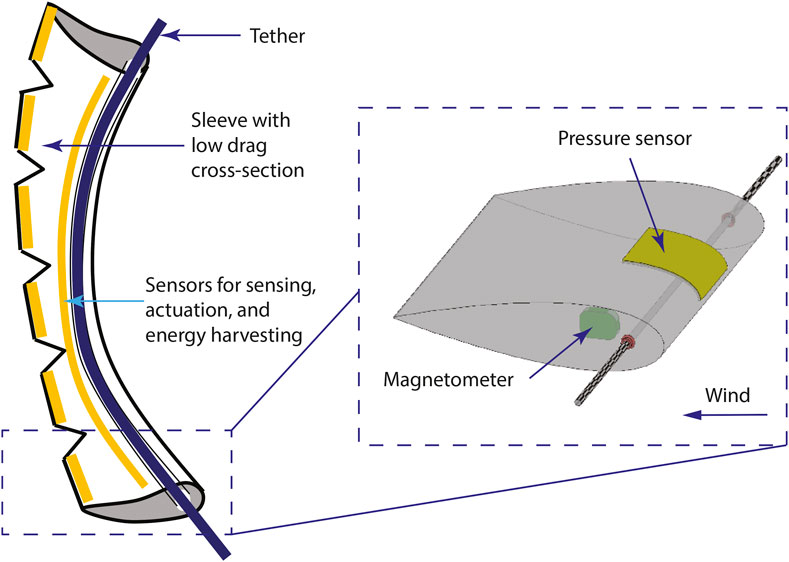
FIGURE 1. Notional schematic of a low-drag, smart tether system. The inset shows the concept of an airfoil-shaped anemometer instrumented with a conformable pressure sensor and a magnetometer for wind speed and direction measurements, respectively Ramanathan et al. (2022).
It has been shown that when the tether is located at the center of pressure, which is approximately 1/4 of the chord length, the moment created by air flowing over the airfoil is independent of the airspeed Anderson, Jr (1984). In other words, the airfoil acts like a wind vane to orient itself to a unique and stable angle-of-attack, which is the angle between the chord of the airfoil and the direction of the airflow. Therefore, the wind direction can be measured based on the angular position of the airfoil. Furthermore, once the airfoil is aligned with the wind direction, the pressure at any point on the surface of the airfoil is proportional to the wind velocity squared Abbott and Von Doenhoff (2012). Thus, wind speed can be determined by measuring the pressure acting on the surface of the airfoil. In the future, the goal is to integrate wind energy harvesters in the airfoil to improve system autonomy by harvesting electrical energy from flow-induced vibrations Wang et al. (2020).
2.2 Airfoil Profile
Airfoil profiles can be broadly classified as symmetric and asymmetric. A symmetric airfoil exhibits zero lift coefficient CL at zero angle-of-attack, whereas an asymmetric airfoil exhibits a non-zero lift coefficient CL at zero angle-of-attack Katz and Plotkin (2001). Two candidate profiles are chosen for thecurrent study--a symmetric airfoil profile (NACA 0015) and an asymmetric airfoil profile (NACA 2412). Figure 2C shows the relationship between the stable angle-of-attack versus coefficient of drag (CD) of the chosen profiles. From the plot, it can be observed that for the airfoil to provide a significant drag reduction over the circular cross-section of the tether, a stable angle-of-attack lower than 10° is desired. The airfoil profiles are generated using a digital airfoil tool Airfoil Tools (2021) and printed using a commercial 3D printer (Ultimaker Cura) with a chord length of 150 mm and a width of 70 mm. A through-hole with a diameter of 4.5 mm is provided at the center of pressure of each airfoil to suspend it in a wind tunnel using a 3.9 mm rod which acts like a rigid tether as shown in Figures 3, 4. Figures 2A,B show photographs of the 3D-printed airfoils.
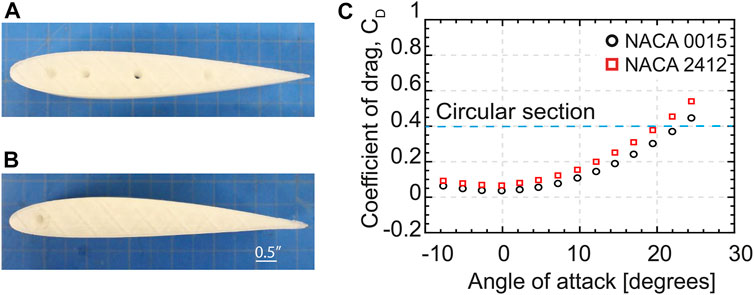
FIGURE 2. 3D-printed (A) symmetric airfoil (NACA 0015), (B) asymmetric airfoil (NACA 2412), and (C) angle of attack vs. drag coefficient for the candidate airfoil profiles Ramanathan et al. (2022). Plot generated using data from Adel (2019).
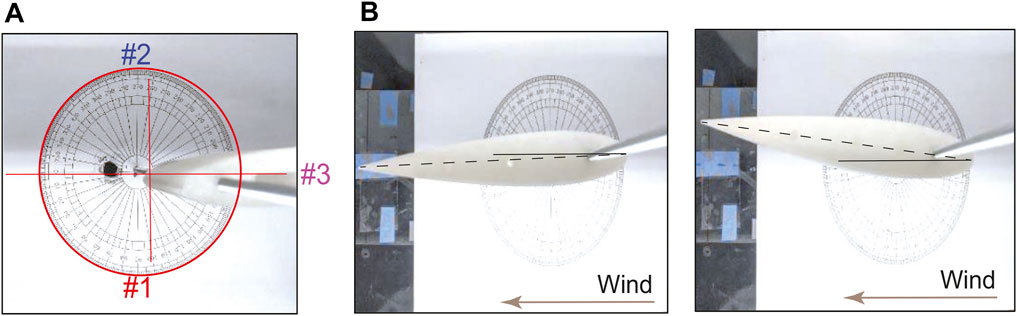
FIGURE 3. (A) Different initial orientations (#1, #2, and #3) of the symmetric airfoil before it is subjected to an airflow and (B) multiple final stable orientations exhibited by the airfoil vane when it is subjected to an air flow Ramanathan et al. (2022).
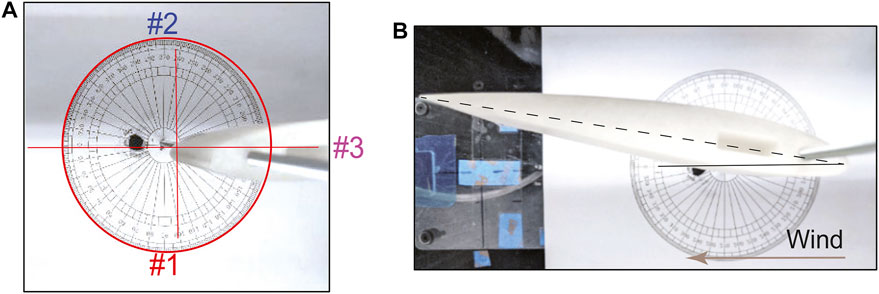
FIGURE 4. (A) Different initial orientations (#1, #2, and #3) of the asymmetric airfoil before it is subjected to an airflow and (B) unique stable orientation exhibited by the airfoil vane when it is subjected to an air flow Ramanathan et al. (2022).
Preliminary visual studies were conducted to ensure a stable orientation of the airfoils is achieved when they are subjected to an airflow. For the experimental evaluation, the airfoils are simply supported on a 10 mm diameter drill stopper such that they are free to rotate about the tether. A protractor sheet, which can be read to within ±2°, serves as a visual indicator to ensure whether the airfoil exhibits a stable angle-of-attack when subjected to an airflow. The two airfoils are tested separately by placing them at different initial orientations and then ramping the wind speed up slowly from rest to 15 m/s. The stability and uniqueness of the final orientation demonstrates the capability of the airfoil to be an effective wind vane.
The symmetric airfoil (NACA 0015) exhibited multiple final orientations between −5° to 5° when subjected to an airflow. Figure 3 shows the various initial orientations of the symmetric airfoil and subsequent final orientations when subjected to an airflow. These multiple stable orientations are suspected to be the result of an insufficient rotational moment to overcome interfacial friction at low angles-of-attack, weight imbalance about the tether axis, or fabrication inaccuracies. Further studies are warranted to understand the non-unique final orientation of the symmetric airfoil. However, when the asymmetric airfoil was subjected to an airflow in the range from 5 to 15 m/s with different initial orientations, it always aligned at a unique stable orientation at an angle-of-attack of −10° ± 2° based on the resolution of the protractor measurement. Even though the coefficient of drag for the asymmetric airfoil at an angle-of-attack of −10° is slightly higher than for the symmetric airfoil at 0°, it provides an opportunity to measure higher surface pressure on the airfoil, thus increasing its sensitivity for wind speed measurement. Figure 4 shows the different initial orientations of the asymmetric airfoil and the unique stable orientation it exhibits after subjecting it to an airflow. Therefore, for development of the airfoil anemometer, the NACA 2412 profile is chosen as the better candidate to integrate the surface wind pressure sensor for wind speed measurements.
2.3 Wind Speed Sensing
For a given angle of attack, the pressure p at any point on the surface of the airfoil is
where CP is the coefficient of pressure at a given angle-of-attack, ρ is the air density, U is the free-stream wind speed Abbott and Von Doenhoff (2012), and it is assumed that the free-stream pressure is equal to atmospheric pressure. A positive CP value represents a compressive pressure while a negative value represents a suction on the surface. Rearranging (1), the wind speed U can be calculated in terms of the measured surface pressure at the airfoil’s stable angle-of-attack:
For a NACA 2412 airfoil in a Pitsco X-Stream laboratory-scale wind tunnel, the maximum positive pressure is expected to be below 300 Pa for a wind speed of 15 m/s. A high sensor resolution is required due to the quadratic relationship between wind speed and surface pressure. In addition, this application requires conformability, insensitivity to temperature change, low cost, and low power consumption. After considering a variety of sensor technologies based on piezoelectric, piezoresistive, and capacitive techniques, the capacitive sensing technology was chosen as the most suitable candidate for near-static sensing regimes. Flexible capacitive sensors also offer tunable pressure sensitivity, low electrical noise, and low power consumption Laflamme et al. (2013); An et al. (2018); Xiong et al. (2020).
In its simplest form, a capacitive sensor consists of two conductive electrodes with a dielectric medium between them. While there are a variety of configurations for capacitive sensors, including multi-layered rectangular arrays Shi et al. (1991), inter-digitated Igreja and Dias (2004), and concentric ring-shaped Chen and Luo (1998) designs, a parallel-plate design is selected due to its design flexibility and ease of fabrication and integration onto a curved airfoil surface.
For a parallel-plate capacitor, the capacitance C is given by
where ɛ0 is the permittivity of free space, ɛr is the relative dielectric constant of the medium, A is the common surface area between the two electrodes, and t is the thickness of the dielectric medium. Wind pressure acting on the parallel-plate capacitor causes a deformation which changes the area and/or thickness of the capacitor, and thus changes its capacitance. The change in capacitance ΔC can be written as
where A (0) and ΔA(p) are the undeformed area and change in electrode area, respectively, and t (0) and Δt(p) are the undeformed thickness and change in thickness of the dielectric layer, respectively.
A parallel-plate capacitor can utilize a variety of dielectric materials, including air. Figure 5 illustrates two configurations where, in Figure 5A, the capacitance is measured across the air gap between an electrode on the diaphragm and an electrode on the base, and Figure 5B, where the capacitance is measured across the dielectric diaphragm material by electrodes on both sides.
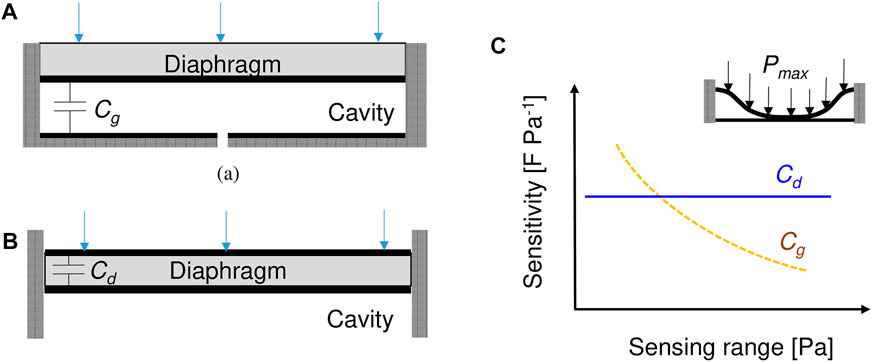
FIGURE 5. Parallel-plate configurations of capacitive pressure sensors: (A) air gap capacitor, (B) diaphragm capacitor, and (C) notional relationship between saturating sensing range and average pressure sensitivity of the air gap capacitor (yellow dashed line) and the diaphragm capacitor (blue solid line). The inset shows the deflection profile of the diaphragm at the maximum pressure measurable by the air gap capacitive sensor Ramanathan et al. (2022).
In the first configuration, a positive pressure deflects the diaphragm towards the base electrode, reducing the air gap thickness and thus increasing the capacitance. Sensing range is limited by the pressure at which the diaphragm electrode contacts the base electrode, but increasing the initial air gap thickness reduces the average pressure sensitivity. Therefore, there is a design tradeoff based on the inverse relationship between average pressure sensitivity and saturating sensing range, as shown in Figure 5C. A key advantage of this configuration is that it can distinguish between positive and negative pressures.
In the second configuration, wind pressure causes the diaphgragm to stretch in-plane as it deforms, which reduces the thickness due to the Poisson’s effect and, consequently, increases the capacitance. In contrast to the air gap capacitor, the sensing range of this configuration is limited only by the yield strength of the diaphragm material, but it cannot distinguish between positive and negative pressures. The diaphgragm capacitance is nearly linear with respect to applied pressure. The diaphgragm can be designed from materials with high dielectric constants and flexibility, such as polyvinylidene fluoride (PVDF), to increase sensitivity Inui et al. (2015).
For this research, a dual-layer circular capacitive sensor as shown in Figure 6 is considered in order to evaluate both configurations and potentially capitalize on the benefits of both. Previously, an Ecoflex-based dual capacitive pressure sensor was experimentally evaluated for wind pressure measurements, where the air gap capacitance served to indicate the direction (positive or negative pressure) and the diaphragm capacitance served as the active capacitor (indicating magnitude of the applied pressure) An et al. (2018). One of the drawbacks of constructing an entire capacitive sensor out of silicone is that the boundary conditions cannot be assumed to be clamped, thus resulting in non-analytical behavior An et al. (2018). However, an analytical model and its applicability to multi-layer flexible capacitive sensors constructed using other materials is still desired. Therefore, in Section 3 a theoretical framework is first developed to understand the effect of geometric and material properties on key performance parameters. The analytical model is then utilized to optimize the sensor design before fabrication and testing.
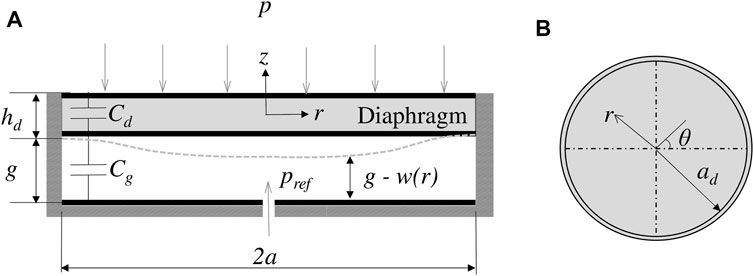
FIGURE 6. Schematic of the dual-layer circular capacitive sensor: (A) cross-sectional view and (B) top view Ramanathan et al. (2022).
2.4 Wind Direction Sensing
There are several suitable candidates to track the structural motion due to wind direction, including angular encoders Wekesa et al. (2012), potentiometers Camuffo and Denegri (1976), and triboelectric devices Wang et al. (2018). However, these technologies rely on frictional interfaces which can limit the minimum wind speed at which direction can be measured. While they can be robust, some of these technologies such as potentiometers consume high power which is detrimental to the efficiency and autonomy of small and distributed applications. In order to avoid measurements based on relative motion or position, a 3D digital magnetometer compass can be used to measure the absolute orientation of the airfoil relative to the Earth’s magnetic field. These devices can operate on a low voltage and consume less than 0.1 mW. It is noted that these devices are susceptible to errors due to various effects such as nearby ferromagnetic materials, tilt, and environmental conditions Moafipoor et al. (2007). However, these effects can be minimized through integrated compensation and calibration procedures as outlined in Section 5.2.1.
3 Modeling
In this section, a circular dual-layer capacitive sensor as shown in Figure 6 is considered. According to membrane theory, the work done on the diaphragm by the applied differential pressure (p − pref) is transformed into elastic strain energy resulting in both extension of the middle plane and out-of-plane bending of the diaphragm Zhou et al. (2005). The extension of the middle plane results in a change in capacitance of the diaphragm and the out-of-plane bending results in change in air gap capacitance. In this model, the effect of fringing field is neglected and the diaphragm layer is assumed to be initially flat. For quasistatic variation of wind pressure, the approximate transverse and radial deformation of the diaphragm layer can be written as Mo et al. (2014).
respectively, where a is the radius of the diaphragm, r is the radial coordinate, and wmax is the maximum deflection at the center of the diaphragm. The constants c1 and c2 are given by
respectively, where νd is the Poisson’s ratio of the diaphragm. The maximum deflection wmax at the center of the circular diaphragm that undergoes both stretching and bending is given by
where hd is the thickness of the diaphragm layer. The constants α1, α2, and α3 are given by
where p is the applied pressure, pref is the reference pressure in the cavity, and sd is the elastic compliance of the diaphragm layer. Therefore, the capacitance of the air gap is given using (Eqs 5, 9) as
where g is the initial air gap of the capacitor.
The radial and circumferential stresses on the circular diaphragm are given by
Assuming plane stress conditions, the radial, circumferential, and thickness strains of the diaphragm sensor are given as
respectively. Finally, the capacitance of the diaphragm due to the applied pressure p can be written as
where ɛr is the relative dielectric constant of the diaphragm material. Since the integrands in (Eqs 13, 19) do not have a closed-form solution, they are solved numerically in MATLAB. The design of the capacitive pressure sensor is primarily determined by its maximum operating compressive pressure. Throughout its operation, the diaphragm electrode should not come into contact with the bottom electrode, i.e., the center deflection of the diaphragm should not exceed the initial air gap (g) at its maximum operating pressure. Also, (Eq. 13) indicates that the average pressure sensitivity (ΔC/p) of the sensor increases with an increase in initial capacitance (Cg (0)). In other words, the sensitivity of the air gap capacitive pressure sensor increases with a decrease in the gap g and increase in the radius of the diaphragm (a).
4 Fabrication
4.1 Capacitive Pressure Sensor
The capacitive pressure sensor is fabricated using commercially available materials. For the diaphragm, a 40 μm thick polyvinylidene fluoride (PVDF) sheet was selected based on its mechanical properties, high relative permittivity (ɛr > 10), and the fact that it is available for purchase with pre-sputtered silver electrodes. Because this material is piezoelectric, it also presents opportunities for future development to enhance dynamic sensing performance and to provide vibrational wind energy harvesting. Based on the size chosen for the airfoil, a diaphragm diameter of 18 mm was selected. Then, using (Eq. 9) with the appropriate material properties (Table 2), an air gap of 304 μm was calculated for a 500 MPa maximum pressure. The base, insulation, and protection layers of the laminated structure are fabricated from Mylar, which provides relatively high compliance and electrical resistance (
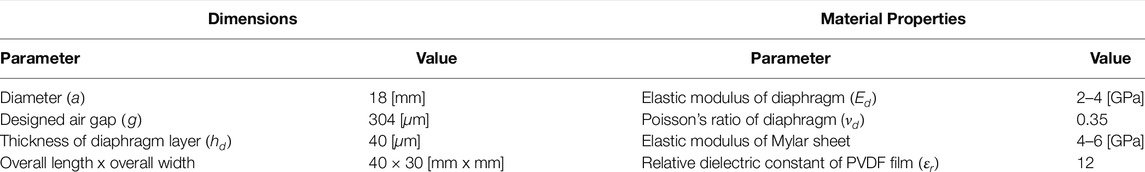
TABLE 2. Geometric and material properties of the capacitive pressure sensor shown in Figure 7B Ramanathan et al. (2022).
As illustrated in Figure 7A, the sensor is fabricated by first cutting a circular copper electrode using a programmable precision cutter (Cameo Silhouette) and then adhering the 25 μm thick copper foil to a 100 μm thick Mylar base sheet. The insulation between the base electrode and the diaphragm consists of three layers of 25 μm thick double-sided adhesive tape with two alternating 127 μm thick layers of Mylar between them. For each of these layers, an 18 mm diameter circle is cut out to form the cavity behind the diaphragm. A copper lead is cut out and placed on top of the insulation layer to later connect with the upper electrode. To create the diaphragm layer, a 25 × 25 mm square is cut out of the PVDF film, circular masks are cut with the programmable cutter and placed on the PVDF, and then the excess electrode area is etched away. Finally, the masks are removed and the electrodes are connected to the copper lead using conductive epoxy while the rest of the perimeter is attached to the insulation layer using a flexible silicone-based adhesive (Loctite) and then cured at 65°C for 30 min. After 24 h at room temperature, a 100 μm thick Mylar sheet is applied over the top surface to complete the capacitive sensor, as shown in Figure 7B. The final sensor has an overall thickness of 0.54 mm and exhibits good flexibility, allowing it to conform to the surface of an airfoil. Based on the low cost and multiple sensing modes possible with this sensor, it is expected to be well suited for a broad range of other distributed pressure sensing applications.
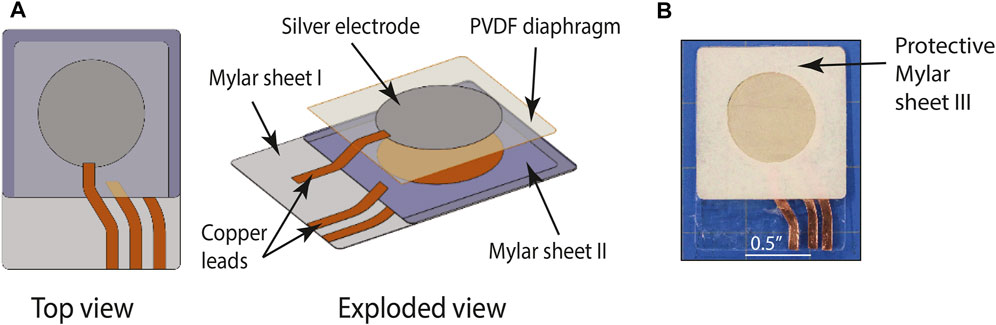
FIGURE 7. (A) Schematic of the capacitive pressure sensor and (B) photograph of the actual sensor.
4.2 Airfoil Anemometer With Integrated Sensors
A rendering of the internal design for the airfoil structure which houses the capacitive pressure sensor and magnetometer is shown in Figure 8. The chord length and the width of the NACA 2412 airfoil are chosen to be 150 and 70 mm, respectively. Since the capacitive sensor exhibits higher sensitivity when subjected to positive pressure, it is located near the nose of the airfoil where there is the highest positive pressure, as indicated by the red arrows in Figure 9. Accordingly, a 2 mm deep cavity is created to house the capacitive pressure sensor and channels are provided to route the wiring from the capacitive pressure sensor out the side of the airfoil.
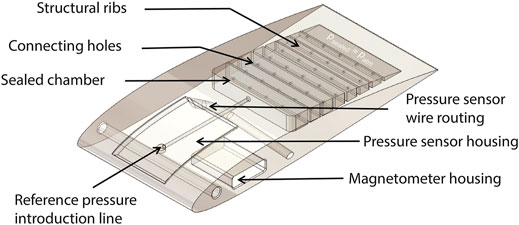
FIGURE 8. Schematic of the airfoil structure with sealed chamber.
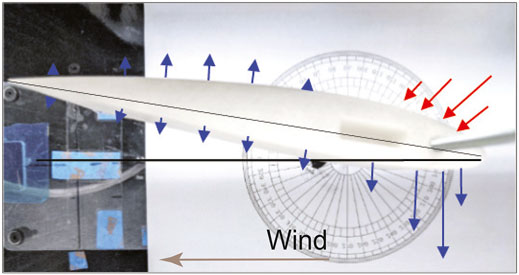
FIGURE 9. Relative pressure profile at the stable angle-of-attack experienced by the NACA 2412 profile when subjected to an airflow Abbott and Von Doenhoff (2012). Blue arrows represent negative pressures and red arrows represent compressive pressure.
A sealed chamber that provides the reference pressure for the capacitive pressure sensor is provided in the tail half of the airfoil. A small hole (3 mm diameter) and a pneumatic connection (2 mm diameter) are provided to introduce the reference pressure from the sealed chamber to the capacitive pressure sensor. Since ΔC is directly related to (p − pref), and p is related to wind speed U as given by Eq. 2, any change in reference pressure introduces error in the ΔC measurement. Therefore, the sealed chamber is equipped with ribs (1 mm thick) as shown in Figure 8 to increase the structural stiffness of the sealed chamber and eliminate any variation in reference pressure resulting from deformation of the airfoil when it is subjected to pressure loading due to an airflow. Each rib has several small holes to maximize the overall chamber volume. The resulting volume of the sealed chamber V is calculated to be 300 times more than the volume of the diaphragm displacement and thus the theoretical measurement error due to change in reference pressure from the deflection of the diaphragm is computed to be less than 0.5%. The airfoil also contains a cavity to house the LSM303AGR magnetometer breakout board, as shown in Figure 8. The airfoil is 3D printed using a commercial fused deposition modeling (FDM) printer (Ultimaker S5). Polylactic acid (PLA, Ultimaker) is printed at 200°C with 40% infill in a triangular pattern to keep the weight of the airfoil as low as possible. A low print speed of 30 mm/s, maximum layer height of 0.2 mm, and a moderate build plate temperature of 60°C are chosen to improve adhesion and reduce air gaps between the printed layers of the airfoil. Figure 10A shows the airfoil being printed. Once the airfoil is printed, the hole at the bottom of the capacitive pressure sensor is aligned with the pneumatic connection provided in the airfoil and flexible silicone adhesive is used to adhere the capacitive sensor in place as it is conformed to the curvature of the cavity. The sensor is clamped in place for several hours to cure, resulting in the airfoil with integrated sensor as shown in Figure 10B. In order to create a flush surface between the sensor and airfoil, silicone sealant (PDMS V-340, Freeman Manufacturing) is spread over the diaphragm sensor and cured at room temperature for 24 h. Figure 10C shows the pressure sensor flushed thoroughly with the silicone sealant. The silicone sealant is utilized to:
• streamline the airflow around the airfoil,
• reduce turbulence and aid measurement repeatability,
• ensure proper sealing of the pressure chamber and the sensor, and
• improve the viscoelastic response and linearity of the capacitive pressure sensor within the measurement range.
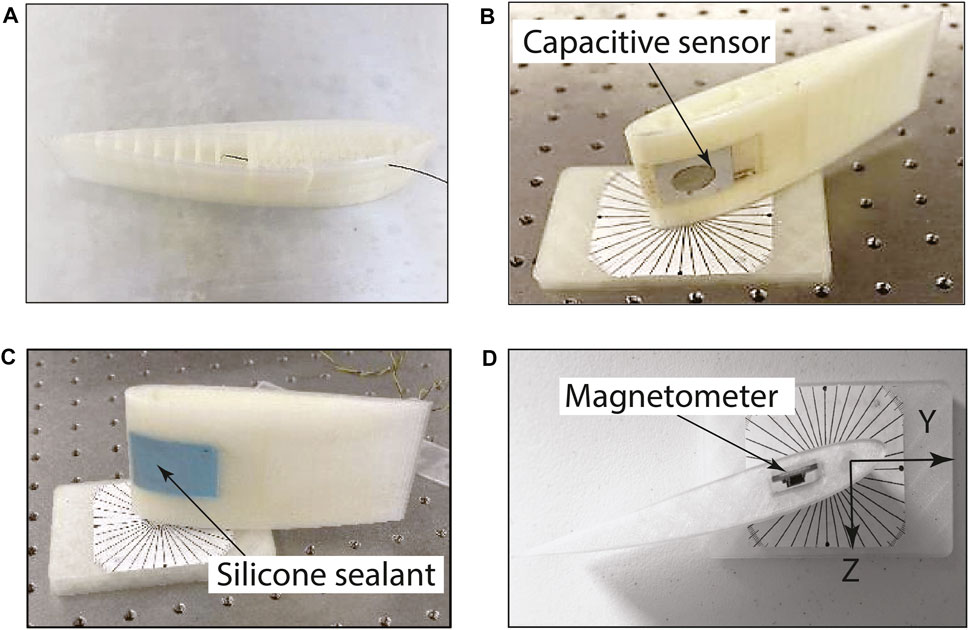
FIGURE 10. Fabrication and instrumentation of the airfoil anemometer: (A) FDM printing of the airfoil. The black wire shows the presence of the pneumatic connection feature between the pressure sensor housing and the sealed chamber, (B) the capacitive pressure sensor is conformed in the housing provided in the airfoil, (C) the pressure sensor is sealed and flushed thoroughly with sealant, and (D) a commercial 3D magnetometer module (LSM303AGR) is located in the housing in the YZ-orientation.
Finally, the LSM303AGR magnetometer breakout board is integrated into the housing in the YZ-direction using double-sided tape as shown in Figure 10D. The total weight of the instrumented airfoil anemometer is measured to be 109 g.
5 Test Methods
5.1 Static Pressure Chamber Testing of Capacitive Sensor
A quasistatic pressure chamber test setup, shown in Figure 11A, is built to verify suitability of the capacitive sensor for wind tunnel measurements, to calibrate the measured change in capacitance with the applied pressure, and to validate the model presented in Section 3. The capacitive pressure sensor is attached to the top wall of a sealed pressure chamber that has an air inlet and outlet. A syringe pump used to supply the desired pressure is connected to the chamber’s air inlet via a check valve, with the syringe pump’s piston attached to a bolt in order to precisely adjust its stroke. Pressure is measured using a Rupse HT-1890 manometer connected to the outlet of the sealed chamber. Electrical leads extending from the sealed chamber connect the capacitive pressure sensor to a BK 880 LCR meter which, in turn, is connected to a Labview interface to record capacitance measurements.
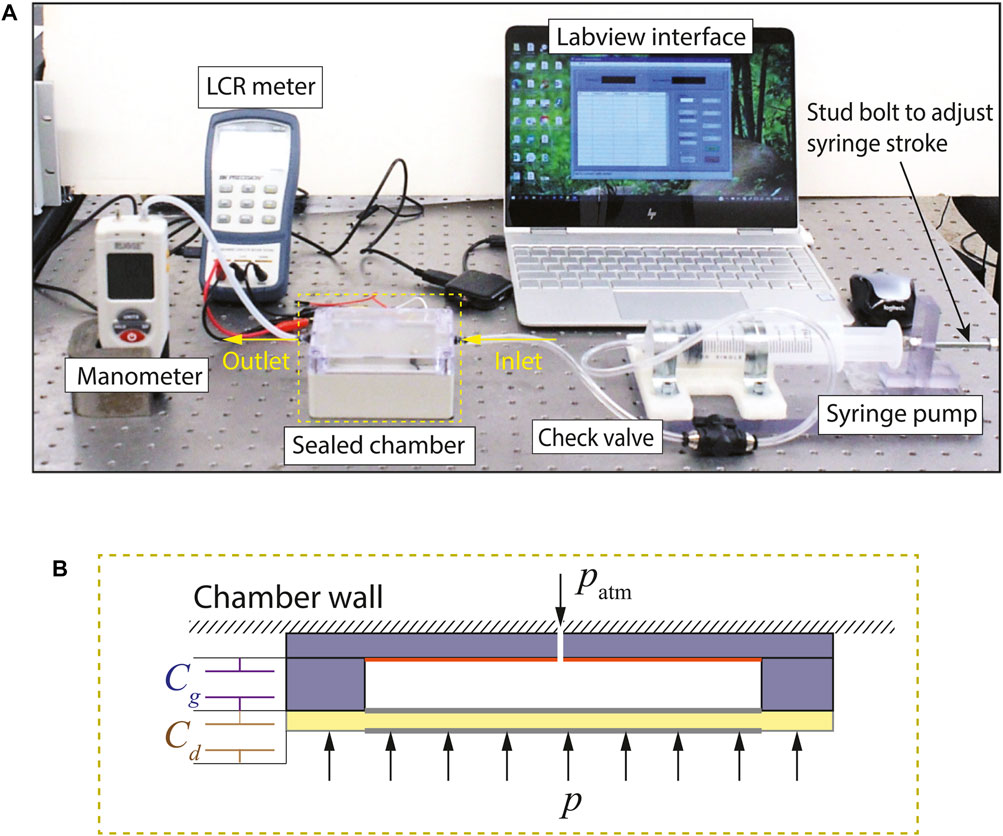
FIGURE 11. Pressure chamber experimental setup: (A) photograph of the experimental setup and (B) cross-sectional illustration of the capacitive pressure sensor in the sealed chamber under open cavity conditions. The color scheme of the materials corresponds to the same scheme shown in Figure 7.
Tests are conducted over a pressure range of −350 to 350 Pa, corresponding to the maximum pressure expected in wind tunnel testing. First, the change in air gap capacitance is recorded versus a range of applied pressures with the sealed sensor cavity. Second, the change in diaphragm capacitance is recorded versus a range of applied pressures with the sealed sensor cavity. After repeating each of these tests three times to ensure repeatable results, a small hole is drilled through the pressure chamber wall and the base of the capacitive sensor, as shown in Figure 11B, thus opening the diaphragm to atmospheric pressure rather than a sealed cavity. At this point, the two tests above are repeated three times each to measure air gap and diaphragm capacitances versus a range of applied pressures for the open cavity condition.
5.2 Wind Tunnel Testing of Airfoil Anemometer
5.2.1 Wind Speed Measurement
The experimental characterization of the airfoil anemometer in a wind tunnel is conducted in two parts. The first part characterizes the performance of the capacitive pressure sensor for wind speed measurement at the stable orientation of the airfoil. The second part characterizes the performance of the magnetometer as a wind direction indicator. The experimental setup for the airfoil in the wind tunnel is shown in Figure 12. The tether hole in the airfoil is placed over a vertical threaded steel rod and supported by a drill stopper such that it is free to rotate about the rod. The wire leads from the capacitive pressure sensor and the magnetometer are routed out through a hole at the bottom of the wind tunnel.
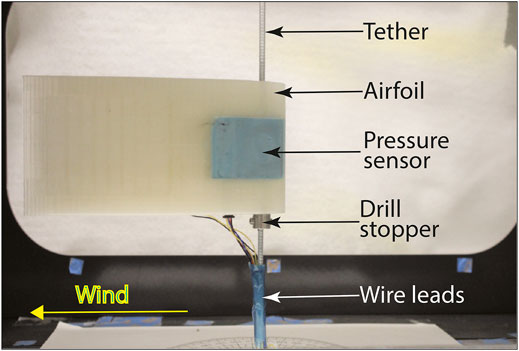
FIGURE 12. Experimental setup to evaluate the airfoil anemometer design in the wind tunnel.
Since the air gap capacitance exhibits a much higher sensitivity compared to the diaphragm capacitance, only the air gap capacitive sensor is utilized for wind speed measurements. The air gap capacitive pressure sensor is interfaced with a BK880 LCR meter for measuring change in capacitance with applied wind speed. The interrogation frequency is chosen to be 100 kHz and the excitation voltage is set at 0.6 V. Typically, the measured initial capacitance is higher than the designed capacitance due to the parasitic capacitance contribution of the wiring and the measurement system Young et al. (2004). A Kelvin probe can be used to suppress parasitic capacitance due to the measurement system, but the parasitic capacitance contribution from the wiring can only be suppressed by utilizing a differential capacitance configuration Lotters et al. (1999). Nevertheless, since only change in capacitance is related to the wind speed, the parasitic capacitance appears as an offset and will not influence the measurement of ΔC.
The experimental characterization of the capacitive pressure sensor for wind speed measurement is conducted with the wind tunnel turned off for 100 s and then turned on for the next 200 s. The applied wind speed is monitored using the manometer connected to the wind tunnel. The airfoil is observed to be at its stable orientation throughout the measurement. The flow is turned off immediately after 300 s and the data is continued to be collected for the next 100 s. The next measurement is taken after the capacitive pressure sensor measurement goes back to its initial value.
5.2.2 Wind Direction Measurement
The second part of characterizing the airfoil anemometer in a wind tunnel involves wind direction measurement using a digital magnetometer. An LSM303AGR breakout board (Adafruit Inc.) is utilized for this purpose. The integrated chip comprises three magnetometers arranged orthogonally to track Earth’s magnetic field in the three corresponding directions. The magnetometer outputs are connected to built-in analog-to-digital converters which digitize the voltage output from the individual magnetometers. The digitized output is transmitted using an Inter-Integrated Circuit (I2C) protocol that is then processed by a micro-controller, such as an Arduino, to obtain the magnetic field in the X, Y, and Z directions. The Earth’s magnetic field intensity always has a component parallel to the magnetic north. Therefore, in its present configuration, assuming zero tilt of the magnetometer, the direction of the airfoil relative to the wind direction (which is relative to Earth’s magnetic north) is given as
where Yh and Zh are the magnetic field in the Y and Z directions, respectively.
Magnetometers are susceptible to disturbances caused by the presence of ferromagnetic elements due to nearby instrumentation and the environment. These hard-iron distortions generate a constant additive field to the Earth’s magnetic field vector and cause a change in the output signal of each magnetometer output Livada et al. (2019). In addition to hard-iron effects, magnetometers are susceptible to soft-iron effects, wherein the distortion in the local magnetic field is caused by nearby magnetizable materials, such as iron or nickel. Further, there exists an angle between magnetic north and true north due to the local direction of the Earth’s magnetic field, called magnetic declination. Therefore, in order to remove and compensate for these errors from the output signal of the magnetometer, a calibration procedure is required. The calibration procedure is performed using standard programs that accompany this device Adafruit SensorLab (2020).
After calibrating the magnetometer, the ability of the airfoil anemometer to measure wind direction is evaluated by orienting it in different initial directions and then subjecting it to airflow in the wind tunnel while recording the magnetic field output from the magnetometer.
6 Test Results
6.1 Static Pressure Chamber Testing of Capacitive Sensor
Mean changes in capacitance measured versus applied pressure for the four tests outlined in Section 5.1 are plotted in Figure 13A. Based on these measurements, the sensitivity is calculated using the line of best fit (LBF) and the nonlinearity is quantified based on the coefficient of determination (R2). These results are summarized for the dual-layer capacitive pressure sensor under sealed and open cavity conditions in Table 3.
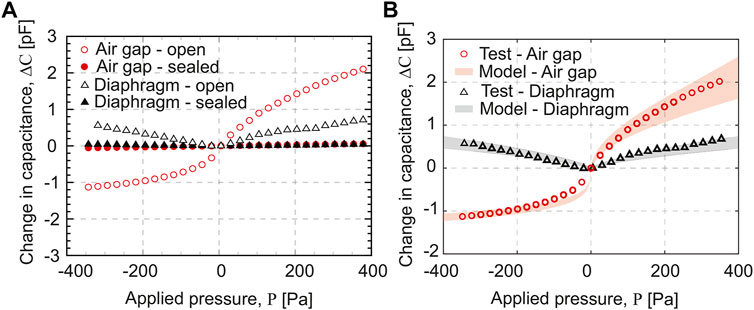
FIGURE 13. (A) Mean changes in air gap capacitance (circles) and diaphragm capacitance (triangles) vs. applied pressure under sealed (solid markers) and open (open markers) cavity conditions, (B) capacitance changes obtained from the measurement vs. model. The shaded regions indicate the change in air gap capacitance (red) and diaphragm capacitance (gray) predicted by the model considering the variation in elastic modulus of commercial PVDF films.
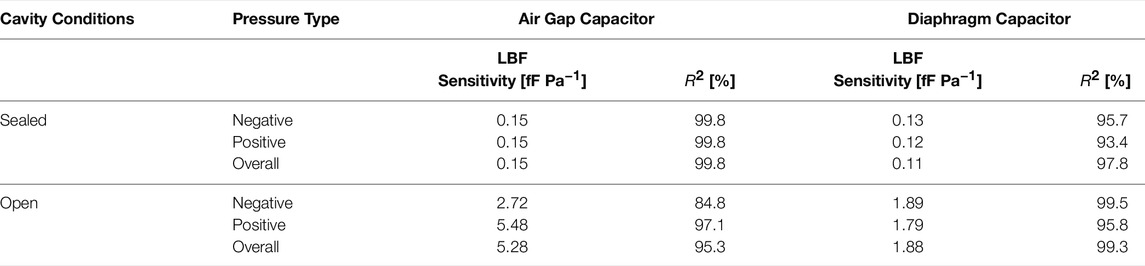
TABLE 3. Measured sensitivities and coefficient of determination (R2) of the dual-layer capacitive sensor under sealed and open cavity conditions Ramanathan et al. (2022).
In order to validate the model, the measured results are plotted against calculations based on the model presented in Section 3. From the measured base capacitance value of 6.33 pF, the actual air gap of the capacitor is calculated to be 350 μm. This increase in the air gap from the designed value of 304 μm is likely due to the expansion of the flexible adhesive after curing Chillara and Dapino (2017). Model validation of the dual-layer capacitive sensor is thus performed using this value as the initial air gap. Per the manufacturer, the elastic modulus of the PVDF layer may range from 2 to 4 GPa due to variability in the processing of PVDF laminae. Therefore, the model predictions are represented by a shaded range on the plot.
6.2 Wind Tunnel Testing of Airfoil Anemometer
6.2.1 Wind Speed Measurement
Following the test procedure outlined in Section 5.2.1, the dynamic response of the capacitive sensor is measured as shown in Figure 14A. The shaded region denotes the time when the wind tunnel is turned on. It can be observed that the capacitive pressure sensor responds sharply with an increase in wind speed and maintains good stability.
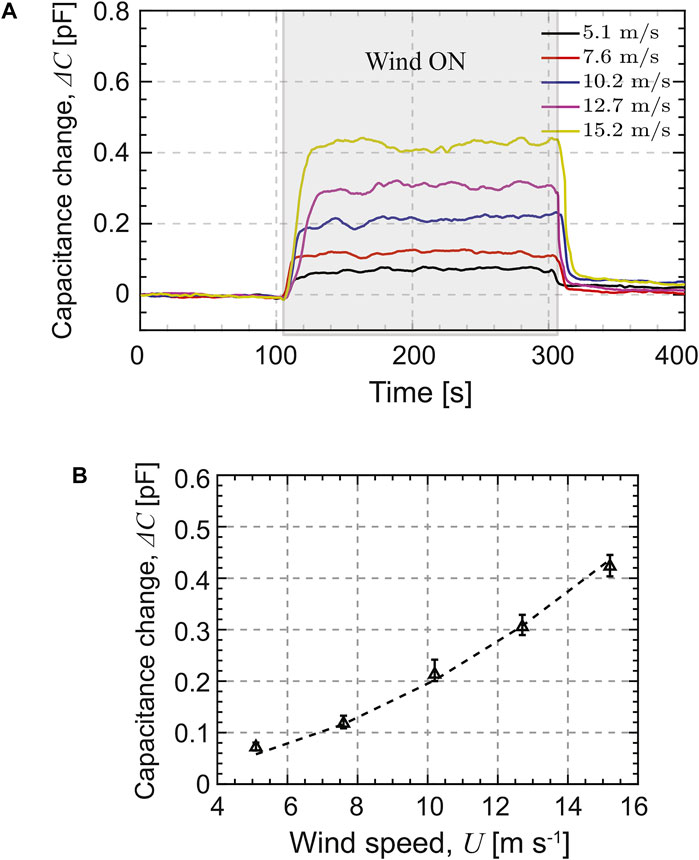
FIGURE 14. Wind tunnel experimental results: (A) dynamic response of the capacitive pressure sensor at different wind speeds. The shaded region indicates when the wind is turned on and (B) mean changes in capacitance with V-340 PDMS (markers) vs. measured wind speed. The dashed line corresponds to a quadratic fit, ΔC = kU2.
Figure 14B shows the average change in capacitance when the wind is on versus the set wind speed as measued by the manometer. As expected from Eq. 2, ΔC in Figure 14B increases quadratically with an increase in the wind speed. The wind speed U can be calculated using the change in capacitance ΔC using the quadratic constant k as
From Figure 14B, the quadratic constant is computed using minimization as k = 1.84 fF m−2 s2. The coefficient of determination (R2) value is calculated to be 99.6%.
6.2.2 Wind Direction Measurement
Wind direction was measured by the integrated digital magnetometer following the procedure described in Section 5.2.2. Figure 15A shows the change in magnetic field in the X, Y, and Z directions before and after the wind is turned on for the different initial orientations #1, #2, and #3 shown in Figure 4A and following the same color scheme. The wind direction is calculated from the measured magnetic fields and plotted in Figure 15B.
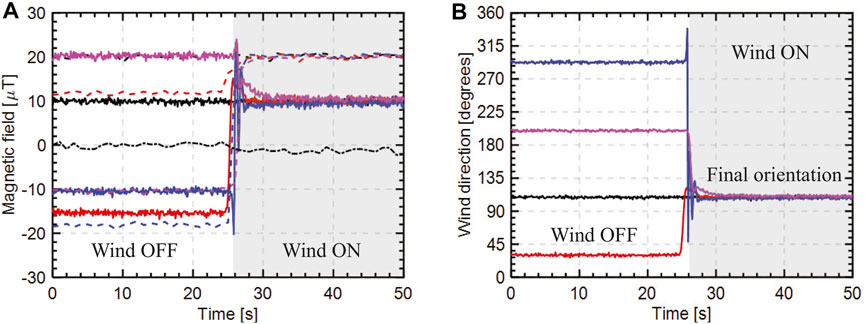
FIGURE 15. Wind direction measurement: (A) change in magnetic field in X (black dot-dashed line), Y (solid lines), and Z (dashed lines) directions. The different colors indicate various initial orientations of the airfoil and (B) wind direction calculated from the change in magnetic field in the Y and Z directions. The shaded region indicates when the wind is turned on.
7 Discussion
7.1 Static Pressure Chamber Testing of Capacitive Sensor
The results in Figure 13 show that sensitivity for the sealed cavity condition is much lower than that for the open cavity. This reason for the low sensitivity with the sealed cavity is that the cavity volume reduces as the diaphragm deflects, thus increasing cavity pressure which provides a greater resistance to further deflection. The change in reference pressure due to diaphragm deflection can be written as Xiong et al. (2020)
where Δpref is the change in reference pressure pref, ΔV is the change in cavity volume, and V is the initial volume of the diaphragm cavity. This equation shows that as initial volume V increases, the effect of the diaphragm deflection on the reference pressure Δpref decreases. In order to ensure that the pressure measurement error is less than 1%, V should be at least 100 times greater than ΔV Xiong et al. (2020). Note that the model presented in Section 3 assumes constant reference pressure, or V = ∞.
Based on these results, it is desirable to capitalize on the high sensitivity of the open cavity pressure sensor to achieve high resolution; however, the sealed cavity pressure sensor exhibits better linearity. Therefore, the reference pressure of the sealed cavity can be adjusted to achieve a targeted balance between sensitivity and linearity.
The sensitivity and nonlinearity of the dual-layer capacitive pressure sensor are summarized in Table 3 for both the sealed and open cavity conditions. These results show that the air gap capacitance has an overall sensitivity of 5.28 fF Pa−1 for the open cavity condition, which is more than 35 times the 0.15 fF Pa−1 sensitivity for the sealed cavity condition, but with more nonlinearity. Under the open cavity conditions, the air gap capacitor also exhibits different sensitivities for positive and negative pressures. However, over the range −50 to 50 Pa, where the air gap sensor is fairly linear, it exhibits a sensitivity of 10.75 fF Pa−1 with an R2 of 99.2%.
The diaphragm capacitive sensor exhibits much better linearity than the air gap capacitive sensor and, despite the low sensitivity, has the design potential for increasing sensitivity through the use of a diaphragm material with a higher dielectric constant. For example, P(VDF-TrFE-CTFE) has an elastic compliance similar to that of PVDF, but with a dielectric constant that is five times higher. If the diaphragm capacitance is used, the air gap capacitance should be used in combination with it in order to distinguish between positive and negative pressures.
Figure 13B shows that the measurement generally agrees with the theoretical calculation. The reasons for discrepancies between the model and experiment, especially at smaller negative pressure values, are suspected to be the compliant boundaries due to the flexible adhesive, fabrication inaccuracies, and the assumption of a perfectly flat diaphragm layer under no load conditions. Nevertheless, the model can be successfully utilized for sensitivity studies to further understand and optimize the design of the dual-layer capacitive sensor.
7.2 Wind Tunnel Testing of Airfoil Anemometer
7.2.1 Wind Speed Measurement
In spite of its good performance as a wind pressure sensor, due to the quadratic relationship, the error in wind speed measurement is high at low wind speeds and low at higher wind speeds. The measurement error in wind speed (δU) due to error in capacitance measurement (δΔC) is given by
Therefore, for the given sensor system, a measurement error of 1 fF in capacitance measurements will result in a 10% error in wind speed measurements at 5 m/s and this error reduces monotonically to 1% at 15 m/s. The measurement error at low wind speeds can be alleviated by increasing the pressure sensitivity of the sensor and increasing the resolution of the instrumentation. Also, after the wind tunnel is turned off, some hysteresis is observed in the measured signal. This is partly due to the viscoelastic nature of the PDMS sealant and also due to the low stiffness of the diaphragm layer. While it will eventually recover and not cause cumulative error, this effect can be greatly reduced by increasing the stiffness of the diaphragm layer, which also reduces the conformability of the sensor, or by reducing the diameter of the diaphragm, which results in reduced sensitivity of the sensor. The reduced pressure sensitivity could be accommodated through advanced signal conditioning electronics capable of resolving down to attofarads Chen et al. (2011). The analytical model described in Section 3 could also be further expanded to include and optimize dynamic performance of the flexible capacitive sensor. Finally, using the model in Section 3, the performance of the capacitive sensor can be further optimized in terms of material and geometric properties based on higher wind speed inputs in practice relative to the wind tunnel.
7.2.2 Wind Direction Measurement
From Figure 15, it can be observed that the variation in magnetic field in the X-direction is negligible owing to the fact that the magnetometer is oriented in the YZ-plane. Therefore, the wind direction is obtained by utilizing the magnetometer data in Y and Z directions only. It can also be observed that the change in magnetic field in the Y-direction is greater than the change in magnetic field in the Z-direction for the same change in wind direction. This is due to the different sensitivities of the different magnetometers within the same integrated circuit. In order to address this, a sensitivity normalization procedure is performed as part of the calibration routine, such that Yh and Zh for a complete rotation of the airfoil is between ±1 normalized units. Figure 15B shows the wind direction calculated from the change in magnetic field after normalizing the sensitivities and accounting for the hard and soft-iron offsets. It can be observed that the different initial orientations of the airfoil converge to a stable unique final orientation within ±2° after the wind is turned on, the demonstrating the wind direction measurement ability of the airfoil anemometer system.
8 Summary
This paper presents an airfoil anemometer for wind speed and direction measurement which provides low aerodynamic drag, low weight, and low power consumption for tethered kites, balloons, and aerial vehicles. Models have been developed and experimentally validated for both diaphragm and air gap capacitive pressure sensors. Static pressure chamber testing showed that the open cavity condition has a sensitivity 35 times higher than the sealed cavity condition, while the sealed condition provides better linearity. However, the reference volume can be designed to provide a desired balance of sensitivity and linearity for a specific application. The diaphragm capacitive sensor provides better linearity but lower sensitivity than the air gap capacitive sensor. There is the potential to improve sensitivity through the design of the diaphragm material, but it would need to be used in combination with an air gap capacitance in order to distinguish between positive and negative pressures.
A dual-layer capacitive sensor was designed and fabricated as part of an airfoil with a sealed chamber having a reference volume more than 300 times the volume of the diaphragm displacement. The airfoil was also designed with a cavity to house a commercial digital magnetometer. As expected, the air gap capacitance increased with the square of wind speed, with the quadratic constant calculated to be k = 1.84 fF m−2 s2. The digital magnetometer showed that the airfoil converged to a stable unique final orientation within ±2° after the wind was turned on.
Data Availability Statement
The raw data supporting the conclusion of this article will be made available by the authors upon request.
Author Contributions
All authors listed have made a substantial, direct, and intellectual contribution to the work and approved it for publication.
Funding
Financial support was provided by the member organizations of the Smart Vehicle Concepts Center, a Phase III National Science Foundation Industry-University Cooperative Research Center (www.SmartVehicleCenter.org) under grant NSF IIP 1738723.
Conflict of Interest
The authors declare that the research was conducted in the absence of any commercial or financial relationships that could be construed as a potential conflict of interest.
Publisher’s Note
All claims expressed in this article are solely those of the authors and do not necessarily represent those of their affiliated organizations, or those of the publisher, the editors and the reviewers. Any product that may be evaluated in this article, or claim that may be made by its manufacturer, is not guaranteed or endorsed by the publisher.
References
Abbott, I., and Von Doenhoff, A. (2012). Theory of Wing Sections: Including a Summary of Airfoil Data. New York, NY: Dover Publications, Inc.
Adafruit SensorLab (2020). Magnetometer Calibration. Available at: https://learn.adafruit.com/adafruit-sensorlab-magnetometer-calibration.
Airfoil Tools (2021). Airfoil Plotter. Available at: http://airfoiltools.com/plotter/index.
Al-Rubaiai, M., Tsuruta, R., Gandhi, U., Wang, C., and Tan, X. (2019). A 3D-Printed Stretchable Strain Sensor for Wind Sensing. Smart Mat. Struct. 28, 084001. doi:10.1088/1361-665x/ab1fa9
An, L., Lu, T., Xu, J., Wang, Z., Xu, M., and Wang, T. (2018). Soft Sensor for Measuring Wind Pressure. Int. J. Mech. Sci. 141, 386–392.
Bian, Y., Liu, R., Huang, X., Hong, J., Huang, H., and Hui, S. (2015). Design and Fabrication of a Metal Core PVDF Fiber for an Air Flow Sensor. Smart Mat. Struct. 24, 105001. doi:10.1088/0964-1726/24/10/105001
Camuffo, D., and Denegri, A. (1976). A Method for Measurement of Mean Wind Direction with the Use of Standard Potentiometric Transducers. Atmos. Environ. (1967) 10, 415. doi:10.1016/0004-6981(76)90012-3
Chen, B., Hu, X., and Sun, H. (2011). Design of Capacitive Differential Pressure Sensor Based on AD7745. Transducer Microsyst. Technol. 6.
Chillara, V. S. C., and Dapino, M. J. (2017). Mechanically-prestressed Bistable Composite Laminates with Weakly Coupled Equilibrium Shapes. Compos. Part B Eng. 111, 251–260. doi:10.1016/j.compositesb.2016.12.011
Cho, L.-H., Lu, C., Zhang, A. P., and Tam, H.-Y. (2013). Fiber Bragg Grating Anemometer with Reduced Pump Power-Dependency. IEEE Phot. Technol. Lett. 25, 2450–2453. doi:10.1109/lpt.2013.2288115
Foss, J. F., Peabody, J. A., Norconk, M. J., and Lawrenz, A. R. (2006). Ambient Temperature and Free Stream Turbulence Effects on the Thermal Transient Anemometer. Meas. Sci. Technol. 17, 2519–2526. doi:10.1088/0957-0233/17/9/020
Gao, S., Yi, Z., Ye, Y., Qin, M., and Huang, Q.-A. (2019). Temperature Effect and its Compensation of a Micromachined 2-D Anemometer. IEEE Sensors J. 19, 5454–5459. doi:10.1109/jsen.2019.2906192
Ghahramani, A., Zhu, M., Przybyla, R. J., Andersen, M. P., Galicia, P. J., Peffer, T. E., et al. (2019). Measuring Air Speed with a Low-Power Mems Ultrasonic Anemometer via Adaptive Phase Tracking. IEEE Sensors J. 19, 8136–8145. doi:10.1109/jsen.2019.2920648
Han, D., Kim, S., and Park, S. (2008). Two-dimensional Ultrasonic Anemometer Using the Directivity Angle of an Ultrasonic Sensor. Microelectron. J. 39, 1195–1199. doi:10.1016/j.mejo.2008.01.090
Igreja, R., and Dias, C. J. (2004). Analytical Evaluation of the Interdigital Electrodes Capacitance for a Multi-Layered Structure. Sensors Actuators A Phys. 112, 291–301. doi:10.1016/j.sna.2004.01.040
Inui, T., Koga, H., Nogi, M., Komoda, N., and Suganuma, K. (2015). A Miniaturized Flexible Antenna Printed on a High Dielectric Constant Nanopaper Composite. Adv. Mat. 27, 1112–1116. doi:10.1002/adma.201404555
Katz, J., and Plotkin, A. (2001). Low-speed Aerodynamics, Vol. 13. Cambridge: Cambridge University Press.
Lackner, M., Rogers, A., and Manwell, J. (2007). “Uncertainty Analysis in Wind Resource Assessment and Wind Energy Production Estimation,” in 45 AIAA Aerospace Sciences Meeting and Exhibit (Reno, NV: AIAA), 1222. doi:10.2514/6.2007-1222
Laflamme, S., Saleem, H. S., Vasan, B. K., Geiger, R. L., Chen, D., Kessler, M. R., et al. (2013). Soft Elastomeric Capacitor Network for Strain Sensing over Large Surfaces. IEEE/ASME Trans. Mechatron. 18, 1647–1654. doi:10.1109/tmech.2013.2283365
Livada, B., Vujić, S., Radić, D., Unkašević, T., and Banjac, Z. (2019). Digital Magnetic Compass Integration with Stationary, Land-Based Electro-Optical Multi-Sensor Surveillance System. Sensors 19, 4331. doi:10.3390/s19194331
Lotters, J. C., Olthuis, W., Veltink, P. H., and Bergveld, P. (1999). A Sensitive Differential Capacitance to Voltage Converter for Sensor Applications. IEEE Trans. Instrum. Meas. 48, 89–96. doi:10.1109/19.755066
Matova, S. P., Makinwa, K. A. A., and Huijsing, J. H. (2003). Compensation of Packaging Asymmetry in a 2-D Wind Sensor. IEEE Sensors J. 3, 761–765. doi:10.1109/jsen.2003.820324
Mo, C., Davidson, J., and Clark, W. W. (2014). Energy Harvesting with Piezoelectric Circular Membrane under Pressure Loading. Smart Mat. Struct. 23, 045005. doi:10.1088/0964-1726/23/4/045005
Moafipoor, S., Grejner-Brzezinska, D., and Toth, C. (2007). “Adaptive Calibration of a Magnetometer Compass for a Personal Navigation System,” in IGNSS Symposium, Sydney, Australia (IGNSS Association Inc.).
Ramanathan, A. K., Headings, L. M., and Dapino, M. J. (2022). “Flexible Piezo-Capacitive Pressure Sensor for Measurement of Wind Speed and Direction,” in Sensors and Smart Structures Technologies for Civil, Mechanical, and Aerospace Systems 2022, Long Beach, CA. Editors D. Zonta, B. Glisic, and Z. Su (International Society for Optics and Photonics), 41–52. doi:10.1117/12.2614329
Sanz-Andrés, Á., Pindado, S., and Sorribes-Palmer, F. (2014). Mathematical Analysis of the Effect of Rotor Geometry on Cup Anemometer Response. ScientificWorldJournal 2014, 537813. doi:10.1155/2014/537813
Shi, T. M., Xie, C. G., Huang, S. M., Williams, R. A., and Beck, M. S. (1991). Capacitance-based Instrumentation for Multi-Interface Level Measurement. Meas. Sci. Technol. 2, 923–933. doi:10.1088/0957-0233/2/10/006
Wang, J., Ding, W., Pan, L., Wu, C., Yu, H., Yang, L., et al. (2018). Self-powered Wind Sensor System for Detecting Wind Speed and Direction Based on a Triboelectric Nanogenerator. ACS Nano 12, 3954–3963. doi:10.1021/acsnano.8b01532
Wang, J., Geng, L., Ding, L., Zhu, H., and Yurchenko, D. (2020). The State-Of-The-Art Review on Energy Harvesting from Flow-Induced Vibrations. Appl. Energy 267, 114902. doi:10.1016/j.apenergy.2020.114902
Wekesa, D., Mutuku, J., and Kamau, J. (2012). Microcontroller-based Data Logging Instrumentation System for Wind Speed and Direction Measurements. J. Agric. Sci. Technol. 14.
Xiong, W., Guo, D., Yang, Z., Zhu, C., and Huang, Y. (2020). Conformable, Programmable and Step-Linear Sensor Array for Large-Range Wind Pressure Measurement on Curved Surface. Sci. China Technol. Sci. 63, 2073–2081. doi:10.1007/s11431-020-1642-4
Young, D. J., Du, J., Zorman, C. A., and Ko, W. H. (2004). High-temperature Single-Crystal 3C-SiC Capacitive Pressure Sensor. IEEE Sensors J. 4, 464–470. doi:10.1109/jsen.2004.830301
Zhenhai Chen, Z., and Luo, R. C. (1998). Design and Implementation of Capacitive Proximity Sensor Using Microelectromechanical Systems Technology. IEEE Trans. Ind. Electron. 45, 886–894. doi:10.1109/41.735332
Keywords: anemometer, wind pressure and direction sensing, capacitive sensor, PVDF, airfoil
Citation: Ramanathan AK, Headings LM and Dapino MJ (2022) Airfoil Anemometer With Integrated Flexible Piezo-Capacitive Pressure Sensor. Front. Mater. 9:904056. doi: 10.3389/fmats.2022.904056
Received: 25 March 2022; Accepted: 06 May 2022;
Published: 06 July 2022.
Edited by:
Weihua Li, University of Wollongong, AustraliaReviewed by:
Tongfei Tian, University of the Sunshine Coast, AustraliaGuolin Yun, University of Cambridge, United Kingdom
Copyright © 2022 Ramanathan, Headings and Dapino. This is an open-access article distributed under the terms of the Creative Commons Attribution License (CC BY). The use, distribution or reproduction in other forums is permitted, provided the original author(s) and the copyright owner(s) are credited and that the original publication in this journal is cited, in accordance with accepted academic practice. No use, distribution or reproduction is permitted which does not comply with these terms.
*Correspondence: Marcelo J. Dapino, dapino.1@osu.edu