Strength Properties and Prediction Model of Cement-Solidified Clay Considering Organic Matter and Curing Temperature
 Yupeng Cao
 Jing Zhang3
 - 1College of Civil Engineering and Architecture, Weifang University, Weifang, China
- 2Key Laboratory of Ministry of Education for Geomechanics and Embankment Engineering, Hohai University, Nanjing, China
- 3Zibo Planning and Information Center, Zibo, China
- 4Geotechnical Research Institute, Yancheng Institute of Technology, Yancheng, China
- 5School of Civil Engineering and Architecture, East China University of Technology, Nanchang, China
- 6Key Laboratory of Ministry of Education for Geomechanics and Embankment Engineering, Hohai University, Nanjing, China
Cement-solidified clay (CSC) is an important filler material in land reclamation projects. Its strength is greatly affected by its organic matter content and curing temperature. This work reports an experimental study of the unconfined compressive strength (UCS) of CSC with respect to its initial water content w, cement incorporation ratio Aw, organic matter content Co, curing temperature T, and curing duration. A model (UCSOT) for predicting the UCS of CSC is established considering the influence of organic matter and curing temperature. A procedure to implement the model is proposed, and the accuracy of the model is verified. The results show that for a given curing duration, UCS decreases with increases in Co and w, and increases with increases in T and Aw. The influence of organic matter on the UCS is greatly affected by Aw, with a threshold of Aw = 15%. High-temperature curing increases the early and ultimate strengths of CSC, and organic matter increases this temperature sensitivity. Multiple regression characterization using cement content, w, and Co as independent control parameters accurately reflects the UCS at the reference temperature. On this basis, the UCSOT model established here considering the influence of organic matter and curing temperature has universal applicability.
Introduction
Abundant silt is deposited in waterways, rivers, lakes, and harbors, and it must be dredged to maintain adequate channel depth, expand storage capacity, and improve water quality (Cao et al., 2019, 2020; 2021a). Dredged silt has high initial contents of water and clay (Cao et al., 2021b) and contains considerable quantities of salts and organic matter (Grubb et al., 2010; Huang et al., 2017; Ying et al., 2021, 2022), resulting in poor dehydration, difficult processing, and high soil lateral pressure (Zhang et al., 2022). A practical and reasonable solution is to improve the physical and mechanical properties of dredged silt through cement solidification, then use the solidified clay to fill structures such as embankments, banks, and artificial islands (Zhang et al., 2020). Examples include artificial island No. 13 at the Central Japan International Airport, the embankment surrounding Tekong Island in Singapore, and the dike in the Songhua River Trunk Canal in northeast China (Kitazume and Satoh, 2003; Tan et al., 2011).
Cement solidified clay (CSC) is used as a filler in construction when the construction speed is fast and there is a large pouring volume; the heat released by cement hydration accumulates in the solidified body, raising the internal solidified temperature of the CSC significantly above the ambient temperature (Zhang et al., 2020). As the on-site curing temperature varies among different regions and by season (Yun et al., 2006), it is necessary to consider the influence of temperature on CSC packing. Relevant studies have shown that temperature can not only affect the mechanical properties of material such as deformation, consolidation, infiltration and migration (Bai et al., 2021a; 2021b), but also greatly increase the strength gain of gelled materials (Zhang et al., 2014). For concrete and mortar, the early strength is usually higher after hotter curing, but the long-term strength will decrease. The Arrhenius equation describes the effect of curing temperature on concrete and mortar, with a hotter curing reaction being faster; the equation does not model any change in the ultimate strength of cementitious materials as the curing temperature changes (Chitambira, 2004). For CSC, it is generally believed that increasing the curing temperature will increase both the early and long-term strengths. Zhang et al. (2014) modified the Arrhenius equation to include a temperature enhancement factor; the modified equation considered both the accelerated reaction rate caused by a higher curing temperature and the influence of temperature on the ultimate strength of cementitious materials. Bi and Chian (2021) proposed a universal method to evaluate the temperature sensitivity of cement-based systems by assuming changes in the reaction mechanism and incorporating the effect of temperature through the Arrhenius equation; the method can standardize the evaluation of strength development in various cementitious materials. However, there is no widely accepted model for predicting the temperature–strength characteristics of CSC. Research on the influence of curing temperature on the development of strength in different cementing materials, especially CSCs, remains rare.
Previous studies of the effect of temperature have focused mainly on concrete materials, granular soil, and fine clay (Chitambira, 2004; Bai et al., 2019, 2022), but few have examined soft clay containing organic matter. Gu et al. (2018) reported silt in a river beach in Shenzhen, China, to contain up to 15.6% organic matter. Du et al. (2020) also highlighted the important influence of organic matter on the development of strength in cement-stabilized clay. Therefore, it is of great practical significance to extend the temperature-dependent strength-development model to consider the solidification of dredged silt containing organic matter.
This paper reports unconfined compressive strength (UCS) tests of CSC with respect to its initial water content w, cement incorporation ratio Aw, organic matter content Co, and curing temperature T. Applying multivariate fitting analysis to the UCS data leads to the development of a model to calculate strength at a reference temperature using w, cement content Cm, and Co as independent control parameters. Introducing the theory describing the effects of temperature then extends the model to predict UCS considering both organic matter and curing temperature. The final model, called UCSOT, and its implementation are put forward here. The proposed model’s accuracy is also verified via comparison with independent data sets reported in the literature to provide a theoretical basis for predicting the strength of solidified silt containing organic matter while considering the influence of temperature.
Laboratory Experiment
Test Materials
The silt tested here is lake sediment that came from the bank of the Huaihe River at Hekou Village, Zhuding Town, Wuhe County, Bengbu City, Anhui Province, China. The silt is gray in the initial state, and the natural water content is 73.9%. The content of organic matter is 3.7% using potassium dichromate method. Dredged silt consists of 4.4% fine sand, 60.5% silt and 35.1% clay, with plastic limit of 26.9% and liquid limit of 58.8%. Under the ASTM D2487 classification, the silt is classified as clay with high liquid limit (ASTM, 2010). The curing agent selected here is Portland blast furnace cement with a slag content of 65%. CaO and SiO2 are the main oxides, with a total content of 79%. The content of MgO in cement is less than 2%. Humic acid powder with a purity of 95% (Jinan Luhui Chemical Co., Ltd., Shandong Province, China) is used as an organic additive.
Sample Preparation and Test Procedure
To analyze the influence of mixing ratio and organic matter content on the evolution of the strength of the CSC, UCS tests with different w, Aw, Co, and curing age t are conducted. The Aw of CSC is 10, 13, 15, and 20%, and the water content of CSC is 1.5wL, 1.75wL, 2.0wL, and 2.25wL (wL is liquid limit of soil), respectively. The selection of each ratio is based on previous work (Zhang et al., 2013). With Aw = 15% cement content and 1.5 wL water content as the benchmark, the method of adding humic acid is used to prepare the silt (Suits et al., 2002). By referring to the organic matter content in the silt of different regions and the solidification tests of the silt containing organic matter (11%, Detzner et al., 1998; 15.6%, Gu et al., 2018; 3.9%, Schmidt et al., 2010; 0–21%, Du et al., 2020), the corresponding organic matter content is determined to be 3.7, 7.7, 10.7, and 13.7%, respectively. The CSC samples are prepared in batches according to the curing temperature. Temperatures of 15, 20, 35, and 45°C are selected with reference to previously studied curing temperatures (10–50°C, Porbaha et al., 2001; 10–25°C, Van Impe and Verastegui Flores, 2006; 10–40°C, Marzano et al., 2009). The curing period of the samples is 3–60 days. After the samples are cured to a specific age (3d, 7d, 14d, 28d, and 60d), they are taken out for the strength test. A total of 640 sample groups are used for the UCS test. Each group have two parallel samples, and the average value of strength is obtained.
The samples are processed as follows. First, calculate the amounts of material for each group according to the test design, then weigh a certain quantity of silt, add pure water to the required content (for samples containing organic matter, humic acid powder is fully mixed with the water in advance), and stir for even mixing. Then, weigh the required quantity of cement, add it to the well-stirred soil–water mixture, and continue mixing for 6–8 min. Pour the evenly mixed soil–cement mixture into a PVC mold in three layers. To eliminate the influence of bubbles, after pouring each layer, vibrate the mold on a vibration table for 30 s. After filling the mold, place it in a standard curing box; remove the sample from the mold after 6 h. In actual land reclamation projects, the fillers solidify underwater, so the samples are cured here in a curing tank. They are removed for UCS testing after a specified duration. Testing is on an YYW-2 (Nanjing Soil Instrument Factory, China) strain controlled UCS tester, and the strain element is measured by a TMR-200 multi-data acquisition system (Bestech, Australia).
Analysis of Experimental Results
Strength Development of Cement-Solidified Clay at the Reference Temperature
Figure 1 shows the variation with Co of the compressive strength qu of the CSC samples after different curing durations; the figure shows decreasing strength with increasing Co at each age. The changing trend can be divided into two stages: for Co between 3.7 and 10.7%, the decreasing trend is linear; for Co > 10.7%, the curve changes little, and the strength tends to a constant value. The strength of CSC with Co = 13.7% is only about 60% of that with Co = 3.7% after curing for 60 days. The observed variation is consistent with the experimental results of Du et al. (2020). The longer the curing age, the more obvious the decreasing trend of strength with changing Co. The ratios of the strengths of samples with Co = 13.7 and 3.7% at 14, 28, and 60 d are 0.88, 0.72, and 0.66, respectively, indicating an increasing influence of organic matter on the strength of CSC with increasing aging. Organic matter reduces the strength of CSC cured for a long duration, mainly because in the alkaline environment of cement hydration, humic acid will exchange ions with calcium, magnesium, iron, aluminum, and other metal ions, resulting in a reduction of OH− in the pores of the solidified soil, making it difficult to activate the pozzolanic reaction (Kipton et al., 1992; Pan et al., 2019).
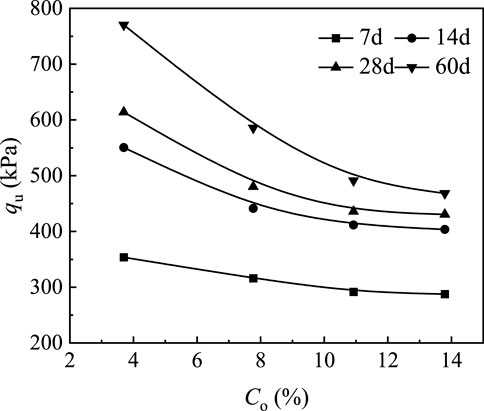
FIGURE 1. Strength qu plotted with respect to organic matter content Co.
Hyperbolic modeling is widely used to describe the change of strength with aging of pure cement solidified soil (Ma, 2017). The hyperbolic model qu = t/(at + b) accurately describes the development of the compressive strength qu of CSC with low cement content during aging for time t. The correlation coefficients are all greater than 0.9 (Figure 2). The strength data in Figure 2 come from tests with Aw = 15% and w = 1.5wL. However, when Aw < 15%, the qu–Aw curve for a CSC sample with Co = 7.7% shows a nonlinear increase, similar to that for a pure cement solidified soil sample (Co = 3.7%), and when Aw > 15%, the qu–Aw curve levels off, as shown in Figure 3. This indicates that when Aw > 15%, the hyperbolic model does not accurately describe the development of strength with age for CSC containing organic matter. Figure 3 also shows that for CSC samples with Co = 7.7%, the variation of qu with w/wL is consistent with that of ordinary CSC (Co = 3.7%); that is, with increasing w, the strength gradually decreases. When w increases, the water distributed in the pores of soil particles and cemented products increase, resulting in the interaction between particle clusters in CSC sample decreases, and the strength decreases.
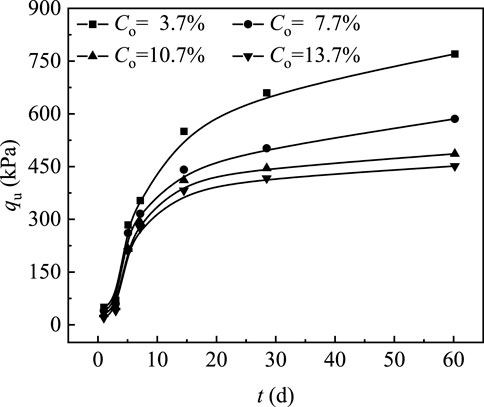
FIGURE 2. Hyperbolic model for different Co values.
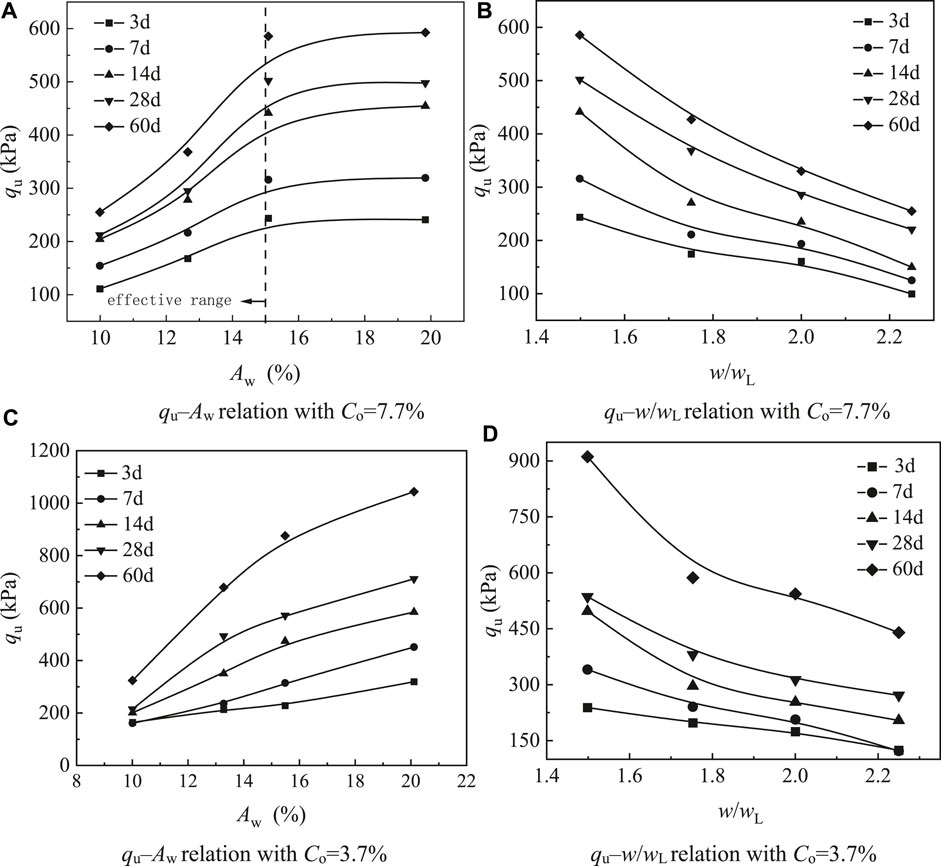
FIGURE 3. Compressive strength qu plotted with respect to cement incorporation ratio Aw and initial water content w. (A) qu–Aw relation with Co = 7.7% (B) qu–w/wL relation with Co = 7.7%. (C) qu–Aw relation with Co=3.7% (D) qu–w/wL relation with Co=3.7%.
Figure 4 plots the development with curing time of the strength of CSC with different Co. The data points represent the measured data. The figure shows similar overall trends for CSC samples with different Co: that is, a rapid early development of strength, which slows later during curing. Therefore, the variation of qu with t for CSC samples with different Co values can be expressed as a function that has a small initial convex surface followed by a long concave surface shape and a platform appearing as t→∞. Referring to an existing strength prediction model (Bi and Chian, 2020), the probability density function of a log-normal distribution (Figure 5) can describe the variation with t of qu for CSC samples with different Co.
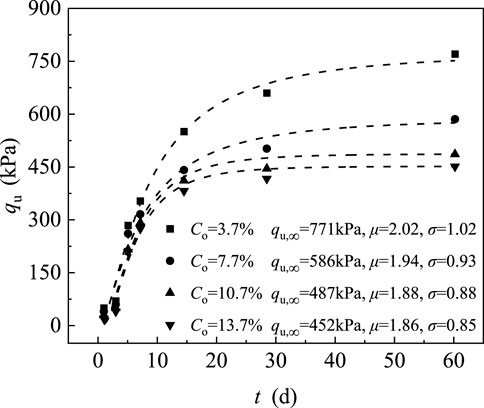
FIGURE 4. Strength models for different Co values (Aw = 15%, w = 1.5wL).
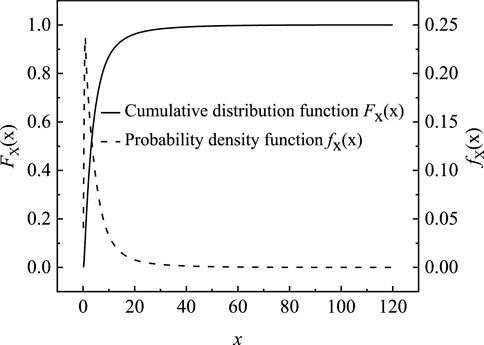
FIGURE 5. Log-normal distribution function [x∈ (0.120), (μ = 1, σ = 1)].
The parameters μ, σ, and qu,∞ in Figure 4 are obtained by fitting the relative strength model under different values of Co. The values of the constants μ and σ are positively correlated with the rate of strength development, and the theoretical ultimate strength of CSC (i.e., qu,∞) depends on the mixing ratio. The figure shows good consistency between the experimental results and the model prediction, with correlation coefficients greater than 0.97. Overall, the relative strength model appears appropriate to predict the strength development of CSC samples.
Modeling the Strength of Cement-Solidified Clay at a Reference Temperature Considering the Influence of Organic Matter
To introduce w, Aw, and Co into the model to calculate the relative strength of samples containing organic matter, the fitting parameters μ, σ, and qu,∞ of CSC with different physical properties are analyzed (Table 1). Note that solidified soil with a high water content and a low cement-incorporation ratio has a relationship between Aw and Cm (defined as the mass of cement added per cubic meter of soil) that varies with w. To eliminate the influence of water content in different mixing ratios on cement content, Aw (%) is converted to Cm (kg/m3), i.e., the Aw values of 10, 13, 15, and 20% respectively become Cm values of 53, 68, 79, and 104 kg/m3 (Table 1). Table 1 shows no significant variation of μ and σ for different values of w, Cm, and Co: their ranges are 1.86–2.03 and 0.85–1.34, respectively, and their mean standard errors are 0.19 and 0.32, respectively. This indicates that μ and σ have a low correlation with the physical properties of the actual data, consistent with the results reported by Bi and Chian (2021). However, qu,∞ varies markedly (with a range of 532 kPa) as the physical properties change (Table 1), with much greater variation than that shown by μ and σ. Therefore, the fitting parameters for qu,∞ have the greatest correlation with the soil properties of CSC, indicating that the soil properties constitute the most important factor affecting the development of qu with t.
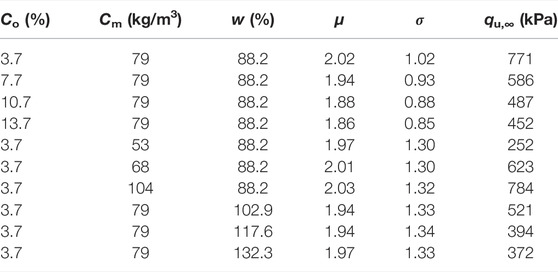
TABLE 1. Strength qu,∞ under different physical properties.
Based on the above analysis, multivariate fitting analysis is conducted on qu,∞ and the indexes for physical property (Table 1) to obtain the relationship between the fitting parameters for qu,∞ and the physical properties:
Combining the probability density function of the log-normal distribution gives.
where t is curing age (in d) and T is curing temperature (in K).
The model to calculate the strength of CSC samples containing organic matter given w, Cm, and Co is thus obtained:
Note that the correlation between fitting parameters for qu,∞ and physical property indexes are obtained from the best selection from among a linear, power, and second-order polynomial function. Fitting for the power and polynomial functions does not converge, while a linear fitting function shows a high correlation coefficient.
To assess the accuracy of the above prediction model, independent data are collected from published literature, and the measured strengths are compared with the corresponding calculated values. As this model is based on CSC samples with high water content and low cement content, the considered mixing ratios should be within the applicable range for CSC (i.e., Aw ≤ 15%, Cm ≤ 79 kg/m3, and Co < 13.7%). In this paper, partial data from literature Du et al. (2020) are collected and verification is carried out based on the data. The verification results are shown in Figure 6. Figure 6A shows the curves of solidified soil samples under different Co values obtained by fitting model. It can be seen that the established model is in good agreement with the actual test data. The verification results in Figure 6B show only a small error between the predicted and measured strength, indicating the applicability of the strength model proposed here to predict the strength of cement-solidified soils with different Co values.
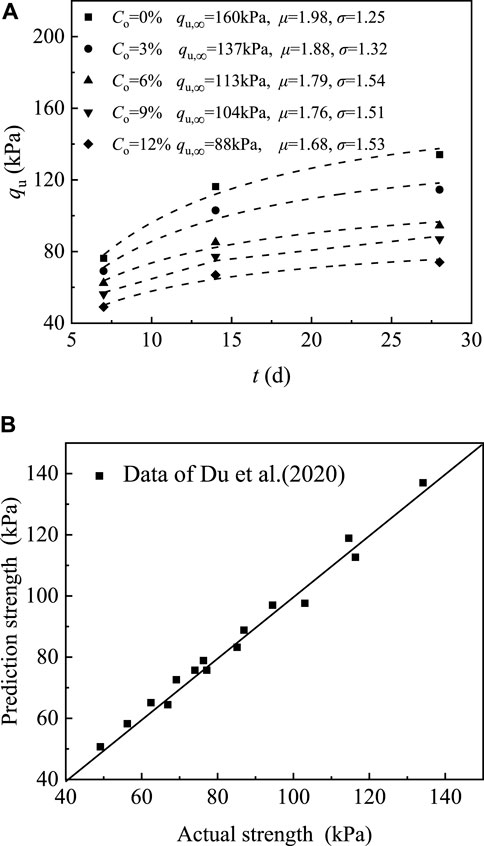
FIGURE 6. Model validation results. (A) Model fitting prediction results. (B) Comparison of measured and calculated strength.
UCSOT Model
Cement-Solidified Clay Strength Characterization Model Considering the Effect of Temperature
Figure 7 plots the development with time of the strength of the CSC samples with different Co values at different temperatures. For a given mixing ratio and curing age, increasing the curing temperature always raises the UCS in both the short- and long-term. The early increase in strength is due to the increase in the polymerization rate of silicate products and the formation of denser gelling products, while the long-term strength increases because high temperature is more conducive to the dissociation of silicate and aluminate, which will allow more Ca (OH)2 to participate in the pozzolanic reaction, resulting in more enhanced products.
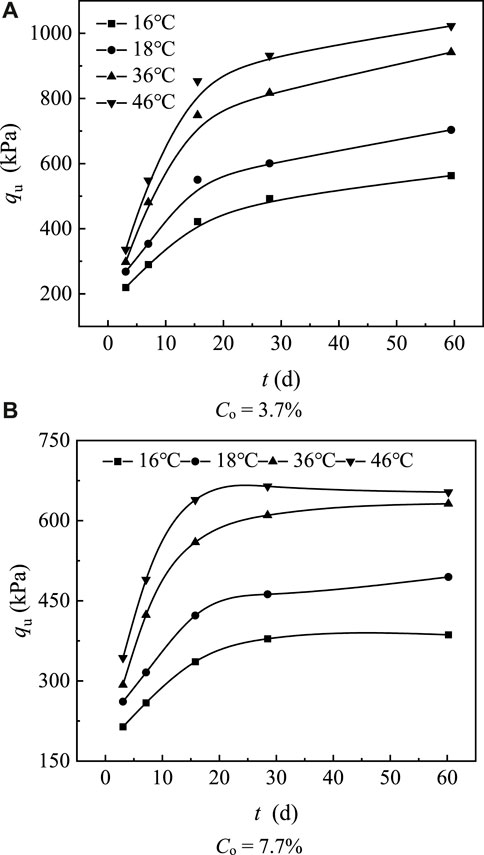
FIGURE 7. Development of strength qu with curing time t for samples with different Co values cured at different temperatures. (A) Co = 3.7% (B) Co = 7.7%.
Modeling Strength Development in Cement-Solidified Clay Samples Cured at Different Temperatures
Existing models assume that the effect of temperature is closely related to the acceleration of the chemical reaction during strength development; they link the temperature and degree of reaction using the Arrhenius equation and maturity theory (Zhang et al., 2014). Accordingly, based on prior research, this paper directly links the curing temperature T with the degree of reaction by considering maturity, and then extends the strength prediction model proposed by Bi and Chian (2021) to a strength–time model for qu,T ∕qu,∞ for any curing temperature T.
Bi and Chian’s (2021) strength prediction model is
tr and tT are the curing time required to reach a certain maturity M at the reference temperature Tr and any curing temperature T, respectively. The relative strength at any temperature T and the reference temperature Tr are DT and Dr, respectively, and are given as follows.
Maturity theory gives maturity M as
where kTr and kT are the rate constants at temperature Tr and T, respectively,
Maturity theory assumes that any CSC samples with the same maturity have the same strength. Considering Eqs 5, 6, this leads to
Both sides of Eq. 9 are cumulative distribution functions of a log-normal distribution, and therefore increase monotonically. The following relationship can be obtained:
Combining this with Eq. 8 gives
Therefore, the model predicting the development relative strength at any curing temperature T is
where qu,T,∞ and μT are the fitting parameters of temperature T; they respectively characterize the theoretical ultimate strength and strength development speed at temperature T. The fitting parameters μr and σr are obtained from the reference temperature Tr, and respectively represent the strength development rate at reference temperature Tr and a fitting constant independent of curing temperature.
Figure 8 plots strength fitting curves for CSC cured at different temperatures obtained from Eq. 13. It shows that the established model agrees well with the actual test data, and thus indicates the model’s appropriateness. Eq. 12 of the temperature model shows a clear linear relationship between the difference of reciprocal temperature (1/T − 1/Tr) and the difference of fitting parameter μ (μT − μr) for any temperature T and the reference temperature Tr. The slope of this relationship is the apparent activation energy. Figure 8 shows that this linear relationship fitted by actual test data is stable and that there is a positive correlation between measured
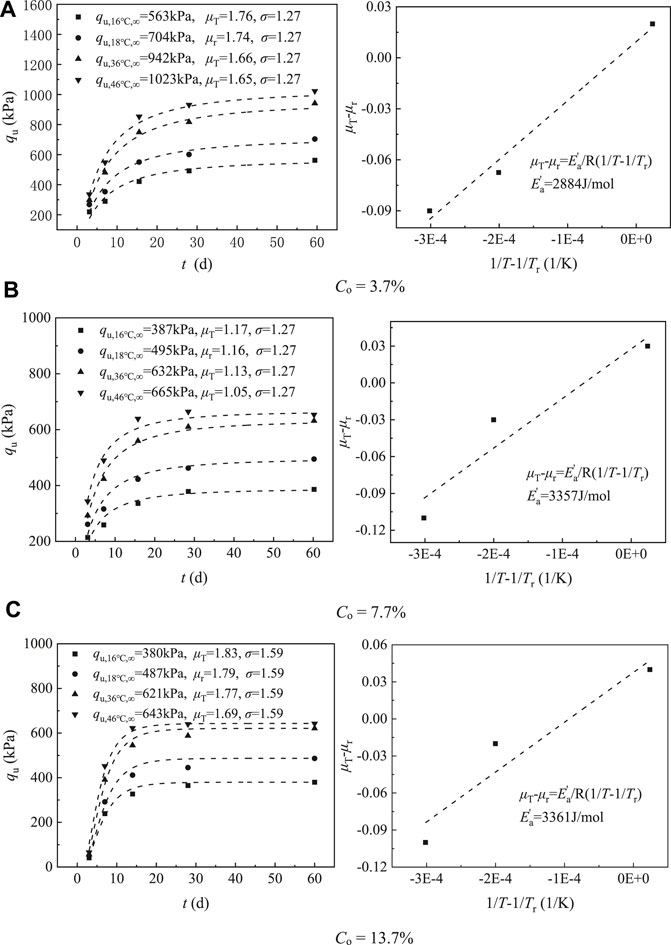
FIGURE 8. Strength development curves of CSC samples affected by temperature. (A) Co = 3.7% (B) Co = 7.7% (C) Co = 13.7%.
The relative theoretical ultimate strength qu,T,∞/qu,Tr,∞ is introduced to establish the relationship between the relative theoretical ultimate strength and the difference of reciprocal temperature (1/T − 1/Tr), as shown in Figure 9. It has a clear linear relationship with 1/T − 1/Tr, which can be expressed as
where A and B are fitting coefficients.
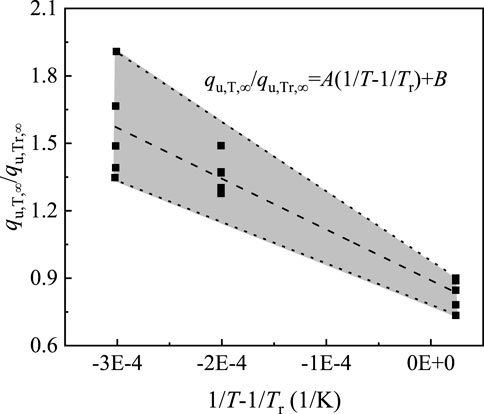
FIGURE 9. Relation between qu,T,∞/qu,Tr,∞ and 1/T − 1/Tr.
Combining Eqs 12, 14 obtains the unconfined compressive strength prediction model for arbitrary curing temperature T based on a reference temperature:
Eq. 15 can predict the strength development of the CSC at any curing temperature (within the relevant range of 15–45°C), given that the relevant parameters qu,Tr,∞ and μr for the sample at the reference temperature are determined in advance according to the selected curing age. As μT − μr and qu,T,∞/qu,Tr,∞ both have a significant linear relationship with the temperature parameters 1/T − 1/Tr, the accuracy of the model’s prediction will be greatly affected by whether the estimation of the relevant parameters at the reference temperature is accurate. For solidified soils with high organic matter content, small differences can lead to large variations. To ensure the stability of the model and decrease the error caused by deviation of the reference temperature parameters, more strength development data for CSC samples containing organic matter at the reference temperature are needed.
The development of strength in CSC samples containing organic matter can be accurately fitted by the cumulative distribution function of the log-normal distribution. The theoretical ultimate strength qu,∞ is linearly correlated with the physical property indexes Co, Cm, and w (Eq. 3). Any lack of data due to errors or omitted tests can be corrected and predicted by the CSC strength calculation model. Therefore, the corresponding temperature model Eq. 15 becomes Eq. 16, which is the UCSOT model for CSC that considers the influences of organic matter and curing temperature:
where a, b, c, and d are linear fitting coefficients for the theoretical ultimate strength qu,Tr,∞ and the physical property indexes Co, Cm, and w at temperature Tr.
Procedure for the UCSOT Model
Based on the established UCSOT model, a methodology to predict the strength development of organic CSC samples at arbitrary temperature T is proposed by revising the method of Zhang et al. (2014).
The sample is prepared from the target material with a representative mixing ratio and cured at a minimum of three temperatures, i.e., the reference temperature and the expected maximum and minimum temperatures. The unconfined compressive strengths of the samples are measured at 3, 7, 14, 28, and 60 d.
1) The theoretical ultimate strength qu,Tr,∞ and the fitting parameter μr at the reference temperature Tr are fitted by the formula
2) The theoretical ultimate strength qu,T,∞ and the fitting parameter μT at the maximum and minimum temperatures are fitted as
3) The difference of the fitting parameters μT − μr and the relative theoretical ultimate strength qu,T,∞/qu,Tr,∞ at the maximum and minimum temperatures are calculated. The corresponding apparent activation energy and ultimate strength parameters A and B are obtained from
4) For different mixing ratios of a given cured material, step (1) is repeated to obtain the theoretical ultimate strength qu,Tr,∞ and μr at the reference temperature. The parameters
Note that the CSC samples must have Co < 13.7%. If Co exceeds this limit, new tests should be carried out to determine the relationship between the theoretical ultimate strength qu,Tr,∞ and the physical properties.
Validation of UCSOT Model
From the data of Zhang et al. (2014), the results for samples DG1 to DG4 are used to calibrate the theoretical ultimate strength qu,Tr,∞ at the reference temperature, and the data for sample DG14 is used to evaluate the accuracy of the temperature–strength model. The considered soils are all Singapore marine soft clay, and the curing agent is slag cement. Figure 10 shows the verification results.
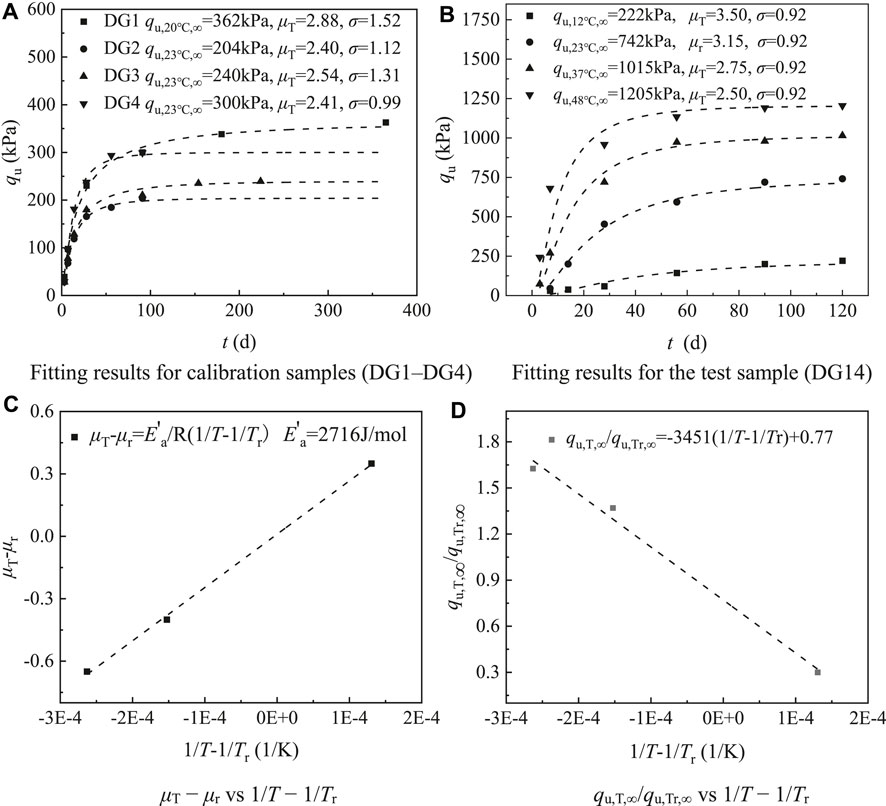
FIGURE 10. Verification of the model using data from Zhang et al. (2014). (A) Fitting results for calibration samples (DG1–DG4) (B) Fitting results for the test sample (DG14) (C) μT−μr vs. 1/T−1/Tr (D) qu,T,∞/qu,Tr,∞ vs. 1/T−1/Tr.
The figure shows that qu,Tr,∞ for DG1 to DG4 is linearly correlated with the physical properties Co, Cm, and w: qu,Tr,∞ = −154.538Co + 18.835Cm − 1.546w + 222.175. Therefore, the theoretical limit of the calibrated strength of DG14 at the reference temperature is 742 kPa. Using this strength to fit the UCSOT model gives predicted results that are in good agreement with the actual data. Plots of 1/T—1/Tr with respect to μT–μr (Figure 10C) and qu,T,∞/qu,Tr,∞ (Figure 10D) obtained from the fitting model are clearly linear. Figure 11 compares the predicted and actual strengths; it shows their consistency, and thus indicates the appropriateness of the UCSOT model proposed here. As the model fully considers the influence of temperature and organic matter on the strength of solidified silt, it is generally applicable in engineering.
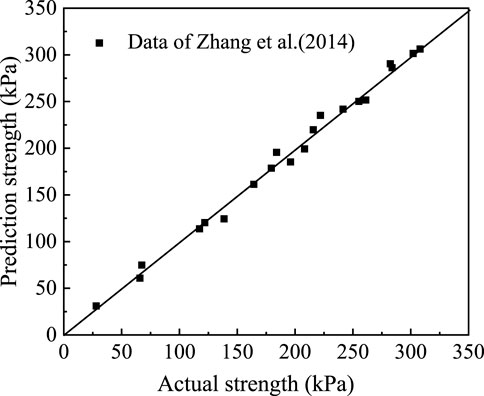
FIGURE 11. Comparison of measured and predicted strengths.
Conclusion
Through a series of laboratory tests, this paper discusses the influence of Aw, Co, w, and T on the qu of CSC. A model characterizing the compressive strength of CSC considering the effects of organic matter and curing temperature is proposed. The accuracy of the model is verified by comparing its predictions with reported experimental data. The main conclusions are as follows.
1) The UCS of CSC decreases with increasing Co (between 3.7 and 13.7%) and w (between 1.5 and 2.25wL) and increases with increasing Aw (between 10 and 20%) and T (between 15 and 45°C). Hotter curing raises both the early and long-term strengths of CSC.
2) Aw greatly affects the influence of organic matter on the UCS of CSC. For Aw > 15%, the UCS does not increase as the cement incorporation ratio increases, and the traditional hyperbolic model cannot accurately predict UCS. The multiple regression model using Cm, w, and Co as independent control parameters can accurately reflect the UCS at the reference temperature.
3) Organic matter increases the temperature sensitivity of CSC samples. A model to characterize strength while considering the influence of organic matter and curing temperature is established. Its predictions fit well the experimental data and the strength data reported in the literature: μT − μr and 1/T − 1/Tr have good linear relationship.
4) A procedure for using the UCSOT model is presented. It easily determines the parameters for the established temperature–strength model, thus allowing prediction of the strength development of CSC at any curing temperature T within the relevant range (15–45°C).
Data Availability Statement
The original contributions presented in the study are included in the article/supplementary material, further inquiries can be directed to the corresponding author.
Author Contributions
YC: conceptualization, methodology, writing—original draft. JZ: investigation, formal analysis, validation. GX: resources. ML: writing—review and editing. XB: methodology.
Funding
This research is supported by the National Natural Science Foundation of China (Grant No. 52178347), project ZR2021ME068 supported by Shandong Provincial Natural Science Foundation, Key Laboratory of Ministry of Education for Geomechanics and Embankment Engineering, Hohai University (Grant No. 2021006), Excellent Doctor Young Teacher Support Program of Weifang University, Scientific Research Foundation of Weifang University (Grant No.2021BS32).
Conflict of Interest
The authors declare that the research was conducted in the absence of any commercial or financial relationships that could be construed as a potential conflict of interest.
Publisher’s Note
All claims expressed in this article are solely those of the authors and do not necessarily represent those of their affiliated organizations, or those of the publisher, the editors and the reviewers. Any product that may be evaluated in this article, or claim that may be made by its manufacturer, is not guaranteed or endorsed by the publisher.
References
ASTM (2010). Standard Practice for Classification of Soils for Engineering Purposes (Unified Soil Classification System). Montgomery County, PA: West Conshohocken. ASTM D2487-10.
Bai, B., Wang, Y., Rao, D. Y., and Bai, F. (2022). The Effective Thermal Conductivity of Unsaturated Porous Media Deduced by Pore-Scale SPH Simulation. Front. Earth Sci 10. doi:10.3389/feart.2022.943853
Bai, B., Nie, Q., Zhang, Y., Wang, X., and Hu, W. (2021a). Cotransport of Heavy Metals and SiO2 Particles at Different Temperatures by Seepage. J. Hydrology 597, 125771. doi:10.1016/j.jhydrol.2020.125771
Bai, B., Yang, G.-c., Li, T., and Yang, G.-s. (2019). A Thermodynamic Constitutive Model with Temperature Effect Based on Particle Rearrangement for Geomaterials. Mech. Mater. 139, 103180. doi:10.1016/j.mechmat.2019.103180
Bai, B., Zhou, R., Cai, G., Hu, W., and Yang, G. (2021b). Coupled Thermo-Hydro-Mechanical Mechanism in View of the Soil Particle Rearrangement of Granular Thermodynamics. Comput. Geotechnics 137 (8), 104272. doi:10.1016/j.compgeo.2021.104272
Bi, J., and Chian, S. C. (2020). Modelling of Three-phase Strength Development of Ordinary Portland Cement- and Portland Blast-Furnace Cement-Stabilised Clay. Géotechnique 70 (1), 80–89. doi:10.1680/jgeot.18.p.087
Bi, J., and Chian, S. C. (2021). Modelling Strength Development of Cement-Stabilised Clay and Clay with Sand Impurity Cured under Varying Temperatures. Bull. Eng. Geol. Environ. 80 (8), 6275–6302. doi:10.1007/s10064-021-02281-8
Cao, Y., Ding, J., Zhang, R., and Xu, G. Z. (2021b). Effect of Vertical Flow on Consolidation Degree of Foundation with Vertical Drains in Large-Strain Consolidation Theory. KSCE J. Civ. Eng. 25 (1), 3264–3272. doi:10.1007/s12205-021-1558-8
Cao, Y., Xu, J., Bian, X., and Xu, G. (2019). Effect of Clogging on Large Strain Consolidation with Prefabricated Vertical Drains by Vacuum Pressure. KSCE J. Civ. Eng. 23 (10), 4190–4200. doi:10.1007/s12205-019-1884-2
Cao, Y., Zhang, J., Xu, J., and Xu, G. (2020). A Large-Strain Vacuum-Assisted Radial Consolidation Model for Dredged Sludge Considering Lateral Deformation. KSCE J. Civ. Eng. 24 (12), 3561–3572. doi:10.1007/s12205-020-1854-8
Cao, Y., Zhang, R., Xu, G., and Xu, J. (2021a). Axisymmetric Large Strain Consolidation by Vertical Drains Considering Well Resistance under Vacuum Pressure. Arab. J. Geosci. 14 (19), 2016. doi:10.1007/s12517-021-08354-y
Chitambira, (2004). Accelerated Ageing of Cement Stabilised/solidified Contaminated Soils with Elevated Temperatures. University of Cambridge.
Detzner, H. D., Schramm, W., Döring, U., and Bode, W. (1998). New Technology of Mechanical Treatment of Dredged Material from Hamburg Harbour. Water Sci. Technol. 37 (6-7), 337–343. doi:10.2166/wst.1998.0770
Du, C., Zhang, J., Yang, G., and Yang, Q. (2020). The Influence of Organic Matter on the Strength Development of Cement-Stabilized Marine Soft Clay. Mar. Georesources Geotechnol. 1 (7), 1–11. doi:10.1080/1064119x.2020.1792593
Grubb, D. G., Chrysochoou, M., Smith, C. J., and Malasavage, N. E. (2010). Stabilized Dredged Material. I: Parametric Study. J. Geotech. Geoenviron. Eng. 136 (8), 1011–1024. doi:10.1061/(asce)gt.1943-5606.0000254
Gu, Z., Hua, S., Zhao, W., Li, S., Gao, Z., and Shan, H. (2018). Using Alkali-Activated Cementitious Materials to Solidify High Organic Matter Content Dredged Sludge as Roadbed Material. Adv. Civ. Eng. 2018 (10), 1–10. doi:10.1155/2018/2152949
Huang, Y., Dong, C., Zhang, C., and Xu, K. (2017). A Dredged Material Solidification Treatment for Fill Soils in East China: A Case History. Mar. Georesources Geotechnol. 35 (6), 865–872. doi:10.1080/1064119x.2016.1257669
Kipton, H., Powell, J., and Town, R. M. (1992). Solubility and Fractionation of Humic Acid; Effect of pH and Ionic Medium. Anal. Chim. Acta 267 (1), 47–54. doi:10.1016/0003-2670(92)85005-q
Kitazume, M., and Satoh, T. (2003). Development of a Pneumatic Flow Mixing Method and its Application to Central Japan International Airport Construction. Proc. Institution Civ. Eng. - Ground Improv. 7 (3), 139–148. doi:10.1680/grim.2003.7.3.139
Ma, C. (2017). Study on High Efficiency Curing Agent for Saturated Soft Soil and Strength Characteristics of Solidified Soil. Shanghai: Shanghai Jiaotong University
Marzano, I. P., Al-Tabbaa, A., and Grisolia, M. (2009). Influence of Curing Temperature on the Strength of Cement-Stabilised Artificial Clays.” in Proceedings of the 2nd International Workshop on Geotechnics of Soft Soils, Glasgow, Scotland, September 03–September 05, 2008, 257–262.
Pan, Y., Rossabi, J., Pan, C., and Xie, X. (2019). Stabilization/solidification Characteristics of Organic Clay Contaminated by Lead when Using Cement. J. Hazard. Mater. 362, 132–139. doi:10.1016/j.jhazmat.2018.09.010
Porbaha, A., Raybaut, J.-L., and Nicholson, P. (2001). State of the Art in Construction Aspects of Deep Mixing Technology. Proc. Institution Civ. Eng. - Ground Improv. 5 (3), 123–140. doi:10.1680/grim.2001.5.3.123
Schmidt, F., Hinrichs, K. U., and Elvert, M. (2010). Sources, Transport, and Partitioning of Organic Matter at a Highly Dynamic Continental Margin. Mar. Chem. 118 (1-2), 37–55. doi:10.1016/j.marchem.2009.10.003
Suits, L. D., Sheahan, T. C., Tan, T. S., Goh T L, , and Yong, K. Y. (2002). Properties of Singapore Marine Clays Improved by Cement Mixing. Geotechnical Test. J. 25 (4), 422–433. doi:10.1520/gtj11295j
Tan, T. S., Lu, Y. T., Phoon, K. K., and Karthikeyan, M. (2011). Innovative Approaches to Land Reclamation in Singapore. Int. Symposium Adv. Ground Technol. Geo-Information, 85–102. doi:10.3850/978-981-07-0188-8_p176
Van Impe, W. F., and Flores, R. D. V. (2006). Deep Mixing in Underwater Conditions: A Laboratory and Field Investigation. Proc. Institution Civ. Eng. - Ground Improv. 10 (1), 15–22. doi:10.1680/grim.2006.10.1.15
Ying, Z., Cui, Y. J., Duc, M., and Benahmed, N. (2022). Effect of Salt Solution on the Optimum Lime Contents of Bentonite and Silt. Acta Geotech., 1–15. doi:10.1007/s11440-022-01488-7
Ying, Z., Cui, Y.-J., Benahmed, N., and Duc, M. (2021). Drying Effect on the Microstructure of Compacted Salted Silt. Géotechnique, 1–9. doi:10.1680/jgeot.20.p.319
Yun, J.-M., Song, Y.-S., Lee, J.-H., and Kim, T.-H. (2006). Strength Characteristics of the Cement-Stabilized Surface Layer in Dredged and Reclaimed Marine Clay, Korea. Mar. Georesources Geotechnol. 24 (1), 29–45. doi:10.1080/10641190600559499
Zhang, J., Li, M., Ke, L., and Yi, J. (2022). Distributions of Lateral Earth Pressure behind Rock-Socketed Circular Diaphragm Walls Considering Radial Deflection. Comput. Geotechnics 143, 104604. doi:10.1016/j.compgeo.2021.104604
Zhang, R. J., Lu, Y. T., Tan, T. S., Phoon, K. K., Asce, F., and Santoso, A. M. (2014). Long-term Effect of Curing Temperature on the Strength Behavior of Cement-Stabilized Clay. J. Geotechnical Geoenvironment Eng. 140 (8), 04014045. doi:10.1061/(asce)gt.1943-5606.0001144
Zhang, R. J., Qiao, Y. Q., Zheng, J. J., and Dong, C. Q. (2020). A Method for Considering Curing Temperature Effect in Mix Proportion Design of Mass Cement-Solidified Mud at High Water Content. Acta Geotech. 16 (12), 1–23. doi:10.1007/s11440-020-00961-5
Keywords: organic matter, curing temperature, unconfined compressive strength, cement solidified clay, prediction model
Citation: Cao Y, Zhang J, Xu G, Li M and Bian X (2022) Strength Properties and Prediction Model of Cement-Solidified Clay Considering Organic Matter and Curing Temperature. Front. Mater. 9:965975. doi: 10.3389/fmats.2022.965975
Received: 10 June 2022; Accepted: 20 June 2022;
Published: 11 July 2022.
Edited by:
Xianze Cui, China Three Gorges University, ChinaReviewed by:
Zi Ying, École des ponts ParisTech (ENPC), FranceJianwen Ding, Southeast University, China
Copyright © 2022 Cao, Zhang, Xu, Li and Bian. This is an open-access article distributed under the terms of the Creative Commons Attribution License (CC BY). The use, distribution or reproduction in other forums is permitted, provided the original author(s) and the copyright owner(s) are credited and that the original publication in this journal is cited, in accordance with accepted academic practice. No use, distribution or reproduction is permitted which does not comply with these terms.
*Correspondence: Yupeng Cao, paradise456917@163.com