Laser ultrasonic time-domain synthetic aperture focusing (SAFT) co-overlay software and hardware (COSH) computing system based on ZYNQ
 Junfu Tan
 Chenyin Ni2*†
 - 1School of Microelectronics, Tianjin University, Tianjin, China
- 2School of Physics, Nanjing University of Science and Technology, Nanjing, China
The application of laser ultrasonic technology to defect detection is being widely studied. The Synthetic Aperture Focusing Techniques (SAFTs) is one of the imaging algorithms for detecting and imaging internal defects. SAFT based on Delay and Sum (DAS-SAFT) is known for high-quality imaging results. However, it has the disadvantages of the large calculation amount, which severely restricts its application. This work proposes a Co-Overlay Software and Hardware method (SAFT-COSH) based on Zynq, which uses parallelism and pipeline technology on FPGA and can efficiently accelerate DAS-SAFT operations. It can be found that the result obtained by the SAFT-COSH method is similar to the original method. Moreover, the time consumption of the SAFT-COSH system is 1/28 of that of the I9-13900KF CPU used for DAS-SAFT calculation. Finally, it was found by analyzing the time consumption of the DAS-SAFT procedure that the time consumption of SAFT-COSH system is short enough to support real-time 3D defect imaging. Characteristics of high efficiency and low cost in the SAFT-COSH method make it applicable in fields that require fast imaging using SAFT-based methods.
1 Introduction
Ultrasonic Testing (UT) including conventional piezo-electric and Laser Ultrasonic (LU) techniques is widely used in aeronautical and space sciences (Abbas et al., 2016), as well as in other industrial fields. The Synthetic Aperture Focusing Technique (SAFT) is one of the imaging algorithms for generating 2D and 3D imaging of defects by synthesizing ultrasonic signals from small aperture transducer(s) using point-by-point scanning (Schickert et al., 2003). This technique can improve the lateral resolution of the imaging results and has a good performance even in the near-field when a conventional piezo-electric transducer being used (Schmitz et al., 2000). Among all SAFT algorithms, the time-domain SAFT algorithm based on Delay and Sum (DAS) (Blouin et al., 1998) is widely used because of its characteristics such as intuition and simplicity in both principle and programming. However, since it needs to traverse all the imaging points in the calculation space many times, it has the disadvantages of the large calculation amount, time-consuming and high cost of calculation platform (Kou et al., 2021), which severely restrict its application in the field of Non-Destructive Testing and Evaluation (NDT&E). It is found that most of the hardware computing architecture of DAS-SAFT chooses traditional CPU for computing (Zhang et al., 2013). This implementation can provide experimenters with flexible parameter definitions and custom data visualization effects. However, the use of traditional CPUs often takes longer calculating time than other architectures at the same cost (Ni et al., 2021).
Field Programmable Gate Array (FPGA) began as Application-specific integrated circuit (ASIC) replacements. It allocates a large amount of hardware resources through user programming and can copy a large number of cores of the same calculation into its internal. Therefore, it can be used to accelerate the calculation when a large number of loop calculations are involved. An FPGA delay calculation algorithm in the ultrasonic synthetic aperture imaging module was introduced (SNikolov et al., 2008). It implemented the square root calculation in the CORDIC algorithm which improved the data processing speed of the processing module. However, the accuracy of the imaging data of the imaging system is low, and the imaging resolution is lower than −86 dB. In this imaging system, the parallel computing structure of FPGA is applied to improve imaging efficiency. The advantage is that the imaging system can perform three-dimensional imaging with a large number of imaging points, and the imaging speed can reach 30 frames per second, but the power consumption is high and the overall structure of the system is too large. Later, an ultrasonic synthetic aperture imaging algorithm acceleration module based on OpenCL language was reported (Amaro et al., 2015). The FPGA development tools used by it have higher performance, the frame rate for 128-element can reach 40 fps. Then the parallel FPGA was used to design, and VHDL language was used to achieve a fast processing parallel architecture and got a better imaging result (Njiki et al., 2016).
It can be seen that the speed of DAS-SAFT can be significantly improved by using FPGA computing architecture. However, the series parameters of the computing core inside the hardware are fixed. The flexibility of the system is compromised. Aiming to these problems, a SAFT-COSH system for high-speed DAS-SAFT calculation with high flexibility is proposed in this paper using the ZYNQ hardware architecture (FPGA & CPU). After one laser ultrasonic A-SCAN signal is obtained, based on the characteristics of the ZYNQ architecture, we first calculate the contribution of a laser ultrasonic signal on the FPGA and then superimpose all calculated laser ultrasonic signals on the ARM part so as to realize the efficient collaborative calculation of the combination of software and hardware. We compared the computing time of the SAFT algorithm on different platforms and technologies such as Mathematical calculation software and Fortran on the CPU, GPU, and the SAFT-COSH technology. The SAFT-COSH method is the fastest, 1.96 times faster than the GPU method and 28 times faster than the CPU method.
2 Materials and method
As mentioned before, the fundamental SAFT algorithm used in this paper is based on the concept of Delay and Sum (DAS). The principle of this approach can be found in literature such as (Blouin et al., 1998). Before the SAFT calculation, one LU scan is carried out using the experimental setup described in (Ni et al., 2021) in an aluminum sample. The sample used in this paper is an aluminum block with a dimension of 200 × 30 × 8 mm3 (length × width × height). On the side of the sample, a transverse perforation at a depth h = 4 mm with a diameter of w = 0.8 mm and a length of k = 10 mm is obtained using a micro-drill (Ni et al., 2021). By following the experiment procedure presented in (Ni et al., 2021), one A-SCAN signal are obtained, pre-processed, and transferred to the SAFT-COSH system for post-processing and DAS-SAFT calculation. It is worth mentioning that the velocity of the shear mode ultrasound is 3,179 m/s (Ni et al., 2021).
To obtain the final superimposed DAS-SAFT imaging constructed by M sets of A-SCAN signals obtained experimentally at different locations on the sample surface, it is necessary to perform the summation of their contributions in the three-dimensional imaging space under the premise of considering the spatial positions of all LU A-SCAN signals. The signal amplitude corresponding to the corresponding time point in the A-SCAN signal represents the contribution of the set of A-SCAN signals at the position of the three-dimensional imaging space. Traversing the contribution of all A-SCAN signals in the entire three-dimensional imaging space in turn by using the following expression, the final superimposed DAS-SAFT imaging can be obtained:
In the Eq.(1), I (x3d, y3d, z3d) is the amplitude of the defect signal at a certain point (x3d, y3d, z3d) in the entire three-dimensional space. where Ii(x3d, y3d, z3d) is the defect contribution generated by the i − th group of A-SCAN signal expressed in Eq. 3.
In the Eq. 2,
2.1 Introduction to SAFT-COSH system
The SAFT-COSH system is designed with two main components in ZYNQ: the Processing System (PS) and the Programmable Logic (PL), as depicted by the gray and pink areas in Figure 1, respectively. Blue and red arrows in the figure represent data input and data output flow, respectively. The PS part is a system on dual-core ARM Cortex-A9 processors. In this study, the LU data interface module, data post-processing module and DAS-SAFT overlay controller module are built in this part. The PL part is a Field Programmable Gate Array (FPGA). Within this side, the DAS-SAFT accelerated computing core module is implemented, performing DAS-SAFT operation on one A-SCAN signal. The high-speed implementation of the entire system relies on the DAS-SAFT accelerated computing core within the FPGA’s PL part. Subsequently, several optimizations are performed on the FPGA’s computing core to further enhance its performance.
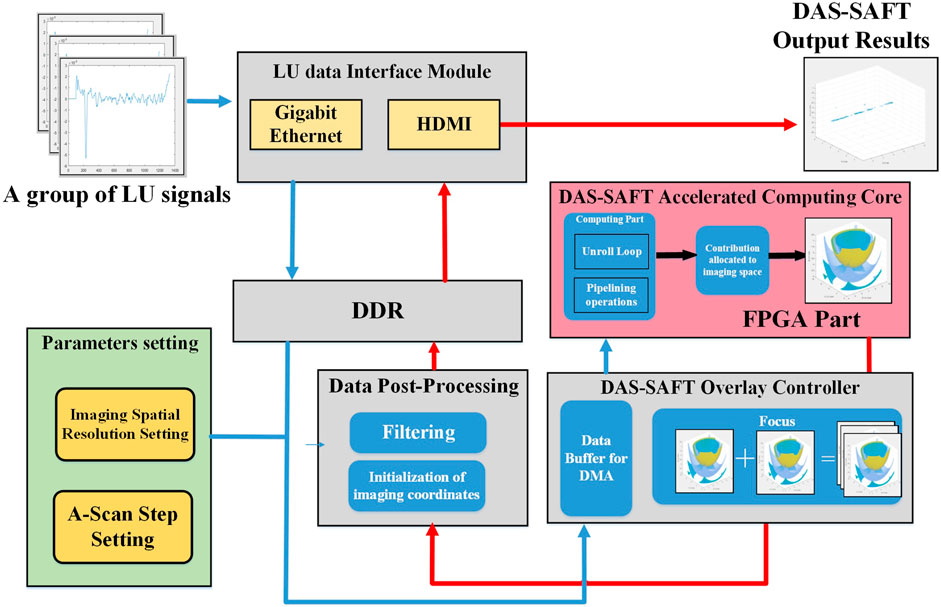
FIGURE 1. SAFT-COSH system architecture.
After one LU signal is collected by the Gigabit Ethernet port, and then be analyzed in the driver on the Linux system based on ARM Cortex-A9 and finally transferred to the DDR memory and then transmitted to the DAS-SAFT Overlay Controller. Meanwhile, the parameters such as the imaging spatial resolution and the step length of the detection scan should be input. They will be stored in the Data Buffer, waiting for the call of the controller to be transferred to the FPGA via DMA sequentially. The DAS-SAFT accelerated computing core module is mainly composed of two parts: the first part is the core computing part which is based on the parallel DAS-SAFT algorithm through loop unrolling and pipeline technology to fully utilize most of the FPGA resources to achieve the goal of completing calculations at high speed; the second part is to convert the calculated contribution into the data structure of the three-dimensional imaging space via parameters from upper module. The result is then transferred to the DAS-SAFT overlay controller module, where the focus unit realizes the focusing process of one A-SCAN signal under the correct timing. The overlaid data is sent to the data post-processing module for the final filtering processing and later imaging output via the LU data interface module with an HDMI device.
2.1.1 Core calculation process on ZYNQ
In synthetic aperture imaging, a large amount of data needs to be processed, which consumes a lot of time. To solve this problem, an FPGA-based parallel pipeline accelerated DAS-SAFT algorithm can be designed because the FPGA is a programmable logic device. However, on a low-cost FPGA, resources such as BRAM and LUTs are limited. Therefore, it is difficult to cache high-resolution synthetic aperture focus data on a FPGA with limited resources, which makes the algorithm difficult to implement on low-cost FPGAs. In response to this problem, this article adopts the ZYNQ (ARM + FPGA) architecture. The contribution of one A-SCAN ultrasonic signal to the entire imaging space is calculated on the FPGA (PL part), then the superposition of all signals in the imaging space is realized on the ARM (PS part). By adopting a hardware design pattern on FPGA, a large number of DAS-SAFT core calculations can be performed in parallel. At the same time, the software design mode adopted on the ARM core can superimpose the results after FPGA calculation. Therefore, high-performance computing can be realized in a cooperative way of software and hardware and the three-dimensional imaging of ultrasonic synthetic aperture focusing can be realized on low-cost hardware, and the system flow chart is shown in Figure 2.
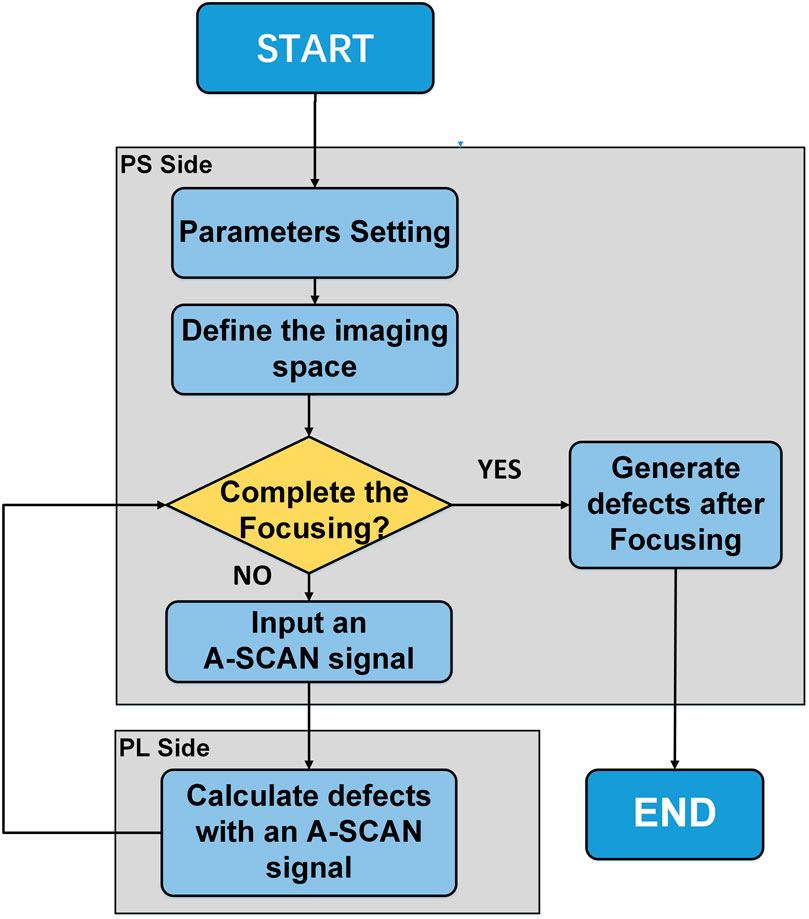
FIGURE 2. DAS-SAFT 3D imaging algorithm flow on ZYNQ.
2.1.2 Implementation of loop unrolling on FPGA
Loop unrolling is one of the main approaches used to realize powerful parallel computing capabilities. In our case, effectively unfolding the multiple nested loops in the DAS-SAFT algorithm in FPGA can greatly improve the time delay stacking of the DAS-SAFT calculation. In the DAS-SAFT algorithm presented in this paper, each set of ultrasonic signals must be nested looped three times in the 3-D imaging space. By expanding this nested loop using the loop unrolling approach, both calculation time and system throughput can be further reduced/improved. The principle of the loop unrolling is shown in Figure 3.In the Figure 3, Sa,b represents the a − th 3D imaging space point’s b − th operation. For n points in 3D imaging space and each contains m sub-operations, the total calculations are expressed as n × m. When the loop is not unrolled as shown in Figure 3A, the system needs to process n points one by one. In this case within FPGA, certain calculation resource blocks containing onboard resources such as DSP, BRAM, and LUT will be allocated for the calculation of one point. To demonstrate the effect of the loop unrolling, suppose that n is 32,768 (corresponding to the resolution 32 × 32 × 32), all loop calculations are completed in this allocated area in sequence. When a half-scale loop unrolling is applied as indicated by Figure 3B, the system processes 16,384 points at one time. This will increase the calculation resource allocated in the FPGA. When all loops are fully unrolled as shown in Figure 3C, the system processes 32,768 points at one time. It means that the full unrolling requires the largest number of resources in FPGA, but the number of loops can be reduced to a minimum. Based on the principle presented above, it can be seen that to achieve this optimization, the onboard resource occupancy rate on the FPGA increases as the scale of the loop unrolling. In the three-dimensional imaging algorithm of synthetic aperture focusing, a three-fold nested loop will be unrolled. However due to the limited resources on an FPGA board, especially which has higher cost effectiveness, the full unrolling cannot be achieved. In this case, the loop unrolling scale should be analyzed and selected by experiments.
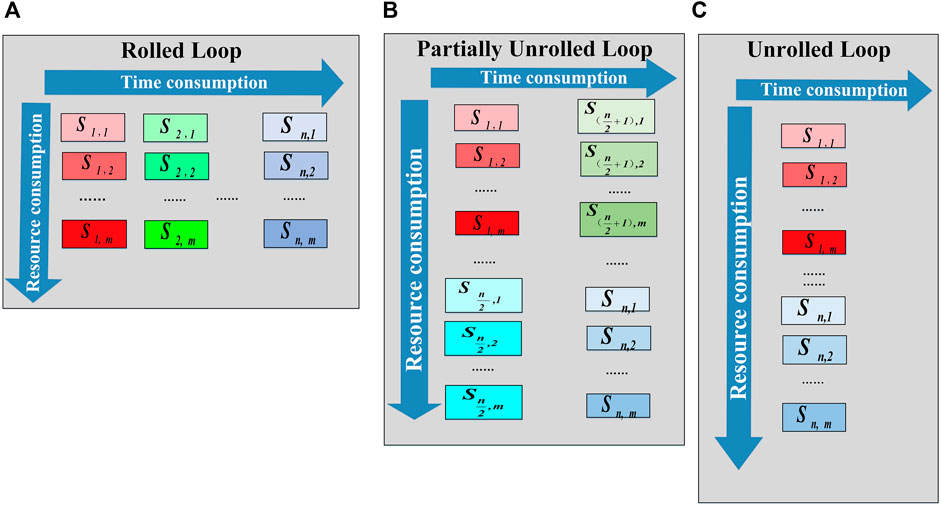
FIGURE 3. (A) shows the principle of Rolled Loop, n loops are performed in sequence. (B) shows the principle of Partially Unrolled Loop, the all loops are unrolled in only two loops. (C) shows the principle of Unrolled Loop, the all loops are unrolled in only one loop.
2.1.3 Implementation of pipeline design
Loop unrolling is optimization from the perspective of points. In order to make greater use of the parallelism of FPGA, we use pipeline technology to optimize from the perspective of sub-operations. As shown in the Figure 4, we have n points that need to be operated and the operation of each point consists of m sub-operations. When we start doing S1 − 2, the calculation circuit used for S1 − 1 can be used for the S2 − 1 operation at the next point. When S1 − n is calculated, S2 − (n − 1) has been calculated for the second point, so only S2 − n needs to be calculated to complete the calculation of the second point. When S2 − n is calculated, S3 − (n − 1) has been calculated for the third point, so only S3 − n needs to be calculated to complete the calculation of the third point. By analogy, we can get the following time-consuming analysis.
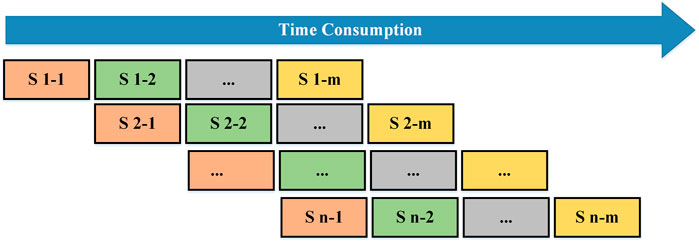
FIGURE 4. Pipelining calculation.
The consumed time Tori for n imaging points without using pipeline technology can be expressed as Eq. 4:
In the formula, m is the number of sub-operations in a point, and Δt is the average time consumption of each sub-process. The variable n refers to the number of 3D points in the imaging space that need to be calculated.
On the other hand, the consumed time Tp under the same condition using pipeline technology can be expressed as Eq. 5:
Therefore, the speedup ratio of the two methods S can be expressed as Eq. 6:
It can be seen that when n is large, the speedup is approximately equal to m.
3 Results
3.1 3-D imaging results
By using the DAS-SAFT algorithm described in (Blouin et al., 1998), the final superimposed result of 420 signals at the three-dimensional imaging with a resolution of 128 × 128 × 128 is shown in Figures 5A,B, respectively.
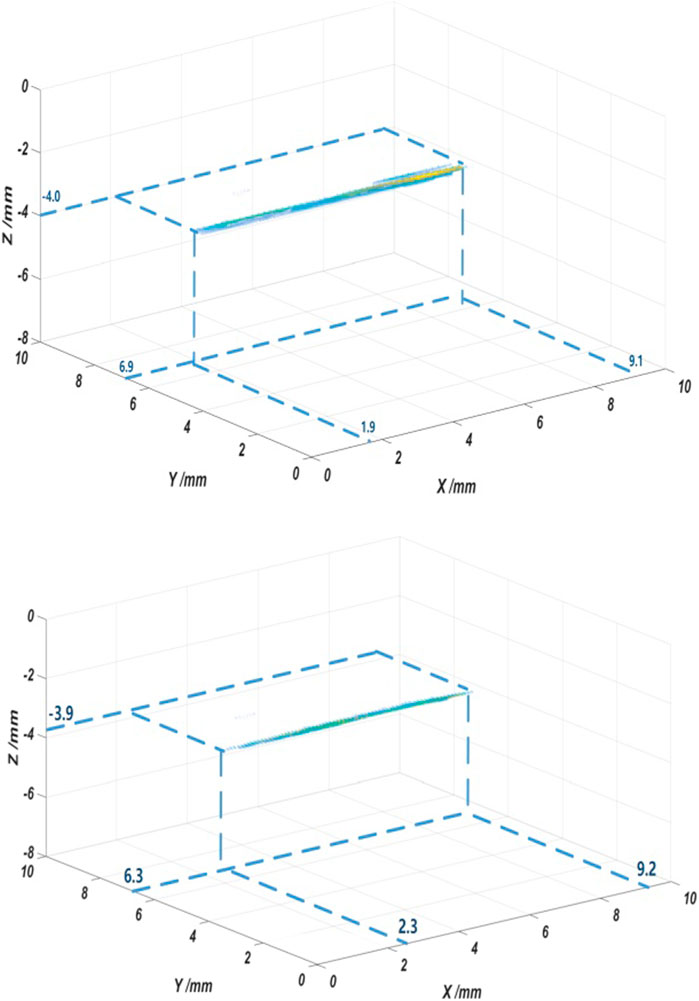
FIGURE 5. Calculated three-dimensional imaging of (A) the final superimposed result using ZYNQ; (B) the final superimposed result using a workstation.
Figure 5A shows the calculation results of the defect using ZYNQ. The calculation result of the same defect using a workstation is shown in Figure 5B as a reference. In both Figures 5A,B, signals represent the detected defects, and they are presented by filtering all values below 0.5 of the maxima of the calculated data. By comparing Figures 5A,B, it can be seen that the locations of the defects are similar. This shows that the calculated results by SAFT-COSH agree well with other verified platforms, therefore, the correctness of the proposed architecture is verified. The slight difference between the two figures in locations and shape of the detect signals is due to the impact of the floating-point number accuracy in the FPGA hardware circuit when BRAM resources on low-cost FPGAs are limited. It would cause the data after the filtering mentioned before (0.5 of the maxima of the calculated data) slightly different. This problem could be overcome by using a ZYNQ chip with a larger total number of resources to improve the accuracy of the data in the operation.
3.2 Algorithm optimization result analysis
As mentioned before, the DAS-SAFT algorithm is extremely computationally intensive. The impact of both optimizations (loop unrolling and pipeline) on the time consumption of the algorithm is studied. When the timing is correctly constrained, the execution of loop unrolling and pipeline will not bring errors to the overall calculation. The main factor that affects the accuracy of the result is the number of digits in the floating-point number. Due to the limited resources on the FPGA, floating-point numbers above 32 bits cannot be used for calculations. This has a certain impact on the results as we mentioned before. But from the optimization strategy, there will be no errors.
Table 1 shows the time consumption comparison using the same single A-SCAN signal with and without unrolling loop optimization at various resolutions. Note that the pipeline optimization is not involved. It can be seen in Table 1 that at all resolutions, the consumption with the unrolling loop is significantly reduced by more than 15 times. In the speedup ratio defined by Eq. 6, it can be seen that the larger the calculation, the higher the speedup ratio.
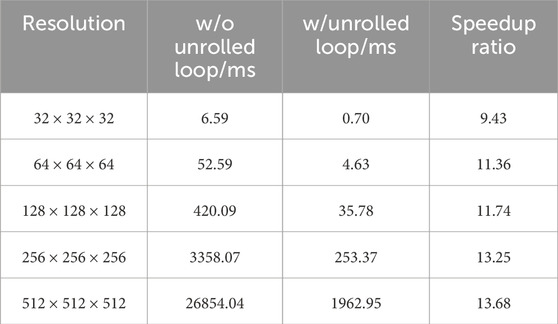
TABLE 1. Comparison of time consumption with and without loop unrolling at various resolutions.
Table 2 shows the time consumption comparison using the same single A-SCAN signal with and without pipeline optimization and loop unrolling. The reason for not analyzing pipeline optimization separately is because in ZYNQ when the loop is pipelined, all loops in the following hierarchical structure will be automatically unrolled to achieve pipeline operation. It can be seen in Table 2 that in all resolutions, the consumption with both optimizations is significantly reduced by more than a hundred times. In the speedup ratio defined by Eq. 6 can be seen that the larger the calculation, the higher the speedup ratio.
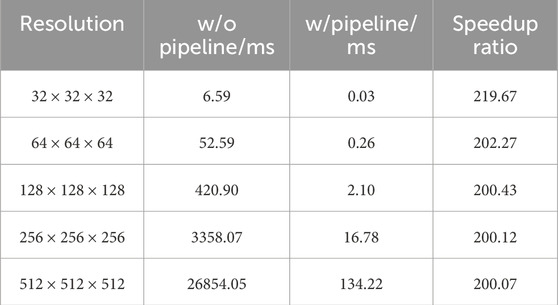
TABLE 2. Comparison of the time consumption with and without pipeline and loop unrolling optimization for the calculation of one A-SCAN signal.
The above is the time consumption for one A-SCAN signal. For multiple A-SCAN signals obtained during a SAFT scan measurement, the calculation time increase linearly with the number of A-SCAN signals without any additional delays.
Using pipeline and loop expansion to accelerate DAS-SAFT of an A-SCAN signal for imaging spaces at different resolutions, the relationship between resolution and imaging speed can be obtained, as shown in Figure 5. It can be seen from Figure 5 that when the resolution is greater than 128 × 128 × 128, due to the limitation of FPGA resources, that is, the parallelism of the hardware, the imaging frame rate tends to be stable.
3.3 Performance comparison
To compare the performance of the same algorithm achieved using different platforms, the DAS-SAFT algorithm is adapted and the same LU A-SCAN signals as well as parameters are used. Results at a resolution of 256 × 256 × 256 are obtained and shown in Figure 6.
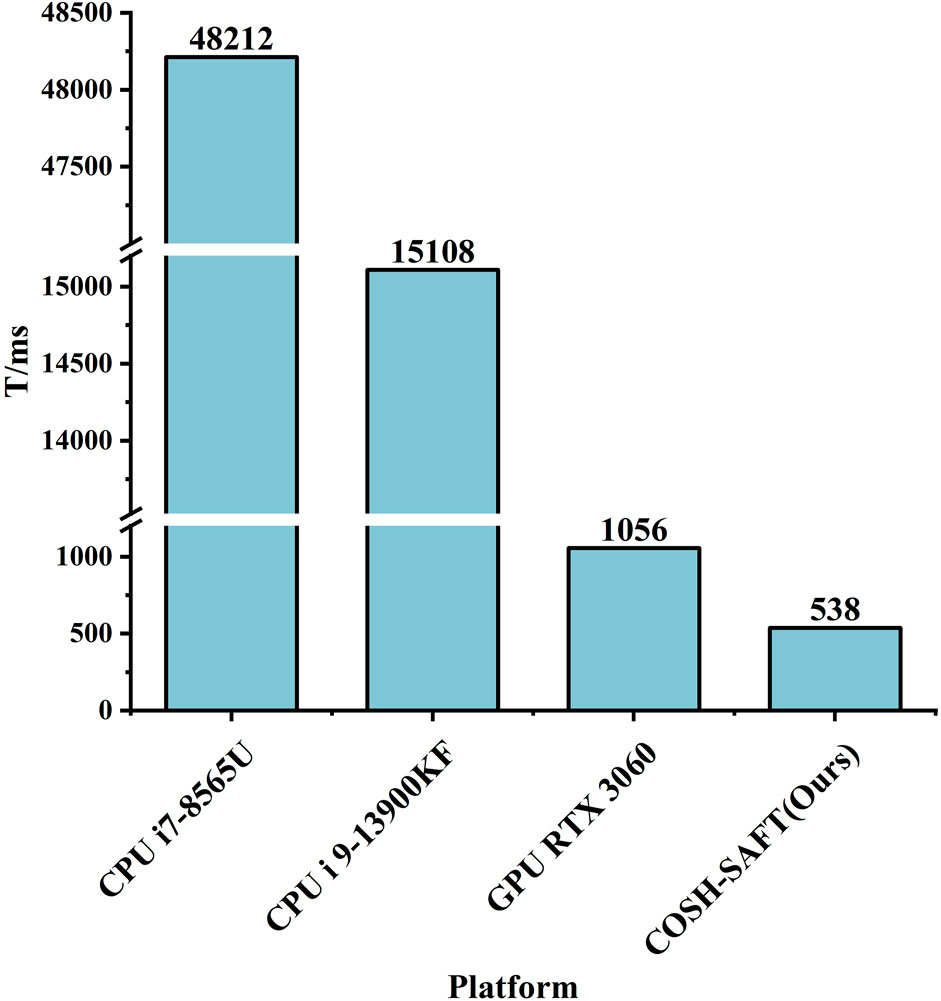
FIGURE 6. Comparison of various equipment imaging performance.
In the comparison, the platforms using the following software and hardware are considered:
1. Mathematical calculation software programming with an Intel® CoreTM i7-8565U CPU;
2. Mathematical calculation software programming with an Intel® CoreTM i9-13900KF CPU;
3. Mathematical calculation software and hardware CUDA programming with a GPU, NVIDIA GeForce® RTXTM 3060 12GB;
4. SAFT-COSH technology on ZYNQ (AMD Xilinx® ZYNQ-7000TM XC7Z020CLG400-2).
In Figure 6, the vertical axis represents the time consumption. It can be seen that the SAFT-COSH method proposed in this paper listed on the right side of the figure has the least time consumption of 538 ms among all platforms employed running the DAS-SAFT algorithm. The proposed approach combining software and hardware is 196% faster than the second fastest approach, and about 90 times faster than the original approach using Mathematical calculation software and a PC with an i7 8-core CPU.
When data comes to on-chip memory, which is essential to reduce the latency in SAFT, ZYNQs result in significantly higher computer capability. The high amount of on-chip cache memory reduces the memory bottlenecks associated with external memory access as well as the power and costs of a high memory bandwidth solution. The main reason for GPUs being power-hungry is that they require additional complexity around their compute resources to facilitate software programmability. The reconfigurability of ZYNQs in addition to the software development stack of main vendors provides much higher efficiency for a large number of end applications and workloads.
3.4 Real-time feasibility of SAFT-COSH 3D imaging
We like to point out that we use 20 fps or 0.05 s per frame as the indicator of real-time imaging. At the same time, the real-time imaging capability we describe refers to the ability to calculate the contribution of a single ultrasound A-SCAN signal to a three-dimensional imaging space within 0.05 s, instead of obtaining the superimposed imaging calculated by the entire group of ultrasound A-SCAN signals within 0.05 s.
It has been demonstrated in the previous section that by using the SAFT-COSH method, the calculation time for one A-SCAN signal at a resolution of 32 × 32 × 32 can be accelerated to 0.03 ms, or 0.26 ms at a resolution of 64 × 64 × 64. As shown in the Figure 7, when resolution less than 256 × 256 × 256 it’s frame rate is higher than 60. Therefore, it has the potential ability to be used in real-time imaging with a frame rate of more than 20 fps. However, to have a full understanding of the time consumption of the SAFT-COSH 3D imaging process, the data acquisition time including the time consumption of LUT (the time consumed for obtaining LU signals and that in mechanical/optical scanning), and the time spent on data transferring and hardware communications/responses should also be considered. It needs to be pointed out that in our case, limited by the mechanical translation state and the repetition rate of the pulsed laser for excitation, the time consumption for obtaining LU signals is 0.5 s per point. Therefore, it is not realistic to discuss real-time imaging using the time consumption of the current experimental setup. However, this high time consumption can be improved by using all-optical scanning using a pulsed laser with a higher repetition rate (Joh et al., 2021). In a time serial of a SAFT-COSH process, the sum of time consumption of LUT and the time spent on data transferring and hardware communications/responses are denoted as T1. Because the time consumption for data transferring and hardware communications/responses are fixed and normally short (in our case,
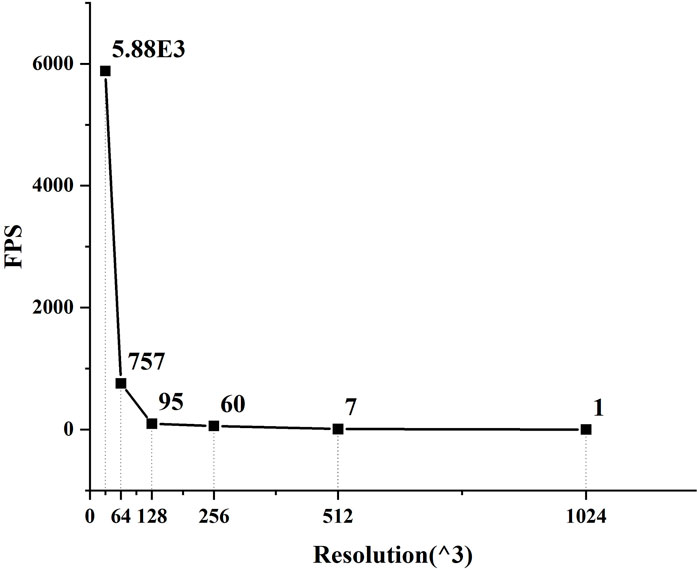
FIGURE 7. Variation in frame rate versus resolution.
Once the FPGA is powered on and programmed, its internal circuit as an ASIC remains stable until powered off. The LUTs of the Logic Blocks in the FPGA will be configured to the configuration shown in the circuit result of the corresponding design at power-up. Of course, operating frequency, temperature, design complexity, and resource utilization will all have an impact on circuit dynamics. But the SAFT-COSH system designed in this article works at 100 MHz and the resource occupancy rate is below 30% on average, which has very little impact on the circuit. The circuit will always work unless the power is turned off or reset again. These factors ensure the stability of SAFT calculation on ZYNQ.
4 Perspectives for further development
Thanks to a wealth of IO interfaces of the SAFT-COSH system, which can be connected to oscilloscopes, translation tables, data acquisition cards, and other peripherals. It is possible to connect and control the complete experimental hardware including optic components, translation mechanics, data acquisition devices, core calculations components, as well as results display devices, using a single board. However, so far, there is still a problem of driver incompatibility. This is mainly due to the relatively new architecture of the system and the failure of various hardware manufacturers to follow up in time. In future work, researchers can compile their own drivers to achieve the above functions, or wait for the manufacturer to release the driver. At present, the work of this system still requires a computer to input data. When the above-mentioned driving problems are solved, a single board can complete all the work.
In addition to loop unrolling and pipeline technology, multi-threading technology can also be used to accelerate DAS-SAFT. Divide the 3D imaging space into multiple 3D sub-blocks, and call multiple threads on the PS side to independently complete the superposition operation of each 3D sub-block. Design the DAS-SAFT circuit of multiple sub-blocks on the FPGA, and send it to the PS after completing the operation The corresponding sub-threads cooperate to complete the overlay operation. At the same time, optimizing the algorithm such as filtering to efficiently reduce the number of A-SCAN groups to be calculated can also speed up the entire DAS-SAFT imaging.
Besides the application in DAS-SAFT, the SAFT-COSH system can be extended to F-SAFT. With its potential ability in real-time imaging, it could find its applications in related fields such as ultrasonic testing and photoacoustic imaging.
5 Conclusion
The SAFT-COSH system based on ZYNQ was proposed in this paper. The FPGA in ZYNQ provides the hardware foundation for the high-speed computing capability of the entire system, and the ARM core in the PS part provides an embedded environment for the entire system. At the same time, the SAFT-COSH system uses the combination of hardware and software of ARM and FPGA to realize the high-speed calculation of SAFT. Optimizations such as loop unrolling and pipeline parallelism were considered to further improve the performance of the SAFT-COSH system.
Then, to verify the feasibility of the system, a LU scanning experimental setup was built and a total of 420 scans on a defected aluminum sample was achieved. By comparing the calculation time consumption using the SAFT-COSH system and those with other approaches using the same DAS-SAFT algorithm on different hardware platforms, it is found that the SAFT-COSH system has the least time consumption among all. Furthermore, the performance of the proposed system was compared with other approaches found in other literature. It is found that by considering only the average time per pixel, the SAFT-COSH system is slower than those in some of the works reported by other groups. However, if the price of the system and the thermal design power consumptions were considered, the comprehensive performance of the SAFT-COSH method would be better than all other groups.
Finally, the real-time feasibility of SAFT-COSH 3D imaging was studied. It is found that the calculation time of the SAFT-COSH system is short enough to support the realization of real-time 3D imaging if a fast-scanning system is employed.
Data availability statement
The raw data supporting the conclusion of this article will be made available by the authors, without undue reservation.
Author contributions
JT: Writing–review and editing. CN: Supervision, Writing–original draft, Writing–review and editing. CW: Writing–review and editing. KY: Writing–review and editing. LD: Writing–review and editing. ZS: Writing–review and editing.
Funding
The author(s) declare financial support was received for the research, authorship, and/or publication of this article. This work was supported by the National Natural Science Foundation of China [61975080, 11974186], the Natural Science Foundation of Jiangsu Province (No. BK20200070), and the Postgraduate Research and Practice Innovation Program of Jiangsu Province and “the Fundamental Research Funds for the Central Universities”, No. 2023203002.
Conflict of interest
The authors declare that the research was conducted in the absence of any commercial or financial relationships that could be construed as a potential conflict of interest.
Publisher’s note
All claims expressed in this article are solely those of the authors and do not necessarily represent those of their affiliated organizations, or those of the publisher, the editors and the reviewers. Any product that may be evaluated in this article, or claim that may be made by its manufacturer, is not guaranteed or endorsed by the publisher.
References
Abbas, J., Lee, S. H., and Kim, Z. (2016). Fpga-based design and implementation of data acquisition and real-time processing for laser ultrasound propagation. Int. J. Aeronautical Space Sci. 17, 467–475. doi:10.5139/IJASS.2016.17.4.467
Amaro, J., Yiu, B. Y., Falcao, G., Gomes, M., and Yu, A. C. (2015). Software-based high-level synthesis design of fpga beamformers for synthetic aperture imaging. IEEE Trans. Ultrasonics, Ferroelectr. Freq. Control 62, 862–870. doi:10.1109/TUFFC.2014.006938
Blouin, A., Lévesque, D., Néron, C., Enguehard, F., Drolet, D., and Monchalin, J.-P. (1998). Saft data processing applied to laser-ultrasonic inspection. Rev. Prog. Quantitative Nondestruct. Eval. 611, 611–617. doi:10.1007/978-1-4615-5339-7_79
Joh, J., Choi, Y., and Lee, J. (2021). Reverberation-based high-speed guided-wave ultrasonic propagation imager for structural inspection of thick composites. Compos. Struct. 259, 113446. doi:10.1016/j.compstruct.2020.113446
Kou, X., Pei, C., Liu, T., Wu, S., Liu, T., and Chen, Z. (2021). Noncontact testing and imaging of internal defects with a new laser-ultrasonic saft method. Appl. Acoust. 178, 107956. doi:10.1016/j.apacoust.2021.107956
Ni, C. Y., Chen, C., Shen, Z.-H., Dai, L. N., Yuan, L., Kan, W. W., et al. (2021). Non-destructive laser-ultrasonic synthetic aperture focusing technique (saft) for 3d visualization of defects. Photoacoustics 22, 100248. doi:10.1016/j.pacs.2021.100248
Njiki, M., Elouardi, A., Bouaziz, S., Casula, O., and Roy, O. (2016). A multi-fpga architecture-based real-time tfm ultrasound imaging. J. Real-Time Image Process. 16, 505–521. doi:10.1007/s11554-016-0563-5
Schickert, M., Krause, M., and Muller, W. (2003). Ultrasonic imaging of concrete elements using reconstruction by synthetic aperture focusing technique. J. Mater. Civ. Eng. 15, 235–246. doi:10.1061/(asce)0899-1561(2003)15:3(235)
Schmitz, V., Chakhlov, S., and Müller, W. (2000). Experiences with synthetic aperture focusing technique in the field. Ultrasonics 38, 731–738. doi:10.1016/S0041-624X(99)00219-X
Snikolov, S., Jensen, J., and Tomov, B. (2008). Fast parametric beamformer for synthetic aperture imaging. IEEE Trans. Ultrasonics, Ferroelectr. Freq. Control 55, 1755–1767. doi:10.1109/TUFFC.2008.860
Keywords: SAFT, FPGA, pipeline, loop unrolling, Zynq, non-destructive evaluation (NDE), laser ultrasonics
Citation: Tan J, Ni C, Wu C, Ying K, Dai L and Shen Z (2024) Laser ultrasonic time-domain synthetic aperture focusing (SAFT) co-overlay software and hardware (COSH) computing system based on ZYNQ. Front. Mater. 10:1283151. doi: 10.3389/fmats.2023.1283151
Received: 25 August 2023; Accepted: 15 December 2023;
Published: 25 January 2024.
Edited by:
Cuixiang Pei, Xi’an Jiaotong University, ChinaReviewed by:
Zhongbing Luo, Dalian University of Technology, ChinaXiaodong Xu, Nanjing University, China
Kamran Avanaki, University of Illinois Chicago, United States
Copyright © 2024 Tan, Ni, Wu, Ying, Dai and Shen. This is an open-access article distributed under the terms of the Creative Commons Attribution License (CC BY). The use, distribution or reproduction in other forums is permitted, provided the original author(s) and the copyright owner(s) are credited and that the original publication in this journal is cited, in accordance with accepted academic practice. No use, distribution or reproduction is permitted which does not comply with these terms.
*Correspondence: Chenyin Ni, chenyin.ni@njust.edu.cn
†These authors have contributed equally to this work and share first authorship