 Fangjia Liu1,2
 Zijun Liao
- 1School of Mechanical Engineering, University of Science and Technology Beijing, Beijing, China
- 2Shunde Innovation School, University of Science and Technology Beijing, Foshan, Guangdong, China
- 3Beijing General Research Institute of Mining and Metallurgy, Beijing, China
- 4National Key Laboratory of Intelligent Optimization Manufacturing for Mining and Metallurgy Process, Beijing, China
- 5School of Electronic Information and Communications, Huazhong University of Science and Technology, Wuhan, China
- 6National Engineering Technology Research Center of Flat Rolling Equipment, University of Science and Technology Beijing, Beijing, China
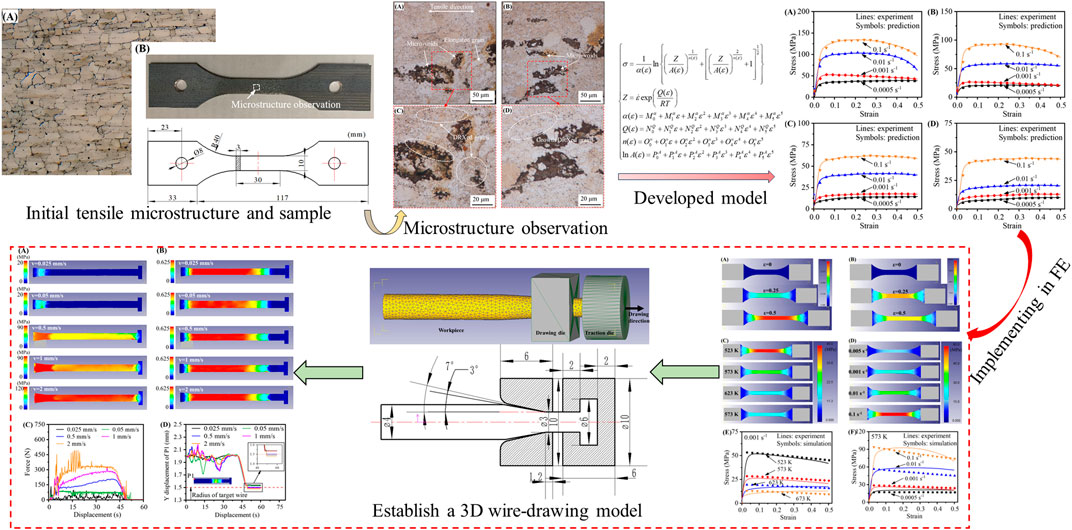
In this work, the hot deformation behavior and microstructure evolution of ZK60 alloy are investigated. Meanwhile, constructive models and hot processing maps of ZK60 alloy during thermal tension are also established. Toward these ends, thermal tensile tests were performed at elevated deformation temperatures (523 K–673 K) and wide-ranging strain rates (0.0005
Highlights
a) A comprehensive understanding involving the thermal deformation of ZK60 alloy during hot tensile.
b) Arrhenius model coupled strain effect and PSO-SVM regression model are developed.
c) The developed model is implemented in the FE software and the wire-drawing process of ZK60 alloy is simulated.
1 Introduction
For ZK60 magnesium alloy is commonly employed in medical implants, aerospace components, and chemical equipment applications because of excellent biocompatibility and high strength (Wang et al., 2018; Wu C. L. et al., 2021; Liu et al., 2022). Since magnesium alloy is a metal with a hexagonal structure and limited formability and ductility at room temperature, the alloy mainly adopts a hot forming process (Chen et al., 2020; Duley et al., 2021; Cao et al., 2022), and the material’s flow characteristics during the hot forming process are highly intricate. The hardening and softening mechanisms of ZK60 alloy are influenced by thermal mechanical parameters like working temperature and strain rate (Zhang et al., 2020; Guo et al., 2022). Therefore, the first step in implementing a successful forming process is to investigate the hot processing characteristics of ZK60 alloy and comprehend the impact of thermomechanical processing on the microstructure.
Up to now, many researchers have developed constitutive models for hot deformation of Mg alloys, revealing in detail the flow behavior of materials under various deformation conditions (Hadadzadeh and Wells, 2017; Zhu et al., 2017; Fang et al., 2022; Yang et al., 2022; Xia et al., 2023; Hu et al., 2024). The phenomenological constitutive models including Johnson-Cook (JC), Arrhenius, Zerilli-Armstrong (ZA) and Field-Backofen (FB) etc., have been used widely for magnesium alloys. These models incorporate, to varying degrees, the interactions of strain rate, temperature, and the phenomena of strain hardening or softening. Gao and Luo (2013) developed the constitutive model of the compression process of Mg–2Zn–0.4Mn–0.2Ce, calculated the activation energy of thermal working, and revealed the thermal deformation behavior and softening mechanism of the alloy in detail. Wei et al. (2015) found that both the Ludwik and Zener-Hollomon models exhibit favorable agreement between the computed stress and the measured stress within a limited strain range while the modified Hensel-Spittel equation is capable of characterizing the entire deformation process at the studied deformation temperature. Wu et al. (2010) developed the Arrhenius equation and accurately predicted the flow stress of ZK21 alloy. Also, they obtained optimized processing intervals through coupling the influence of microstructure. Raghunath et al. (2011), Mei et al. (2018) and Wang et al. (2022) established constitutive equations by incorporating Zener-Hollomon parameters to account for the impacts of temperature, strain, and strain rate. These investigations primarily center on characterizing peak stress, determining deformation activation energy, and formulating constitutive equations for magnesium alloys. Based on a broad spectrum of experimental data, the prediction accuracy of these models is relatively high. Furthermore, it is imperative to investigate deformation behavior and formulate more accurate models within an extended processing range with a limited dataset. In order to obtain more accurate results, machine learning (ML) techniques are introduced and compared with traditional root data (Zou et al., 2021; Kazi et al., 2022; Huang et al., 2023). The machine learning model can create an appropriate relationship between input and output variables. Sani (Sani et al., 2018) developed the Artificial Neural Network (ANN) model of Mg-Al alloy and found that a well-trained neural network is more accurate than constitutive equations in predicting hot flow behavior. Meanwhile, the ANN model also be established in Mg-3Sn-1Mn alloy and can predict the hot deformation behavior of the alloy coupled with twinning effect (Li et al., 2023). Wu J. et al. (2021) used neural networks to predict the residual stress, microhardness and ultimate tensile strength of FGH4095 alloy. Zou et al. (2021) successfully predicted the high strength and ductility of Titanium alloys using the Support Vector Machine (SVM) method. Xiong et al. (2023) introduced a ML-inspired Gaussian process regression (GPR) model to the stress prediction process of FGH alloys and found that the model has better generalization ability than Sellars. The microstructure evolution and hot processing characteristics of alloys are closely related. Yang et al. (2023) reported that in the Mg-9Li-1Zn alloy, the grain size with the increase of strain rate, and decreased first and then increased with the increase of deformation temperature. In addition, the soft mechanism of the alloy is DRX. Yuan et al. (2023) indicated that the increase in working temperature is beneficial to the DRX of Mg-12Y–1Al alloy. The alloy’s DRX mechanism primarily encompasses discontinuous dynamic recrystallization (DDRX) and continuous dynamic recrystallization (CDRX), with DDRX being the predominant mechanism.
The application of Mg-wire is extensive across various fields, attributed to its lightweight nature, high strength, and superior mechanical properties. In the field of medical devices, Mg alloy finds application in the production of bone implants and surgical instruments, benefiting from its excellent biocompatibility (Fu et al., 2020; Ali et al., 2023; Cheng et al., 2023). Additionally, in the electronics industry, its favorable conductivity and lightweight properties make it suitable for manufacturing conductive wires, connectors, and electronic components (He et al., 2022). In the context of preparing wires from Mg and Mg-based alloys, the primary emphasis is placed on cold drawing and hot drawing methods. Sun et al. (2022) reported a study on Mg-Gd alloy and revealed exceptional super-formability (∼165% in accumulative true strain) through multiple-pass cold drawing at room temperature. Simultaneously, the microstructural evolution of nanocrystals plays a pivotal role in attaining exceptional tensile deformation capabilities. In addition, they also performed multiple passes of cold drawing on the Mg-2wt%Zn alloy until the cumulative true strain reached 91%, highlighting the excellent drawing deformation ability of the alloy at ambient temperature (Sun et al., 2017). Moreover, they elucidated the texture formation process, where the texture component ultimately transitioned from the extruded basal texture to the typical ⟨10–10⟩ fiber texture in the drawing direction. Although cold-drawn materials have high strength and considerable ductility, these improvements often require a large number of annealing processes and mold assistance, which prolongs the wire preparation cycle and increases energy consumption (Chen et al., 2017; Xie et al., 2021; Gao et al., 2022). The Mg-wire, produced through a hot drawing method, demonstrates high processing efficiency and excellent ductility (Seitz et al., 2011). Milenin et al. (2020) investigated the hot drawing method for Mg-Ca alloy, revealing that decreasing Ca content reduces biocorrosion rate. The elevating drawing temperature exacerbates biocorrosion while improving ductility and diminishing strength. Utilizing hot drawing technology, Zuo et al. (2022) obtained Mg-0.8Al-0.1Ca-0.6Mn alloy wire with a tensile yield strength of 394 MPa and ultimate tensile strength of 431 MPa. This exceptional strength is attributed to its distinctive grain structure, ultrafine dynamic recrystallization grains, nanoprecipitates, and solute segregation. However, the practical data applicable to wire-drawing from ZK60 alloy in the literature are missing.
Although previous researchers have conducted extensive in-depth research on the thermal processing characteristics and microstructure evolution of magnesium alloys, research on the deformation behavior, constitutive description, and microstructure evolution of the ZK60 alloy is insufficient. Hence, the thermal deformation behavior of the ZK60 alloy was systematically investigated, and two constitutive models based on phenomenology and machine learning, as well as a thermal processing map, were established. In the prediction of flow stress, the PSO-SVM model outperforms the Arrhenius model. The developed PSO-SVM model shows excellent predictive power and good generalization ability. Additionally, the thermal deformation stable region of the studied alloy was determined. The research strategy of establishing the constitutive model, processing diagram, microstructure analysis and numerical simulation will offer robust support for the production of ZK60 alloy wire.
2 Materials and methods
The as-received material is a sheet of ZK60 alloy that is 3 mm thick and the chemical compositions are Mg-6.0Zn-0.6Zr (wt%). The initial microstructure, geometric shape and size of the uniaxial hot tensile sample are depicted in Figure 1. The tests were conducted using the SUST-CMT5000GL thermal testing machine. The sample was rapidly heated to the designated temperature and maintained at that temperature for 180 s to ensure temperature uniformity. Water quenching (WQ) is carried out immediately after the completion of hot stretching, to preserve the instantaneous state of the deformed grains. The isothermal compression tests are conducted at temperature from 523 K to 673 K (the interval of 50 K). And the strain rates are 0.0005
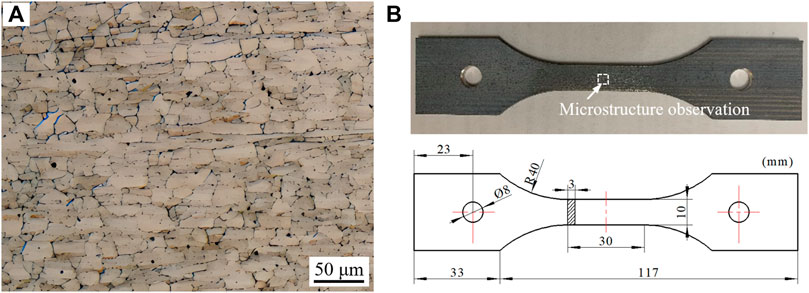
FIGURE 1. Initial microstructure and the size of the tensile sample. (A) Microstructure, (B) The geometric shape and size of the uniaxial hot tensile sample.
3 Results and discussions
3.1 Flow stress
Figure 2 shows the flow stress curves of AZ60 alloy at different tensile parameters. The hot working process of the alloy involves the interplay between work hardening and dynamic softening, which includes dynamic recovery (DRV) and DRX. The former raises the deformation resistance, while the latter diminishes it. During the initial phases of tensile loading, deformation is predominantly controlled by the work hardening mechanism, directly associated with the accumulation of dislocations during plastic deformation (Jabbari-Taleghani and Torralba, 2014). The accumulation and entanglement of a significant quantity of dislocations will lead to an increase of stress. When the strain continues to increase, a portion of the deformation work persists within the alloy in the shape of defects or dislocations, which will provide the driving force for DRV and DRX (Silva et al., 2021). At this time, the stress increase caused by work hardening and the stress reduction caused by dynamic softening will be in a state of dynamic competition. When dynamic softening is dominant, the slope of the flow stress curve gradually diminishes until it reaches the peak stress, where the work hardening and dynamic softening tend to reach a dynamic balance. Following the peak stress, dynamic softening predominates, with DRX being the primary mechanism for dynamic softening in magnesium alloys. From the deformation conditions at 623 K and 673 K (Figures 2C, D), the dynamic soft fully counteracts the influences of strain and work hardening, resulting in a steady state of flow stress.
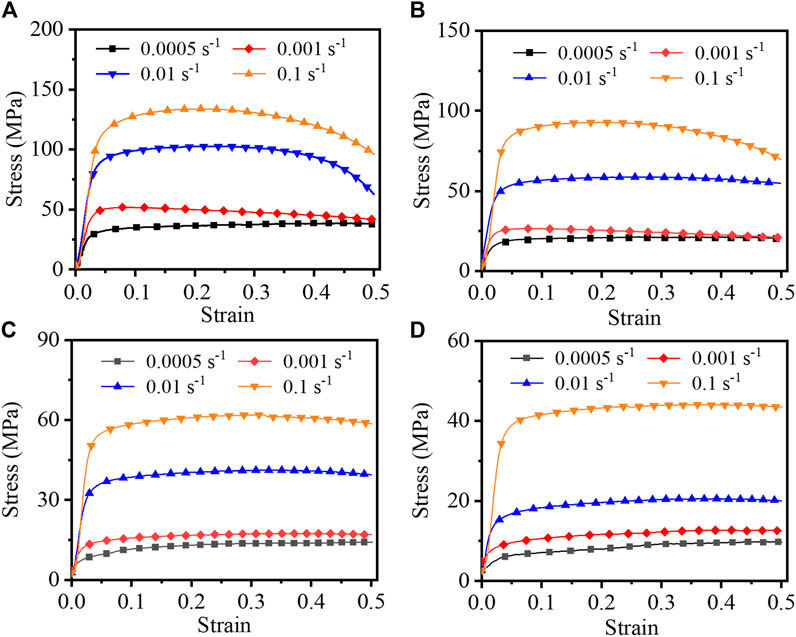
FIGURE 2. The flow stress curves of ZK60 alloy at different tensile temperatures of: (A) 523 K, (B) 573 K, (C) 623 K, (D) 673 K.
3.2 Microstructure
The microstructures of AZ60 alloy under various tensile temperatures are displayed in Figure 3. And the strain rate maintains a constant value of 0.001 s-1. It is evident that both the grain size of DRXed grains and the fraction of coarse deformed grains are temperature-dependent. The tensile alloys exhibit a non-uniform microstructure composed of fine equiaxed grains generated by DRX and some coarse elongated patches. In the deformation microstructures at 573 K (Figures 3A, C), a limited quantity of DRXed grains can be discerned at the grain boundaries, signifying the nucleation and growth of DRXed grains. However, the content of DRXed grains is lower. For the alloy deformed at 573 K, the average grain size of the DRXed grains is about 6.8 μm. When the deformation temperature escalates to 623 K (Figures 3B, D), a large number of DRXed grains appear and the number of DRXed grains also increases. Meanwhile, the DRXed grains grow and the average grain size is approximately 10.3 μm. DRXed grains are predominantly situated along the grain boundaries of parent-phase grains, signifying that DDRX is the primary softening mechanism in the alloy. In addition, there are often a few DRXed grains near the formed micro-voids. Prior to the formation of micro-voids, a significant quantity of dislocations gather near the micro-voids to be formed, which increases the local dislocation energy and promotes the nucleation of DRXed grains (Chen X. et al., 2023).
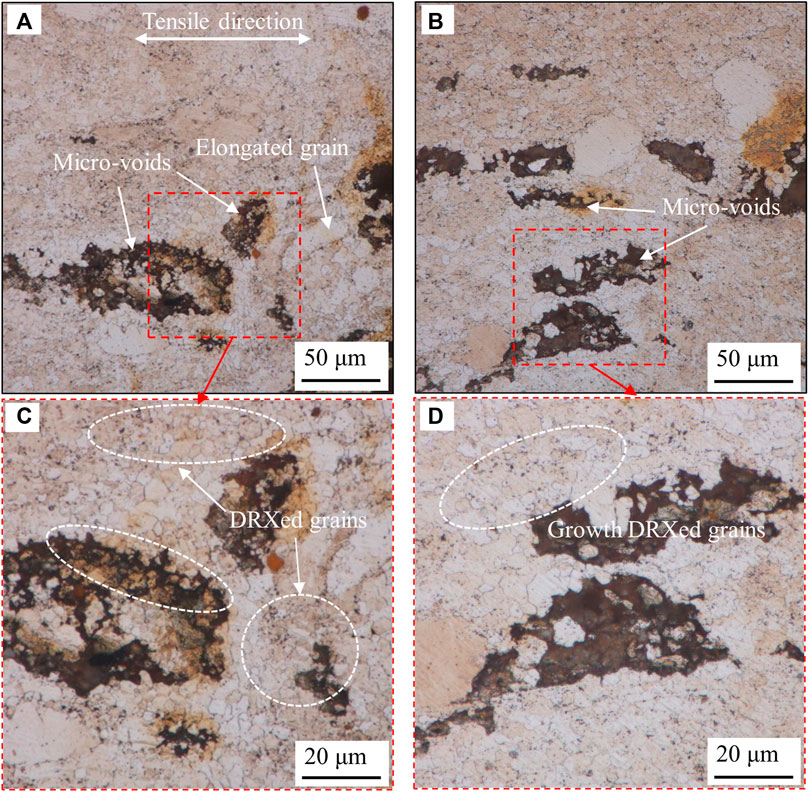
FIGURE 3. The microstructures of AZ60 alloy at 0.001
3.3 Constructive model
Constitutive models for metallic materials are crucial in understanding their mechanical behavior. The Arrhenius equation is widely employed for describing the temperature-dependent properties of metals, accounting for the influence of temperature on material strength and deformation (Chen L. et al., 2023). In addition, machine learning models have emerged as powerful tools for developing data-driven constitutive models in recent years. By training on extensive experimental or simulated data, these models can simulate complex, non-linear relationships between material properties, temperature, and other factors, offering enhanced predictive capabilities and insights into the behavior of metal materials. Based on the characteristics of different models, phenomenological and machine learning constitutive models have been established.
3.3.1 Strain-compensation Arrhenius model
The Arrhenius model is well-suited for constructing high-temperature constitutive models for metallic materials and has gained extensive usage. The equation incorporates both the temperature (T) and the activation energy (Q) (Lei et al., 2021):
where
The impact of forming temperature and strain rate on deformation characteristics can be characterized using Z parameter (Lei et al., 2023).
Operating Eqs 1 and 2, and logarithmically transforming:
According to Eq. 3, the relevant parameter values can be obtained by performing linear fitting on the scattered points of the stress under varying deformation parameters. Figure 4 shows the linear fitting lines derived from the measured data at a strain level of 0.1. The inverse of the mean slop of the linear regression lines for
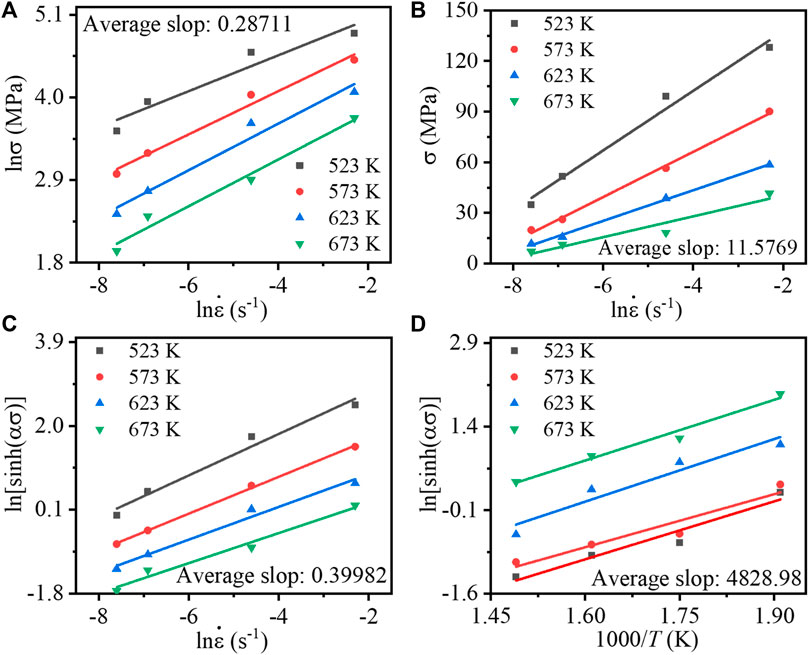
FIGURE 4. The linear fitting lines of: (A)
The relationship between
Finally, the material parameters were substituted into Eq. 4 to obtain the stress constitutive equation for ZK60 alloy at a strain of 0.1.
In the established Eq. 5, the impact of strain on flow stress during tensile deformation is ignored, making it difficult to predict stress under different strains. Additionally, strain affects both Q and material parameters. Therefore, to develop an Arrhenius model incorporating strain-related effects,
True stress values are extracted at intervals of 0.05 across the entire true strain range of 0–0.5. So, the values of
where the involved parameters are characterized in Table 2.
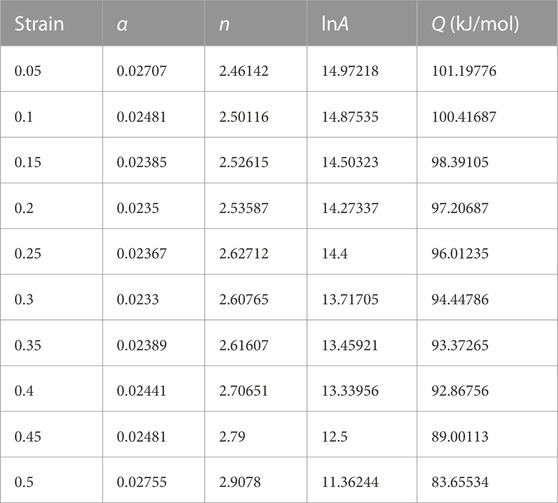
TABLE 1. The parameters for the Arrhenius model at the stain in the range of 0–0.5.
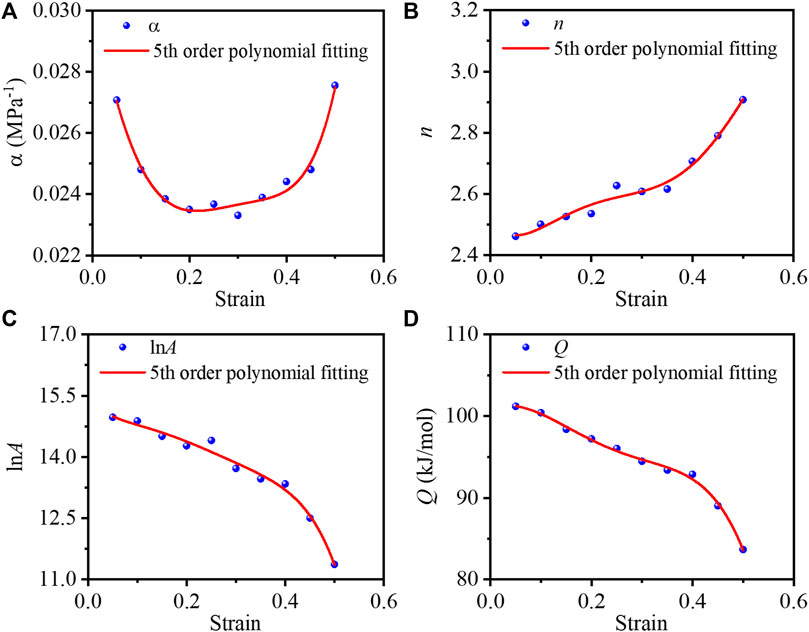
FIGURE 5. Fifth-order polynomial fitting curves of material parameters with strain ε: (A)
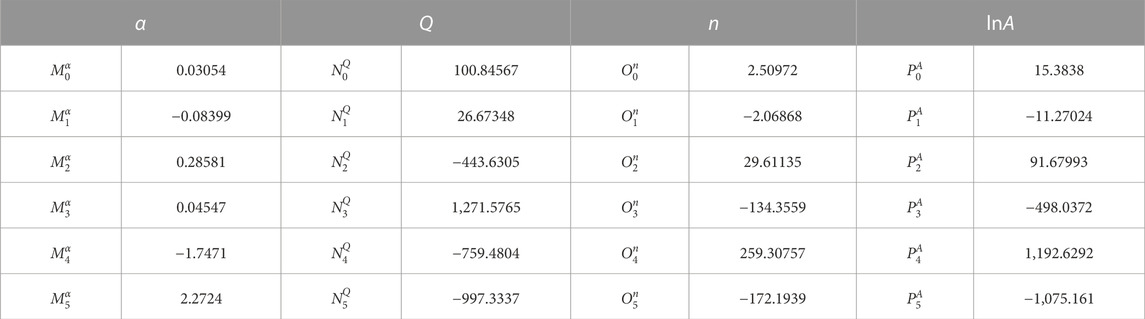
TABLE 2. Fifth-order polynomial coefficients for characterization parameters.
Figure 6 illustrates the correlation between the predicted stress and the measured stress. At lower tensile strain rates, the predicted values from the constitutive model closely align with the actual stress values. Although there is a slight discrepancy between the predicted values and experimental results at high strain rates, the developed constitutive model remains capable of forecasting the flow stress during the thermal tensile deformation process of ZK60 alloy.
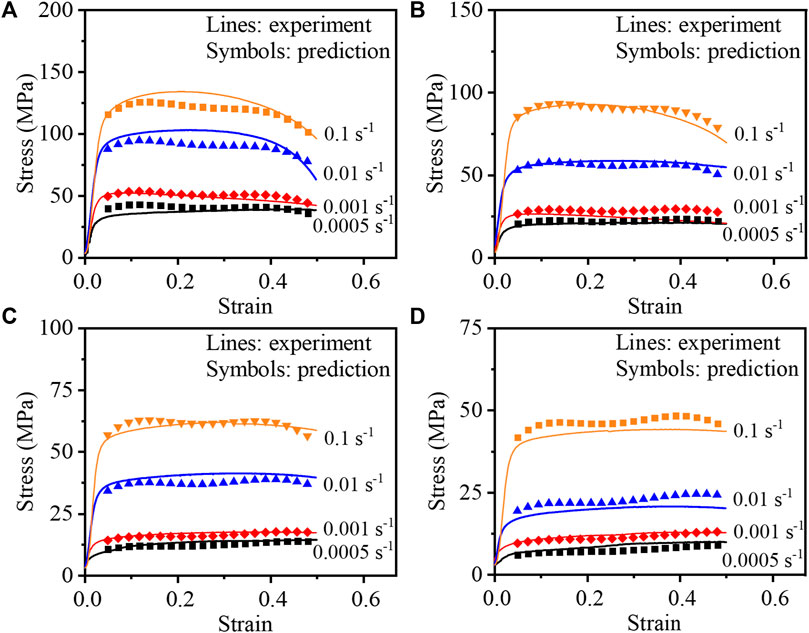
FIGURE 6. Experiment and simulation stress of AZ60 alloy at different tensile temperatures of: (A) 523 K, (B) 573 K, (C) 623 K, (D) 673 K.
3.3.2 PSO-SVM regression model
3.3.2.1 SVM regression model
SVM regression model is employed for addressing regression and classification tasks, which was first proposed by Vapnik (Peng et al., 2013). Many drawbacks in traditional machine learning techniques can be avoided by SVM based on structural risk minimization (SRM), such as local minima, low convergence rate, the need for diverse training data and underfitting/overfitting (Sheykhmousa et al., 2020). A special training dataset is set as
To widen the classification range and accommodate limited noisy data, relaxation variable
where
The Lagrange operators
For the maximum, minimum and duality problem, let
Then, the following Eq. 12 also can be obtained.
Once the Lagrange operator
where
3.3.2.2 PSO algorithm model
PSO algorithm model is employed in this work as a prevalent tool, which is a form of swarm intelligence in which birds cooperate in groups to find the best places to get food (Jakubcová et al., 2014). The population in the D-dimensional target search space consists of bird flocks whose amount is m and known as “particles”. The space vector
where
3.3.2.3 SVM optimized by PSO technique
The performance of SVM regression model for classification is highly dependent on
3.3.2.4 Forecasting flow stress of ZK60 alloy
Before starting prediction, it is necessary to prepare training and prediction datasets separately. The datasets involving the temperature, the strain rate, the strain and the flow stress are prepared. The input data consists of temperature, strain rate, and strain, while the output is the flow stress. The datasets collected from 523 K to 573 K are applied for training, and from 623 K to 673 K are employed for testing.
Figure 7 illustrates the iterative process of the PSO algorithm, where both the average fitness and optimal fitness are updated and substituted in each iteration step. From Figure 7, the particle swarm searched for the global optimal fitness value when the iteration step is 18th. Currently, MSE = 0.088, C = 32.5, g = 0.3, and the average fitness value after each iteration has also been approaching the global optimal fitness value, indicating that the particle swarm is moving towards the optimal position every iteration.
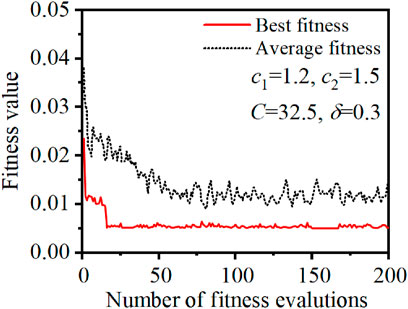
FIGURE 7. The iteration process of the PSO algorithm.
Figure 8 displays the flow stress curves of AZ60 alloy, as predicted by the PSO-SVM regression model and compared with measured stress. The stress predicted by the PSO-SVM regression model closely matches the experimental flow stress throughout the entire tensile process (Figures 8A, B). This is because the data collected from 523 K to 573 K are applied for training datasets. At the onset of deformation with the temperatures of 623 K and 673 K, as depicted in Figures 8A, C, D minor deviation exists between the predicted stress and the experimental stress. In general, the PSO-SVM regression model demonstrates good consistency between predicted stress and test stress.
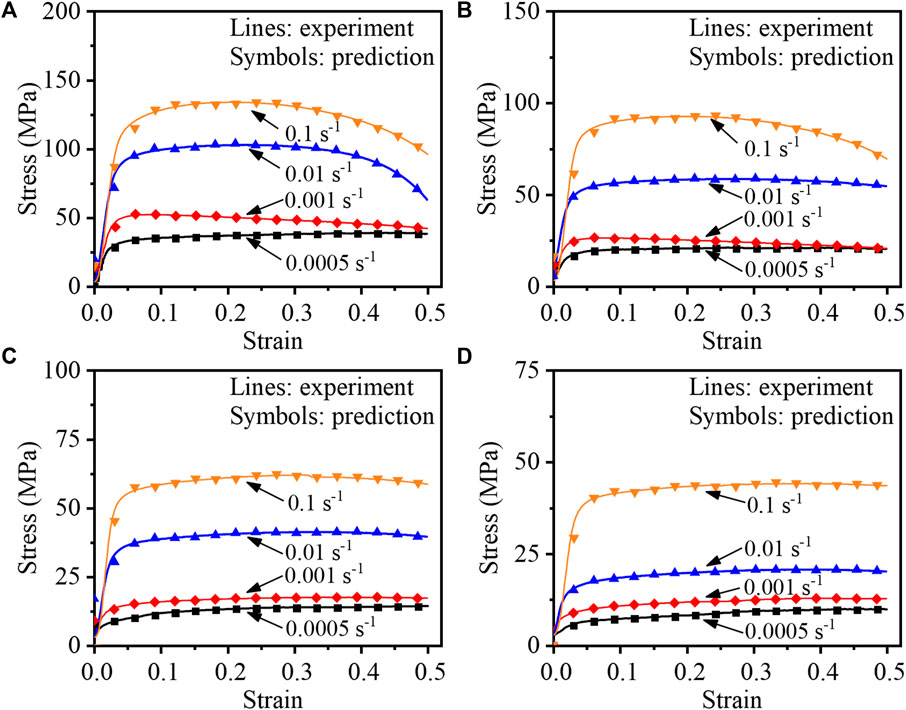
FIGURE 8. The PSO-SVM regression model predicted and experimental flow stress curves of AZ60 alloy at different tensile temperatures of: (A) 523 K, (B) 573 K, (C) 623 K, (D) 673 K.
3.3.3 Comparison of different prediction models
To assess the predictive capability of Arrhenius model and PSO-SVM regression model, the average absolute relative error and the correlation coefficient, denoted by AARE and R, are utilized.
where
Figure 9 illustrates a comparison of predicted accuracy between the strain-compensation Arrhenius model and the PSO-SVM regression model. The AARE of the strain-compensation Arrhenius model and the PSO-SVM regression model are 8.96% and 1.12%, respectively. In addition, the values of R of the two models are, respectively, 0.9736 and 0.9984. The findings indicate that the flow stress response of ZK60 alloy during hot tension can be effectively described by both the Arrhenius model, which accounts for strain compensation, and the PSO-SVM regression model. However, it is not accurate enough for the established strain-compensation Arrhenius model. The PSO-SVM regression model significantly enhances model accuracy and minimizes prediction distortion, particularly at high strain rates, achieving a high level of precision.
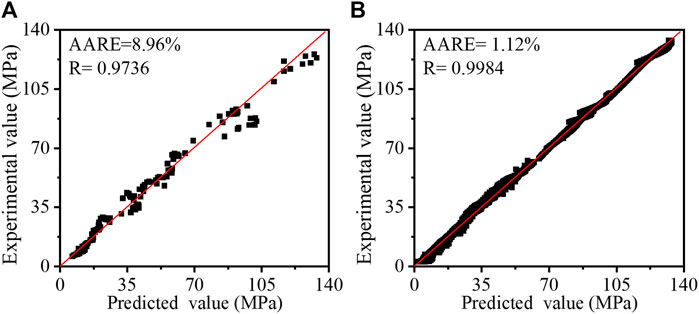
FIGURE 9. The comparison of predicted accuracy between the strain-compensation Arrhenius model and the PSO-SVM regression model: (A) Arrhenius model, (B) PSO-SVM regression model.
3.4 Hot processing maps
The hot processing map identifies a material’s machinability and instability intervals by correlating flow data with microstructural evolution. The hot processing map encompasses both a power dissipation efficiency map and an instability map. It effectively portrays the correlation between thermal deformation parameters and the mechanism of microstructure evolution (Zhi et al., 2023). The model treats the thermal processing of materials as an energy-consuming system, in which the total power
The strain rate factor
For an ideal linear dissipater,
A larger
Plastic flow instability will occur when
The hot processing maps of ZK60 alloy at strains of 0.1 and 0.5 are displayed in Figures 10A, B, where instability region occurs in low temperature and high strain rate as the strain increases. When the strain is low (Figure 10A), the instability area is mainly concentrated in the high strain rate area, and the region of instability predominantly centers around the low-temperature and all strain rate zone. This means that the sensitivity of the deformation parameters to the instability shifts gradually from the strain rate to the processing temperature as the deformation strain increases. The stability processing range for this alloy are concentrated in the range of 573 K–653 K with a strain rate of 0.001
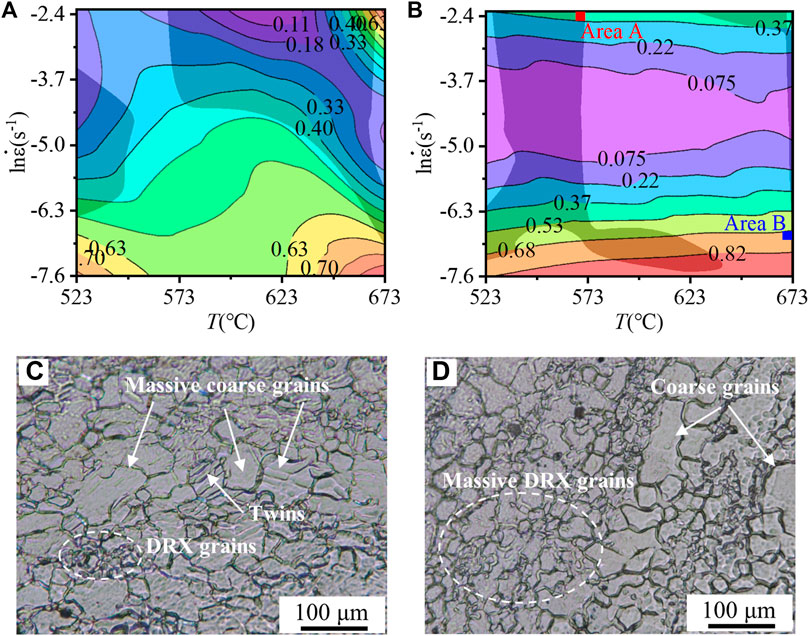
FIGURE 10. Hot processing map and deformation microstructure located in areas (A,B) (A) 0.1, (B) 0.5, (C) Area A, (D) Area (B).
3.5 Application of constitutive model and numerical simulation verification
To facilitate the practical application of the established constitutive model in engineering, the model described in Section 3.3.1 is implemented in the FE software. The tensile process is reproduced by FE method in Figure 11. Then, the drawing process of ZK60 alloy wire is also simulated.
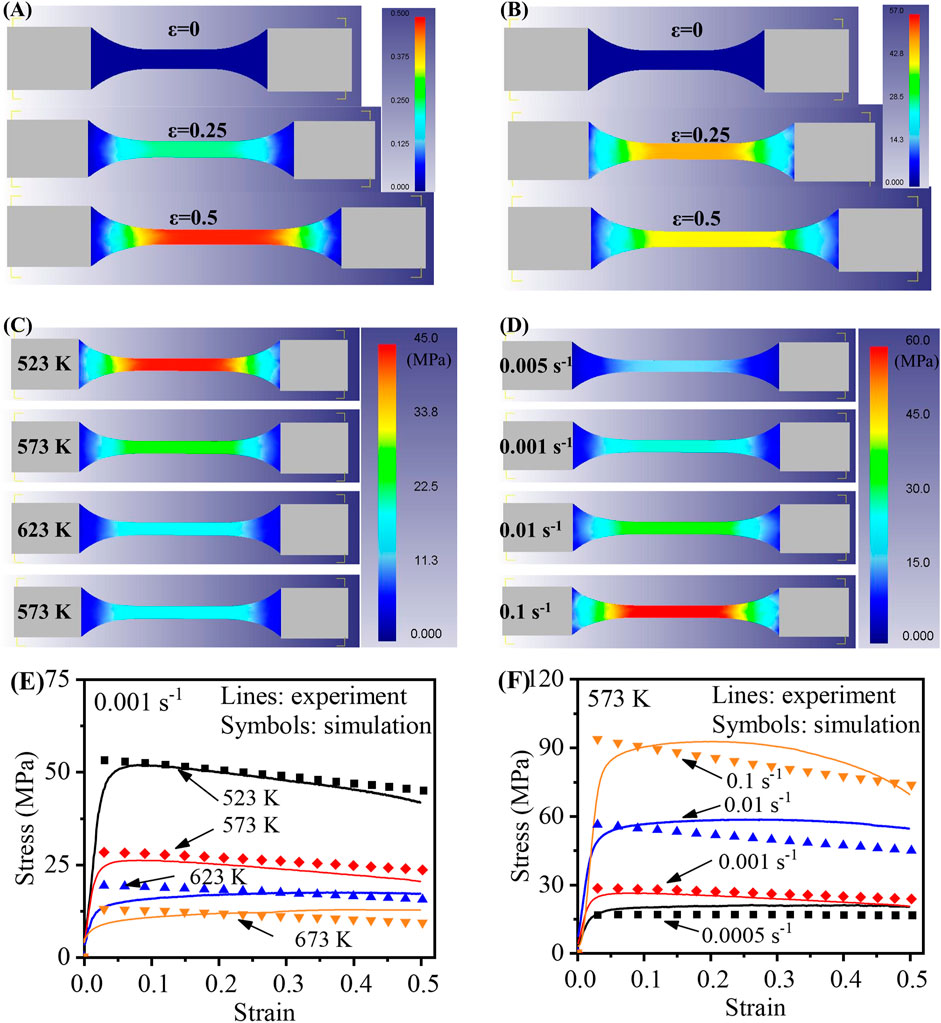
FIGURE 11. The simulated thermal tensile process of ZK60 alloy under different parameters. The variations of (A) strain and (B) stress deformed at 523 K-0.001 s-1, (C) The stress deformed at different temperatures and the strain rate is 0.001 s-1, (D) The stress deformed at different strain rates and the temperature is 573 K, (E) and (F) The comparison between experimental and simulated stress.
3.5.1 Thermal tensile process
Figure 11 shows the simulated thermal tensile process of ZK60 alloy. Figures 11A, B reveal non-uniform distributions of strain and stress along the tensile direction of the material. As tension continues, the strain increases while the stress slightly decreases, attributed to recrystallization softening. The distributions of the stress at different temperatures and strain rates are shown in Figures 11C, D. Obviously, with an increase in tensile temperature and a decrease in strain rate, the flow stress exhibited a decrease (Figures 11C, E). Furthermore, at elevated temperatures, the reduction in stress becomes less pronounced as the temperature continues to rise. At high strain rates, there is a notable discrepancy between simulated and experimental stresses (Figure 11F), which also noted in Section 3.3.1. Some researchers have addressed the impact of these high strain rates (Wu et al., 2010; Raghunath et al., 2011). Overall, simulated stresses show strong alignment with experimental results.
3.5.2 FE analysis of wire-drawing process of ZK60 alloy
The analysis uses the elastic-plastic analysis finite element method to analyze the drawing process of ZK 60 alloy wire. The initial diameter of the wire is 4 mm. Assume that the wire is made of isotropic and nonlinear elastic-plastic material with elastic modulus E of 154 GPa and Poisson’s ratio v of 0.3. The drawing and traction dies are treated as rigid bodies. The reductions in the semi-die angle and cross-sectional area, when the diameter is decreased from 4 mm to 3 mm, amount to 7° and 43.7%, respectively. To facilitate the wire drawing process, the initial wire, which was approximately 9 mm in length upon entering the drawing die, was transformed into a frustum-like structure with a half-angle of 3°. The FE model and dimensions of ZK60 alloy drawing simulation process is shown in Figure 12. In light of the findings presented in Sections 3.2 and 3.4, a drawing temperature of 623 K has been established. Additionally, five drawing speeds, namely, 0.025 mm/s, 0.05 mm/s, 0.5 mm/s, 1 mm/s and 2 mm/s, were selected to investigate their impact on wire formation and enhance the efficiency of wire preparation.
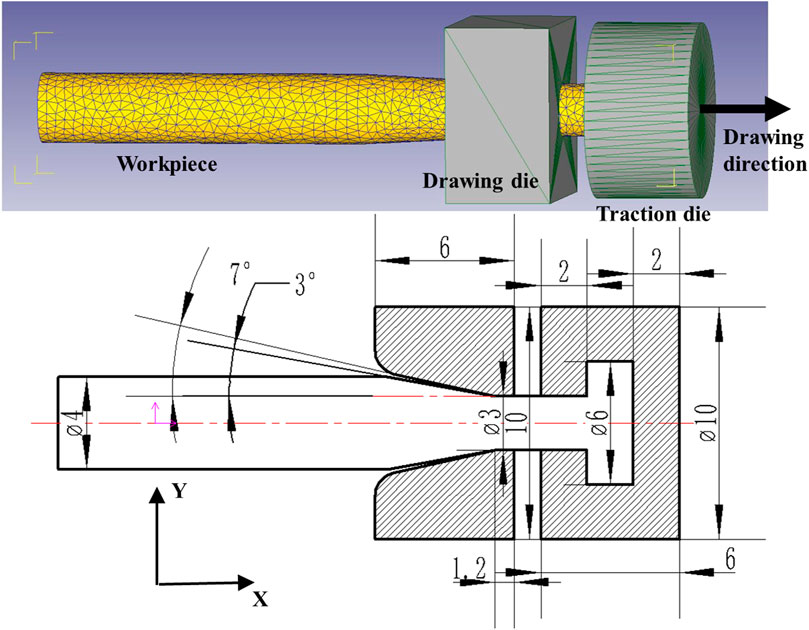
FIGURE 12. Model and dimensions of ZK60 alloy drawing simulation process.
Figure 13 shows the simulation of ZK60 alloy drawing at 623 K with different speeds. At slower drawing speeds, ranging from 0.025 mm/s to 0.05 mm/s, the wire experiences increased friction and shear deformation as it traverses the drawing die. This leads to the concentration of stress primarily on the deforming wire. It is noteworthy that a minor residual stress exists in the deformed wire, primarily attributable to the lower strain rate and reduced deformation resistance of the material during low-speed drawing. As the drawing speed increases (0.5 mm/s to 2 mm/s), the wire experiences its highest equivalent stress at the point where it passes through the drawing die. The formed wire exhibits non-uniformly distributed residual stress, with the residual stress gradually increasing from the wire’s center to the surface area. While the maximum equivalent stress is observed on the wire’s surface during the drawing process, the minimum equivalent stress in the formed wire is located near the wire’s center. The faster the drawing speed, the greater the residual stress. Under various drawing speeds, while the distribution of equivalent stress may vary, the strain remains uniformly distributed, as shown in Figure 13B. Figure 13C depicts the drawing force required at varying drawing speeds for reducing the diameter from 4 mm to 3 mm. It demonstrates a significant influence of drawing speed on the drawing force. As the drawing speed rises, so does the drawing force. At a drawing speed of 0.025 mm/s, the drawing force remains relatively low but exhibits fluctuations. In the range of drawing speeds between 0.05 mm/s and 1 mm/s, the drawing force remains fairly stable, showing a steady or gradual increase, which is conducive to wire forming. At a drawing speed of 2 mm/s, the drawing force is relatively high, reaching around 300 N during stable drawing. Nevertheless, there are significant fluctuations in the drawing force during the drawing process, with the maximum value reaching 450N, which does not promote the stable formation of the wire.
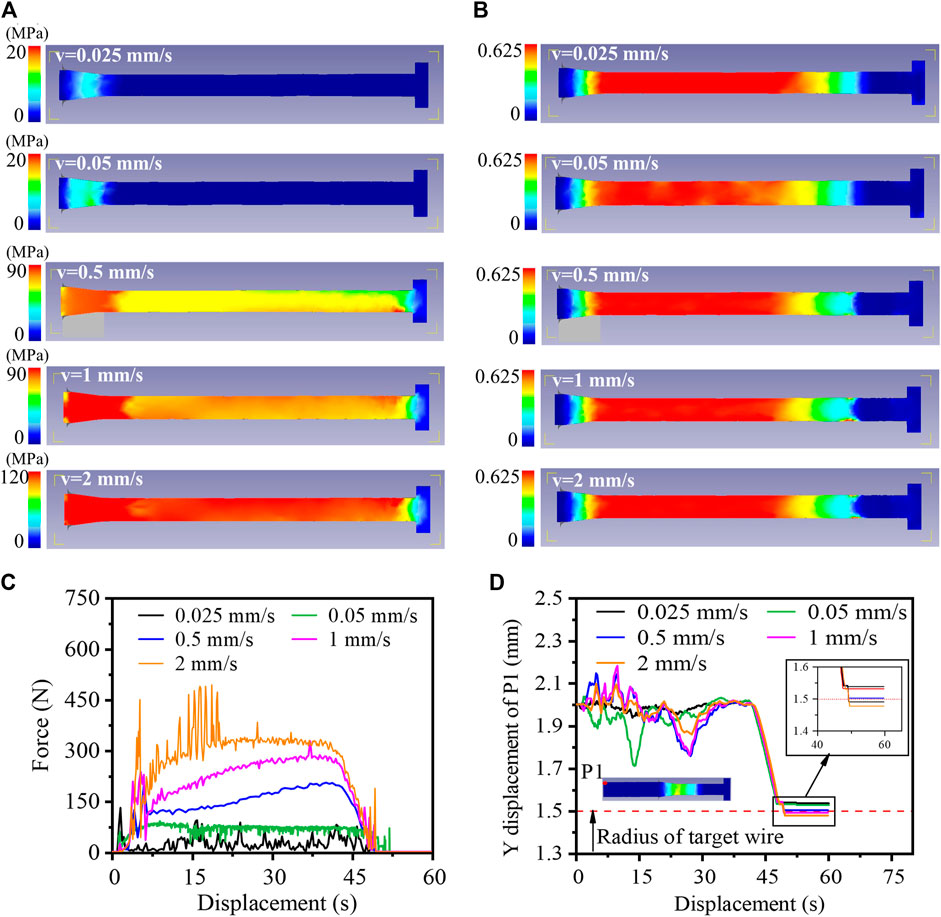
FIGURE 13. Figures of (A) simulated equivalent stress, (B) equivalent strain, (C) drawing force and (D) Y-axis displacement of point P1 of ZK60 alloy drawing at 523 K with different speeds.
In the wire drawing and forming process, circular runout may occur at the wire’s end or at a position distant from the drawing die. Consequently, the P1 point at the end of the wire is selected and the displacement of the Y-axis will be recorded to evaluate whether the drawing process proceeds stably. The Y-axis displacement of point P1 is depicted in Figure 13D. When the drawing speed is low, the fluctuated amplitude of the Y-axis displacement is smaller. With increased drawing speed, the fluctuated amplitude grows. Notably, at a drawing speed of 2 mm/s, the fluctuation amplitude decreases. This is attributed to the swifter drawing speed, shorter forming duration, and the greater force applied by the drawing die, which constrains the extent of fluctuations. At speeds of 0.025 mm/s, 0.05 mm/s, 0.5 mm/s, 1 mm/s, and 2 mm/s, the Y-direction displacement of point P1 measures 0.05 mm, 0.32 mm, 0.45 mm, 0.47 mm, and 0.22 mm, respectively. When the drawing is completed, the radii of the wire at point P1 are 1.5377 mm, 1.5304 mm, 1.5014 mm, 1.4902 mm and 1.4767 mm respectively. Therefore, based on the previous analysis, in order to stabilize the wire drawing process and prepare qualified ZK60 alloy wire efficiently, the recommended drawing temperature is 623 K and the drawing speed is 0.05–0.5 mm/s.
Figure 14 shows the entire drawing simulation process of ZK60 alloy drawing at 623 K with a speed of 0.05 mm/s. As the drawing time increases, the higher equivalent stress is mainly concentrated at the position of the deforming wire. The equivalent strain on the wire appears uniformly distributed. However, due to the strong friction between the wire surface and the mold, the equivalent stress and equivalent strain on the surface are slightly higher than the core. Overall, there is less residual stress in the wire drawn at this speed.
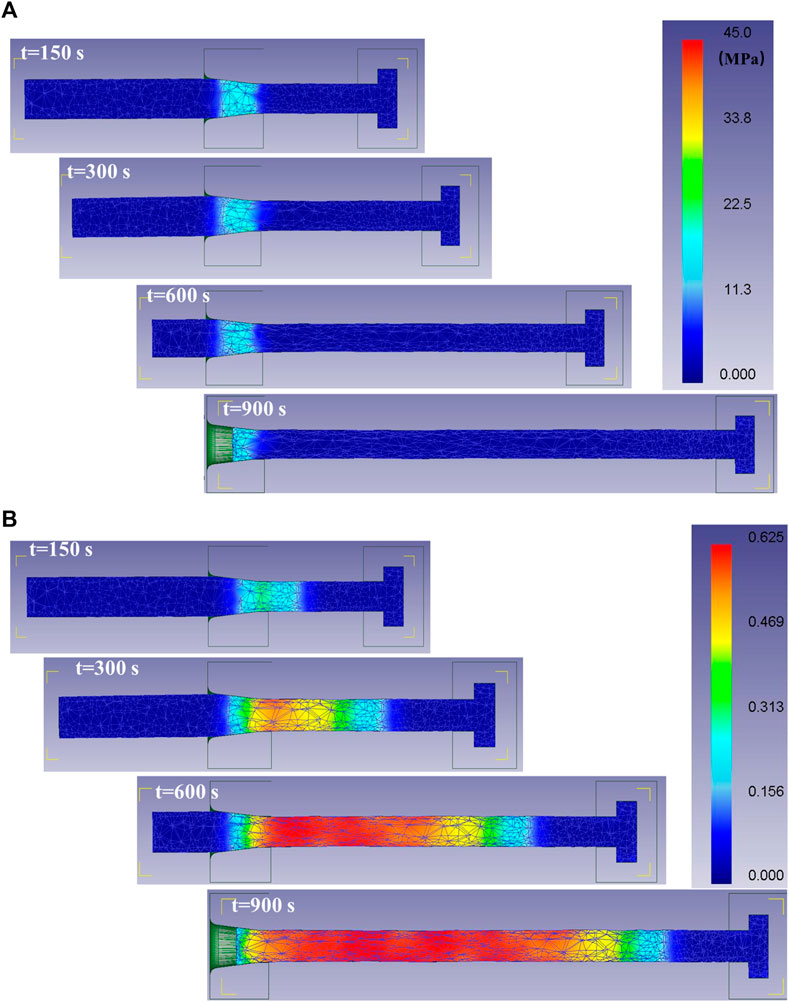
FIGURE 14. Simulation process of ZK60 alloy drawing at 623 K with a speed of 0.05 mm/s. (A) Equivalent stress, (B) Equivalent strain.
4 Discussions
4.1 The value of Q between ZK60 alloy and other Mg-based alloys
Table 3 listed the comparison of the value of Q between the alloy in this work and other Mg-based alloys reported in reference. Several Mg-based alloys including Mg-3Sn-1Mn (Xiong et al., 2023), Mg-8.5Gd-4.5Y-0.8Zn-0.4Zr (Hu et al., 2023), Mg-8.1Gd-4.5Y-0.3Zr (Xia et al., 2020) and Mg-9Li-3Al-2Sr-2Y (Wei et al., 2015) are selected for comparison of the value of Q. It can be observed that the Q value for ZK60 alloy in this work gradually decrease with increasing strain. This implies an instantaneous reduction in the energy demand during the thermal deformation of the alloy as strain increases, which is likely linked to the initiation of DRX with escalating strain. Also, the alloys discussed in these reports also demonstrate a decrease in Q values as strain increases. In contrast to the reported Mg-based alloys, the Q value of ZK60 alloy is relatively low. This discrepancy can be attributed to a lower content of alloying elements and variations in deformation conditions (Shi et al., 2022). Furthermore, the substantial extent of recrystallization also contributes to the reduction in the Q value of the alloy (Ciccarelli et al., 2015). Upon comparing the Mg-8.5Gd-4.5Y-0.8Zn-0.4Zr and Mg-8.1Gd-4.5Y-0.3Zr, it becomes evident that, despite having identical deformation conditions, a slight variation in alloy elements can result in a significant alteration in the Q value. Indeed, initial grain size, crystal orientation and the occurrence of twins during thermal deformation also stand out as crucial factors influencing the Q value (Ciccarelli et al., 2015; Tahreen et al., 2015; Lei et al., 2021).
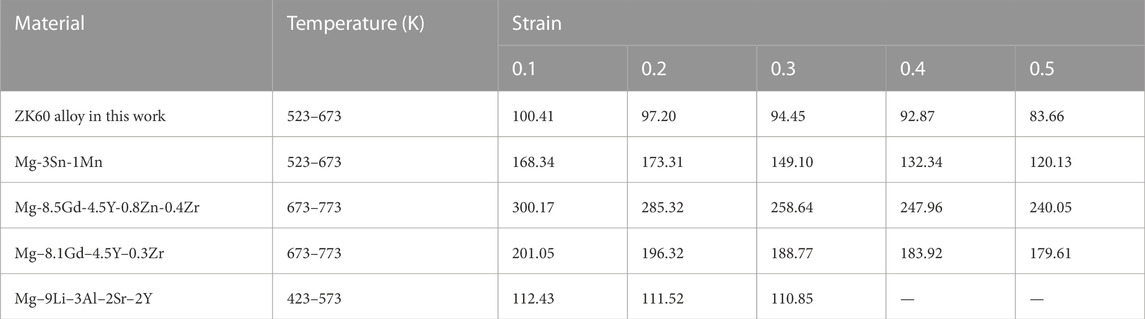
TABLE 3. Comparison between the value of Q for ZK60 alloy and other Mg-based alloys (kJ/mol).
4.2 The generalization ability of the established prediction model
The generalization ability of the established prediction model is pivotal, particularly in industrial applications. In this work, the strain-compensation Arrhenius model based wide range of experimental data is established. This phenomenological model is capable of predicting the thermal deformation behaviour under various working conditions within the range of experimental deformation conditions. These calibrated model parameters or material parameters can be promoted and used wherever they need to be implemented, such as cellular automaton (CA), phase field (PF), finite element (FE), etc. In industrial applications, it is beneficial to reduce the parameters of the model at the expense of a small amount of accuracy, rather than blindly pursuing the accuracy of the model and coupling multiple model parameters (Lin et al., 2010). As mentioned earlier, the established model can only be effectively generalized within the known deformation interval, and its predictive ability beyond this interval is unreliable. However, the data-driven PSO-SVM regression model exhibits robust generalization ability for the following reasons (Feng et al., 2002; Zhang et al., 2021).
i) Kernel function implementation: The PSO-SVM regression model employs a kernel function to map input data into a high-dimensional feature space. This mapping enhances the linearity of separability in the data and enables implicit nonlinear mapping.
ii) PSO optimization of hyperparameters: Utilizing the PSO algorithm, the PSO-SVM regression model optimizes hyperparameters such as the penalty parameter
iii) k-fold cross-validation technique: The PSO-SVM regression model incorporates k-fold cross-validation technology, dividing the training set into k subsets. During each iteration, one subset serves as the validation set, while the remaining subsets function as the training set. This approach reduces model variance and helps prevent overfitting.
These factors collectively contribute to the strong generalization ability of the PSO-SVM regression model, allowing it to effectively predict outcomes beyond the known data range and demonstrating its suitability for diverse applications.
5 Conclusion
The deformation behavior, microstructure and DRX mechanism of the ZK60 alloy during hot tensile deformation were investigated. The primary findings are outlined as follows.
(1) With an increase in tensile temperature and a decrease in strain rate, the flow stress exhibited a decrease. At the deformation conditions at 623 K and 673 K, the dynamic soft fully balances the effects of strain and work hardening, leading to a steady state of flow stress. Raising the temperature while maintaining a constant strain rate favors the occurrence of DRX. The softening mechanism of the alloy mainly is DRX.
(3) The developed constructive modes including the Arrhenius model and the PSO-SVM regression model can describe the flow stress of the alloy during hot tension. However, the PSO-SVM regression model can more accurately predict the stress of the studied alloy with the AARE and R of 1.12% and 0.9984, respectively.
(4) Based on the hot processing maps, the sensitivity of the deformation parameters to the instability shifts gradually from the strain rate to the deformation temperature as the deformation strain increases. The stability processing range areas for this alloy are concentrated in the range of 573 K–653 K with a strain rate of 0.001
(5) The distribution of physical fields in ZK60 alloy during both tensile and drawing processes can be accurately predicted by the established Arrhenius model. Based on the FE analysis, in order to stabilize the wire drawing process and prepare qualified ZK60 alloy wire efficiently, the recommended drawing temperature is 623 K and the drawing speed is 0.05–0.5 mm/s.
Data availability statement
Publicly available datasets were analyzed in this study. This data can be found here: If you need the data, please contact us.
Author contributions
FL: Conceptualization, Data curation, Investigation, Writing–original draft. CY: Methodology, Visualization, Writing–review and editing. ZL: Conceptualization, Supervision, Writing–review and editing. HW: Project administration, Validation, Writing–review and editing.
Funding
The author(s) declare financial support was received for the research, authorship, and/or publication of this article. The financial support of the Characteristic innovation project of colleges and universities in Guangdong Province (2022WTSCX315).
Conflict of interest
The authors declare that the research was conducted in the absence of any commercial or financial relationships that could be construed as a potential conflict of interest.
Publisher’s note
All claims expressed in this article are solely those of the authors and do not necessarily represent those of their affiliated organizations, or those of the publisher, the editors and the reviewers. Any product that may be evaluated in this article, or claim that may be made by its manufacturer, is not guaranteed or endorsed by the publisher.
References
Ali, W., Echeverry-Rendón, M., Dominguez, G., van Gaalen, K., Kopp, A., González, C., et al. (2023). Bioabsorbable WE43 Mg alloy wires modified by continuous plasma electrolytic oxidation for implant applications. Part II: degradation and biological performance. Biomater. Adv. 147, 213325. doi:10.1016/j.bioadv.2023.213325
Cao, F., Sun, C., Liu, S., Liang, J., Liu, R., Guo, H., et al. (2022). Microstructures, hot tensile deformation behavior and constitutive modeling in a superlight Mg-2.76Li-3Al-2.6Zn-0.39Y alloy. J. Alloys Compd. 896, 163049. doi:10.1016/j.jallcom.2021.163049
Chen, L., Yuan, C., Wu, R., Jiao, W., Jiang, H., and Zhou, X. (2023a). The parameter identification of physical-based constitutive model by inverse analysis method for application in near-net shape forging of aluminum wheels. Met. (Basel) 13, 700. doi:10.3390/met13040700
Chen, X., Lu, Y., Ning, M., Zhou, X., and Chen, J. (2023b). Tailoring microstructural evolution and fracture damage behavior of a Mg–Y–Zn alloy during hot tensile deformation. Mater. Sci. Eng. A 871, 144857. doi:10.1016/j.msea.2023.144857
Chen, Y., Mao, Y., Lu, W., and He, P. (2017). Investigation of welding crack in micro laser welded NiTiNb shape memory alloy and Ti6Al4V alloy dissimilar metals joints. Opt. Laser Technol. 91, 197–202. doi:10.1016/j.optlastec.2016.12.028
Chen, Y., Sun, S., Zhang, T., Zhou, X., and Li, S. (2020). Effects of post-weld heat treatment on the microstructure and mechanical properties of laser-welded NiTi/304SS joint with Ni filler. Mater. Sci. Eng. A 771, 138545. doi:10.1016/j.msea.2019.138545
Cheng, Z., Li, S., Zhang, Y., Wang, X., Xie, Q., Qian, K., et al. (2023). Research of a biodegradable Mg-5Zn wire for anastomosis staples. Mater. Lett. 352, 135173. doi:10.1016/j.matlet.2023.135173
Ciccarelli, D., El Mehtedi, M., Jäger, A., and Spigarelli, S. (2015). Analysis of flow stress and deformation mechanism under hot working of ZK60 magnesium alloy by a new strain-dependent constitutive equation. J. Phys. Chem. Solids 87, 183–195. doi:10.1016/j.jpcs.2015.08.020
Duley, P., Sanyal, S., Bandyopadhyay, T. K., and Mandal, S. (2021). Implications of annealing treatments on microstructure, texture, and tensile properties of hard plate hot forged Mg-Zn-Ca-Mn alloy. Mater. Charact. 172, 110885. doi:10.1016/j.matchar.2021.110885
Fang, J. X., Wang, J. X., Wang, Y. J., He, H. T., Zhang, D. B., and Cao, Y. (2022). Microstructure evolution and deformation behavior during stretching of a compositionally inhomogeneous TWIP-TRIP cantor-like alloy by laser powder deposition. Mater. Sci. Eng. A 847, 143319. doi:10.1016/j.msea.2022.143319
Feng, X. T., Li, S., Liao, H., and Yang, C. (2002). Identification of non-linear stress-strain-time relationship of soils using genetic algorithm. Int. J. Numer. Anal. Methods Geomech. 26, 815–830. doi:10.1002/nag.226
Fu, Z. H., Yang, B. J., Shan, M. L., Li, T., Zhu, Z. Y., Ma, C. P., et al. (2020). Hydrogen embrittlement behavior of SUS301L-MT stainless steel laser-arc hybrid welded joint localized zones. Corros. Sci. 164, 108337. doi:10.1016/j.corsci.2019.108337
Gao, L., and Luo, A. A. (2013). Hot deformation behavior of as-cast Mg-Zn-Mn-Ce alloy in compression. Mater. Sci. Eng. A 560, 492–499. doi:10.1016/j.msea.2012.09.094
Gao, M., Etim, I. P., Yang, K., Tan, L., and Ma, Z. (2022). Enhancing mechanical property and corrosion resistance of Mg – Zn-Nd alloy wire by a combination of SPD techniques, extrusion and hot drawing. Mater. Sci. Eng. A 829, 142058. doi:10.1016/j.msea.2021.142058
Guo, Y., Dai, Y., Chen, P., Zang, Q., and Zhang, Z. (2022). Microstructure, hot deformation behavior, and textural evolution of Mg-3Sn-2Al-1Zn-0.6Nd alloy. Met. (Basel) 12, 364. doi:10.3390/met12020364
Hadadzadeh, A., and Wells, M. A. (2017). Analysis of the hot deformation of ZK60 magnesium alloy. J. Magnes. Alloy. 5, 369–387. doi:10.1016/j.jma.2017.09.002
He, X., Li, Y., Miao, H., Xu, J., Ong, M. T., Wang, C., et al. (2022). High formability Mg-Zn-Gd wire facilitates ACL reconstruction via its swift degradation to accelerate intra-tunnel endochondral ossification. J. Magnes. Alloy. doi:10.1016/j.jma.2022.12.006
Hu, J., Yang, K., Wang, Q., Chen, Q., Hui, Y., and Liu, Y. J. (2024). Ultra-long life fatigue behavior of a high-entropy alloy. Int. J. Fatigue 178, 108013. doi:10.1016/j.ijfatigue.2023.108013
Hu, L., Lang, M., Shi, L., Li, M., Zhou, T., Bao, C., et al. (2023). Study on hot deformation behavior of homogenized Mg-8.5Gd-4.5Y-0.8Zn-0.4Zr alloy using a combination of strain-compensated Arrhenius constitutive model and finite element simulation method. J. Magnes. Alloy. 11, 1016–1028. doi:10.1016/j.jma.2021.07.008
Huang, M., Jiang, J., Wang, Y., Liu, Y., Zhang, Y., and Dong, J. (2023). Comparison and error evaluation of Arrhenius model and typical machine learning algorithms for high-temperature flow stress prediction of GH3536 superalloy. Mater. Lett. 349, 134754. doi:10.1016/j.matlet.2023.134754
Jabbari-Taleghani, M. A., and Torralba, J. M. (2014). Hot workability of nanocrystalline AZ91 magnesium alloy. J. Alloys Compd. 595, 1–7. doi:10.1016/j.jallcom.2014.01.091
Jakubcová, M., Máca, P., and Pech, P. (2014). A comparison of selected modifications of the particle swarm optimization algorithm. J. Appl. Math. 2014, 1–10. doi:10.1155/2014/293087
Kazi, M. K., Eljack, F., and Mahdi, E. (2022). Design of composite rectangular tubes for optimum crashworthiness performance via experimental and ANN techniques. Compos. Struct. 279, 114858. doi:10.1016/j.compstruct.2021.114858
Lei, C., Wang, Q., Ebrahimi, M., Li, D., Tang, H., Zhang, N., et al. (2023). Hot deformation behavior and processing maps of an as-cast Al-5Mg-3Zn-1Cu (wt%) alloy. Mater. (Basel) 16, 4093. doi:10.3390/ma16114093
Lei, C., Wang, Q., Tang, H., Liu, T., Li, Z., Jiang, H., et al. (2021). Hot deformation constitutive model and processing maps of homogenized Al–5Mg–3Zn–1Cu alloy. J. Mater. Res. Technol. 14, 324–339. doi:10.1016/j.jmrt.2021.06.069
Li, X., Wang, J., Ma, J., Yang, T., Yuan, S., Liu, X., et al. (2023). Thermal deformation behavior of Mg–3Sn–1Mn alloy based on constitutive relation model and artificial neural network. J. Mater. Res. Technol. 24, 1802–1815. doi:10.1016/j.jmrt.2023.03.096
Lin, Y. C., Chen, X. M., and Liu, G. (2010). A modified Johnson-Cook model for tensile behaviors of typical high-strength alloy steel. Mater. Sci. Eng. A 527, 6980–6986. doi:10.1016/j.msea.2010.07.061
Liu, L., He, S., Guo, Z., Li, J., Zhao, M., and Wu, Y. (2022). Enhancing degradation resistance of biomedical Mg-6Zn-0.5Zr alloy by the incorporation of nanodiamond. Mater. (Basel) 15, 6707–6714. doi:10.3390/ma15196707
Liu, W., Guo, G., Chen, F., and Chen, Y. (2019). Meteorological pattern analysis assisted daily PM2.5 grades prediction using SVM optimized by PSO algorithm. Atmos. Pollut. Res. 10, 1482–1491. doi:10.1016/j.apr.2019.04.005
Mei, R. B., Bao, L., Huang, F., Zhang, X., Qi, X. W., and Liu, X. H. (2018). Simulation of the flow behavior of AZ91 magnesium alloys at high deformation temperatures using a piecewise function of constitutive equations. Mech. Mater. 125, 110–120. doi:10.1016/j.mechmat.2018.07.011
Milenin, A., Kustra, P., Byrska-Wójcik, D., Wróbel, M., Packo, M., Sulej-Chojnacka, J., et al. (2020). The influence of the parameters of hot drawing of MgCa alloys wires on the mechanical properties that determine the applicability of the material as a high strength biodegradable surgical thread. Procedia Manuf. 50, 804–808. doi:10.1016/j.promfg.2020.08.145
Peng, X., Lin, P., Zhang, T., and Wang, J. (2013). Extreme learning machine-based classification of ADHD using brain structural MRI data. PLoS One 8, e79476. doi:10.1371/journal.pone.0079476
Raghunath, B. K., Raghukandan, K., Karthikeyan, R., Palanikumar, K., Pillai, U. T. S., and Gandhi, R. A. (2011). Flow stress modeling of AZ91 magnesium alloys at elevated temperature. J. Alloys Compd. 509, 4992–4998. doi:10.1016/j.jallcom.2011.01.182
Samantaray, S., Sahoo, A., and Agnihotri, A. (2023). Prediction of flood discharge using hybrid PSO-SVM algorithm in barak river basin. MethodsX 10, 102060. doi:10.1016/j.mex.2023.102060
Sani, S. A., Ebrahimi, G. R., Vafaeenezhad, H., and Kiani-Rashid, A. R. (2018). Modeling of hot deformation behavior and prediction of flow stress in a magnesium alloy using constitutive equation and artificial neural network (ANN) model. J. Magnes. Alloy. 6, 134–144. doi:10.1016/j.jma.2018.05.002
Seitz, J. M., Utermöhlen, D., Wulf, E., Klose, C., and Bach, F. W. (2011). The manufacture of resorbable suture material from magnesium-Drawing and stranding of thin wires. Adv. Eng. Mater. 13, 1087–1095. doi:10.1002/adem.201100152
Sheykhmousa, M., Mahdianpari, M., Ghanbari, H., Mohammadimanesh, F., Ghamisi, P., and Homayouni, S. (2020). Support vector machine versus random forest for remote sensing image classification: a meta-analysis and systematic review. IEEE J. Sel. Top. Appl. Earth Obs. Remote Sens. 13, 6308–6325. doi:10.1109/jstars.2020.3026724
Shi, B., Yang, C., Peng, Y., Zhang, F., and Pan, F. (2022). Anisotropy of wrought magnesium alloys: a focused overview. J. Magnes. Alloy. 10, 1476–1510. doi:10.1016/j.jma.2022.03.006
Silva, E. P., Buzolin, R. H., Marques, F., Soldera, F., Alfaro, U., and Pinto, H. C. (2021). Effect of Ce-base mischmetal addition on the microstructure and mechanical properties of hot-rolled ZK60 alloy. J. Magnes. Alloy. 9, 995–1006. doi:10.1016/j.jma.2020.09.018
Sun, L., Bai, J., and Xue, F. (2022). Evolutions of microstructure and texture of Mg-Gd alloy wires processed by cold drawing. J. Mater. Res. Technol. 21, 3961–3969. doi:10.1016/j.jmrt.2022.11.037
Sun, L., Bai, J., Xue, F., Tao, L., Chu, C., and Meng, J. (2017). Exceptional texture evolution induced by multi-pass cold drawing of magnesium alloy. Mater. Des. 135, 267–274. doi:10.1016/j.matdes.2017.09.027
Tahreen, N., Zhang, D. F., Pan, F. S., Jiang, X. Q., Li, C., Li, D. Y., et al. (2015). Characterization of hot deformation behavior of an extruded Mg-Zn-Mn-Y alloy containing LPSO phase. J. Alloys Compd. 644, 814–823. doi:10.1016/j.jallcom.2015.04.144
Wang, D., Zhu, Q., Wei, Z., Lin, B., Jing, Y., Shi, Y., et al. (2022). Hot deformation behaviors of AZ91 magnesium alloy: constitutive equation, ANN-based prediction, processing map and microstructure evolution. J. Alloys Compd. 908, 164580. doi:10.1016/j.jallcom.2022.164580
Wang, L., Zhao, Y. Q., Chen, H. M., Zhang, J., Liu, Y. D., and Wang, Y. N. (2018). Improvement of mechanical properties of magnesium alloy ZK60 by asymmetric reduction rolling. Acta Metall. Sin. 31, 63–70. doi:10.1007/s40195-017-0649-5
Wei, G., Peng, X., Hadadzadeh, A., Mahmoodkhani, Y., Xie, W., Yang, Y., et al. (2015). Constitutive modeling of Mg-9Li-3Al-2Sr-2Y at elevated temperatures. Mech. Mater. 89, 241–253. doi:10.1016/j.mechmat.2015.05.006
Wu, C. L., Zai, W., and Man, H. C. (2021a). Additive manufacturing of ZK60 magnesium alloy by selective laser melting: parameter optimization, microstructure and biodegradability. Mater. Today Commun. 26, 101922. doi:10.1016/j.mtcomm.2020.101922
Wu, J., Xu, Z., Qiao, H., Zhao, J., and Huang, Z. (2021b). Mechanical properties prediction of superalloy FGH4095 treated by laser shock processing based on machine learning. Mater. Lett. 297, 129970. doi:10.1016/j.matlet.2021.129970
Wu, Y. Z., Yan, H. G., Chen, J. H., Zhu, S. Q., Su, B., and Zeng, P. L. (2010). Hot deformation behavior and microstructure evolution of ZK21 magnesium alloy. Mater. Sci. Eng. A 527, 3670–3675. doi:10.1016/j.msea.2010.03.016
Xia, B., Huang, X., Chang, L., Zhang, R., Liao, Z., and Cai, Z. (2023). The arrangement patterns optimization of 3D honeycomb and 3D re-entrant honeycomb structures for energy absorption. Mater. Today Commun. 35, 105996. doi:10.1016/j.mtcomm.2023.105996
Xia, X., Zhang, K., Ma, M., and Li, T. (2020). Constitutive modeling of flow behavior and processing maps of Mg–8.1 Gd–4.5Y–0.3Zr alloy. J. Magnes. Alloy. 8, 917–928. doi:10.1016/j.jma.2020.02.018
Xie, J., Chen, Y., Yin, L., Zhang, T., Wang, S., and Wang, L. (2021). Microstructure and mechanical properties of ultrasonic spot welding TiNi/Ti6Al4V dissimilar materials using pure Al coating. J. Manuf. Process. 64, 473–480. doi:10.1016/j.jmapro.2021.02.009
Xiong, J., He, J. C., Leng, X. S., and Zhang, T. Y. (2023). Gaussian process regressions on hot deformation behaviors of FGH98 nickel-based powder superalloy. J. Mater. Sci. Technol. 146, 177–185. doi:10.1016/j.jmst.2022.10.063
Yang, K., Qin, N., Yu, H., Zhou, C., Deng, H., Tian, W., et al. (2022). Correlating multi-scale structure characteristics to mechanical behavior of Caprinae horn sheaths. J. Mater. Res. Technol. 21, 2191–2202. doi:10.1016/j.jmrt.2022.10.044
Yang, Y., Liu, Y., Guo, X., Yin, C., Yu, J., Zhang, Z., et al. (2023). The hot deformation behavior, microstructure and texture evolution of homogenized Mg–9Li–1Zn alloy. J. Mater. Res. Technol. 25, 2602–2618. doi:10.1016/j.jmrt.2023.05.266
Yuan, S., Wang, J., Zhang, L., and Jin, P. (2023). Revealing the deformation behavior and microstructure evolution in Mg-12Y–1Al alloy during hot compression. J. Alloys Compd. 946, 169462. doi:10.1016/j.jallcom.2023.169462
Zhang, P., Yin, Z. Y., and Jin, Y. F. (2021). State-of-the-Art review of machine learning applications in constitutive modeling of soils. Arch. Comput. Methods Eng. 28, 3661–3686. doi:10.1007/s11831-020-09524-z
Zhang, T., Cui, H., Cui, X., Chen, H., Zhao, E., Chang, L., et al. (2020). Effect of addition of small amounts of samarium on microstructural evolution and mechanical properties enhancement of an as-extruded ZK60 magnesium alloy sheet. J. Mater. Res. Technol. 9, 133–141. doi:10.1016/j.jmrt.2019.10.038
Zhi, C., Wu, Z., Lei, J., Huang, Z., Xv, H., Zhu, Y., et al. (2023). Deformation and fracture characterization of an Mg-Sn-Ca alloy using 3D processing maps. Met. (Basel) 13, 645. doi:10.3390/met13040645
Zhu, Q., Chen, J., Gou, G., Chen, H., and Li, P. (2017). Ameliorated longitudinal critically refracted-Attenuation velocity method for welding residual stress measurement. J. Mater. Process. Tech. 246, 267–275. doi:10.1016/j.jmatprotec.2017.03.022
Zou, C., Li, J., Wang, W. Y., Zhang, Y., Lin, D., Yuan, R., et al. (2021). Integrating data mining and machine learning to discover high-strength ductile titanium alloys. Acta Mater 202, 211–221. doi:10.1016/j.actamat.2020.10.056
Keywords: ZK60 magnesium alloy, hot deformation behaviors, constructive model, microstructure, wire-drawing
Citation: Liu F, Yang C, Liao Z and Wu H (2024) Prediction of flow stress and microstructure evolution mechanism during thermal tensile process of ZK60 alloy. Front. Mater. 10:1334815. doi: 10.3389/fmats.2023.1334815
Received: 07 November 2023; Accepted: 13 December 2023;
Published: 08 January 2024.
Edited by:
Attilio Vittorio Vargiu, Università di Cagliari, ItalyCopyright © 2024 Liu, Yang, Liao and Wu. This is an open-access article distributed under the terms of the Creative Commons Attribution License (CC BY). The use, distribution or reproduction in other forums is permitted, provided the original author(s) and the copyright owner(s) are credited and that the original publication in this journal is cited, in accordance with accepted academic practice. No use, distribution or reproduction is permitted which does not comply with these terms.
*Correspondence: Chong Yang, eWFuZ2Nob25nd2hAMTYzLmNvbQ==; Zijun Liao, emlqdW5AaHVzdC5lZHUuY24=