Research on temperature field reconstruction technology for single-dome combustion chambers based on flame image
 Miaomiao Chen
 Haiyan Jiang
 - Hunan Railway Professional Technology College, Zhuzhou, China
In order to compensate for the limitations of traditional temperature measurement methods, glass plates were installed on both sides of the single-dome combustion chamber test piece, and two CCD cameras observed the combustion flame in the furnace from different positions. The obtained flame radiation images were combined into a single image through the video capture card, and then the images were input into the reconstruction algorithm software to calculate the three-dimensional temperature field in the combustion chamber in real-time. The software could dynamically display the temperature distribution at three different positions in the chamber. This marked the first time that the temperature field in the combustion chamber was obtained using this new temperature measurement technology, which preliminarily verifies the feasibility of reconstructing the temperature field in the single-dome combustion chamber through flame image temperature measurement technology.
1 Introduction
The temperature distribution at the exit of the combustion chamber is one of the most critical parameters for aeroengine combustion chambers. It directly impacts the lifespan and reliability of the first-stage turbine guide vanes and working blades. As aero-engines continue to improve their propulsive-weight ratios (P/W), the exhaust temperature from the combustion chamber has been on the rise. The average temperature at the outlet of aeroengine combustion chambers has already reached 2000 K (Lin and Xu, 2008), with hot spots even exceeding 2500 K (Han et al., 2018; Zou et al., 2020).Especially hot spot locations are difficult to obtain through traditional temperature measurement techniques, which will cause huge difficulties for engine development.Consequently, in the pursuit of high-power aero-engines, addressing ultra-high-temperature measurements has become an indispensable challenge.
The combustion state of the fuel significantly influences the thermal energy conversion efficiency of the engine. If fuel combustion is unstable, it can lead to fuel nozzle coking and an increase in the emission of various pollutants (Jia and Luo, 2020). In sum, measuring temperature distribution within the engine combustion chamber is a formidable hurdle in the development of high-power-to-weight ratio engines. It also plays a crucial role in optimizing engine design and enhancing combustion efficiency.Therefore, research on the reconstruction of temperature fields within aeroengine combustion chambers holds substantial practical significance.
At present, commonly used methods for testing ultra-high temperatures include infrared spectroscopy, CARS, gas analysis, etc. Infrared radiation temperature measurement is significantly affected by the emissivity of the measured object, and issues such as the installation position of the temperature measurement probe on the receiver and cooling method need to be considered; The difficulty of applying CARS system in combustion chamber testers lies in the emission and reception of laser signals. The reflection and refraction of smoke particles can reduce the intensity of the received signal, and the equipment is complex; Gas analysis is influenced by collection speed and gas extraction; These methods are difficult to achieve ultra-high temperature measurement in engineering applications.Image-based temperature field measurement technology is a cutting-edge, non-contact measurement technique that has received increasing attention in recent years. In the late 1980s, Viskata established the radiation heat transfer equation for combustion systems (Shimoda et al., 1990), enabling the calculation of internal parameters such as radiation parameters, temperature fields, and boundary conditions using thermal radiation intensity data. In recent years, researchers have made significant progress in radiation transfer, solving ill-conditioned equations, and establishing models connecting radiation energy imaging to temperature. They have successfully generated three-dimensional temperature field distribution data and real-time displays with over 1000 discrete units in the furnace. The refresh cycle for the three-dimensional temperature field is less than 5 s, and the relative error remains within 5% (Liu and Zhou, 2023; Shi et al., 2022; Tang et al., 2022; Tu et al., 2022; Wang et al., 2022; Yuan et al., 2022).
Simultaneously, image temperature measurement technology has begun making its way into the aviation sector (Chen et al., 2018), with applications in flame image temperature measurement technology for various combustion chamber configurations such as the tail end of the combustion chamber, single/multi-dome combustors, and more. However, research on the application of image temperature measurement technology within full annular combustors is scarce. As the demand for high-power-to-weight ratio engines continues to grow, ultra-high temperature measurement is becoming a pressing challenge in engine development. The integration of image temperature measurement technology may offer a solution to this issue.
2 Materials and methods
The combustion area within the engine’s combustion chamber is subdivided into two segments: M units in the spatial region and N units in the wall region, totaling I units. The radiation data within the furnace is acquired using a CCD camera positioned at the outlet of the engine combustion chamber. The camera’s field of view angle is carefully chosen to encompass the entire combustion area of the combustion chamber, as depicted in Figure 1.
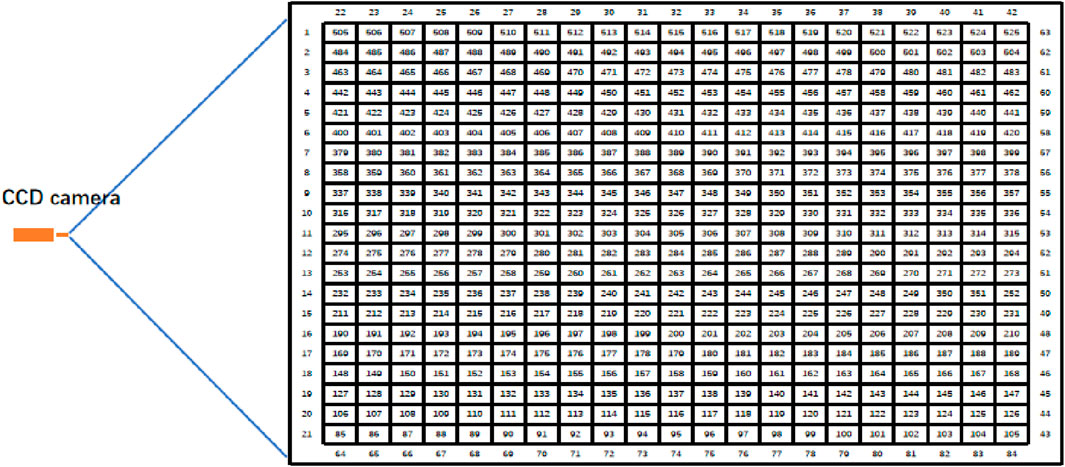
FIGURE 1. Diagram of combustion coverage area.
The radiation imaging model establishes a quantitative relationship between the flame radiation image and the three-dimensional temperature distribution within the furnace:
Among these, the elements of matrix A are determined by the radiation emitted from the ith grid cell and the portion received by the jth CCD pixel cell, primarily calculated using the DRESOR number. While there exists a connection between the flame radiation image and the three-dimensional temperature distribution in the combustion chamber, calculating temperature from radiation image data remains a challenging task. Hence, the new radiation imaging model establishes a quantitative relationship between the two-dimensional temperature image of the flame and the three-dimensional temperature distribution within the furnace:
Among them,
The calculation formula of flame two-dimensional temperature image is as follows:
The temperature image and the modified Tikhonov regularization method applied to linear problems can be used to calculate the blackbody radiation intensity
In addition, the flame radiation intensity is closely related to the flame temperature and radiation characteristic parameters, so the functional relationship between them can be established:
Where,
The least square solution of the equation is:
Thus, the iteration quantity of radiation characteristic parameters can be calculated. Combined with the temperature solution process, the flame temperature and radiation community characteristic parameters can be simultaneously retrieved from the flame radiation image through iteration.
3 Construction of test system
This system is mainly composed of high-temperature flame image detector and high-performance industrial control computer real-time monitoring system. The detector includes two CCD cameras. The schematic diagram of combustion chamber three-dimensional temperature field visual monitoring system is shown in Figure 2. The monitored area of this system is the whole space in the combustion chamber of all engines. Two CCDs are arranged on the left and right sides of the combustion chamber test piece respectively (as shown in Figure 2; Figure 3). The combustion flame in the combustion chamber is observed from different positions. Multiple flame radiation images obtained are combined into one image through the video acquisition card. The reconstruction algorithm software is used to calculate the three-dimensional temperature field in the combustion chamber in real time, dynamically display the three-dimensional temperature distribution in the combustion chamber, and obtain the real-time temperature field in the combustion chamber.
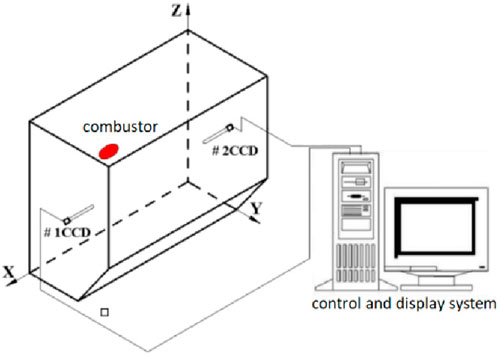
FIGURE 2. Structure diagram of combustion chamber three-dimensional temperature field visual monitoring system.
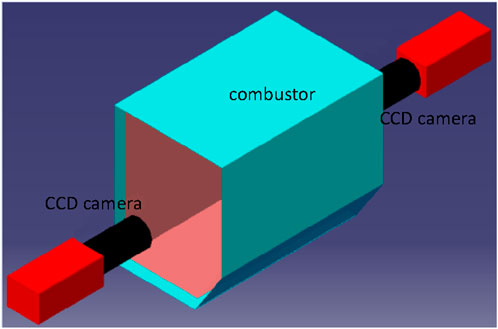
FIGURE 3. Front view of CCD camera installation position structure.
The temperature field reconstruction software utilizes the optical lens in Figure 1, representing the schematic of the three-dimensional temperature field visual monitoring system for the single-dome combustorr, to focus light emitted from the surface of the object being measured onto the CCD photosensitive surface. A color CCD camera then translates this light information into photoelectric signals, producing three primary color signals that include brightness data. The image acquisition card performs real-time signal acquisition and analog-to-digital conversion of standard video image signals, converting analog data into digital format.
Subsequently, the computer stores the digital image signals, establishes a visual system, and conducts temperature measurement calculations and temperature field reconstructions. The visualization system can automatically deliver accurate real-time temperature readings of the three-dimensional temperature field within the combustion chamber every few seconds. It also generates various visual representations, including two-dimensional plane maps, three-dimensional color isotherm diagrams, cloud diagrams of the combustion chamber, time-temperature trend graphs, regional temperature color maps, and more, as illustrated in Figure 4.
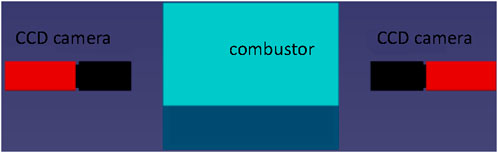
FIGURE 4. Side view of CCD camera installation position structure.
4 Experimental work
Taking the performance test of single-dome combustor as an example, the glass windows on both sides of the combustion chamber were installed, and the flame image in the combustion chamber was obtained in real time from the glass windows on both sides of the combustion chamber by CCD camera. A CCD camera captured the flame image in the combustion chamber of single-dome combustor, as shown in Figure 5 on the right side. It can be seen from the figure that the field of view angle of the camera lens met the requirements of shooting a panoramic view of the flame. Since the two cameras have the same frequency, the real-time flame images taken by the two cameras can be combined into one image through the video image acquisition card, as shown in Figure 6.
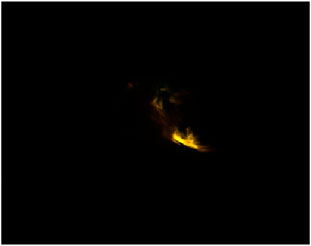
FIGURE 5. Original image taken by a single camera.
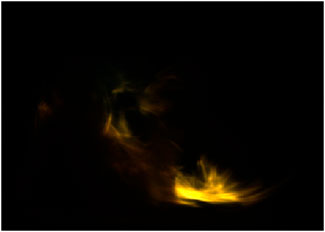
FIGURE 6. Image after image synthesis of two cameras.
Input the synthesized flame image (as shown in Figure 6) into the reconstruction algorithm software to calculate and reconstruct the three-dimensional temperature field in the combustion chamber in real time. The initial processed temperature field is shown in Figure 7. It is found that the place with flame is also a high temperature area by comparing Figure 6 and Figure 7. The flame image was restored in three dimensions, and four section positions are intercepted to obtain the temperature of the section respectively, as shown in Figure 8. The inversion of the temperature field in the combustion chamber is completed.
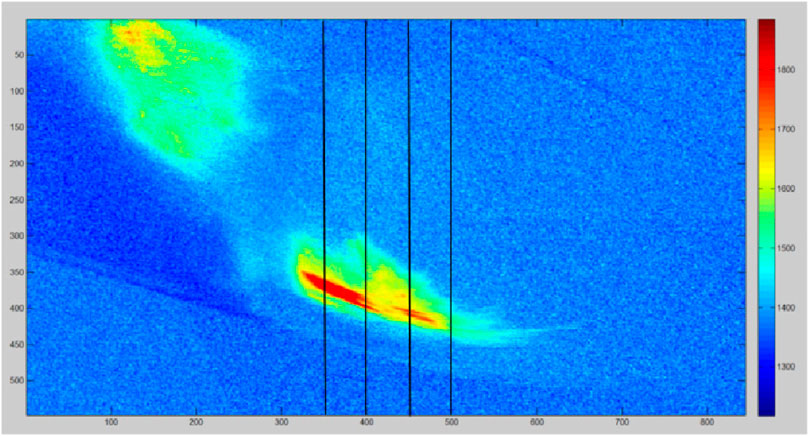
FIGURE 7. Shooting flame temperature (preliminary treatment).
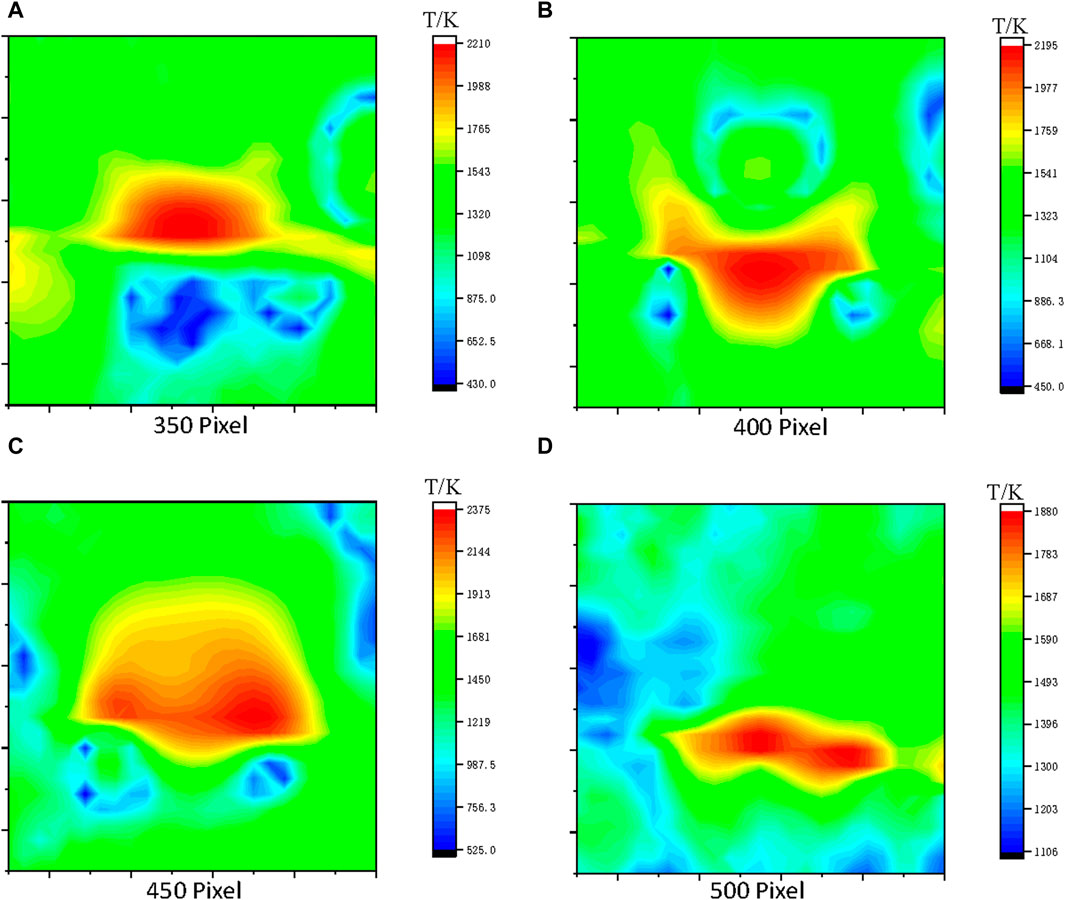
FIGURE 8. Inversion temperature field of four sections.
Figures 8A–D, it can be seen that the maximum temperature and minimum temperature at different section locations are different, indicating that different combustion intensity in the combustion area will lead to different temperatures. It can also be seen from the figure that as the temperature section moves backward, the maximum temperature also changes. When the maximum temperature is reached, it will drop again, which proves that the maximum combustion temperature is not in the nozzle outlet area, but in the middle and rear sections of the combustion chamber. Finally, the temperature will drop again after reaching the maximum temperature. From the above two points, it can be seen that the temperature characteristics obtained by using flame images are very consistent with the combustion characteristics in the combustion chamber, which fully proves the reliability of the technology of reconstructing the temperature field in the combustion chamber by using flame images. In addition, the combustion characteristics in the combustion can be truly reproduced by reconstructing the temperature field, which greatly makes up for the defects of the traditional temperature measurement technology.
5 Conclusion
Applying radiation imaging technology to the temperature measurement of aeroengine combustion chamber can realize real-time temperature measurement, which can make up for the following defects of traditional measurement methods:
(1) The defect of thermocouple point measuring temperature is solved, and the “field” temperature is really realized, which is no longer a pseudo temperature field.
(2) The temperature distribution in the combustion chamber of the single-dome combustor is realized by using CCD image temperature measurement for the first time, which solves the problem that combustion in the combustion chamber is a “black box,” and can obtain the full presentation of combustion characteristics in the combustion chamber in real time, which will help to understand the suitability of combustion design more comprehensively, and also help to shorten the development cycle of the combustion chamber.
(3) Using CCD image temperature measurement can not only observe the flame combustion status in real time, but also understand the performance of the combustion chamber more comprehensively, which will help to understand the suitability of combustion design more comprehensively, and also help to shorten the development cycle of the combustion chamber.
(4) Compared to traditional temperature testing methods, it is easier to obtain the position of the highest temperature point in the combustion chamber, which will help shorten research and development costs and cycles.
The flame image temperature measurement method can solve the defect that the existing temperature measurement methods cannot obtain continuous temperature field, and can also reduce the test risk and cost.However, due to the harsh and complex environment inside the combustion chamber, it is currently difficult to replace contact temperature measurement with flame image method, mainly because this method is greatly affected by the environment and materials. If the traditional method and image temperature measurement technology can be used together, it will greatly benefit engine research and save costs for engine development. Since the thermocouple cannot withstand high temperature above 1800°C in a narrow space, there is no good solution to verify the accuracy of image temperature measurement. The next step of this article is to verify the accuracy of image temperature measurement methods, such as adding more comparative temperature measurement experiments of temperature testing methods, and further verifying the feasibility of image temperature measurement technology.
Data availability statement
The original contributions presented in the study are included in the article/Supplementary material, further inquiries can be directed to the corresponding author.
Author contributions
MC: Conceptualization, Data curation, Formal Analysis, Funding acquisition, Validation, Visualization, Writing–original draft, Writing–review and editing. HJ: Conceptualization, Data curation, Funding acquisition, Methodology, Writing–original draft. XC: Conceptualization, Funding acquisition, Methodology, Writing–review and editing. CT: Funding acquisition, Methodology, Resources, Validation, Writing–review and editing.
Funding
The author(s) declare financial support was received for the research, authorship, and/or publication of this article. The authors gratefully acknowledge the financial support for this project from Natural Science Foundation of Hunan Province (2022JJ60007).
Conflict of interest
The authors declare that the research was conducted in the absence of any commercial or financial relationships that could be construed as a potential conflict of interest.
Publisher’s note
All claims expressed in this article are solely those of the authors and do not necessarily represent those of their affiliated organizations, or those of the publisher, the editors and the reviewers. Any product that may be evaluated in this article, or claim that may be made by its manufacturer, is not guaranteed or endorsed by the publisher.
References
Chen, M., Tan, C., Tang, Y., and Su, H. (2023). Research on reconstruction technology of temperature field in engine combustion chamber based on image thermometry. Proc. Bulg. Acad. Sci. 76 (7), 1084–1091. doi:10.7546/crabs.2023.07.12
Chen, M., Yuan, T., Jiang, R., and Zhang, X. (2018). Application of flame image technology in aeroengine combustion chamber ignition/flameout test. gas turbine test Res. 31 (01), 35–37+49. doi:10.3969/j.issn.1672-2620.2018.01.007
Han, B., Wang, M., Li, Y., and Zheng, Ma (2018). Calculation method of combustion chamber outlet gas temperature based on composition. J. Aeronautical Dyn. 33 (11), 2687–2693. doi:10.13224/j.cnki.jasp.2018.11.015
Jia, L., and Luo, Q. (2020). Experimental study on single head low pollution combustion chamber of aeroengine. Mach. Manuf. automation 49 (03), 63–66. doi:10.19344/j.cnki.issn1671-5276.2020.03.018
Lin, Y., and Xu, Q. (2008). Gaoen Liu Gas turbine combustion chamber. Beijing: National Defense Industry Press, 256–257.
Liu, S., and Zhou, M. (2023). End point temperature prediction of converter steelmaking based on caracteristics of flame image and spectrum. J. laser and Optoelectron Prog. 60 (4), 0430001. doi:10.3788/LOP213049
Shi, J., Qi, H., sun, A., an, X., and Ren, Y. (2022). Influence of calibration error of light field camera on three-dimensional temperature field reconstruction. Combust. Sci. Technol. 28 (02), 220–228.
Shimoda, H., Sugano, A., Kimura, T., Watanabe, Y., and Ishiyama, K. (1990). Prediction method of unburnt carbon for coal fired utility boiler using image processing technique of combustion flame. Energy Convers. IEEE Trans.5 (4), 640–645. doi:10.1109/60.63133
Tang, G., Yan, H., Wang, C., Liu, Z., Xin, Li, Yan, X., et al. (2022). Experimental study of hydrocarbon diffusion flame: effect of combustion atmosphere on flame spectrum and temperature (English). Spectrosc. Spectr. analysis 42 (05), 1654–1660. doi:10.3964/j.issn.1000-0593(2022)05-1654-07
Tu, H., Zhao, M., Qin, T., and Cai, H. (2022). Temperature field reconstruction based on imaging spectrum [j/ol]. J. Harbin Eng. Univ. 43 (07), 1036–1042.
Wang, Xu, Zhu, H., Liu, X., and Li, X. (2022). Inversion calculation of flame temperature field based on improved simulated annealing algorithm. Comput. Simul. 39 (06), 313–318.
Yuan, L., Si, M., Huang, W., Li, Mi, Luo, Z., and Cheng, Q. (2022). Inversion of ethylene flame temperature and carbon black based on machine learning [j/ol]. coal Convers. 1-12. doi:10.19726/j.cnki.ebcc.202205004
Keywords: aeroengine, single-dome combustor, combustion rig, ultra-temperature measurement, image temperature measurement, three dimensional temperature field reconstruction
Citation: Chen M, Jiang H, Cai X and Tan C (2024) Research on temperature field reconstruction technology for single-dome combustion chambers based on flame image. Front. Mater. 11:1339375. doi: 10.3389/fmats.2024.1339375
Received: 16 November 2023; Accepted: 29 February 2024;
Published: 13 March 2024.
Edited by:
Natrayan L, Saveetha University, IndiaReviewed by:
Suryanarayanan R, Vellore Institute of Technology (VIT), IndiaSubash Thanappan, KAAF University College, Ghana
V. R. Niveditha Sriram, Sathyabama Institute of Science and Technology, India
Jothi Arunachalam S, Karpaga Vinayaga College of Engineering and Technology, India
Prabhu Paramasivam, Mattu University, Ethiopia
Santhosh Mozhuguan Sekar, UCSI University, Malaysia
Copyright © 2024 Chen, Jiang, Cai and Tan. This is an open-access article distributed under the terms of the Creative Commons Attribution License (CC BY). The use, distribution or reproduction in other forums is permitted, provided the original author(s) and the copyright owner(s) are credited and that the original publication in this journal is cited, in accordance with accepted academic practice. No use, distribution or reproduction is permitted which does not comply with these terms.
*Correspondence: Chuanwu Tan, 20151360@hnrpc.com