Experimental study on the disintegration behavior and mechanism of red-bed mudstone in guangxi, China
 Tingyi Luo1
  Qingsong Zhang
- 1Guangxi Beitou Highway Construction & Investment Group Co., Ltd, Nanning, China
- 2Institute of Geotechnical Engineering, Southeast University, Nanjing, China
Red-bed mudstone (RBM) has the characteristics of being easily softened and disintegrated under dry and wet cycles. To investigate the weakening and disintegration characteristics of the RBM, typical mudstone from Guangxi highway slope was taken as the research object in this study. Disintegration tests, water chemistry tests, and microscopic tests were performed to investigate the disintegration mechanism of this RBM. The results indicate that the RBM exhibits strong disintegration, releasing soluble salts such as potassium chloride and sulfates during the disintegration process. The hydrolysis of clay minerals is the main cause of changes in ion concentration in the solution. Throughout the dry and wet cycles, the proportion of macro-pores and meso-pores significantly increases, while the percentage of small and micro-pores gradually decreases. Under the influence of dry and wet cycles, the contact area between particles gradually decreases, transitioning from face-to-face contact to face-edge contact and finally to edge-to-edge contact. These research findings provide a basis for the stability analysis and prevention of landslide hazards in the red-bed soft rock areas.
1 Introduction
Mudstone is a type of sedimentary rock that is characterized by its fine-grained nature and is composed primarily of silt- and clay-sized particles. Red-bed mudstone, a rock rich in clay content, undergoes disintegration into various-sized fragments under natural climatic conditions. Mudstone disintegration poses a high risk of slope destabilization disasters. The weakening of rocks due to softening is greatly influenced by mineral composition (Wang et al., 2015), structural characteristics, water, and temperature (Dhakal et al., 2002).
Considering that landslides are often triggered by water-related factors and have a considerable impact on soft rocks, extensive research has been conducted (Zhang D. et al., 2017). The pore water pressure in soil or rock materials were related to the content of clay minerals (Chilingar and Knight, 1960). Different types of weak rocks exhibit varying behaviors during softening and that cyclic wet-dry tests are more reliable than durability tests in determining the durability of weak rocks (Bell et al., 1997; Crosta, 1998). The damage of soft rock under dry wet cycles has been proved to be irreversible, and the strength decreases further with the increase of dry wet cycles (Wang et al., 2014; Zhang et al., 2015). N. Yoshida conducted a notable study to investigate the softening effect of water absorption in mudstone over time (Yoshida et al., 1997). Torres-Suarez et al. explored the control of the wet and dry cycle process in mudstone using a steam balance technique (Torres-Suarez et al., 2014). Shen et al. focused on the disintegration characteristics of red mudstone in the Three Gorges reservoir area and proposed a new fractal method for assessing the degree of mudstone disintegration (Shen et al., 2019). To meet the requirements of different work conditions, Gautam et al. and Fereidooni et al. comparatively investigated the disintegration characteristics of soft rock masses in indoor, acidic, and natural climate environments. The results of long-term monitoring of mudstone slopes have revealed that the shear strength of the rock-soil material decreased to 1/5 to 1/26 of its original strength when subjected to the disintegration effect caused by water seepage (Lowe et al., 2019). A Shakoor and TP Gautam compared laboratory test results with the weathering behavior under natural climatic conditions, investigating the disintegration characteristics of claystone, mudstone, silty sandstone, and sandstone in natural environments (Gautam and Shakoor, 2013; Shakoor and Gautam, 2015; Gautam and Shakoor, 2016; Gratchev et al., 2019). Terzaghi and Peck proposed the principle of pneumatic collapse mechanics from the perspective of rock-soil fissure structure (Terzaghi et al., 1996). Rock disintegration is caused by the combined effects of humidity and temperature changes, with humidity change being the main controlling factor (Gamble, 1971). After each wet and dry cycle, the samples and their disintegrated materials were sieved using standard screens, and the disintegration resistance index of the samples was calculated after each cycle. Previous studies have indicated a close association between the content of clay minerals and the disintegration characteristics of mudstones (Zhang H. et al., 2017). Micro-computed tomography, focused ion-beam scanning electron microscope (FIB-SEM) imaging methods have been conducted to analysis of mudstone sedimentary composition and quantified pore size distributions (Bollermann et al., 2022). Cano and Tomas introduced a disintegration index for assessing the disintegration of rocks, including mudstones, under wet and dry cycle conditions (Cano and Tomas, 2016). Furthermore, a significant increase in the disintegration mass of weathered mudstones during the initial five wet and dry cycles, followed by relatively stable mass changes (Vlastelica et al., 2018).
The climate in southern China is humid and hot. Taking Guangxi Province as an example, the average annual temperature is 21.4°C, with extreme maximum temperatures reaching 39.3°C. The average relative humidity ranges from 71% to 82% over many years, with a maximum of 100%. The average annual rainfall in Guangxi is 1415.4 mm, with a peak of 2043 mm recorded in 1981. The majority of rainfall occurs between April and September, accounting for over 80% of the total annual precipitation. Under continuous or heavy rainfall, as well as fluctuating reservoir levels, the accumulation blocks of red-bed soft rocks tend to disintegrate and weaken, leading to varying degrees of strength reduction in the red-layered soft rocks. Consequently, landslide stability is significantly compromised, posing substantial safety hazards to nearby residents and structures. Notably, the section of Guiliu Expressway from Yongfu to Huangguan traverses the red layer area, which has experienced multiple landslides and avalanches within a year due to slope instability. These incidents have adversely impacted vehicle safety and resulted in substantial economic losses.
This study aims to investigate the disintegration behavior of typical RBM in the Guangxi, China, under dry and wet cycles. RBM samples under different wet and dry cycles, and were subsequently subjected to analysis for grain size, microstructure observation, measurement of clay mineral contents, and chemical analysis of the soaking solution throughout the entire wet and dry process. By examining the disintegration characteristics of RBM in the Nanning Basin of Guangxi, this research provides a valuable reference for stability analysis and landslide prevention in areas characterized by red soft rocks.
2 Test materials
2.1 Sample collection
The RBM samples in this study were taken from the S210 highway project in Nanning, Guangxi. The slope at this area is highly susceptible to mudstone disintegration and slope collapses usually take place during rainfall. The sampling location is illustrated in Figure 1A. Figures 1B, C depict the primary macroscopic features of the slope at the sampling site. The mudstone slopes were stratified by the Cretaceous (K), Tertiary (E) and Quaternary Holocene (Q4), and the RBM in the section sampled was mainly from the Cretaceous Dapo Formation (K1d). The mudstone at the sampling point was mainly distributed in the area with a depth of 3.5 m–6.5m, and the surface was mostly covered with soft silt. Based on previous research on mudstone classification, the RBM in this paper can be classified as “Clay-rich siliceous mudstone” (Gamero-Diaz et al., 2013). There are two main characteristics of the mudstone slope: First, the slope mostly contains unequal thickness interlayer of sandstone and mudstone. Second, a lot of tension cracks and large voids exist in the mudstone. Therefore, both the weak interlayer and the fracture structure provide natural channels for water to enter into the interior matrix of the mudstone.
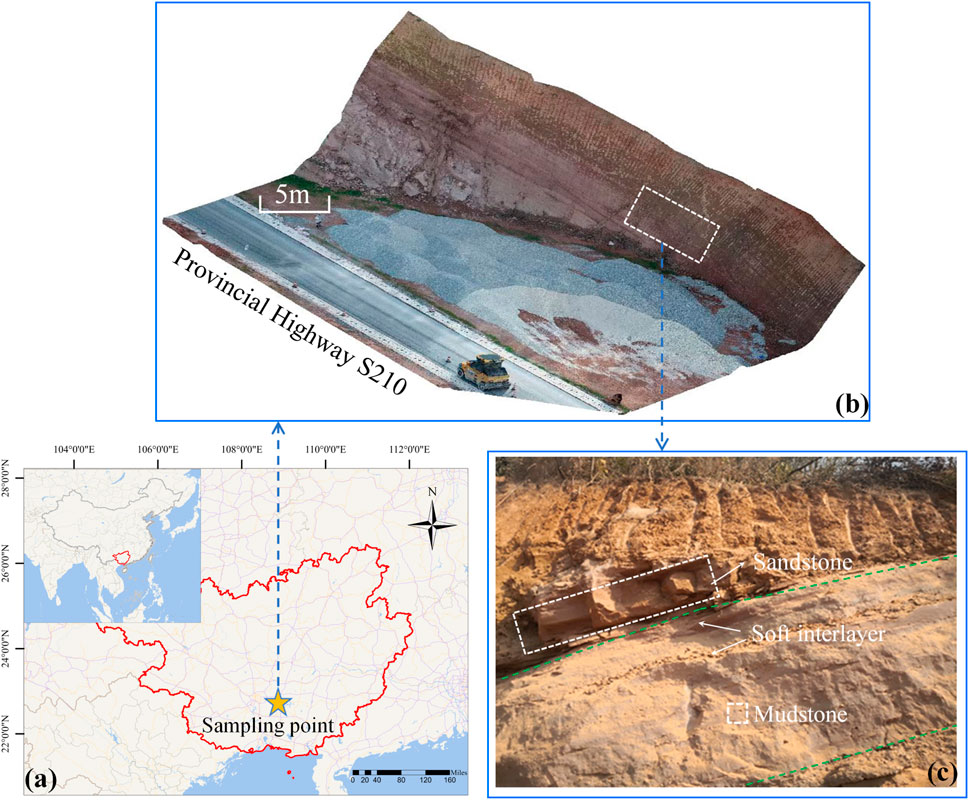
Figure 1. The location of sampling points and the engineering characteristics of mudstone slope, (A) Sample point, (B) Sample slope (C) Engineering characteristics of mudstone slope.
2.2 Basic properties of RBM sample
Extensive laboratory tests were conducted to evaluate the fundamental physical and mechanical properties of the RBM in this section. Table 1 presents the basic physical property indices obtained for the mudstone.

Table 1. Basic physical property index of RBM.
In compliance with the ASTM 2014 (ASTM, 2014), the unconfined compressive strength and softening coefficient of the RBM in dry, natural, and saturated states are depicted in Table 2. Analysis of the unconfined compressive strength in different states reveals the significant influence of moisture on the mechanical properties of the mudstone samples. Most samples exhibit the highest unconfined compressive strength in their natural state. In the dry state, the strength decreases as the mudstone samples lose water. In the saturated state, the unconfined compressive strength of the RBM samples reaches its minimum due to the complete saturation of their pores with water, making RBM more vulnerable to damage.
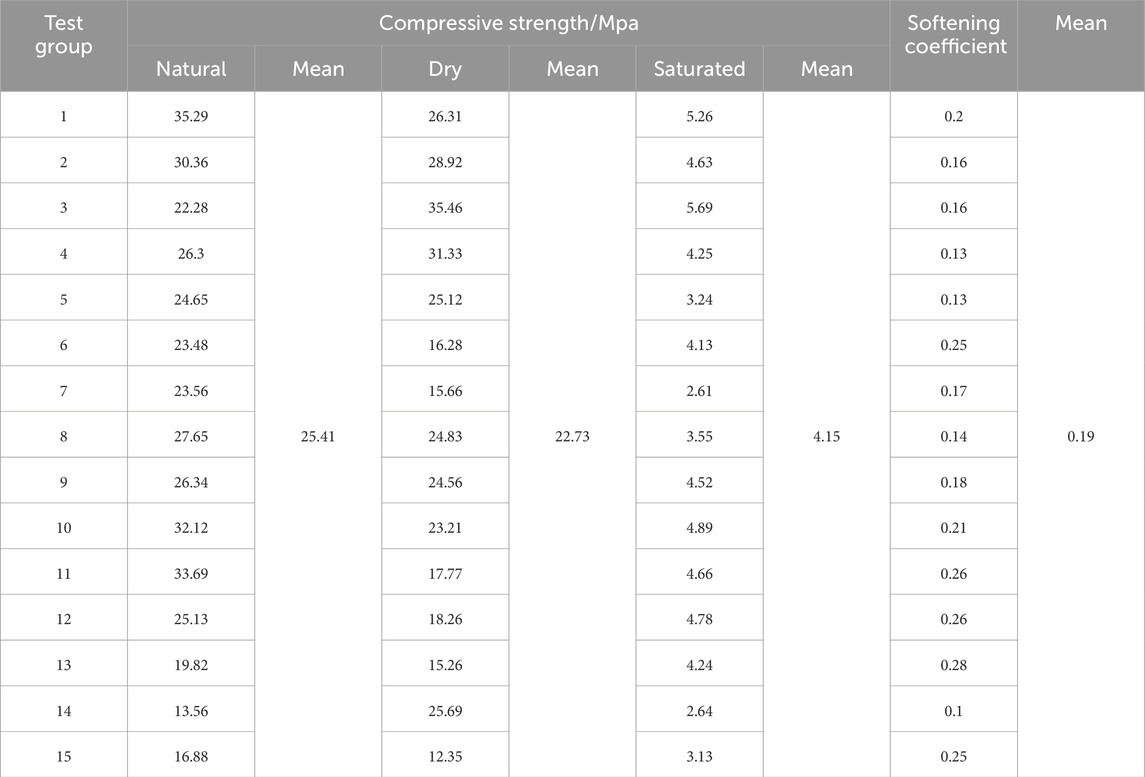
Table 2. Compressive strength and softening coefficient of the RBM.
3 Test methods
Based on the fundamental physical and mechanical properties of the RBM, a series of investigations were conducted to assess its disintegration characteristics.
3.1 Disintegration resistance and sieving test
The RBM exhibits strong disintegration characteristics. To examine the disintegration ability of the mudstone samples, multiple cycles of disintegration tests were conducted until complete disintegration was achieved. Each cycle involved recording the mass loss, and the disintegrated particles were subsequently sieved. The SCL-1 rock disintegration tester was used in this test.
The specific test process is as follows:
(1) Sample Preparation: 20 rounded specimens weighing between 40 and 60 g were created from mudstone samples collected at the site. The initial characteristics of each specimen were recorded.
(2) Oven Drying: Each sample was placed into the cylindrical sieve tube of the disintegration tester and then heated in an oven at a temperature range of 105°C–110°C until a constant mass was achieved. The mass of the sieve tube and sample was recorded after cooling to room temperature.
(3) Water Immersion: The sieve cylinder containing the specimen was submerged in a water tank filled with clean water, ensuring that the water level was 20 mm below the rotation axis. The sieve cylinder was rotated at a speed of 20r/min for 10 min.
(4) Drying and Sieving: The sieve cylinder and specimen were carefully dried and cooled. They were then removed from the apparatus and weighed. The retained specimen and disintegrated mudstone were sieved through different sieve sizes, including 5mm, 2mm, 1mm, 0.5mm, 0.25mm, 0.15mm, and 0.075 mm. The mass and particle morphology characteristics of each size group were recorded.
(5) Repeated Cycles: Steps 2 to 4 were repeated until complete disintegration of the mudstone was achieved.
The absolute disintegration resistance index, calculated using Eq. 1, provides a measure of the mudstone’s overall ability to resist disintegration.
Where:
Based on the calculation using the relative disintegration resistance index (Eq. 2), the findings demonstrate a clear pattern of change in the disintegration resistance of the rock with each successive cycle.
Where:
3.2 Experimental study of free disintegration under dry and wet cycle conditions
The testing device includes a hydrostatic balance, a water tank, an iron frame, and various measuring instruments. Samples were collected during the experiment to conduct hydrochemical and microscopic analyses.
Specific test steps are as follows:
(1) Sample preparation: Firstly, the integrity of the mudstone samples was carefully inspected to ensure there were no fractures or defects. Subsequently, the surface of each sample was meticulously cleaned to attain a smooth and pristine condition. To ensure test comparability and result accuracy, rectangular specimens measuring 50 mm × 50 mm × 100 mm were precisely cut from the same core following the ASTM suggested specification (ASTM 2014, 2016) (ASTM, 2014; ASTM, 2016).
(2) Grouping: To investigate the progressive disintegration of mudstone with varying durations of water immersion, a batch of mudstone specimens was selected, dried, and categorized into four groups denoted as A, B, C, and D. These four groups underwent synchronized drying and wetting cycles to facilitate comparative analysis.
(3) Drying: The samples from each group were removed from the water sink and subjected to a controlled drying process. They were placed within an oven and exposed to temperatures ranging from 105°C to 110°C until a constant mass was achieved. Subsequently, the samples were allowed to cool to room temperature within a desiccator.
(4) Wetting: The RBM samples were placed in a vacuum saturation cylinder, where the cylinder was filled with clean water to ensure complete submersion of the samples. During the 24-h wetting process of the RBM samples, a vacuum pump was continuously used to vacuum the water cylinder, ensuring a vacuum degree of −0.1 MPa. Observations of disintegration phenomena and mass variations were recorded. The remaining specimens from groups B and C were submerged in separate sinks, each containing an equal volume of deionized water. After a 24-h wetting process, the soaking solution of the mudstone from group B was sampled using a 20 mL plastic syringe. The collected solution was then filtered through a 0.45 μm filter head and subjected to tests measuring ionic concentration. For the specimens in group C, penetration tests were performed to assess their strength during the same period. Samples from group D were specifically set aside for microscopic examination.
(5) Repeat: Steps 3 and 4 were iterated until complete disintegration of the mudstone specimens was achieved.
3.3 Penetration test
The micro penetrometer is a simple and direct tool commonly employed in field soil investigations to assess the unconfined compressive strength of soils (Yasun, 2018). Given the significant reduction in mechanical strength of RBM after undergoing wet and dry cycles, the traditional unconfined compressive test cannot determine the destructive load capacity of the mudstone. Thus, the micro penetrometer was introduced to evaluate the physico-mechanical parameters of the mudstone after each cycle.
The testing apparatus utilized was the mechanical miniature penetrometer WXGR-4.0 (Figure 2A), which comprises a dynamometer and three indenters as A, B, and C. The force gauge employs spring compression deformation converted into a pointer scale for measurement, with a measurement error within ±1%. The instrument was positioned perpendicular to the soil sample, and the cone head was pressed 1 cm deep into the specimen to obtain the penetration pressure value.
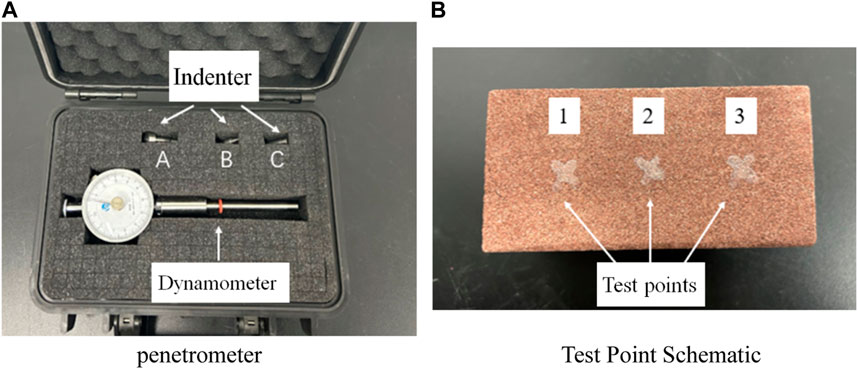
Figure 2. Schematic diagram of test instruments and test points, (A) Penetrometer, (B) Test points.
Due to the substantial loss of strength in the mudstone after the wet and dry cycles, it was not feasible to conduct uniaxial compression tests. Therefore, penetration tests were conducted to assess its mechanical strength. To enhance the reliability and accuracy of the test results, a minimum of three parallel tests were performed for each penetration test. The distance between the penetration point and the edge of the specimen, as well as the spacing between penetration points of parallel tests on the same specimen, were ensured to be at least three times the diameter of the probe. Three test points on the same specimen are illustrated in Figure 2B.
3.4 Hydrochemical test
The metal element content test, anion test, and zeta potential test were used to examine the release of ions in the aqueous solution and its impact on the solution environment upon the interaction between mudstone and water during dry-wet cycle. These tests aimed to elucidate the mineralogical responses and variations of the mudstone under different cycle conditions. Prior to experimentation, meticulous sampling procedures were followed. For the RBM, the soaking solution was subjected to agitation after each cycle to ensure homogeneous dispersion of suspended particles. A 20 mL aliquot of the resulting suspension was transferred into a dedicated reagent bottle for zeta potential analysis. Moreover, an 80 mL portion of the suspension was filtrated through a 45 μm filter membrane and evenly divided into three separate reagent bottles. Subsequently, each sample underwent the aforementioned hydrochemical analyses.
3.5 Microscopic analysis
Microscopic tests were conducted using X-ray diffraction (XRD), mercury intrusion porosimetry (MIP), and scanning electron microscopy (SEM) to examine the mineral composition, crystallization, and microscopic porosity of the RBM under different dry and wet cycle conditions.
4 Test results
4.1 Disintegration test results
Figure 3 illustrates the progressive changes observed in the specimens during the disintegration test. Initially, the mass of the specimens ranged from 40 to 60 g. After undergoing multiple cycles of drying and wetting, the RBM took on a flattened shape with irregular contours. Throughout the cycle process, the corners of the samples became rounded, and the grain size of the clasts gradually decreased. By the third cycle, significant disintegration occurred, resulting in residual clasts with a grain size of 1–3 cm. This grain size continued to decrease with each subsequent cycle.
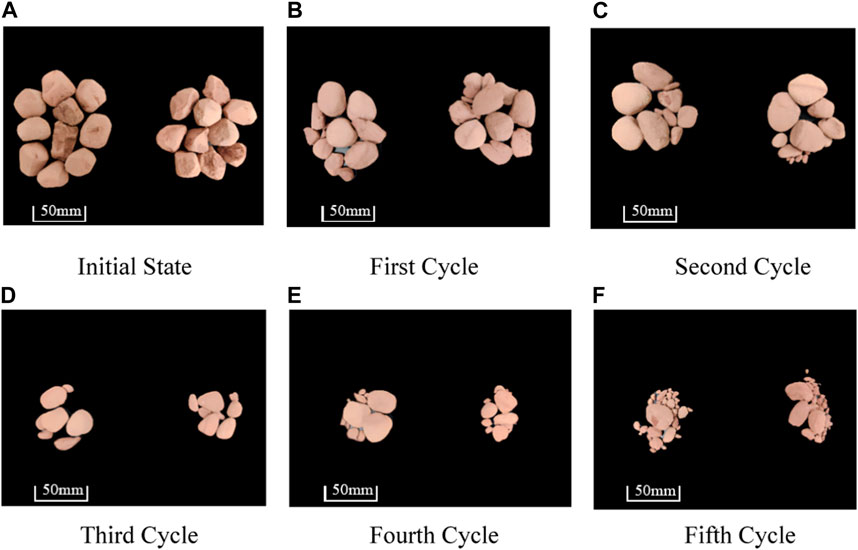
Figure 3. Variation of disintegration resistance in RBM, (A) Initial state, (B) First cycle, (C) Second cycle, (D) Third cycle, (E) Fourth cycle, (F) Fifth cycle.
The trend of the disintegration resistance index of the RBM as a function of the number of cycles is depicted in Figure 4, based on Eqs 1, 2.
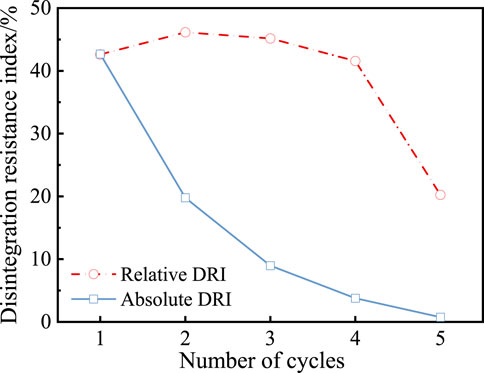
Figure 4. Effect of the number of dry and wet cycles on disintegration resistance index.
The results indicate that the RBM exhibits strong disintegration. After a single standard cycle, the mass of the disintegrated residue decreases from 509.6 g to 224.4g, resulting in an absolute disintegration resistance index of 42.66%. With an increasing number of wet and dry cycles, the absolute disintegration resistance index gradually decreased, indicating a weakening of the sample’s disintegration. This can be attributed to the mudstone samples’ surfaces becoming enveloped in muddy components during cycle, thereby reducing disintegration.
4.2 Wet and dry cycles’ effects on the physical and mechanical properties of RBM
4.2.1 Description of the morphology of RBM
The disintegration phenomenon of the mudstone was carefully observed and recorded during the first cycle. The disintegration pattern of the same surface of a RBM sample after each wet and dry cycle was documented, as depicted in Figure 5.
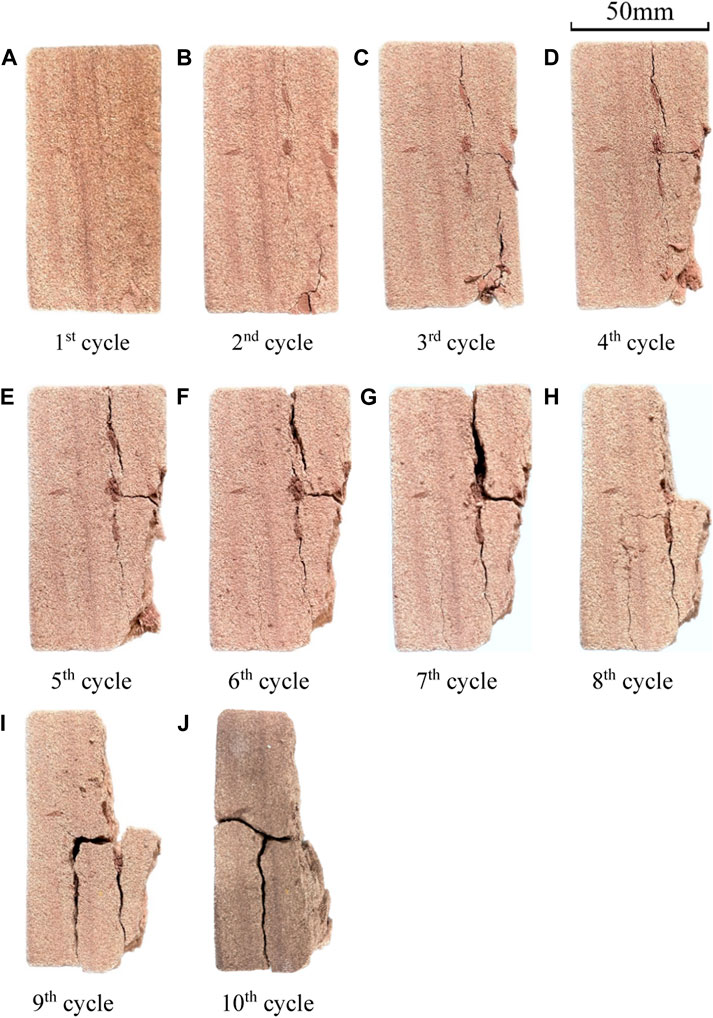
Figure 5. Morphology of the sample after different numbers of dry and wet cycles, (A) 1st cycle (B) 2nd cycle, (C) 3rd cycle, (D) 4th cycle, (E) 5th cycle, (F) 6th cycle, (G) 7th cycle, (H) 8th cycle, (I) 9th cycle, (J) 10th cycle.
Observing the disintegration phenomenon, it becomes evident that the degree of mudstone disintegration increases with a greater number of wet and dry cycles, with the disintegration rate also accelerating. During the first wet and dry cycle, it took over an hour for the mudstone to reach a stable disintegrated state. However, by the third wet and dry cycle, the mudstone only required approximately 20 min to reach this stable state upon encountering water again. Figure 5 shows the images of surface cracks on the samples after various wetting and drying cycles. The number of cracks gradually increased with each cycle. After four wet and dry cycles, primary and secondary cracks on the sample’s surface became interconnected, eventually leading to noticeable disintegration and fragment detachment. The depth of the cracks intensified with an increasing number of wet and dry cycles, resulting in a significant increase in the volume of disintegrated material. Ultimately, after ten cycles, the mudstone block disintegrated completely.
4.2.2 Remaining mass and penetration strength of RBM
Figure 6A illustrates the impact of the number of wet and dry cycles on the remaining mass of RBM disintegration. It is evident that during the dry and wet cycle disintegration test, the majority of mass loss occurs in the first cycle. After the fourth cycle, the rate of mass loss reaches its peak, with a maximum loss of 8%. After the eighth cycles, the mass loss stabilized, resulting in a remaining RBM mass of approximately 436 g. Based on these disintegration phenomena, it can be concluded that the disintegration process is predominantly characterized by crumbly falling disintegrated material.
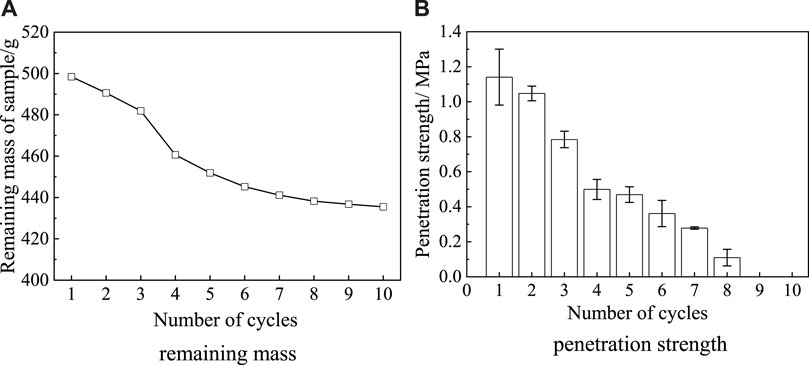
Figure 6. Effect of the number of dry and wet cycles on the penetration strength of mudstone, (A) Remaining mass, (B) Penetration strength.
Figure 6B demonstrates the effect of the number of wet and dry cycles on the penetration strength of RBM. As depicted in the figure, the strength of the mudstone experiences a significant decrease after the fourth wet and dry cycle. Specifically, the strength decreases by 56% compared to the penetration strength after one wet and dry cycle. Upon reaching the ninth and 10th wet and dry cycles, complete disintegration of the mudstone occurs, resulting in a 100% strength loss. This phenomenon arises from the inability of the RBM’s skeleton support structure to withstand external loads, leading to an extremely attenuated compressive capacity. Consequently, the rock loses its ability to resist compressive loads, rendering it susceptible to damage when subjected to any pressure.
By combining Figures 6A, B, it can be concluded that the mass disintegration rate and strength loss rate of RBM reach their maximum after four wet and dry cycles. After eight cycles, the disintegrated mass of RBM stabilizes, and its strength measures 0.1 MPa. Hence, a correlation can be established between the mass loss rate and the penetration strength loss rate of RBM under the influence of wet and dry cycle.
4.3 Effects of wet and dry cycles on the microstructure of RBM
4.3.1 MIP results analysis
The RBM samples, including original sample and samples subjected to wet and dry cycle, underwent mercury pressure testing. The distribution of pore size is illustrated in Figure 7A, while the cumulative mercury volume curves are presented in Figure 7B.
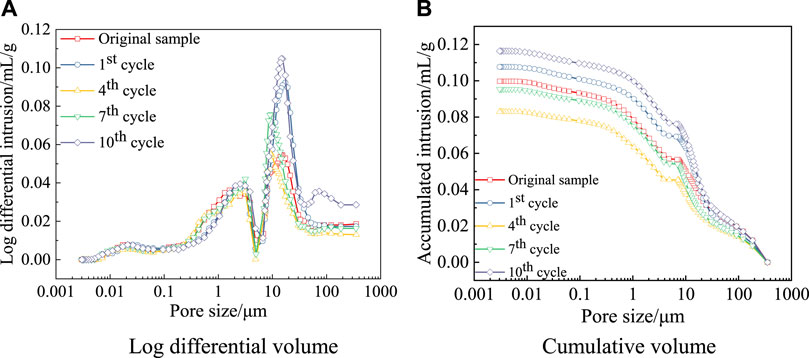
Figure 7. MIP test results of RBM under dry and wet cycles, (A) Log differential volume, (B) Cumulative volume.
Each peak in the curve represents the most frequently occurring aperture within a specific range, indicating the highest probability of pore occurrence. The area under the curve between any two apertures represents the volume of pores distributed within that range. As shown in the figures, the pore size distribution curves for all three conditions exhibit three distinct peaks. The peaks for the as-received samples correspond to pore diameters of 0.01–1 μm, 1–10 μm, and 10–100 μm, respectively. After one cycle of wet and dry cycle, the curve shifts slightly to the right in the 1–10 μm range, indicating an increase in pore size, an enlargement of the area under the 10–100 μm range, and an overall reduction in the curve’s area. With four cycles of wet and dry cycle, the peak further shifts to the right in the 1–10 μm range, accompanied by a noticeable decrease in the area under the 10–100 μm range compared to one cycle. After five cycles, the pore size distribution curve shows peaks in the 1–10 μm and 10–100 μm ranges, with the disappearance of peaks in the 0.01–0.1 μm range and a significant decrease in the area under the 1–10 μm range compared to the as-received sample. After seven cycles, the peak representing pore sizes between 10–100 μm increases, along with an increase in the corresponding area under the curve. Nine cycles result in further growth of the area under the 10–100 μm range, with the emergence of pore sizes larger than 100 μm. The trend continues, with the distribution of pore sizes between 10–100 μm increasing after ten cycles.
The cumulative mercury volume, reflecting the pore volume of the RBM, is shown in Figure 7B. Observing the figure, it becomes apparent that the amount of mercury feed is correlated with the number of wet and dry cycles. The mercury intake per Gram for the as-received sample, one cycle, four cycles, seven cycles, nine cycles, and ten cycles is recorded as 0.100 mL/g, 0.107 mL/g, 0.083 mL/g, 0.110 mL/g, 0.095 mL/g, 0.116 mL/g, and 0.116 mL/g, respectively. Considering the pattern of cumulative mercury feed, the initial four cycles decrease the cumulative pore volume due to the effects of wet and dry cycles. However, subsequent cycles significantly increase the cumulative pore volume. After the ninth and 10th cycles, the cumulative pore volume stabilizes, indicating complete disintegration of the mudstone.
Figure 8 depicts the distribution of different types of pore occupancy in RBM after dry and wet cycles. According to the MIP results, based on the characteristics of this mudstone, the pores can be divided into four groups according to pore size, including: macro-pores (>100 μm) meso-pores (10–100 μm), small-pores (1–10 μm), and micro-pores (<1 μm). It can be observed that the mudstone exhibits the following pore distribution characteristics based on the number of cycles: For the original sample, pores were dominated by small and micro-pores, with each type accounting for approximately 30% of the total pore volume. The proportion of macro-pores and micro-pores in the total pore volume is relatively small, accounting for 17.18% and 21.8%, respectively. As the number of wet and dry cycles increased, the proportion of macro-pores and meso-pores significantly increased, accounting for approximately 80% of the total pore volume. The percentage of small-pores gradually decreased from 28.34% to 12.07%. Similarly, the proportion of micro-pores decreased from 21.26% to 7.27%, indicating that wet and dry cycles have a more substantial impact on the larger pores compared to the smaller pores.
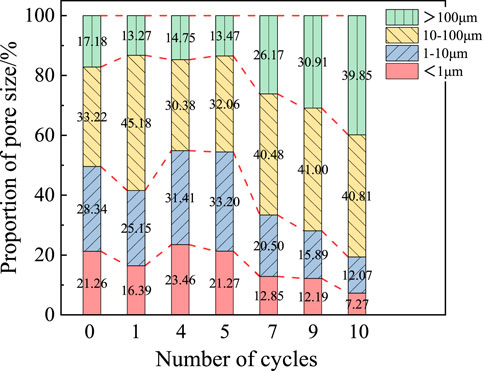
Figure 8. Distribution of different types of pore occupancy in RBM after dry and wet cycles.
4.3.2 SEM analysis
The microstructure of RBM encompasses the shape and size of mineral particles and their aggregates, as well as the distribution of fissures and pores, all of which significantly influence the physical and mechanical properties of mudstone in addition to its mineral composition. Figure 9 presents SEM images of the topography of the RBM at ×100 and ×20,000 magnification under different cycle conditions.
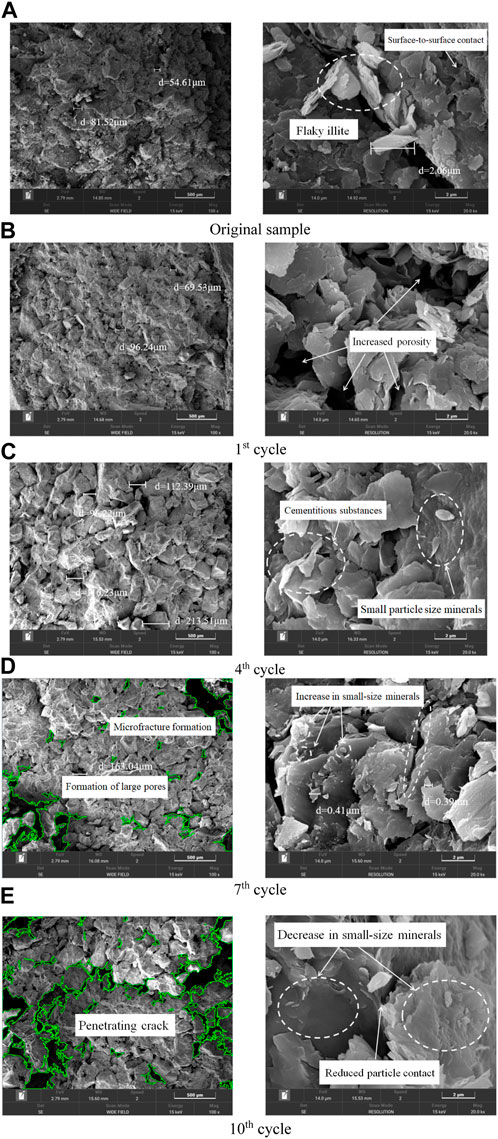
Figure 9. SEM images of RBM under different cycles, (A) Original sample, (B) 1st cycle, (C) 4th cycle, (D) 7th cycle, (E) 10th cycle.
As shown in Figure 9A, the original sample primarily exhibits lamellar clay grains as the form of internal cementation, with mineral particles mainly bonded through face-to-face contact. Consequently, the number of intergranular pores is small, and the pore diameter is relatively small. However, Figure 9B reveal that after one wet and dry cycle, intergranular expansion occurs due to the hydrophilicity of ilmenite. This expansion is facilitated by water molecules, and subsequent drying results in shrinkage, leading to an increase in the number of pore spaces and the enlargement of pore diameter within the mudstone. As a result, the contact area between mudstone minerals decreases, transitioning gradually from predominantly face-to-face contact to a combination of face-to-face and face-to-side contact. Figure 9C illustrate the microstructure of the mudstone specimen after four wet and dry cycles. Intense disintegration reactions among mudstone particles are observed, leading to clearer outlines of the particles. The presence of inter-particle cementing material is notably reduced, and individual pores become filled through the disintegration of small particles. However, the overall number of pores increases significantly, accompanied by a considerable enlargement in pore diameter. Additionally, some penetrating cracks emerge. Figure 9D depict the mudstone after seven wet and dry cycles, highlighting a substantial number of microfractures. The clay minerals, predominantly illite, continue to disintegrate, resulting in a gradual reduction in mineral size and nearly disappearing cementation. The remaining structural skeleton of the mudstone particles assumes a honeycomb-like appearance. Figure 9D reveals that after ten wet and dry cycles, the mudstone particles form an extremely loose skeletal structure, and the interparticle cementation disappears.
4.4 Mineral hydration of RBM during wet and dry cycles
4.4.1 Changes in ion concentration in solution
Figure 10A displays the relationship between the number of wet and dry cycles and the cation concentration in the solution during the disintegration of RBM. Sodium (Na+), calcium (Ca2+), potassium (K+), and magnesium (Mg2+) were measured due to their significant impact on mudstone disintegration during wet and dry cycle. Analysis of the ion results reveals that the ion content in the aqueous solution undergoes constant changes after each cycle, indicating various forms of chemical interactions occurring between the water and rock during each wet and dry cycle. This phenomenon primarily arises from the physical and chemical reactions between water and minerals like quartz, illite, and feldspar, which constitute the main mineral components of mudstone. Throughout the dry and wet cycle process, the concentration of K+, Mg2+, and Ca2+ ions in the soaking solution fluctuates to some extent, whereas the concentration of Na+ ions remain relatively stable with insignificant fluctuations compared to the initial solution. It is noteworthy that the concentrations of K+, Mg2+, and Ca2+ remain relatively stable during the first two wet and dry cycles, while there is a rapid increase in concentration during the third disintegration process. Similarly, the concentration of Ca2+ ions undergo significant changes during the third wet and dry cycle.
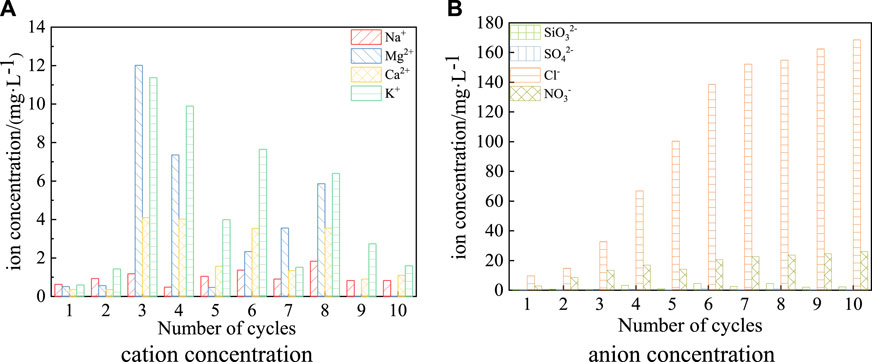
Figure 10. Relationship between the cation concentration of soaking solution and the number of wet and dry cycles, (A) Cation concentration, (B) Anion concentration.
Figure 10B presents the relationship between the number of wet and dry cycles and the anion concentration in the solution during the disintegration of RBM. The concentrations of sulfate (SO42-), silicate (SiO32-), and nitrate (NO3−) in the solution reach a stable state after the third disintegration. Conversely, the concentration of chloride (Cl−) continues to increase with each subsequent disintegration, with a faster rate of increase observed between the third and sixth cycles. After the sixth cycle, the concentration of Cl− reaches a stable rising state. The continuous increase in Cl− concentration in the solution results from the ongoing dissolution of soluble salts in the mudstone.
Table 3 presents the correlation analysis of anion concentration with the number of cycles using SPSS software. The analysis reveals significant correlations between SO42- and K+, Ca2+, and Mg2+, as well as between NO3- and K+. Additionally, Cl− exhibits a significant positive correlation with K+. Therefore, the soluble salt components that participate in the disintegration process are mainly composed of calcium sulfate, magnesium sulfate, potassium nitrate, potassium chloride, and potassium sulfate. Hence, it is inferred that the main loss of soluble salts in the aqueous solution during mudstone disintegration is attributed to potassium chloride and sulfate minerals.
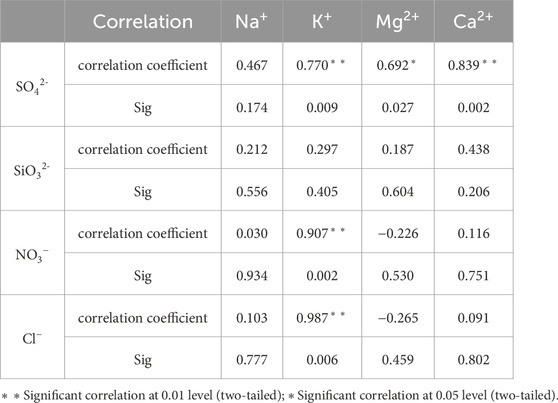
Table 3. Spearman’s Rho correlation coefficient Table.
Based on the ion concentration in solution, it can be inferred that when mudstone, primarily composed of illite as the main clay mineral, is immersed in water, it initially undergoes the following hydrolysis reaction:
As the reaction progresses and the solution gradually becomes alkaline, the clay minerals mainly undergo the following chemical reactions:
4.4.2 Changes in mineral compositions
Original mudstone samples and samples subjected to wet and dry cycle were selected for XRD test, followed by qualitative and quantitative analysis. The XRD spectrum is presented in Figure 11A. Based on the test results, the relative content of minerals can be determined as the number of wet and dry cycles changes, as shown in Figure 11B. Before the wet and dry cycles, quartz accounted for 42.0% of the total mass in the RBM, but it partially dissolved during the cycles, resulting in a decrease in its content to 38.8% after ten cycles. The initial clay mineral content was mainly illite, comprising 23.2% of the total mass. With an increase in the number of wet and dry cycles, the content of illite reached its lowest point of 16.5% during the fourth cycle, and after ten cycles, it increased to 21.3%. Hematite content decreased with the number of wet and dry cycles until fully dissolving in the aqueous solution, reaching 0% in the mudstone. Sodium feldspar and potassium feldspar content in the mudstone exhibited a trend of initial increase followed by a decrease as the number of wet and dry cycles increased, with overall content remaining relatively stable. Sodium feldspar content increased, while potassium feldspar content displayed a pattern of fluctuation without significant change.
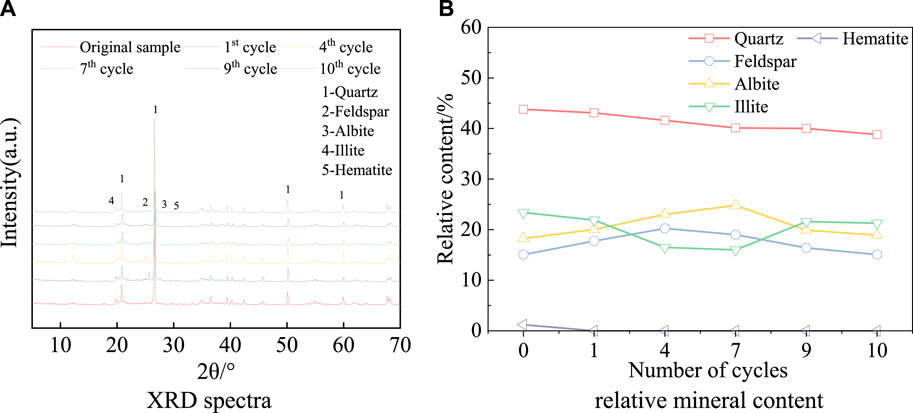
Figure 11. XRD test results of RBM under dry and wet cycles, (A) XRD spectra (B) Relative mineral content.
5 Conclusion
This study systematically analyzes the disintegration behavior and mechanism of RBM under the action of dry wet cycles. Quantitative analysis was conducted on the changes in mudstone during the whole dry wet cycles from four aspects: mechanical properties, ion concentration in the soaking solution, mineral components, and pore distribution. The following conclusions can be drawn:
(1) The disintegration resistance test reveals that the red-bed mudstone undergoes significant disintegration, eventually reaching complete disintegration after five cycles. The absolute disintegration index decreases with an increasing number of cycles, while the relative disintegration index initially increases and then decreases with the number of wet and dry cycles. The degree of disintegration of this red-bed mudstone increases as the number of wet and dry cycles increases. The mudstone experiences the highest level of disintegration after four wet and dry cycles, with a mass loss rate of 8% and a reduction in mechanical strength of 56%. After eight wet and dry cycles, the mudstone no longer disintegrates and loses its strength completely.
(2) Throughout the wet and dry cycles, the main cations in the solution of this red-bed mudstone during wet and dry cycle are K+ and Mg2+, while the dominant anion is Cl−. The main soluble salts lost during mudstone disintegration are potassium chloride and sulfate.
(3) The mineral components of this red mudstone demonstrate the following patterns of change during wet and dry cycles: quartz content decreases, sodium feldspar and potassium feldspar content initially increase and then decrease, illite content decreases and then increases, hematite content decreases, ultimately dissolving completely in the aqueous solution.
(4) Based on pore size, the various types of pores in this red-bed mudstone are classified as follows: Macro-pores (>100 μm), meso-pores (100–10 μm), small-pores (1–10 μm), and micro-pores (<1 μm). Throughout the dry and wet cycles, the proportion of macro-pores and meso-pores significantly increased, accounting for approximately 80% of the total pore volume. The percentage of small-pores gradually decreased from 28.34% to 12.07%. Similarly, the proportion of micro-pores decreased from 21.26% to 7.27%, respectively.
This study presents a systematic characterization of the water-induced collapse of RBM at multiple scales, which is of great significance for understanding the degradation and disaster mechanisms of RBM. Other interesting issues, such as the accurate correlation between macroscopic and microscopic experimental results and the on-site application of indoor experimental results, require further research in the future.
Data availability statement
The raw data supporting the conclusion of this article will be made available by the authors, without undue reservation.
Author contributions
TL: Data curation, Investigation, Project administration, Writing–original draft. QZ: Conceptualization, Data curation, Writing–review and editing. CG: Investigation, Visualization, Writing–review and editing. YT: Project administration, Writing–review and editing. SZ: Methodology, Writing–review and editing. YW: Investigation, Writing–review and editing.
Funding
The author(s) declare financial support was received for the research, authorship, and/or publication of this article. This research was supported by the National Natural Science Foundation of China (Grant No. 41877240).
Acknowledgments
The authors would like to acknowledge the financial support provided by the National Natural Science Foundation of China (Grant No. 41877240).
Conflict of interest
Authors TL, CG, YT, and SZ were employed by Guangxi Beitou Highway Construction & Investment Group Co., Ltd.
The remaining authors declare that the research was conducted in the absence of any commercial or financial relationships that could be construed as a potential conflict of interest.
Publisher’s note
All claims expressed in this article are solely those of the authors and do not necessarily represent those of their affiliated organizations, or those of the publisher, the editors and the reviewers. Any product that may be evaluated in this article, or claim that may be made by its manufacturer, is not guaranteed or endorsed by the publisher.
References
ASTM (2014). Standard test methods for compressive strength and elastic moduli of intact rock core specimens under varying states of stress and temperatures. West Conshohocken: ASTM International.
ASTM (2016). Standard test method for splitting tensile strength of intact rock core specimens. West Conshohocken: ASTM International.
Bell, F. G., Entwisle, D. C., and Culshaw, M. G. (1997). A geotechnical survey of some British Coal Measures mudstones, with particular emphasis on durability. Eng. Geol. 46 (2), 115–129. doi:10.1016/s0013-7952(96)00106-8
Bollermann, T., Yuan, T., Kulenkampff, J., Stumpf, T., and Fischer, C. (2022). Pore network and solute flux pattern analysis towards improved predictability of diffusive transport in argillaceous host rocks. Chem. Geol. 606, 120997. doi:10.1016/j.chemgeo.2022.120997
Cano, M., and Tomas, R. (2016). Proposal of a new parameter for the weathering characterization of carbonate flysch-like rock masses: the potential degradation index (PDI). Rock Mech. Rock Eng. 49 (7), 2623–2640. doi:10.1007/s00603-016-0915-2
Chilingar, G. V., and Knight, L. (1960). Relationship between pressure and moisture content of kaolinite, illite, and montmorillonite clays. AAPG Bull. 44 (1), 101–106. doi:10.1306/0bda5f81-16bd-11d7-8645000102c1865d
Crosta, G. (1998). Slake durability vs ultrasonic treatment for rock durability determinations. Int. J. Rock Mech. Min. 35 (6), 815–824. doi:10.1016/s0148-9062(98)00006-0
Dhakal, G., Yoneda, T., Kato, M., and Kaneko, K. (2002). Slake durability and mineralogical properties of some pyroclastic and sedimentary rocks. Eng. Geol. 65 (1), 31–45. doi:10.1016/s0013-7952(01)00101-6
Gamble, J. C. (1971). Durability - plasticity classification of shales and other argillaceous rocks.
Gamero-Diaz, H., Miller, C., and Lewis, R. (2013) “sCore: a mineralogy based classification scheme for organic mudstones.” Paper presented at the SPE Annual Technical Conference and Exhibition, New Orleans, Louisiana, USA, September 2013.
Gautam, T. P., and Shakoor, A. (2013). Slaking behavior of clay-bearing rocks during a one-year exposure to natural climatic conditions. Eng. Geol. 166, 17–25. doi:10.1016/j.enggeo.2013.08.003
Gautam, T. P., and Shakoor, A. (2016). Comparing the slaking of clay-bearing rocks under laboratory conditions to slaking under natural climatic conditions. Rock Mech. Rock Eng. 49 (1), 19–31. doi:10.1007/s00603-015-0729-7
Gratchev, I., Pathiranagei, S. V., and Kim, D. H. (2019). Strength properties of fresh and weathered rocks subjected to wetting-drying cycles. Geomech. Geophys Geo 5 (3), 211–221. doi:10.1007/s40948-019-00104-5
Lowe, M.-A., Mathes, F., Loke, M. H., McGrath, G., Murphy, D. V., and Leopold, M. (2019). Bacillus subtilis and surfactant amendments for the breakdown of soil water repellency in a sandy soil. Geoderma 344, 108–118. doi:10.1016/j.geoderma.2019.02.038
Shakoor, A., and Gautam, T. P. (2015). Influence of geologic and index properties on disintegration behavior of clay-bearing rocks. Environ. Eng. Geosci. 21 (3), 197–209. doi:10.2113/gseegeosci.21.3.197
Shen, P., Tang, H., Huang, L., and Wang, D. (2019). Experimental study of slaking properties of red-bed mudstones from the Three Gorges Reservoir area. Mar. Georesour Geotec. 37 (8), 891–901. doi:10.1080/1064119x.2018.1504839
Terzaghi, K., Peck, R. B., and Mesri, G. (1996). Soil mechanics in engineering practice. New York, NY: John Wiley and Sons.
Torres-Suarez, M. C., Alarcon-Guzman, A., and Berdugo-De Moya, R. (2014). Effects of loading-unloading and wetting-drying cycles on geomechanical behaviors of mudrocks in the Colombian Andes. J. Rock Mech. Geotech. 6 (3), 257–268. doi:10.1016/j.jrmge.2014.04.004
Vlastelica, G., Miscevic, P., and Cvitanovic, N. S. (2018). Durability of soft rocks in Eocene flysch formation (Dalmatia, Croatia). Eng. Geol. 245, 207–217. doi:10.1016/j.enggeo.2018.08.015
Wang, L. L., Bornert, M., Heripre, E., Chanchole, S., Pouya, A., and Halphen, B. (2015). The mechanisms of deformation and damage of mudstones: a micro-scale study combining esem and dic. Rock Mech. Rock Eng. 48 (5), 1913–1926. doi:10.1007/s00603-014-0670-1
Wang, L. L., Bornert, M., Heripre, E., Yang, D. S., and Chanchole, S. (2014). Irreversible deformation and damage in argillaceous rocks induced by wetting/drying. J. Appl. Geophys 107, 108–118. doi:10.1016/j.jappgeo.2014.05.015
Yasun, A. S. (2018). Capability of pocket penetrometer to evaluate unconfined compressive strength of baghdad clayey soil. Al-Nahrain J. Eng. Sci. 21 (01), 66–73. doi:10.29194/njes21010066
Yoshida, N., Nishi, M., Kitamura, M., and Adachi, T. (1997). Analysis of mudstone deterioration and its effect on tunnel performance. Int. J. Rock Mech Min. 34, 353.e1-353.e19. doi:10.1016/s0148-9062(97)00076-4
Zhang, B. Y., Zhang, J. H., and Sun, G. L. (2015). Deformation and shear strength of rockfill materials composed of soft siltstones subjected to stress, cyclical drying/wetting and temperature variations. Eng. Geol. 190, 87–97. doi:10.1016/j.enggeo.2015.03.006
Zhang, D., Chen, A., Zhao, J., Lu, C., and Liu, G. (2017a). Quantitative model prediction of the combined effect of moisture content and temperature on purple mudstone decay in south-western China. Geomorphology 295, 656–661. doi:10.1016/j.geomorph.2017.07.023
Keywords: red-bed mudstone, disintegration, dry and wet cycles, ion concentration, pore size distribution
Citation: Luo T, Zhang Q, Gui C, Tang Y, Zhou S and Wang Y (2024) Experimental study on the disintegration behavior and mechanism of red-bed mudstone in guangxi, China. Front. Mater. 11:1357116. doi: 10.3389/fmats.2024.1357116
Received: 18 December 2023; Accepted: 01 March 2024;
Published: 19 March 2024.
Edited by:
Songtao Lv, Changsha University of Science and Technology, ChinaReviewed by:
Jue Li, Chongqing Jiaotong University, ChinaZhenning Shi, Changsha University of Science and Technology, China
Copyright © 2024 Luo, Zhang, Gui, Tang, Zhou and Wang. This is an open-access article distributed under the terms of the Creative Commons Attribution License (CC BY). The use, distribution or reproduction in other forums is permitted, provided the original author(s) and the copyright owner(s) are credited and that the original publication in this journal is cited, in accordance with accepted academic practice. No use, distribution or reproduction is permitted which does not comply with these terms.
*Correspondence: Qingsong Zhang, zqs1019@seu.edu.cn