The effect of Te-based lead-free glass powder containing Ge and Ag+ on the contact formation and electrical performance of silicon solar cells
 Xianglei Yu
 Wei Li
 Hu Sun1
  Yang Yu
- 1Faculty of Material Science and Engineering, Kunming University of Science and Technology, Kunming, China
- 2Sino-Platinum Metals Co. LTD, Kunming, China
- 3Sino-Platinum Electronic Materials (Yunnan) Co. LTD, Kunming, China
- 4Centre for Infrastructure Engineering and Safety, School of Civil and Environmental Engineering, The University of New South Wales, Sydney, NSW, Australia
The Te-based glass powder exhibits distinctive characteristics such as a low melting temperature and high chemical stability, rendering it a focal point of research in the realm of glass powder applications for solar cells. In this investigation, a pioneering Ge-containing Te-based lead-free glass powder was synthesized, and the influence of GeO2 content on critical parameters such as glass transition temperature (Tg), high-temperature fluidity, high-temperature wettability, acid and alkali resistance, as well as the network structure of the glass, was systematically explored. At an optimal GeO2 content of 8%, the glass powder displayed the lowest Tg (437°C), accompanied by a subdued crystallization reaction. The high-temperature fluidity and wettability exhibited favorable characteristics, indicating that the inclusion of GeO2 in the glass powder resulted in an enhanced interface contact. Building upon this foundation, techniques to augment the Ag+ content within the glass powder were investigated, along with the interaction between Ag+ and the SiNx anti-reflection layer or silicon on the surface of crystalline silicon solar cells. It was discerned that the Ag+ content in the glass powder significantly influences the deposition of silver microcrystals on the surface of crystalline silicon, thereby impacting the contact resistance of the solar cell. Then influences the series resistance and photoelectric conversion efficiency of the solar cell.
1 Introduction
In recent years, amid the continual surge in energy demand, solar energy, recognized as a renewable and clean energy source, has experienced rapid development, garnering widespread attention in the realm of solar cell research (Yuan et al., 2017; Jinling et al., 2022; Yinghu et al., 2023). Screen-printed photovoltaic silver paste is extensively employed in the front metallization of monocrystalline silicon solar cells due to its economic viability and straightforward preparation process. The resultant silver electrode boasts low resistivity and a minimal shading area (Gerdes et al., 2018). Typically, photovoltaic silver paste comprises three components: silver powder, glass powder, and an organic carrier. Although glass powder constitutes merely 1%–3% of the silver paste, it assumes a pivotal role in the formation of positive electrodes in solar cells. The glass powder effectively etches the SiNx anti-reflective coating (ARC), ensuring favorable mechanical contact between the silver film and the silicon substrate (Jiefeng et al., 2020). Furthermore, the glass powder serves as a medium for the recrystallization of silver on the surface of the silicon emitter, ensuring an ideal ohmic contact-crucial for the conductivity of solar cells (Kumar et al., 2018). During the electrode formation, under high-temperature sintering, the glass powders can also form a liquid phase to wet and dissolve the silver powder, potentially influencing the sintering kinetics of the silver powder. Therefore, the glass powder exerts a crucial influence on the etching degree of the ARC and the degree of ohmic contact.
Currently, the utilization of lead-based glass powder remains pervasive in the solar cell industry, primarily owing to its low Tg, which significantly lowers the softening temperature of the glass system (Kim et al., 2018; Mikeska et al., 2019). In addition, the PbO-containing glass powder demonstrates favorable wettability with various battery base materials. This property ensures that the formed silver film exhibits better adhesion to the base, and simultaneously, it can more effectively, etch the ARC (Yuce et al., 2019; Hui et al., 2020). However, the extensive use of lead poses risks of environmental pollution and threatens human health, emphasizing the importance of developing pollution-free and high-performance lead-free glass powder.
Glass powder based on TeO2 exhibits a low melting temperature, low Tg, and high chemical stability (Qian et al., 2017). In addition, TeO2 can also lower the viscosity of molten glass, positioning it as a research hotspot for scholars (Xin et al., 2017; Mikeska et al., 2013; Libin et al., 2022). The glass, mainly composed of TeO2 and Bi2O3, has nearly equaled or surpassed the glass containing PbO in performance, but there remain shortcomings in the thermal stability of the glass and wettability to silicon substrates. GeO2 and PbO share many advantages, plus previous studies have explored GeO2 glass (Guojun et al., 2014; Scalise et al., 2021). Therefore, we were inspired to choose Te-based lead-free glass powder containing Ge, which had not been reported in previous studies. This study primarily characterized the effect of GeO2 addition on the glass structure, thermal stability, and high-temperature wettability by adding different proportions of GeO2 to TeO2-Bi2O3-B2O3-ZnO glass. We then explored methods to enhance the Ag+ content in glass. The goal was to increase the amount of silver microcrystals generated on the silicon substrate surface during the silver paste sintering process, reducing the contact resistance at the silver/silicon interface and the resistance of the glass layer, thereby reducing the series resistance of solar cells and improving the photoelectric conversion rate.
2 Materials and methods
2.1 Raw materials
The raw materials for preparing glass powder were purchased and have not been further purified, TeO2 (≥99%, Aladdin Reagent Co. Ltd.), Bi2O3 (≥99.0%, Aladdin Reagent Co. Ltd.), GeO2 (≥99.99%, Aladdin Reagent Co. Ltd.), B2O3 (≥98%, Aladdin Reagent Co. Ltd.), ZnO (≥99%, Aladdin Reagent Co. Ltd.), AgNO3 powder (≥99.8%, Aladdin Reagent Co. Ltd.), silver powder (1.2 μm, Deli Chemical Research Institute), terpineol (≥95%, Aladdin Reagent Co. Ltd.), butyl carbitol (≥99%, Shanghai Wokai Chemical Reagent Co., Ltd.), butyl phthalate (≥99.5%, Sinopharm Chemical Reagent Co. Ltd.), silane coupling agent KH-570 (≥98%, Sinopharm Chemical Reagent Co. Ltd.), hydrogenated castor oil (Aladdin Reagent Co. Ltd.) and ethyl cellulose (CP, Aladdin Reagent Co. Ltd.).
2.2 Preparation of glass powder
The TeO2-Bi2O3-GeO2-B2O3-ZnO glass powder was synthesized using the traditional melt-water quenching method. The raw materials of different components were precisely weighed and poured into an agate mortar for grinding over a defined period. After thorough mixing, they were transferred into a corundum crucible. Subsequently, the mixture was introduced into a muffle furnace and subjected to heating at a rate of 10°C/min up to 1,200°C. Following a 30-min holding period, the molten glass was promptly poured into the prepared deionized water and quenched to room temperature. After the drying process, the samples underwent milling in a planetary ball mill for 8 h, using a grinding ball, absolute ethanol, and glass powder ratio of 3:2:1. The resulting samples were then retrieved, dried, and passed through a 400-mesh sieve to obtain lead-free glass powder.
2.3 Preparation of organic vehicle and silver paste
The organic vehicles used in this experiment were Terpineol (12 wt%), Butyl carbitol (55 wt%), Butyl phthalate (20 wt%), KH-5700 (2.5 wt%), Polyamide wax slurry (0.5 wt%), and ethyl cellulose (10 wt%). Each component was weighed according to the mass ratio and placed in a small beaker. Then the small beaker containing the organic carrier was placed into a large beaker with a constant temperature water bath at 80°C and stirred until completely dissolved. Subsequently, it was cooled to room temperature for standby.
Silver paste was obtained by mixing silver powder (88 wt%), glass powder (2 wt%), and organic vehicle (10 wt%), and then rolling it 3–4 times with a three-roller grinder. The resulting silver paste was printed on the P-type monocrystalline silicon solar cells (square resistance 80 Ω/sq, size 156 × 156 mm) by screen printing. It then stood at room temperature for 10 min to level the silver paste. Finally, the silver paste was metallized by sintering in a chain fast firing furnace, and the heating temperatures in each area of the chain furnace are 300°C/300°C/300°C/500°C/590°C/600°C/720°C/850°C/835°C in sequence.
2.4 Measurements
The amorphous state of as-prepared glass powders was investigated with an X-ray diffractometer (XRD, D8-Advance, Germany) using Cu Kα radiation. The glass transition temperature (Tg) was measured by differential scanning calorimetry (DSC, Q2000, TA Corporation, ) in air with a heating rate of 10°C/min. The chemical bonds and functional groups of the substances were determined by the peak positions in infrared spectroscopy (FT-IR, Bruker ALPHA, Germany) and Raman spectroscopy (Raman, XPLORA PLUS, Japan). The elements on the material surfaces and their chemical states were investigated by X-ray photoelectron spectroscopy (XPS, PHI5000 VersaprobeIII, Japan). The square resistance of the silver grids was measured by a multifunction digital four-probe tester (ST-2258C, Suzhou Lattice Electronics Co., Ltd., China). The microstructures of the glass powder, the surface, and cross-section of the silver electrode were observed by using a field emission scanning electron microscopy (FESEM, Nova Nano SEM 450, FEI, ).
3 Results and discussion
3.1 The influence of GeO2 content on the structure of glass powders
Different contents of GeO2 were added to the formula of TeO2-Bi2O3-B2O3-ZnO lead-free glass powder and produced glass powders GF1-GF5. The specific composition ratio of the glass powders was shown in Table 1.
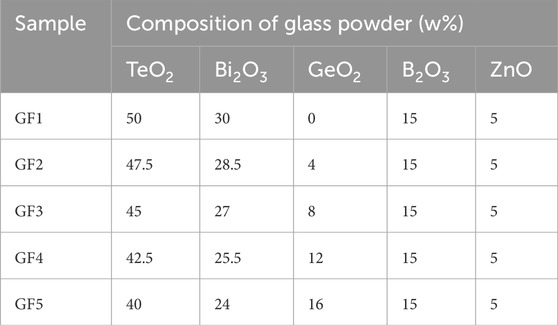
TABLE 1. The composition of Te-Bi-Ge-B-Zn-O glass powder.
To ascertain the crystalline or amorphous structure of the glass powders, XRD tests were conducted on five different glass powders. Figure 1 shows the XRD diffraction pattern of glass powders GF1-GF5, revealing the degree of vitrification of the glass powder after water quenching. It is evident that all five types of glass powders exhibit no crystal diffraction peaks, only a typical glass peak at 2θ = 28°, signifying that the prepared glass powders are all amorphous (Qian et al., 2023). The broadening degree of glass characteristic peaks in glass powders GF2 and GF3 is higher, indicating a more pronounced degree of vitrification for these two types of glass powders.

FIGURE 1. XRD patterns of glass powders with different contents of GeO2 added.
To investigate the main structure groups in the glass powders, IR and Raman tests were conducted on the glass powders. Figure 2 shows the infrared absorption spectrums of glass powders GF1-GF5. It can be seen that the positions of the corresponding absorption peaks of glass samples with different GeO2 contents have basically not changed, and only a very weak new peak has been generated, indicating that the overall network structure of the Te-Bi-Ge-B-Zn-O glass remains unchanged with the increase of GeO2 content and the decrease of TeO2 and Bi2O3 content. The absorption peak appears at 693 cm-1, and the intensity gradually weakens, which can be attributed to the decrease of TeO2 content, the reduction of the stretching vibration of Te-O in [TeO4], and the transformation of part of [TeO4] to the triangular cone [TeO3]. The weak peak at 1,030 cm-1 represents the asymmetric stretching vibration of B-O in the tetrahedron [BO4] (Yaping et al., 2009), and the shoulder at 1,210 cm-1 is the symmetric stretching vibration of B-O in the [BO3] triangular pyramid (Sung-Hung et al., 2021). With the increase of GeO2 content, the intensity of the weak peak at 1,030 cm-1 gradually decreases, and the shoulder at 1,210 cm-1 gradually increases, indicating that [BO4] gradually changes to [BO3]. The vibration of [BO3] planar group occurs at 1376 cm-1, and the peak of [BO3] is stronger than that of [BO4], indicating that B2O3 primarily participates in the construction of the glass network as a [BO3] triangular pyramid (Feng et al., 2011; Jun et al., 2016). The peak at 1,645 m-1 may be the bending vibration peak of [OH] or the bending vibration peak of o-h-o of water. With the increase of GeO2 content, an unknown peak emerges at 1,550 cm-1, which may be the formation of a Ge-O-R bond (R = Te, Bi, B or Zn) between Ge and some elements (Yongzheng et al., 2019).
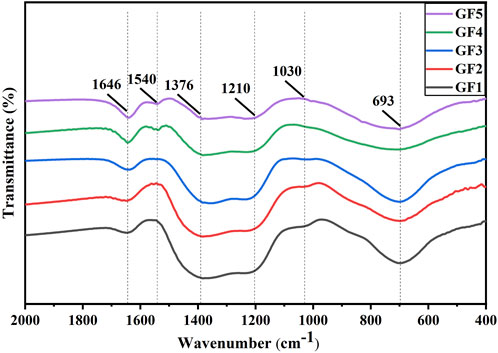
FIGURE 2. The infrared absorption spectrums of glass powders with different contents of GeO2 added.
The Raman spectrums of glass powders GF1-GF5 are presented in Figure 3. The peak at 301 cm-1 corresponds to the bending vibration of the non-bridging oxygen bonds in the [TeO3] triangular pyramid. This peak slightly weakens with the increase in GeO2 content. The appearance of a new peak at 436 cm-1 with increasing GeO2 content corresponds to the symmetric stretching vibration of the Ge-O-Ge bonds in the [GeO4] ring group. The peaks at 655 cm-1 and 731 cm-1 correspond to the asymmetric stretching vibration of Te-O bonds in the [TeO4] double triangular pyramid and the symmetric stretching vibration of Te-O bonds in the [TeO3] triangular pyramid, respectively. With the increase in GeO2 content and the decrease in TeO2 content, the peak at 655 cm-1 gradually weakens, while the peak at 731 cm-1 weakens less, indicating a transformation from [TeO4] to [TeO3] triangular pyramids. The peaks at 1,028 cm-1 and 1,206 cm-1 correspond to the vibrations of B-O in [BO4] tetrahedra and [BO3] triangular pyramid, respectively. With the increase in GeO2 content, the peak at 1,028 cm-1 gradually weakens, and the peak at 1,206 cm-1 gradually strengthens, suggesting a transformation from [BO4] tetrahedra to [BO3] triangular pyramids. The Raman spectrum analysis is consistent with the infrared absorption spectrum, indicating that the absorption peak positions of glass powders corresponding to the increase in GeO2 content remain essentially unchanged. The changes in peak intensity are minimal, indicating no alteration in the overall network structure of the glass.
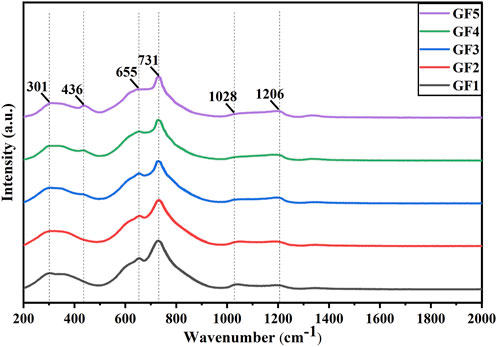
FIGURE 3. The Raman spectrums of glass powders with different contents of GeO2 added.
To further investigate the structure of glass powders, XPS used to measure the atomic orbital binding energies of its main elements. The test results are illustrated in Figure 4, with calibration references from the “Handbook of X-ray Photoelectron Spectroscopy.” Figure 4A shows the overall spectrum of glass frit GF3, with annotations indicating the atomic orbitals corresponding to each peak. Figure 4B shows the spectrum of the C element, where the C 1s orbital exhibits minor sub-peaks. The main peak, at a binding energy of 284.80 eV, corresponds to the C-C bond and serves as a calibration reference for XPS spectra. The minor peak at 288.84 eV corresponds to the C=O bond. Figure 4C shows the spectrum of the O element, with a single peak at a binding energy of 530.94 eV, consistent with the binding energy of O in metal oxides. Figure 4D shows the spectrum of the Te element, revealing the 3d orbitals splitting into 3d5/2 and 3d3/2 with binding energies of 576.32 eV and 586.73 eV, respectively, consistent with the binding energies of Te in TeO2. Figure 4E shows the spectrum of the Bi element, revealing the 4f orbitals splitting into 4f7/2 and 4f5/2 with binding energies of 159.29 and 164.55 eV, respectively, consistent with the binding energies of Bi in Bi2O3. Figure 4F shows the spectrum of the Ge element, revealing distinct peaks in the 3d orbitals with binding energies of 29.68 and 32.45 eV. The latter corresponds to the binding energy of Ge in GeO2, while the former corresponds to the binding energy of Ge in simple substance or in GeTe.
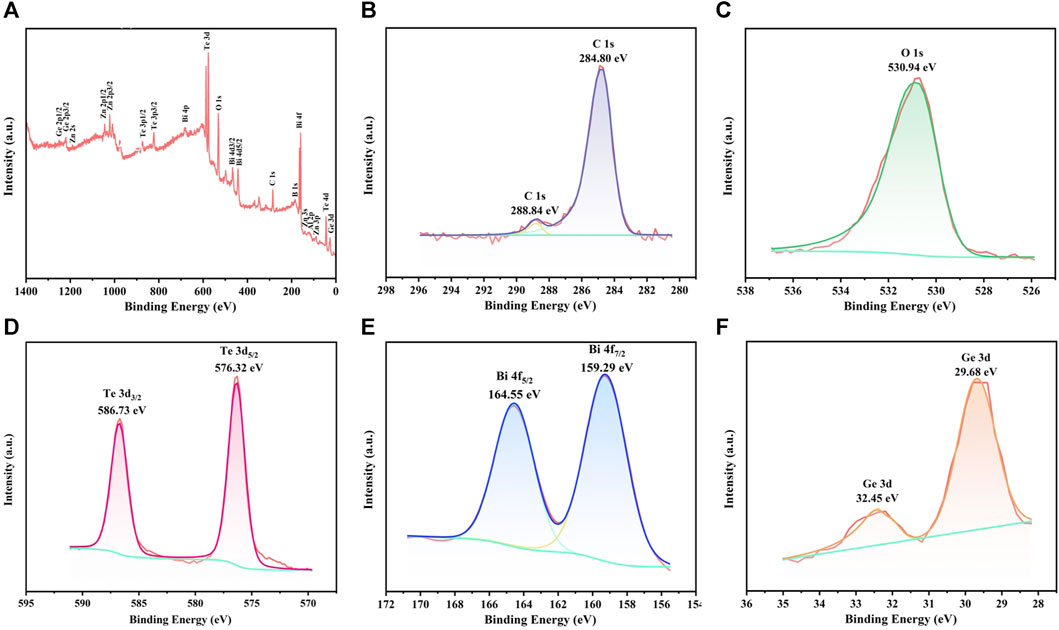
FIGURE 4. XPS spectrums of glass powder GF3 (A) overall spectrum, (B–F) high-resolution spectra for individual elements.
3.2 The influence of GeO2 content on the sintering character of glass powders
To investigate the thermal behavior of glass powders during the heating process, differential scanning calorimetry (DSC) tests were conducted on glass powders GF1-GF5. The test results are illustrated in Figure 5. It is evident that as the content of GeO2 increases from 0% to 8%, the glass transition temperature of the glass decreases from 450°C to 437 °C. However, as the content of GeO2 further increases from 8% to 16%, the glass transition temperature of the glass increases from 437°C to 453°C. In addition, the DSC curves of glass powders GF1 and GF2 reveal a significant crystallization peak in the range of 550°C–600°C. The temperature corresponding to the crystallization peak of glass powder GF3-GF5 reduced, and the intensity of the crystallization peak weakened. This observation suggests that as the content of GeO2 gradually increases to 8%, the phases precipitated during the glass heating process change, and the precipitation amount decreases. Considering that solar silver paste requires glass powder to melt and flow between the silver layer and solar cells as early as possible during the sintering process, it necessitates glass powder with a low glass transition temperature and less crystallization. Among the 5 types of glass, GF3 glass exhibits the lowest glass transition temperature, the smoothest DSC curve, and less crystallization, making it the most suitable for solar silver paste.
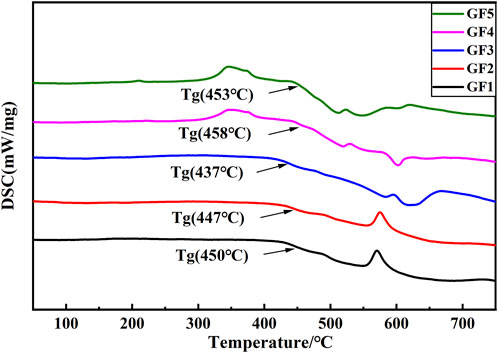
FIGURE 5. DSC curves of glass powders with different contents of GeO2 added.
To further investigate the crystallization behavior of glass powders during the devitrification peak, representative glass powders GF1, GF3, and GF5 with distinctive DSC curves were selected. These powders were pressed into pieces and heated in a muffle furnace at 650 °C for 3 min. Subsequently, XRD analysis was conducted, and the results are depicted in Figure 6. The area of the amorphous peaks and the intensity of the crystal peaks indicate that, post-heating, GF1 exhibits the highest crystallization with the least remaining amorphous phase. In contrast, GF3 and GF5 show similar crystallization behaviors with fewer crystalline phases and a substantial amount of remaining amorphous phase. By referencing standard PDF cards for peak calibration, it was determined that GF1 primarily crystallizes into Bi2Te2O7, GF3 predominantly crystallizes into Bi2Te2O7 with a minor amount of GeO2, and GF5 exhibits a reduction in Bi2Te2O7 crystallization with an increase in GeO2 crystallization. The findings suggest that the introduction of GeO2 reduces the crystallization of Bi2Te2O7, but this effect becomes less pronounced after the GeO2 content exceeds 8%, accompanied by an increased crystallization of GeO2. Therefore, considering the demand of minimizing crystallization during the heating process, GF3 emerges as the optimal choice for glass powders.
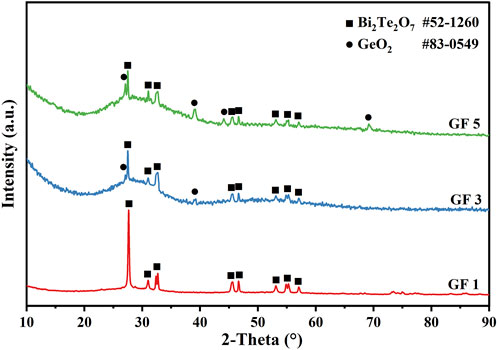
FIGURE 6. XRD patterns of glass powders GF1, GF3, and GF5 after heating at 650°C.
To analyze the state of glass powders at different heating stages, glass powders GF3 and a control glass powder GF1 without GeO2 were selected. In GF1 and GF3, 5 wt% alcohol was added to wet the powders. Subsequently, cylindrical samples with a diameter of 5 mm and a height of 7 mm were pressed using a pellet press. The pressed glass powder samples were then placed on the surface of solar cells with a size of 20 mm and sintered at different temperatures for 3 min. The morphology of the sintered glass and the contact angle between the glass melt and the surface of the solar cell at 800°C is shown in Figure 7. It can be seen from Figures 7A,B that when the sintering temperature is 500°C, the samples begin to shrink because the temperature exceeds the glass transition temperature of the glass powders. When the sintering temperature rises to 600°C, the glass crystallizes, resulting in volume expansion, because the temperature exceeds the initial crystallization temperature of the glass powders. Because the crystallization peak of glass powder GF3 is weaker than that of glass powder GF1, the volume expansion of glass GF3 is smaller. When the sintering temperature rises to 650°C, the volume of glass powder GF1 shrinks and the volume of glass powder GF3 expands slightly because the crystallization end temperature of glass powder GF1 is less than 600°C and that of glass powder GF3 is more than 600°C. With the continuous increase of sintering temperature, glass powder GF1 and GF3 began to melt. The melting degree of glass GF1 was higher at 700°C, but the fluidity of glass GF3 was better at 800°C. From the contact angle of Figures 7C,D, it can be seen that the glass melt formed by glass powder GF3 at 800°C has better high-temperature wettability. The morphology changes of glass powder sintered at different temperatures not only verified the analysis results of DSC, but also further showed that glass powder GF3 containing 8% GeO2 had better sintering performance than glass powder GF1 without GeO2.
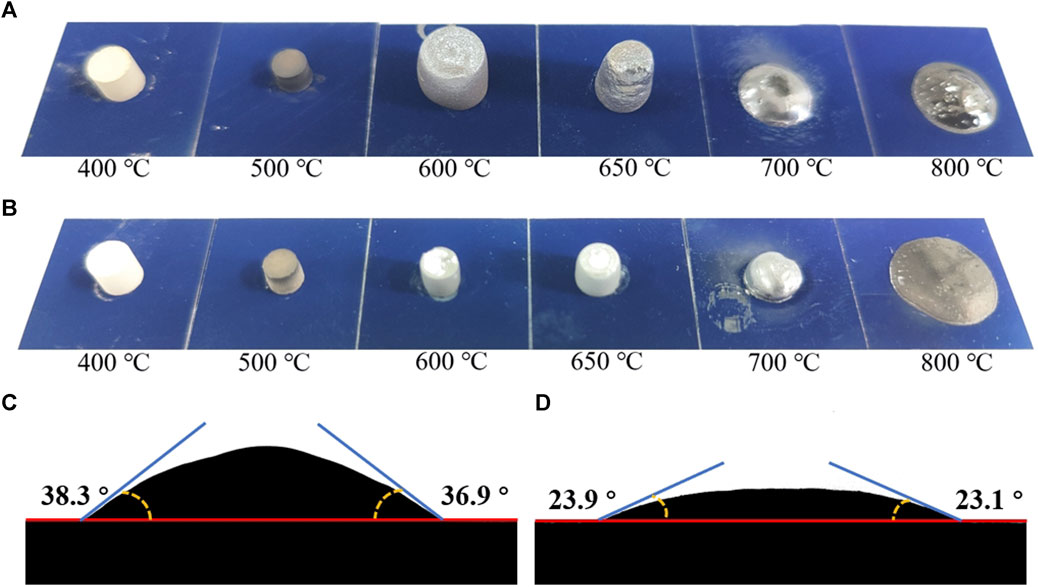
FIGURE 7. Morphological images of glass powder sintered at different temperatures. (A) Glass powder GF1, (B) glass powder GF3.The contact angle of glass melt on the surface of solar cells at 800°C. (C) Glass powder GF1, (D) glass powder GF3.
3.3 Acid and alkali resistance test
Glass powder in the solar silver paste is an important bonding phase to achieve ohmic contact between the silver electrode and the solar cell, and its chemical stability directly affects the service life of solar cells. In order to verify the acid and alkali resistance of the prepared glass powder, 1 g of glass powder GF3 was added to 0.01 mol/L nitric acid solution and 10% NaCO3 solution respectively, and kept in a constant temperature water bath at 80°C for 1 h. After that, the glass powder was washed with deionized water and anhydrous ethanol for several times, weighed it after drying, and calculated the percentage of mass reduction of glass powder. For comparison, 1 g of glass powder GF3 was added to deionized water, and the water bath was conducted under the same conditions. Finally, the weight loss percentages of adding acid, alkali, and water were calculated as 0.022%, 0.0146%, and 0.0029%, respectively. This weight loss is negligible. In addition, the surface morphology of glass powder GF3 after immersion in acid, alkali, and deionized water was shown in Figure 8. It can be seen that the morphology of the glass powder after acid-base corrosion was basically the same as that of non-corroded glass powder. The above tests showed that glass powder GF3 had good acid and alkali resistance.
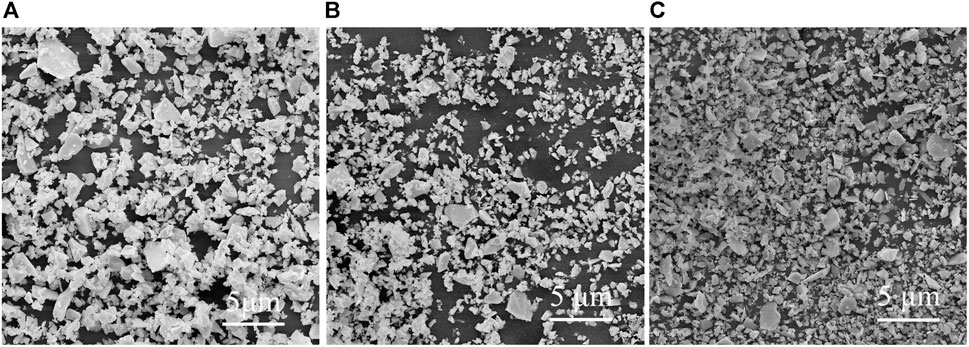
FIGURE 8. SEM image of glass powder GF3 after acid and alkali resistance test. (A) Acid corrosion, (B) alkali corrosion, (C) not-corroded.
3.4 Effect of glass powder on sintering properties of silver paste
During the silver paste sintering process, Ag+ in the glass melt reacted with the SiNx antireflection layer and the silicon on the surface of the solar cell, and generated silver microcrystals on the silicon surface of the solar cell (Schmidt et al., 2018). The silver microcrystals could form a better ohmic contact between the silver layer and the solar cell, and reduced the contact resistance between the silver electrode and the solar cell (Libin et al., 2018; Xinjie et al., 2020; Bowen et al., 2023). The reaction processes were shown in Eqs 1–4.
In the past, the glass powder used in solar silver paste did not contain Ag+, and the Ag+ in the glass powder was reacted with silver powder into the glass powder during the sintering process. Due to the short sintering time of solar silver paste, the content of Ag+ in the glass melt often does not reach saturation. By adding a small amount of silver powder or silver nitrate in advance during the melting process of the glass powder, the content of Ag+ in the glass could be improved. The bottom of the crucible for normal melting of the glass powder GF3, with 5% silver powder and 5% silver nitrate respectively added before melting, is shown in Figure 9. It can be seen that the glass powder GF3 was originally yellow transparent glass. Adding 5% silver nitrate before melting would make the glass brownish, but it was basically uniform and transparent. It was speculated that most of the silver oxide after silver nitrate decomposition was melted into the glass, and a small part of the silver oxide was reduced to nano silver particles and evenly dispersed in the glass, making the glass brownish. Adding 5% silver powder before melting would make the glass have black non-uniform non-molten substances. It was speculated that the silver powder not melted into the glass is mixed unevenly in the glass. Because the glass was non-uniform, it could not be used as the glass powder of solar silver paste. The glass powder made by grinding the glass with 5% silver nitrate and passing through a 400-mesh sieve was recorded as GF6.
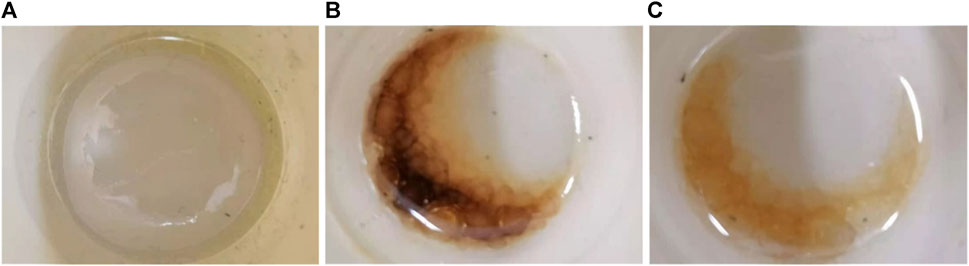
FIGURE 9. Physical drawing of crucible bottom after melting glass powders. (A) Glass powder GF3, (B) Added 5% silver powder, (C) Added 5% silver nitrate.
Glass powders GF1, GF3, and GF6 were used to formulate silver pastes SP1, SP2, and SP3, respectively. The three types of silver pastes were applied to the solar cells using a screen printing machine, and the microstructure of the cross-section of the solar cells was examined by a field emission scanning electron microscope after sintering, as shown in Figure 10 and Supplementary Figure S1. From Supplementary Figure S1, it is evident that the thicknesses of the silver layers sintered from silver pastes SP1-SP3 are 13.95, 14.10, and 14.55 μm, respectively, with the silver layer thicknesses being closely comparable. By comparing Figures 10A,B, it could be seen that the glass layer between silver and silicon after silver paste SP1 sintered was thin and had some holes, and some glass remained in the silver layer, while the glass layer between silver and silicon after silver paste SP2 sintered was dense and less glass remained in the silver layer, because the high-temperature fluidity and wettability of glass powder GF1 were worse than that of glass powder GF3. The silver nanoparticles precipitated in the glass layer could be seen in the area circled by the dotted line. Due to the high resistance of the glass itself, the silver nanoparticles dispersed in the glass layer could provide a conductive path for the passing current, reduce the resistance of the glass layer, and lower the contact resistance between silver and silicon. It could be seen from Figure 10C that after adding Ag+ to glass powder GF3, the amount of silver nanoparticles precipitated in the glass layer increased significantly, but due to the reaction between Ag+ and SiNx antireflection layer, gas would be generated, and the holes in the glass layer would increase.
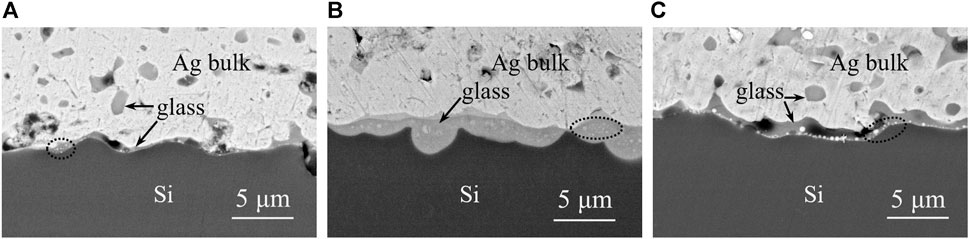
FIGURE 10. Cross-sectional SEM images of solar cell after silver paste sintered. (A) SP1, (B) SP2, (C) SP3.
In order to observe the silver nanoparticles on the surface of the silicon layer of the solar cell, the silver layer of the silver electrode was corroded with 60% concentrated nitric acid, and the residual glass layer was corroded with 5% hydrofluoric acid, and then observed with a field emission scanning electron microscope. The SEM images are shown in Figure 11. It can be seen from Figure 11 that there were two types of silver nanoparticles on the surface of the silicon layer of the solar cell (Wonje et al., 2020). One was framed by the red circles, which were nano silver microcrystals grown after the reaction of glass with SiNx or silicon. They exhibited a certain crystalline structure and generally generated on the top of the raised pyramid structure of the silicon wafer. The nano silver microcrystal had good contact with the silicon layer, which could well export the photoelectrons. But at the same time, it should be noted that the overgrown silver microcrystals may puncture the PN junction and produce leakage current. The other one was the spherical silver nanoparticles precipitated from the glass layer due to the decrease of melting degree when the glass melt cooled. They appeared inside the glass layer and mostly concentrated at the bottom of the glass layer due to gravity, and the contact with the silicon layer was not close. The spherical silver nanoparticles mainly formed a conductive path inside the glass layer to reduce the resistance of the glass layer. In Figure 11A, due to the thin and incomplete coverage of the glass layer formed by the sintered silver paste SP1, there were fewer silver nanoparticles on the silicon surface after the glass layer was removed, and they were mainly nano silver microcrystals. In Figure 11B, the glass layer formed by sintered silver paste SP2 was thick and completely covered, and there were many spherical silver nanoparticles at the bottom of the glass layer. After the removal of the glass layer, the silicon surface consisted mainly of spherical silver nanoparticles. In Figure 11C, the thickness of the glass layer formed by sintered silver paste SP3 was moderate, and due to the high content of Ag+ in the glass, it produced more nano silver microcrystals. After the removal of the glass layer, there were more spherical silver nanoparticles and nano silver microcrystals on the silicon surface. It can be seen from Figures 10, 11 that the sintering performance of silver paste SP3 was better and formed a better interface contact between the silver layer and the silicon layer.
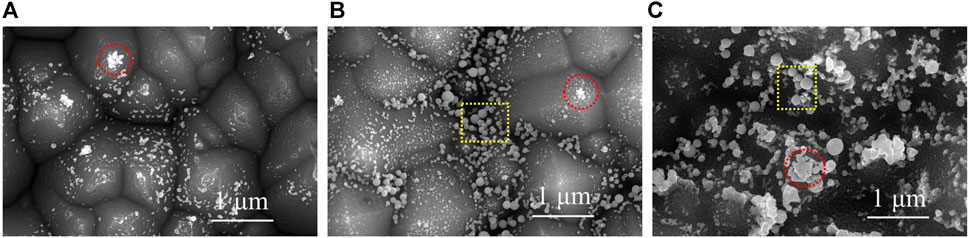
FIGURE 11. SEM image of silver electrode surface with silver layer and glass layer etched off. (A) SP1, (B) SP2, (C) SP3.
In order to explore the element distribution between silver/glass/silicon layers, EDS tests were carried out on them, and the results are shown in Figure 12. Region A represents the Si emitter, region B represents the glass layer, and region C represents the silver layer. From the element distribution of silicon, it is evident that there is silicon in the glass layer, but there is no SiO2 in the glass composition, which proves that reactions similar to the reactions formula (3), (4) occurred at the interface between glass and silicon. It is evident from the distribution of silver that there is a significant amount of silver in the glass layer, and some silver elements even diffuse into the silicon layer. From the element distribution of tellurium, bismuth, and germanium, it can be observed that in the process of glass melting and flowing to the silicon surface, there is mutual diffusion between the glass and the silver layer, and the main elements in the glass are distributed relatively evenly in the silver layer. In addition, tellurium, bismuth, and germanium elements in the glass also diffuse into the silicon layer, which affects the element doping of the silicon emitter and reduces the photoelectric conversion efficiency of the cell. Therefore, the solar silver paste should adopt the rapid sintering process to reduce the element diffusion.
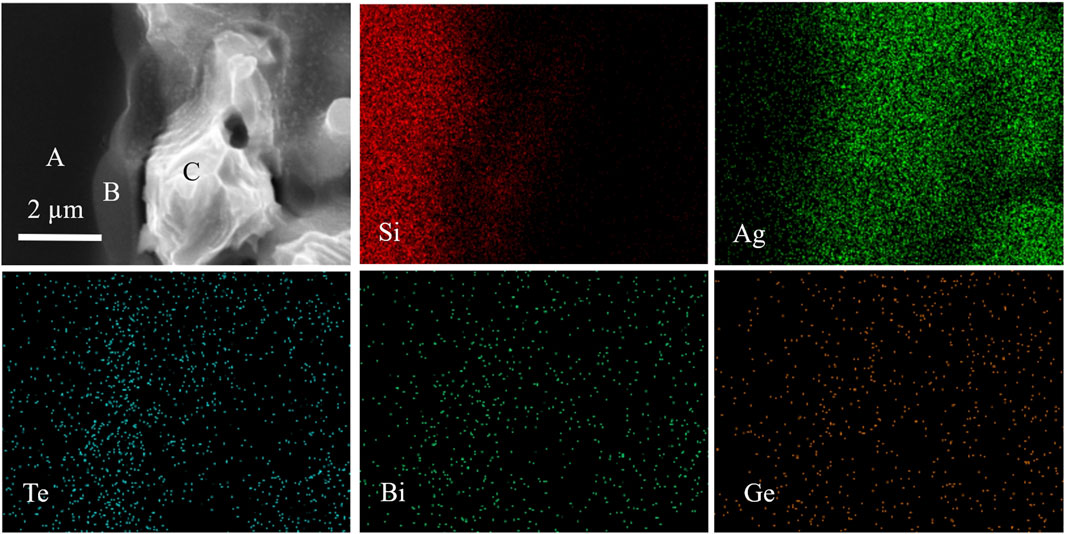
FIGURE 12. Cross-sectional SEM image of solar cell after silver paste SP3 sintered and corresponding EDS compositional maps.
3.5 Electrical properties of prepared solar cells
The front electrodes of solar cells were printed with silver pastes SP1, SP2, and SP3, respectively, and the I-V electrical properties of solar cells after sintering were tested. The results are shown in Table 2. It is evident from the test results that the open circuit voltages (Voc) of the solar cell remained basically unchanged. The main factors influencing the solar cell performances are the series resistance (Rs), the short-circuit current (Isc), and the filling factor (FF). It is evident from the above that the silver paste SP3, prepared using glass powder GF6, demonstrated the best silver-silicon interface contact performance. Therefore, the Rs of silver paste SP3 was the lowest, and Rs had an impact on the Isc and FF of the solar cell. The photoelectric conversion efficiency (ETA) of silver paste SP3 was the highest, reaching 23.19. It should be noted that silver paste SP3 generated more nano silver microcrystals on the surface of the silicon emitter than silver pastes SP1 and SP2, posing the risk of piercing the PN junction and generating leakage current, which could lead to a reduction in parallel resistance (Rsh) and Voc.
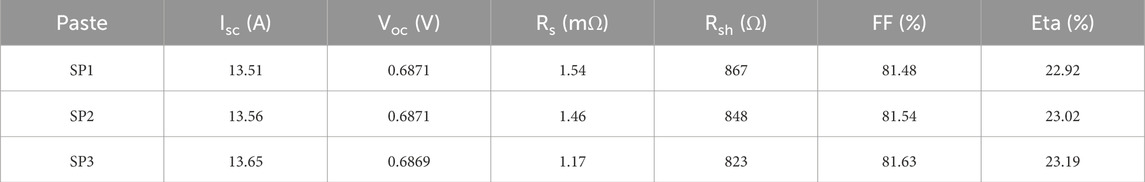
TABLE 2. I-V performance test results of solar cells used different silver pastes.
4 Conclusion
In the formulation of Te-based lead-free glass powder, various proportions of GeO2 were incorporated. Through XRD analysis, it was established that all the glass powder exhibited an amorphous structure. The influence of GeO2 content on the glass transition temperature and crystallization behavior of the glass powder was investigated using DSC. It was observed that glass powder GF3, with a GeO2 content of 8%, displayed the lowest glass transition temperature and the least pronounced crystallization behavior. Upon comparing the morphological changes of glass powder GF1 and GF3 at different temperatures, it was noted that the addition of GeO2 could mitigate the crystallization expansion of the glass powder, enhancing the fluidity and wettability of the glass melt. Infrared spectrum analysis of the impact of GeO2 addition on the glass network structure further validated the feasibility of adding GeO2. Silver nitrate was introduced to glass powder GF3 before melting to obtain glass powder GF6 with a high Ag+ content. The cross-sectional morphology of the silver paste after sintering and the silicon surface morphology after the corrosion of the silver layer and glass layer were examined. This confirmed the formation of two types of silver nanoparticles, namely, nano silver microcrystals and spherical nano silver particles, in the glass layer during the sintering process. The interfacial sintering of glass powder GF1, GF3, and GF6 was compared, revealing that the silver paste utilizing glass powder GF6 could establish a superior ohmic contact between the silver electrode and the solar cell. The elemental diffusion at the silver/glass/silicon interface was observed through EDS surface scanning of the solar cell cross-section. Finally, the impact of silver pastes produced from glass powder GF1, GF3, and GF6 on the I-V electrical properties of solar cells was assessed. It was determined that the glass powder primarily influenced the Rs, Isc, and FF performance of the solar cell. The photoelectric conversion rate peaked at 23.19% when glass powder GF6 was employed. Celikbilek et al., 2013, Sheng et al., 2017.
Data availability statement
The original contributions presented in the study are included in the article/Supplementary Material, further inquiries can be directed to the corresponding authors.
Author contributions
XY: Conceptualization, Data curation, Formal Analysis, Investigation, Methodology, Validation, Visualization, Writing–original draft, Writing–review and editing. WL: Investigation, Methodology, Resources, Validation, Writing–review and editing. HS: Conceptualization, Investigation, Validation, Writing–review and editing. ZQ: Data curation, Methodology, Software, Visualization, Writing–review and editing. GG: Methodology, Supervision, Writing–review and editing, Conceptualization, Funding acquisition, Project administration, Resources, Validation. YY: Writing–review and editing, Investigation, Methodology, Supervision. JL: Conceptualization, Funding acquisition, Project administration, Resources, Validation, Writing–review and editing.
Funding
The author(s) declare financial support was received for the research, authorship, and/or publication of this article. This research was funded by National Natural Science Foundation of China (Grant No.51771084); the Major Science and Technology project of Yunnan Province (Grant No.202102AB080008); the Science and Technology projects of Yunnan Precious Metals Laboratory (Grant Nos YPML-2022050207 and YPML-2023050206); the Fundamental Research Project of Yunnan Province-General Project (Grant Nos 202001AT070061 and 2019HB108).
Acknowledgments
The authors acknowledge fruitful discussions with WL, JL from Sino-Platinum Metals Co.,LTD. and YY from The University of New South Wales for the support of experiment analysis.
Conflict of interest
Authors WL and JL were employed by Sino-Platinum Metals Co. LTD. Author JL was employed by Sino-Platinum Electronic Materials (Yunnan) Co. LTD.
The remaining authors declare that the research was conducted in the absence of any commercial or financial relationships that could be construed as a potential conflict of interest.
The author(s) declared that they were an editorial board member of Frontiers, at the time of submission. This had no impact on the peer review process and the final decision.
Publisher’s note
All claims expressed in this article are solely those of the authors and do not necessarily represent those of their affiliated organizations, or those of the publisher, the editors and the reviewers. Any product that may be evaluated in this article, or claim that may be made by its manufacturer, is not guaranteed or endorsed by the publisher.
Supplementary material
The Supplementary Material for this article can be found online at: https://www.frontiersin.org/articles/10.3389/fmats.2024.1359856/full#supplementary-material
References
Bowen, F., Yaoping, L., Wei, C., Guoguang, X., Xingqian, C., and Xiaolong, D. (2023). Differently shaped Ag crystallites and four current transport paths at sintered Ag/Si interface of crystalline silicon solar cells. Sol. Energy Mater. Sol. Cells 257, 112381. doi:10.1016/j.solmat.2023.112381
Cai, X., Yuancheng, T., LangTeng, W., and Xiaohua, C. (2017). Characterization of TeO2 based glass frits and morphology to their silver films. J. Mater. Science-Materials Electron. 28 (24), 18429–18436. doi:10.1007/s10854-017-7789-2
Celikbilek, M., Ersundu, A. E., and Aydin, S. (2013). Preparation and characterization of TeO2–WO3–Li2O glasses. J. Non-Crystalline Solids 378, 247–253. doi:10.1016/j.jnoncrysol.2013.07.020
Feng, H., Jun, W., and Dawei, D. (2011). Effect of Bi2o3 on structure and wetting studies of Bi2o3-zno-B2o3 glasses. J. Alloys Compd. 509 (21), 6332–6336. doi:10.1016/j.jallcom.2011.03.087
Gerdes, B., Jehle, M., Lass, N., Riegger, L., Spribille, A., Linse, M., et al. (2018). Front side metallization of silicon solar cells by direct printing of molten metal. Sol. Energy Mater. Sol. Cells 180, 83–90. doi:10.1016/j.solmat.2018.02.022
Guojun, Z., Yuping, T., Hui, W., and Jintao, B. (2014). Effect of the Pb-Te-B-O system glass frits in the front contact paste on the conversion efficiency of crystalline silicon solar cells. J. Mater. Science-Materials Electron. 25 (9), 3779–3786. doi:10.1007/s10854-014-2089-6
Hui, L., Hua, T., Jiefeng, Z., Guoqing, L., Yunxia, Y., Cui, L., et al. (2020). Investigation on pbo–B2o3–sio2–rxoy glasses applied in noncontact silver paste for crystalline silicon solar cells. J. Electron. Mater. 49 (9), 5422–5429. doi:10.1007/s11664-020-08281-w
Jiefeng, Z., Hua, T., Xinjie, S., Guoqing, L., Hui, L., Yunxia, Y., et al. (2020). An investigation on determinants of silver paste metallization contact performance on crystalline silicon solar cells. J. Mater. Sci. Mater. Electron. 31 (7), 5752–5759. doi:10.1007/s10854-020-03145-9
Jinling, Z., Jicheng, Z., Jing, H., and Bowen, L. (2022). Effect of TeO2-based lead-free glass on contact formation of front side silver metallization for monocrystalline silicon solar cells. Sol. Energy Mater. Sol. Cells 238, 111585. doi:10.1016/j.solmat.2022.111585
Jun, C., De'an, Y., Tong, Z., Bingqiang, G., and Qi, W. (2016). Influence of B2o3-sio2-zno-bao glass ratio and sintering temperature on the microstructure and property of copper thick film for low temperature Co-fired ceramic. J. Mater. Science-Materials Electron. 27 (2), 1929–1937. doi:10.1007/s10854-015-3975-2
Kim, Y., Huh, J., and Kim, H. (2018). Effect of basicity of glass frits on electrical properties of Si solar cells. Sol. Energy Mater. Sol. Cells 185, 97–103. doi:10.1016/j.solmat.2018.05.015
Kumar, P., Aabdin, Z., Pfeffer, M., and Eibl, O. (2018). High-efficiency, single-crystalline, P- and N-type Si solar cells: microstructure and chemical analysis of the glass layer. Sol. Energy Mater. Sol. Cells 178, 52–64. doi:10.1016/j.solmat.2018.01.001
Libin, M., Yuyang, Z., Lei, Z., Chunlan, Z., and Wenjing, W. (2018). Effect of sub-micrometer sized silver particle on the performance of the front Ag paste for C-Si solar cells. J. Alloys Compd. 742, 256–262. doi:10.1016/j.jallcom.2018.01.321
Libin, M., Yuyang, Z., Lei, Z., Chunlan, Z., and Wenjing, W. (2022). Effect of TeO2 on Ag/Si interface contact of crystalline silicon solar cells. Mater. Lett. 324 (2022), 132752. doi:10.1016/j.matlet.2022.132752
Mikeska, K. R., Meijun, L., and Weilin, L. (2019). Tellurium-based screen-printable conductor metallizations for crystalline silicon solar cells. Prog. Photovoltaics 27 (12), 1071–1080. doi:10.1002/pip.3185
Qian, L., Shenghua, M., Hui, W., Jintao, B., Shiqing, B., and Hanying, W. (2023). Effect of rare metal oxide doped lead-based glass frits on the performance of crystalline silicon solar cells. Sol. Energy Mater. Sol. Cells 254, 112261. doi:10.1016/j.solmat.2023.112261
Qian, M., Shenghua, M., Jintao, B., and Hui, W. (2017). Influence of lead-free glass frit in the front contact paste on the conversion efficiency of polycrystalline silicon solar cells. RSC Adv. 7 (75), 47500–47506. doi:10.1039/c7ra07574j
Scalise, E., Houssa, M., Pourtois, G., Afanas'ev, V. V., and Stesmans, A. (2011). Structural and vibrational properties of amorphous Geo2 from first-principles. Appl. Phys. Lett. 98 (20), 3. doi:10.1063/1.3593036doi:202110
Schmidt, J., Peibst, R., and Brendel, R. (2018). Surface passivation of crystalline silicon solar cells: present and future. Sol. Energy Mater. Sol. Cells 187, 39–54. doi:10.1016/j.solmat.2018.06.047
Sheng, Y., Yongji, C., Zongwei, M., Ming-Jian, Z., Zhou, G., Xingbo, W., et al. (2017). Novel Ag-doped glass frits for high-efficiency crystalline silicon solar cells. Chem. Commun. 53 (46), 6239–6242. doi:10.1039/c7cc02838e
Sung-Hung, L., Chin-Tung, L., Yi-Sheng, L., Chien-Chon, C., and Hsi-Wen, Y. (2021). The relationship between the structure and thermal properties of Bi2O3-zno-B2O3 glass system. Adv. Condens. Matter Phys. 2021, 12 doi:2321558doi:10.1155/2021/2321558
Wonje, O., Jisu, P., Sima, D., Eung Kwon, K., Yong Seob, P., and Jaehyeong, L. (2020). Metallization of crystalline silicon solar cells for shingled photovoltaic module application. Sol. Energy 195, 527–535. doi:10.1016/j.solener.2019.11.095
Xinjie, S., Shanshan, Y., Juanjuan, X., Jiefeng, Z., Yunxia, Y., Hongbo, L., et al. (2020). Mechanism of silver/glass interaction in the metallization of crystalline silicon solar cells. Mater. Res. Express 7 (1), 016315. doi:10.1088/2053-1591/ab6ca2
Yaping, Z., Yunxia, Y., Yuwen, O., Wei, H., Jiahua, Z., and Guorong, C. (2009). Effect of Sb2O3 on thermal properties of glasses in Bi2O3-B2O3-SiO2 system. J. Am. Ceram. Soc. 92 (8), 1881–1883. doi:10.1111/j.1551-2916.2009.03127.x
Yinghu, S., Haobo, X., Chenqian, Y., Yuxin, T., Shiyuan, N., Shenghua, M., et al. (2023). Improvement of wettability of Te-modified lead-free glass frit and its effect to front side silver paste in crystalline silicon solar cells. Sol. Energy Mater. Sol. Cells 253, doi:112214doi:10.1016/j.solmat.2023.112214
Yongzheng, F., Shaohua, M., Jingshan, H., Yufeng, L., Guoying, Z., Yanyan, G., et al. (2019). Experimental study of growth of silver nanoparticles embedded in Bi2o3-sio2-B2o3 glass. J. Alloys Compd. 809, 8–151725. doi:10.1016/j.jallcom.2019.151725
Keywords: GeO2, Te-based glass powder, solar cell, silver paste, nano silver microcrystals
Citation: Yu X, Li W, Sun H, Qian Z, Li J, Yu Y and Gan G (2024) The effect of Te-based lead-free glass powder containing Ge and Ag+ on the contact formation and electrical performance of silicon solar cells. Front. Mater. 11:1359856. doi: 10.3389/fmats.2024.1359856
Received: 22 December 2023; Accepted: 05 February 2024;
Published: 15 February 2024.
Edited by:
Kalisadhan Mukherjee, Pandit Deendayal Energy University, IndiaReviewed by:
Priyanka Das, Jackson State University, United StatesHuidan Zeng, East China University of Science and Technology, China
Copyright © 2024 Yu, Li, Sun, Qian, Li, Yu and Gan. This is an open-access article distributed under the terms of the Creative Commons Attribution License (CC BY). The use, distribution or reproduction in other forums is permitted, provided the original author(s) and the copyright owner(s) are credited and that the original publication in this journal is cited, in accordance with accepted academic practice. No use, distribution or reproduction is permitted which does not comply with these terms.
*Correspondence: Guoyou Gan, ganguoyou@kust.edu.cn; Junpeng Li, lijunpeng@ipm.com.cn; Yang Yu, yang.yu12@unsw.edu.au