Formulation and structural insight of biocompatible microemulsion for enhanced release profile of anticancer methotrexate
 Muhammad Yasir Siddique1
  Sehrish Zafar2
  Linta Rizwan1
  Muhammad Atif Saleem1
  Sajjad Haider3 Waqar Azeem4
  Kamran Alam5
  Yasir Iqbal6
  Sajjad Hussain Sumrra1
  Muhammad Faizan Nazar2*
- 1Department of Chemistry, University of Gujrat, Gujrat, Pakistan
- 2Department of Chemistry, University of Education, Lahore, Pakistan
- 3Chemical Engineering Department, College of Engineering, King Saud University, Riyadh, Saudi Arabia
- 4Lahore Chemical & Pharmaceutical Works (Private) Limited, Lahore, Pakistan
- 5Department of Chemical Engineering Materials Environment Sapienza University of Rome, Rome, Italy
- 6Department of Chemistry, Government College University, Faisalabad, Pakistan
Microemulsions (μEs) are particularly suitable systems for the efficient delivery of anticancer drugs due to their thermodynamic stability, structural flexibility, and patient-friendly chemotherapies. Moreover, μE formulations can efficiently encapsulate the anticancer drugs and deliver them to the desired location. Herein, three new Tween-60-based µE formulations were developed to enhance the dissolution profile of anticancer methotrexate (MTX). For this, μE formulations using an appropriate ratio of castor oil (∼9%), water (∼11%), and Tween-60 (∼40%) were used, while ethanol, 2-propanol, and 1-butanol were selected as co-surfactants for each formulation, respectively. Preliminarily, the phase compatibility of the μE ingredients, the average μE region, and the structural transformation in the microstructure of μE were delineated by mapping the pseudoternary phase diagram, as well as electrical conductivity, viscosity, and optical microscopic measurements. The size distribution profile of the as-formulated μEs analyzed by dynamic light scattering (DLS) revealed the fine monomodal assembly of MTX-μE nanodroplets (∼65 nm), which remained stable over a half year of storage. FTIR analysis showed good compatibility of MTX with μE ingredients with no apparent chemical interaction, while fluorescence measurements endorsed the acquisition of MTX in nonpolar microenvironments. Furthermore, an enhanced dissolution rate (>98% ± 1.5%, p ≤ 0.001) and superior bioavailability of the lyophilized non-aggregated methotrexate nanoparticles (MTX-NPs) were achieved, making them a suitable formulation for oral administration.
Introduction
Due to the uncontrolled growth and widespread distribution of abnormal cells throughout the body, cancer remains a major global public health challenge. These abnormal cells can proliferate uncontrollably and form large abnormal cell clusters called tumors that disrupt normal physiological functions (Hegde and Chen, 2020). In addition, malignant cells have the ability to invade surrounding tissue and migrate to distant areas of the body via the bloodstream or lymphatics, a process called metastasis (Barrios, 2022). The most common types of cancer include lung, prostate, colon, and breast cancer. According to recent population health projections, the estimated global incidence of cancer diagnoses is expected to continue to increase in the coming decades, with new cases discovered reaching over 20 million annually by 2025, increasing cancer incidence (Zugazagoitia et al., 2016; Ginsburg et al., 2017).
Methotrexate (MTX) is one of the main drugs used for a range of cancer treatments. It is commonly used to treat psoriasis. As an early-stage chemotherapy agent, MTX is widely used in the treatment of breast, lung, and head and neck cancers. Interestingly, research also suggests that MTX may reduce the risk of cardiovascular complications. The drug is similarly used for rheumatoid arthritis, which is likely achieved by increasing adenosine levels in the body. While stopping folate synthesis risks exacerbating oxidative damage, MTX itself works to eliminate harmful substances and reduce unwarranted inflammation (O Dell, 1997). The administration of high-dose MTX results in bone marrow suppression by impeding the replication of healthy cells and causing gastrointestinal inflammation. Therefore, to avoid or mitigate these negative effects of MTX, it is essential to find an ideal carrier or delivery approach that allows the targeted delivery of optimal MTX quantities. One challenge is that MTX has poor solubility in fat compositions, complicating delivery efforts (Moshikur et al., 2021). The use of unique dispersions has been shown to be beneficial in improving MTX absorption by the body and reducing unwanted side effects (Rahdar et al., 2020; Changez et al., 2024). Regarding formulation, scientists strive to develop micro- and nanocarriers for various pharmaceutical compounds, and microemulsions (µEs) are emerging as effective drug carriers (Ray et al., 2015; Ullah et al., 2022). The key advantages of µEs include their thermodynamic stability, low viscosity, and ability to solubilize both hydrophilic and hydrophobic molecules. Their application promises controlled release and delivery of MTX for improved therapeutic outcomes (Mahdavinia et al., 2017; Nazar et al., 2017; Ghazy and Hanafy, 2024).
µEs are stable dispersions of water, oil, and surfactants that maintain clarity and optical uniformity. Surfactants and co-surfactants provide these systems with increased surface activity, reduced surface tension, and favorable viscosity properties (Siddique et al., 2021a; Saleem et al., 2023). There are three main types: oil-in-water (O/W) μEs, with oil droplets dispersed in a continuous aqueous phase, used for applications requiring smaller amounts of oil; water-in-oil (w/o) µEs, consisting of water droplets dispersed in a continuous oil phase and widely used for high-oil concentration requirements; and bicontinuous µEs, where both the oil and water phases exhibit continuity and interconnectivity (Nazar et al., 2011a; Azfaralariff et al., 2020). Due to their ability to effectively solubilize hydrophobic compounds such as MTX, µEs improve bioavailability (KIZIBASH et al., 2011). Furthermore, the tiny droplet size within µEs enhances drug permeation and limits loss through first-pass metabolism, presenting great potential for targeted drug delivery (Amarji et al., 2016; Essa et al., 2020; Sultan Rana et al., 2023).
In the current study, three new µE systems were developed, consisting of castor oil as an oil phase, Tween-60 as a surfactant, and water as an aqueous phase. Ethanol, 2-propanol, and 1-butanol aided as co-surfactants in µE-A, µE-B, and µE-C, respectively, to improve the dissolution profile of anticancer MTX. The optimal µE systems contain 3.5 wt% methotrexate at pH 6.5, 4.8 wt% at pH 6.9, and 4.2 wt% at pH 6.3 for µE-A, µE-B, and µE-C, respectively. These loaded µEs were found to be more effective than other designs, highlighting their utility for the improved delivery of MTX. Moreover, an enhanced dissolution rate (>98%) and superior bioavailability of the lyophilized non-aggregated methotrexate nanoparticles (MTX-NPs) were achieved, making them a suitable formulation for oral administration (Nazar et al., 2021).
Materials and methods
Materials and chemicals
Absolute ethanol (≥99.8%), 2-propanol (99.99%), 1-butanol (99.99%), castor oil, and Tween-60® (99.99%) were purchased from Sigma-Aldrich. Methotrexate (working standards) was provided by Lahore Chemical & Pharmaceutical Works (Private) Limited, Pakistan (the molecular structures of MTX and Tween 60 are shown in Supplementary Figures S1, S2 in Supplementary Material, respectively). Deionized and double-distilled water (conductivity ≤1 μs/cm and viscosity 0.01 poise) was used for dilution and other experimental purposes.
Preparation of the o/w μE
Three new μE formulations were prepared using Tween-60 (HLB = 14.9), ethanol, 2-propanol, and 1-butanol at a constant ratio (1:1). To obtain a translucent μE, a surfactant mixture (Smix) was placed in an ultrasonicator, followed by the addition of an appropriate amount of castor oil and further dilution with water using the titration method. The pseudoternary phase diagram was mapped using Tween-60 as the surfactant, castor oil as oil, and water as the aqueous phase (Figure 1). Ethanol, 2-propanol, and 1-butanol were used as co-surfactants in the preparation of μE-A, μE-B, and μE-C, respectively. The final composition of the optimal μE-A consists of Tween-60 (40%), ethanol (40%), castor oil (9%), and water (11%); the optimal μE-B composition consists of Tween-60 (38%), 2-propanol (38%), castor oil (9%), and water (15%); and the optimal μE-C composition consists of Tween-60 (41%), 1-butanol (41%), castor oil (8%), and water (10%). The morphological transformation of all systems from an oil-rich (w/o) system to a water-rich (o/w) system was accessed at a constant oil-to-surfactant ratio by selecting a water dilution line AB highlighted in the pseudoternary phase diagram.
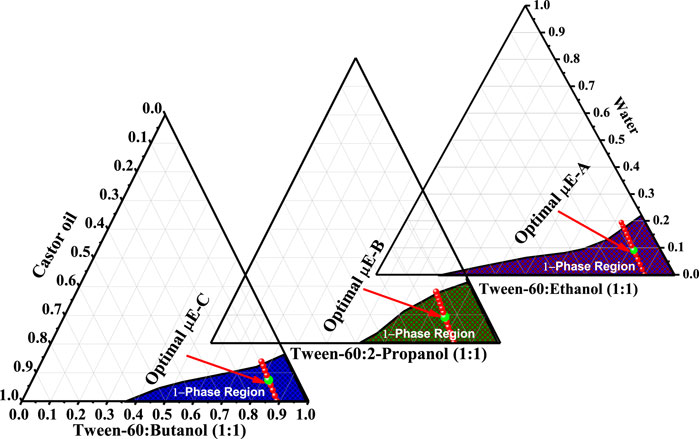
Figure 1. Pseudoternary phase diagram showing the one-phase region µE (purple-shaded) of ethanol/Tween-60/castor oil/water as μE-A, 2-propanol/Tween-60/castor oil/water (olive-shaded) as μE-B, and 1-butanol/Tween-60/castor oil/water (blue-shaded) as μE-C. The red line represents the dilution line selected for further investigations. The highlighted green mark on the dilution line represents the optimal µE composition.
Incorporation of MTX in the μE and preparation of MTX nanoparticles
Under continuous stirring, the maximum amount of MTX was loaded into the optimal systems as follows: 3.5 wt.% at pH 6.5, 4.8 wt.% at pH 6.9, and 4.2 wt.% at pH 6.3 for μE-A, μE-B, and μE-C, respectively. To maintain the temperature at 25°C ± 0.5°C, a Lauda M20 thermostatic water bath was used. All three μE systems (MTX-free and MTX-loaded) were stable and remained clear for 6°months. A rotary evaporator was used to obtain the MTX NPs. All μE formulations were freeze-dried, placing the colloidal solution in a freeze dryer (model: Alpha 1-2 LD Plus; Christ) to remove all water and organic substances and obtain fine and dried MTX nanopowder. The loading efficiency percentage (LE%) and entrapment efficiency percentage (EE%) of MTX were computed using the following formula:
Characterization of the microemulsion
Physiochemical properties, stability, and optical microscopy study
The stability and homogeneity of all MTX-free and MTX-loaded μE formulations were checked by centrifugation of the samples for 15 min at 3,000 rpm using a Hermle Z-200A Centrifuge (Germany). The biological microscope (LABOMED FLR Lx 400, Jenoptik, Germany) had a magnification of 4×/10×/40×/100× and was used to manifest any type of structural transition occurring in the structure of MTX-free μE systems.
Electrical conductivity and viscosity measurements
The phase changes from w/o to o/w via a bicontinuous phase within the MTX-free μE were assessed using electrical conductivity measurements. A conductometer (ADWA AD3000, Hungary) was used to measure the electric conductivity (σ), whereas viscosity (ƞ) was measured using a calibrated Brookfield viscometer (LVDV-2T, United States) at 25ºC ± 1°C with 150 rpm by flushing and washing the viscosity at each measurement.
Size distribution and morphological analysis
The average droplet size and zeta potential of MTX-free and MTX-loaded μE systems were determined at room temperature using a Zetasizer (Malvern, Nano ZSP, United Kingdom). Morphological analyses were conducted to explore the internal structure of both MTX-free and MTX-loaded μEs. These investigations were performed using a JEOL 2100 high-resolution transmission electron microscope (HRTEM, Japan), equipped with a LaB6 electron gun operating at 200 KV. Samples of the MTX-free and MTX-loaded μE were carefully positioned onto copper grids and subsequently air-dried to prepare them for observation under the microscope.
Spectroscopic measurements
FTIR spectra were recorded of pure MTX, MTX-free, and MTX-loaded μE systems at a resolution of 2 cm-1 within the range of 500–4,000 cm-1 using a Bruker FTIR (Alpha Series, Germany). Meanwhile, a spectrofluorophotometer (Shimadzu RF-6000, Japan) was used to measure steady-state fluorescence. A range of 300–600 nm was used to record the fluorescence spectra of MTX. These spectra were recorded in the aqueous phase, oil phase, and all Smix (1:1) and optimal μE systems.
Dissolution release study
The dissolution rate of MTX-NPs was examined using USP apparatus I (Basket) at 50 rpm for 30 min in 900 mL of the dissolution medium. The temperature was maintained at 37°C ± 0.5°C. For the dissolution test, the PT-DT70 instrument was used, and the absorbance at 306 ± 2 nm was measured using a UV–visible spectrophotometer (Shimadzu UV-1800, Japan). After a set period of 45 min, the samples were removed, and the extracted liquid was replaced with the dissolution medium. The sample was filtered using a 0.45-µm filter paper. Each test was performed in triplicate.
A comparative dissolution profile of MTX-NPs and methotrexate–commercial formulation (MTX-CF) was also studied at buffer pH 1.2, buffer pH 4.5, and buffer pH 6.8. Twelve units (equivalent to the same active substance weight) of both types of products were taken. The dissolution time was 60 min, and the same conditions were applied as mentioned above for the study. The sample was drawn at 5, 10, 15, 20, 30, 45, and 60 min. The sample was drawn and filtered using a 0.45-µm filter paper. The same volume was added to the dissolution as drawn. The UV–visible spectrophotometer (Shimadzu UV-1800) was used to measure the sample and standard solution at 306 ± 2 nm.
MTX-NP-μE-A, MTX-NP-μE-B, and MTX-NP-μE-C were stored at 15°C and elevated temperatures (40°C) for more than 6 months. No change in physical form was observed for all three formulations. The stability data show that all three formulations are stable and can be used commercially.
Results and discussions
Phase studies and physiochemical behavior
A ternary phase diagram is used to help study the phase behavior and determine the ideal circumstances for the generation of μEs by checking the compatibility of oil, water, and the surfactant (Rahman et al., 2017). It also helps determine the correlation between the phase behavior of the excipients of μEs and drug molecules (Mitchell and Ninham, 1981). The water dilution method was used to investigate the behavior of each phase; it is a quick, precise, and economical procedure (Pal et al., 2017). Optimal μE-A comprises Tween-60 (40%), ethanol (40%), castor oil (9%), and water (11%); optimal μE-B comprises Tween-60 (38%), 2-propanol (38%), castor oil (9%), and water (15%); and optimal μE-C comprises Tween-60 (41%), 1-butanol (41%), castor oil (8%), and water (10%), respectively. The shaded area in Figure 1 shows the μE region, and the dilution line is indicated by red lines in that μE region. The highlighted mark on the dilution line signifies the optimal μE that is used for further investigation and characterization (Saleem et al., 2018). Water-rich quantity shows that the optimal μE is w/o μE. Figure 1 shows the differences in the μE region, which are attributed to the varying co-surfactants used in the three systems (Siddique et al., 2021a).
The compatibility of oil with the co-surfactant and surfactant chain length plays a crucial role in determining the formation of µE structures (Lawrence and Rees, 2012). The different physiochemical properties of the μE systems are presented in Table 1. However, the microstructural transitions in the structure of the μE system cannot be evaluated using the ternary phase diagram. Therefore, the transitions in the one-phase region of the µE system are explored by conductivity (σ), viscosity (η), and optical microscopic analysis as a weight fraction of the aqueous component (Φw).
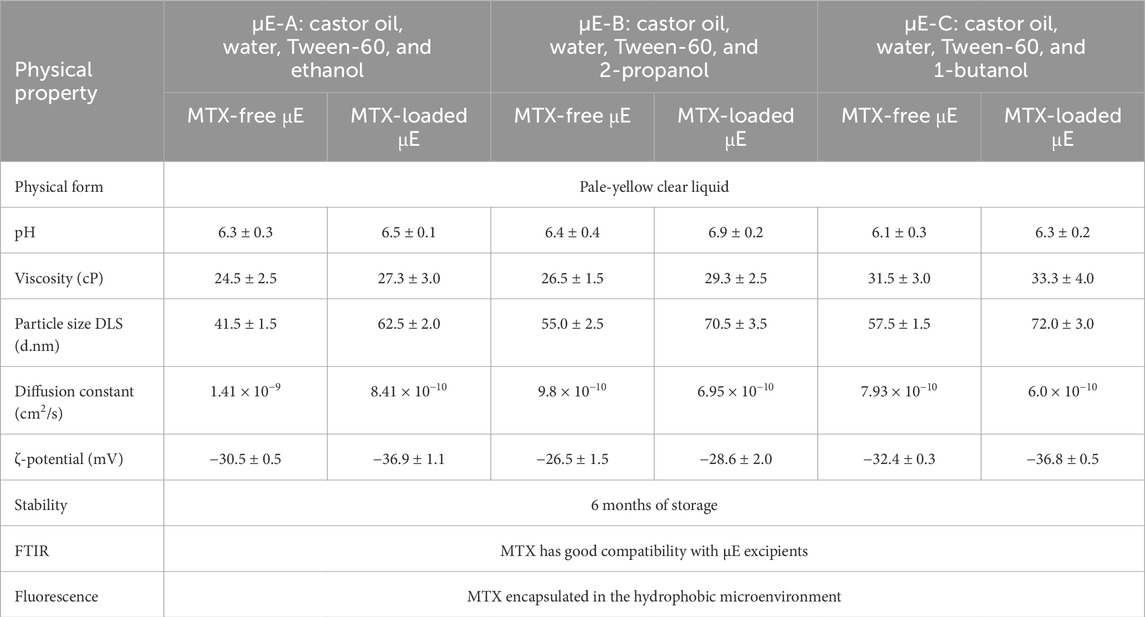
Table 1. Physical parameters of optimal μEs.
Electrical conductivity measurements
Electrical conductivity is a useful technique for evaluating the structural transition and forecasting a conductive network channel (bicontinuous μE) in µEs. The conductance is measured along the dilution line AB by constantly adding water to the oil, surfactant, and co-surfactant mixture (Acosta et al., 1996; Yadav et al., 2018). As the water was added, a change in the electrical conductance of the mixture occurred, as shown in Figure 2, which displays the plot of σ and its first derivative (dσ/dΦ) versus Φw for each µE system. An abrupt change occurred when the phase transition occurred. The phase transition from a w/o to o/w µE occurred, although the bicontinuous phase is determined by the conductivity (σ) of the water component (weight fraction) Φw (Kahlweit et al., 1993; Olivieri et al., 2003).
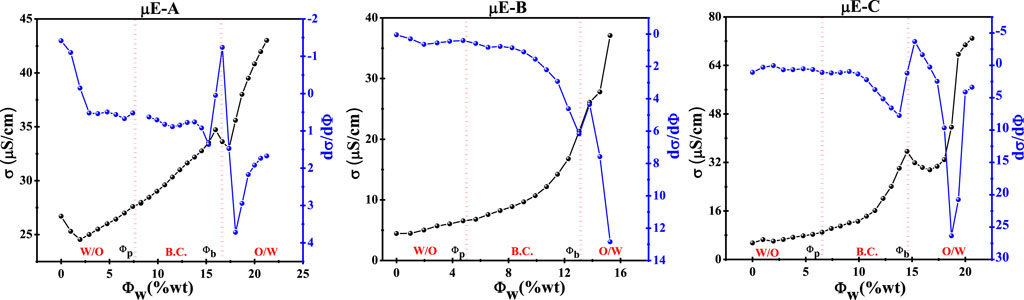
Figure 2. Discrepancy in the electrical conductivity (σ) and the first derivative of the electric conductivity (dσ/dΦ) with Φw (wt%) of µE-A, µE-B, and µE-C.
For µE-A, Figure 2 shows that the Φw value is below ∼8%, and the bicontinuous region of µE-A begins at ∼ 9% Φw, called the percolation threshold (Φp), below the slight increase observed in the Φw value (w/o µE). At a value of 16% Φw, sudden changes occurred, which indicated that σ decreased due to the increase in water content. The increase in water content leads to the development of o/w, which leads to the phase transition of Φb. With the increase in the value of Φw, the change in the first derivative (dσ/dφ) also further helps determine the phase transition in the µE domain (Formariz et al., 2008; Pal et al., 2017).
For µE-B, Φw slightly increases until the critical Φw value is 4.5%. The bicontinuous region starts at 5% of the percolation threshold (Φp). At this value, Φp w/o µE exists and is higher than the Φp value (Φw > 4.4%). σ increases until Φb (Φw ∼8.6%) is formed. After Φb, the sudden decrease in the σ value corresponds to an increase in the water ratio, thereby forming the o/w µE (Gaudana et al., 2010). For µE-C, the Φp value starts at 6.0% Φw, which is slightly higher than the Φw value (w/o µE). The changes occur at the 14.5% Φw value, which indicates that σ decreases as the water content increases. The increase in water content causes the development of the o/w µE, which leads to the phase transition of φb
Viscosity measurements
Viscosity measurement is a commonly used approach to observe the occurrence of phase transitions in µEs since it depends on the droplet size (Üstündağ-Okur et al., 2014). Along the dilution line AB, for all three µE systems, viscosity (η) and its first derivative (dη/dΦ) were mapped as a function of Φw, as shown in Figure 3. The change in the viscosity trend followed the same pattern as the conductivity. The change in water content along the dilution line resulted in a viscosity change. It was observed that a steady increase in viscosity with increasing weight fraction (Φw) of the aqueous component for every formulation occurred, which could be beneficial for controlling the slow diffusion of MTX at high dilutions (Acosta et al., 1996; Baptista and Tran, 1997).
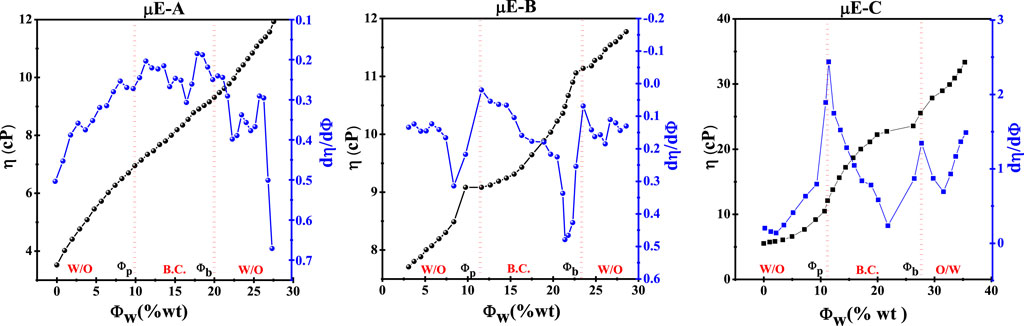
Figure 3. Variation in viscosity (η) and its first derivative (dη/dΦ) with water content as a function of Φw (wt%) of optimal µE-A, µE-B, and µE-C.
By increasing the plots between (dη/dΦ) and Φw, Φp and phase transition of µEs can be determined, as shown in Figure 2. The results of µE-A, µE-B, and µE-C of the Φp computed (dη/dΦ) and Φw assumed showed that there is a w/o µE up to 10%, from 10% to 20% the o/w phase of the transition, and after 20%, there is an o/w µE (Malik et al., 2006).
Microscopic studies
The biological microscope was used to examine the microstructural transitions in µE systems via the bicontinuous phase, which determines the process of microstructure modification of µE (Nazar et al., 2020). Figures 4A–C show three anticipated phase transitions of µE-A; w/o µE, bicontinuous networks, o/w µE, and the proposed microstructure changes are shown in Figure 4, which shows the microstructure transformation of µEs with increasing concentration of the aqueous phase (Paria and Khilar, 2004).
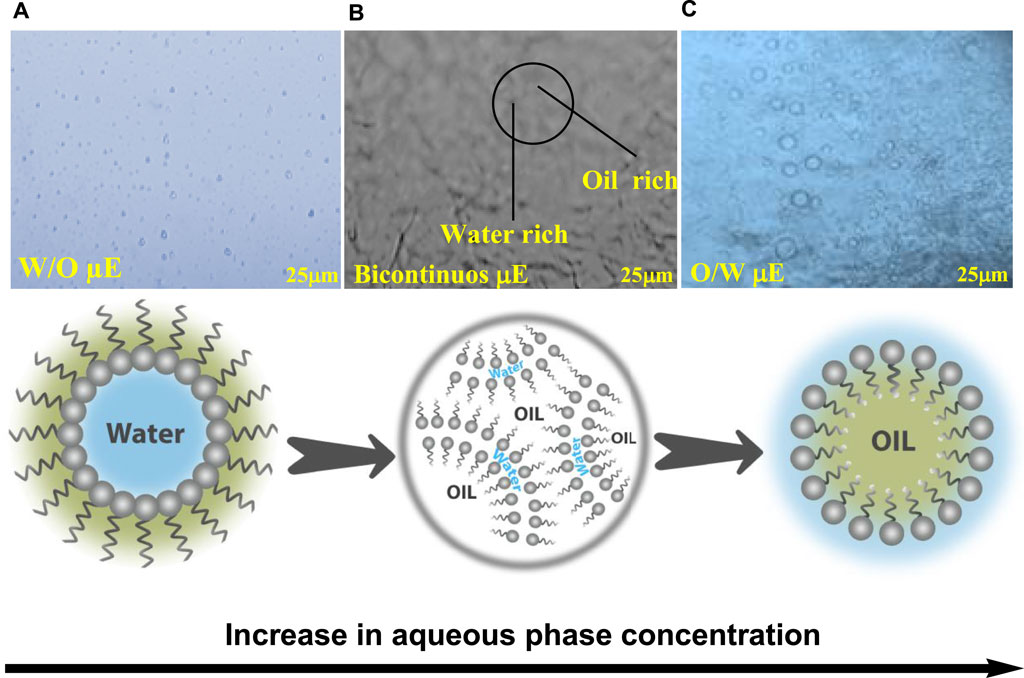
Figure 4. Microscopic images of µE-A; (A) w/o µE, (B) bicontinous µE, (C) o/w µE; along with the proposed microstructure variations in the µE.
Figure 4A shows a w/o µE with dispersed water droplets in the oil phase, while the o/w µE revealed that the oil droplets were present in the continuous aqueous phase (Figure 4C), and the bicontinuous µE showed a network of spherical droplets creating bicontinuous channels (Figure 4B). These results were also consistent with earlier studies (Nazar et al., 2018). The hydrophilic–lipophilic balance (HLB) between the surfactant and co-surfactant had an impact on the microstructures of the µE systems. o/w systems were produced by a lipophilic-leaning HLB, whereas w/o systems were produced by a hydrophilic-leaning HLB. When neither oil nor water droplets predominated, a bicontinuous µE appeared, suggesting percolation behavior (Khan et al., 2016; Rahman et al., 2016). The microstructure transformation of µE-B and µE-C with increasing concentrations of the aqueous phase obtained from an optical microscope is shown in Supplementary Material (Supplementary Figure S3).
The enhanced solubility of MTX in each optimized μE formulation is achieved, i.e., 3.5 wt% at pH 6.5, 4.8 wt% at pH 6.9, and 4.2 wt% at pH 6.3 in μE-A, μE-B, and μE-C, respectively. Furthermore, high EE% and excessive LE% are obtained for each formulation. The quantitative EE% and LE% are 94.22% ± 0.48% and 22.50% ± 0.48 for μE-A, 86.78% ± 0.92% and 17.75% ± 0.48 for μE-B, and 82.45% ± 1.15% and 15.95% ± 0.48 for μE-C, respectively.
Size distribution and zeta potential measurements
The evaluation of physical stability is a key factor in the preparation of µE systems. Particles having a smaller size exhibit a higher surface area and can easily permeate with fast release (Siddique et al., 2024). The particle size distribution of MTX-free µE-A and MTX-loaded µE-A was computed, as shown in Figure 5A. The average size of MTX-free µE-A was ∼42 nm, with a polydispersity index (PDI) of 0.112. Likewise, the average size of MTX-loaded µE-A was ∼62.5 nm, and the PDI was 0.194. The DLS results showed an increase in size upon the loading of MTX in the optimal µE, which confirmed the encapsulation of MTX (Zafar et al., 2024). MTX-loaded µE-A exhibited an increase in size due to the loading of MTX (Rahman et al., 2017; Siddique et al., 2021a). The small size of droplets provides higher mobility, enhanced surface area for encapsulation, and enhanced dissolution and maximum release of the drug. Moreover, the larger size of the µE systems provides less mobility, which leads to slow drug release (Nazar et al., 2018; Siddique et al., 2021b). The particle size distribution of MTX-free µE-B (∼55 nm), MTX-loaded µE-B (∼70.5 nm), MTX-free µE-C (∼57.5 nm), and MTX-loaded µE-C (∼72 nm) is given in Supplementary Material (Supplementary Figure S4A, B).
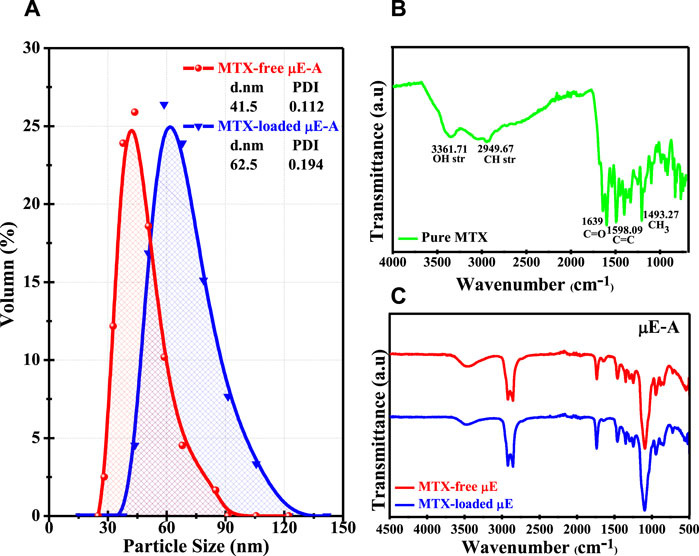
Figure 5. (A) Size distribution of MTX-free µE-A and MTX-loaded µE-A. (B) FTIR spectrum of pure MTX. (C) FTIR spectra of the MTX-free µE and MTX-loaded µE.
Zeta (ζ) potential is the most significant parameter to evaluate the stability of colloidal systems. A higher value of ζ-potential indicates higher stability without any aggregation of droplets, while a low zeta potential shows less stability, leading to aggregation or coagulation. A highly stable colloidal system shows a ζ-potential value of >30 mV or < -30 mV due to the steric and electrostatic repulsion between particles (Nazar et al., 2009; Nazar et al., 2018). These ζ-potential calculations show the stability of MTX-loaded µE-A (−36.95 mV), MTX-loaded µE-B (−28.6 mV), and MTX-loaded µE-C (−36.8 mV) in Supplementary Material (Supplementary Figure S5). The substantial negative ζ-potential values of nanodroplets in µE systems are very suitable for the development of a stable drug delivery system. Additionally, the higher negative ζ-potential value demonstrated the improved stability and longer shelf life of the µE system (Bhagyaraj and Krupa, 2020; Saleem et al., 2020; Freidus et al., 2021).
FTIR analysis
FTIR is a powerful analytical technique that provides information about the molecular structure and functional groups present in a sample. FTIR analysis was used to investigate possible interactions between MTX and the different components of the µE system (Baptista and Tran, 1997; Dinache et al., 2020). The investigation concentrated on finding characteristic infrared peaks and patterns, which can show any alterations or shifts indicating chemical interactions in any µE system before and after loading MTX. In order to guarantee the durability and efficacy of the µE system as a drug delivery mechanism, this procedure is essential (Nazar et al., 2009).
The chemical stability of MTX in µE systems and the interactions between MTX and the other components of µEs were evaluated. As shown in Figure 5B, the FTIR of MTX showed the following characteristic peaks: a major peak at 3,361 cm-1 was observed due to the carboxylic group [O-H stretching], whereas the peak at 2,949 cm-1 is assigned to the CH3 group [C-H stretching]. The peaks at 1,639 cm-1 were due to the stretching of the carbonyl group [C=O stretching] and aromatic rings [C=C stretching]. These spectroscopic studies of µE-A, µE-B, and µE-C, together with MTX-free and MTX-loaded µEs, are shown in Figure 5C and Supplementary Figure S4C, D in Supplementary Material, respectively. The MTX-loaded µE-A, µE-B, and µE-C showed that MTX was completely dissolved in optimal µE systems without any aggregation and absence of any additional peak. Hence, there were no observable interactions present between MTX and µE components, which confirms the chemical stability of MTX in the microstructure of the µE systems (Rajinikanth et al., 2007).
Morphological analysis
The TEM micrographs shown in Figure 6 offer a detailed view of the high-resolution morphology of both the MTX-free μE and MTX-loaded μE. These images confirm a monomodal size distribution consistent with the estimations from DLS studies. Importantly, they reveal a notable increase in the size of the MTX-loaded μE compared to the MTX-free μE, indicating successful MTX loading. The micrographs of the MTX-free μE depict spherical surfaces with fine distribution, suggesting minimal alteration in morphology across all nano-colloidal dispersions. However, the increase in size observed implies the effective encapsulation of MTX, facilitating enhanced bioavailability and solubility. Specifically, μEs are utilized to encapsulate drugs with poor solubility and limited absorption capacity. The formation of these aggregates relies on self-assembly structures or patterns that navigate various obstacles to reach specific destinations, enabling controlled drug release at targeted sites (Alswieleh et al., 2020; Hanafy et al., 2023).
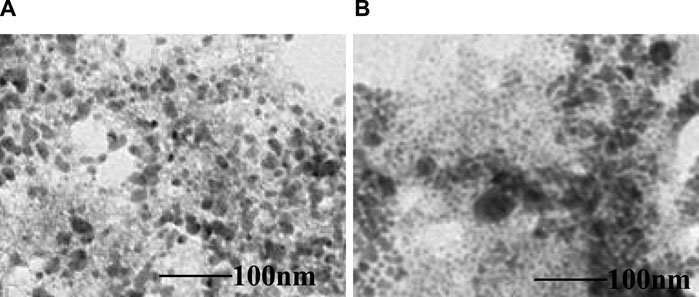
Figure 6. TEM micrographs of the (A) MTX-free µE and (B) MTX-loaded µE.
Fluorescence spectral studies
One commonly used probing method to evaluate drug partitioning in the microdomains of µEs is steady-state spectrofluorophotometry because the absorption properties of the drug are highly influenced by the polarity of the surrounding medium (Lissi et al., 2000; Bermejo et al., 2003; Pal et al., 2011). Figure 7 shows the maximum emissions (λem) of MTX at 365 nm (a characteristic of MTX) in the aqueous phase and appears at 435 nm in the oil phase. However, λem of MTX in Smix-A and µE-A was located at 440 nm and 445 nm, respectively. In addition, the λem values of MTX in Smix-B, µE-B, Smix-C, and µE-C were observed at 405 nm, 415 nm, 438 nm, and 442 nm, respectively. λem of Smix and µE systems showed a red shift in the wavelength with respect to the λem value of the aqueous phase. The λem values of the µE systems are consistent with the λem values of the oil phase. The results suggested that the MTX molecules firmly partitioned themselves in the hydrophobic part of the µEs, which indicates that a higher concentration of MTX is present in the non-polar microenvironment of the µE systems and shielded by the aqueous domain (Ibrahim et al., 2010; Pal et al., 2011).
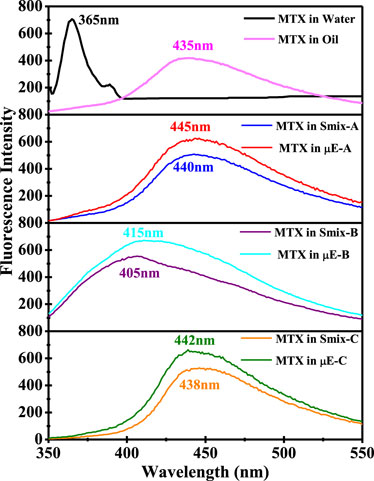
Figure 7. Fluorescence emission spectra of MTX in water, castor oil, Smix-A, Smix-B, Smix-C, and the optimal µE-A, µE-B, and µE-C.
Dissolution release profile studies
A comparative enhanced dissolution release profile of MTX-NPs obtained from all three μE systems was evaluated in different vessels. The results indicate that the drug release profile showed variations compared to conventional formulations at different sampling points in all three μE systems. Figure 8 shows that the average result found was 98.5% ± 1% (p < 0.004) for MTX-NP-μE-A, 84.9% ± 3% (p < 0.001) for MTX-NP-μE-B, and 80.3% ± 2.2% (p < 0.005) for MTX-NP-μE-C.
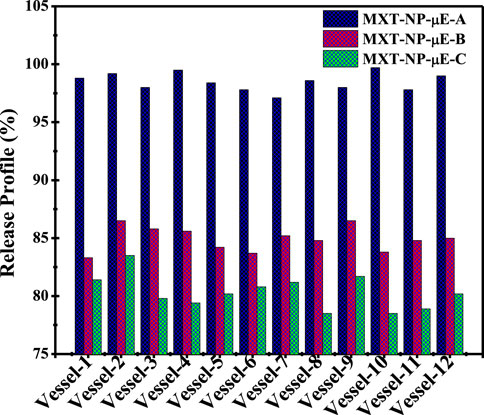
Figure 8. Comparative release profile of MTX-NPs obtained from µE-A, µE-B, and µE-C.
MTX showed the maximum release in MTX-NP-μE-A compared to other formulations, which confirmed improved drug solubility and maximum bioavailability at the site of action (a complete datasheet of the comparative dissolution release profile is shown in Supplementary Material Supplementary Tables S1–S3). The decreasing particle size at interfacial surfaces to the nanometer extent highly influenced the solubility, providing a high surface area for the encapsulation and dissolution rate of drugs with poor wettability (Saleem et al., 2019; Saleem et al., 2020). The release profile of MTX-NPs was compared with that of MTX-CF in different pH media at various intervals of time. MTX-NPs showed maximum release in all mediums with different pH values compared to MTX-CFs. However, the maximum release of MTX-NPs was ∼80.4 ± 1.1% in the interlude of the first 5 min at pH 6.8, while it was ∼75.3 ± 1.2% and ∼65.4 ± 1.1% at a higher pH. Conclusively, MTX-NPs release MTX more readily at lower acidic pH and less so at higher pH, which indicated that the MTX-NPs were pH-sensitive, possibly due to their increased solubility under acidic conditions. This behavior suggests that the MTX might be more effective or stable under acidic conditions and can influence its formulation and therapeutic application. For instance, if intended for release in specific parts of the body like the stomach or intestines, the formulation might need adjustment to optimize release and efficacy. Understanding this pH-dependent release can also guide regulatory and clinical strategies, ensuring the MTX performs effectively under physiological conditions. The release profiles of both MTX-NPs and MTX-CFs at different pH values are given in Supplementary Material Supplementary Figures S6–S9. The nanometrically dispersed MTX-NPs obtained from this study, with improved bioavailability, showed many remarkable advantages and features over other conventional formulations (Narayani and Rao, 1994; Nazar et al., 2011b; Church et al., 2018). Moreover, the MTX-NPs prepared from optimal μE systems can be used as a promising and efficient platform for improving the oral absorption and bioavailability of hydrophobic drugs.
Conclusion
The results of the present study indicate the formation of MTX-NPs from three new μE formulations comprising Tween-60, castor oil, and water, while ethanol, 2-propanol, and 1-butanol are added as co-surfactants in each formulation. Electrical conductivity and viscosity data revealed the microstructural transition of the o/w μE to w/o μE via a bicontinuous region. Optical micrographs are also consistent with electrical conductance and viscosity data and verify the transition of phases in the μE system. The enhanced solubility of MTX in each optimized μE formulation is achieved, i.e., 3.5 wt% at pH 6.5, 4.8 wt% at pH 6.9, and 4.2 wt% at pH 6.3 in μE-A, μE-B, and μE-C, respectively. Furthermore, a high percentage of EE% and an excessive LE% were obtained for each formulation. The quantitative EE% and LE% are 94.22% ± 0.48% and 22.50% ± 0.48 for μE-A, 86.78% ± 0.92% and 17.75% ± 0.48 for μE-B, and 82.45% ± 1.15% and 15.95% ± 0.48 for μE-C, respectively. The DLS results show the monomodal size distribution (40–72 nm) of droplets in μE systems without any aggregation or coalescence upon loading of anticancer MTX. FTIR spectroscopy revealed the good compatibility of anticancer MTX with μE excipients, and no observable molecular interaction was present between the excipients and μE. The probing dynamics results illustrate that more MTX was present in the hydrophobic region of the μE interface. Distinctly, the MTX-NPs obtained from the μE-A system offer superior oral bioavailability and maximum dissolution release (98.5 %± 1%) values compared to the MTX-NPs from the μE-B (84.9% ± 3%) and μE-C (80.3% ± 2.2%) systems. It also confirms that better efficacy of the dosed drug will be achieved due to the higher bioavailability of the drug at the site of action. Moreover, the MTX-NPs prepared from optimal μE systems can be used as a promising and efficient platform for improving the oral absorption of hydrophobic drugs by investigating and determining the other possible intrinsic mechanisms.
Data availability statement
The original contributions presented in the study are included in the article/Supplementary Material; further inquiries can be directed to the corresponding author.
Author contributions
MS: formal analysis and writing–original draft. SZ: software and writing–review and editing. LR: methodology and writing–original draft. MS: data curation, formal analysis, and writing–review and editing. SH: writing–review and editing, funding acquisition, methodology, and project administration. WA: writing–review and editing and resources. KA: writing–review and editing, investigation, and visualization. YI: writing–review and editing and validation. SS: writing–review and editing and formal analysis. MN: writing–review and editing, conceptualization, and supervision.
Funding
The author(s) declare that financial support was received for the research, authorship, and/or publication of this article. The research work was supported by Researchers supporting project number (RSP2024R399), King Saud University, Riyadh, Saudi Arabia.
Acknowledgments
The author, MN, acknowledges the Higher Education Commission of Pakistan for providing financial support through NRPU Project No. 20-17321/NRPU/R&D/HEC/2021. The authors sincerely appreciate funding from Researchers Supporting Project number (RSP2024R399) , King Saud University, Riyadh, Saudi Arabia. Furthermore, the authors acknowledge the Department of Chemistry, University of Education, Multan Campus, Pakistan, for providing laboratory facilities to conduct their research.
Conflict of interest
WA was employed by Lahore Chemical & Pharmaceutical Works (Private) Limited.
The remaining authors declare that the research was conducted in the absence of any commercial or financial relationships that could be construed as a potential conflict of interest.
Publisher’s note
All claims expressed in this article are solely those of the authors and do not necessarily represent those of their affiliated organizations, or those of the publisher, the editors, and the reviewers. Any product that may be evaluated in this article, or claim that may be made by its manufacturer, is not guaranteed or endorsed by the publisher.
Supplementary material
The Supplementary Material for this article can be found online at: https://www.frontiersin.org/articles/10.3389/fmats.2024.1409310/full#supplementary-material
References
Acosta, E., Kurlat, D., Bisceglia, M., Ginzberg, B., Baikauskas, L., and Romano, S. J. C. (1996). Induced electric birefringence and viscosity studies in microemulsions. Colloids Surfaces A 106 (1), 11–21. doi:10.1016/0927-7757(95)03333-5
Alswieleh, A. M., Beagan, A. M., Alsheheri, B. M., Alotaibi, K. M., Alharthi, M. D., and Almeataq, M. S. (2020). Hybrid mesoporous silica nanoparticles grafted with 2-(tert-butylamino) ethyl methacrylate-b-poly (ethylene glycol) methyl ether methacrylate diblock brushes as drug nanocarrier. Molecules 25 (1), 195. doi:10.3390/molecules25010195
Amarji, B., Garg, N. K., Singh, B., and Katare, O. P. (2016). Microemulsions mediated effective delivery of methotrexate hydrogel: more than a tour de force in psoriasis therapeutics. J. drug Target. 24 (2), 147–160. doi:10.3109/1061186x.2015.1058804
Azfaralariff, A., Fazial, F. F., Sontanosamy, R. S., Nazar, M. F., and Lazim, A. M. (2020). Food-grade particle stabilized pickering emulsion using modified sago (Metroxylon sagu) starch nanocrystal. J. Food Eng. 280, 109974. doi:10.1016/j.jfoodeng.2020.109974
Baptista, M. S., and Tran, C. D. (1997). Electrical conductivity, near-infrared absorption, and thermal lens spectroscopic studies of percolation of microemulsions. J. Phys. Chem. B 101 (21), 4209–4217. doi:10.1021/jp970017c
Barrios, C. H. (2022). Global challenges in breast cancer detection and treatment. Breast 62, S3–S6. doi:10.1016/s0960-9776(21)00048-5
Bermejo, R., Tobaruela, D. J., Talavera, E. M., Orte, A., and Alvarez-Pez, J. M. (2003). Fluorescent behavior of B-phycoerythrin in microemulsions of aerosol OT/water/isooctane. J. Colloid Interface Sci. 263 (2), 616–624. doi:10.1016/s0021-9797(03)00391-6
Bhagyaraj, S., and Krupa, I. (2020). Alginate-mediated synthesis of hetero-shaped silver nanoparticles and their hydrogen peroxide sensing ability. Molecules 25 (3), 435. doi:10.3390/molecules25030435
Changez, M., Anwar, M. F., and Alrahbi, H. (2024). Olive oil-based reverse microemulsion for stability and topical delivery of methotrexate: in vitro. ACS Omega 9, 7012–7021. doi:10.1021/acsomega.3c08875
Church, T. L., Bernin, D., Garcia-Bennett, A. E., and Hedin, N. (2018). Dispersed uniform nanoparticles from a macroscopic organosilica powder. Langmuir 34 (6), 2274–2281. doi:10.1021/acs.langmuir.7b03705
Dinache, A., Tozar, T., Smarandache, A., Andrei, I. R., Nistorescu, S., Nastasa, V., et al. (2020). Spectroscopic characterization of emulsions generated with a new laser-assisted device. Molecules 25 (7), 1729. doi:10.3390/molecules25071729
Essa, M. L., El-Kemary, M. A., Ebrahem Saied, E. M., Leporatti, S., and Nemany Hanafy, N. A. (2020). Nano targeted therapies made of lipids and polymers have promising strategy for the treatment of lung cancer. Materials 13, 5397. doi:10.3390/ma13235397
Formariz, T. P., Chiavacci, L., Sarmento, V., Franzini, C., Silva-, A., Scarpa, M., et al. (2008). Structural changes of biocompatible neutral microemulsions stabilized by mixed surfactant containing soya phosphatidylcholine and their relationship with doxorubicin release. Colloids Surfaces B Biointerfaces 63 (2), 287–295. doi:10.1016/j.colsurfb.2007.12.021
Freidus, L. G., Kumar, P., Marimuthu, T., Pradeep, P., and Choonara, Y. E. (2021). Theranostic mesoporous silica nanoparticles loaded with a curcumin-naphthoquinone conjugate for potential cancer intervention. Front. Mol. Biosci. 8, 670792. doi:10.3389/fmolb.2021.670792
Gaudana, R., Ananthula, H. K., Parenky, A., and Mitra, A. K. (2010). Ocular drug delivery. AAPS J. 12 (3), 348–360. doi:10.1208/s12248-010-9183-3
Ghazy, M. G. M., and Hanafy, N. A. N. (2024). Targeted therapies for breast and lung cancers by using Propolis loaded albumin protein nanoparticles. Int. J. Biol. Macromol. 260, 129338. doi:10.1016/j.ijbiomac.2024.129338
Ginsburg, O., Bray, F., Coleman, M. P., Vanderpuye, V., Eniu, A., Kotha, S. R., et al. (2017). The global burden of women’s cancers: a grand challenge in global health. Lancet 389 (10071), 847–860. doi:10.1016/s0140-6736(16)31392-7
Hanafy, N. A. N., Sheashaa, R. F., Moussa, E. A., and Mahfouz, M. E. (2023). Potential of curcumin and niacin-loaded targeted chitosan coated liposomes to activate autophagy in hepatocellular carcinoma cells: an in vitro evaluation in HePG2 cell line. Int. J. Biol. Macromol. 245, 125572. doi:10.1016/j.ijbiomac.2023.125572
Hegde, P. S., and Chen, D. S. (2020). Top 10 challenges in cancer immunotherapy. Immunity 52 (1), 17–35. doi:10.1016/j.immuni.2019.12.011
Ibrahim, H. K., El-Leithy, I. S., and Makky, A. A. (2010). Mucoadhesive nanoparticles as carrier systems for prolonged ocular delivery of gatifloxacin/prednisolone bitherapy. Mol. Pharm. 7 (2), 576–585. doi:10.1021/mp900279c
Kahlweit, M., Busse, G., and Winkler, J. (1993). Electric conductivity in microemulsions. J. Chem. Phys. 99 (7), 5605–5614. doi:10.1063/1.465953
Khan, M. F., Singh, M. K., and Sen, S. (2016). Measuring size, size distribution, and polydispersity of water-in-oil microemulsion droplets using fluorescence correlation spectroscopy: comparison to dynamic light scattering. J. Phys. Chem. B 120 (5), 1008–1020. doi:10.1021/acs.jpcb.5b09920
Kizibash, N. A., et al. (2011). Design of a microemulsion-based drug delivery system for diclofenac sodium. J. Chem. Soc. Pak. 33 (6), 1.
Lawrence, M. J., and Rees, G. D. (2012). Microemulsion-based media as novel drug delivery systems. Adv. drug Deliv. Rev. 64, 175–193. doi:10.1016/j.addr.2012.09.018
Lissi, E., Abuin, E. B., Rubio, M. A., and Cerón, A. (2000). Fluorescence of Prodan and Laurdan in AOT/heptane/water microemulsions: partitioning of the probes and characterization of microenvironments. Langmuir 16 (1), 178–181. doi:10.1021/la990720n
Mahdavinia, G. R., Mosallanezhad, A., Soleymani, M., and Sabzi, M. (2017). Magnetic-and pH-responsive κ-carrageenan/chitosan complexes for controlled release of methotrexate anticancer drug. Int. J. Biol. Macromol. 97, 209–217. doi:10.1016/j.ijbiomac.2017.01.012
Malik, M., Zhao, X., and Drlica, K. (2006). Lethal fragmentation of bacterial chromosomes mediated by DNA gyrase and quinolones. Mol. Microbiol. 61 (3), 810–825. doi:10.1111/j.1365-2958.2006.05275.x
Mitchell, D. J., and Ninham, B. W. (1981). Micelles, vesicles and microemulsions. J. Chem. Soc. Faraday Trans. 2 Mol. Chem. Phys. 77 (4), 601–629. doi:10.1039/f29817700601
Moshikur, R. M., Ali, M. K., Wakabayashi, R., Moniruzzaman, M., and Goto, M. (2021). Methotrexate-based ionic liquid as a potent anticancer drug for oral delivery: in vivo pharmacokinetics, biodistribution, and antitumor efficacy. Int. J. Pharm. 608, 121129. doi:10.1016/j.ijpharm.2021.121129
Narayani, R., and Rao, K. P. (1994). Controlled release of anticancer drug methotrexate from biodegradable gelatin microspheres. J. Microencapsul. 11 (1), 69–77. doi:10.3109/02652049409040439
Nazar, M., Shah, S., and Khosa, M. (2011a). Microemulsions in enhanced oil recovery: a review. Petroleum Sci. Technol. 29 (13), 1353–1365. doi:10.1080/10916460903502514
Nazar, M. F., Khan, A. M., and Shah, S. S. (2009). Microemulsion system with improved loading of piroxicam: a study of microstructure. AAPS PharmSciTech 10 (4), 1286. doi:10.1208/s12249-009-9328-9
Nazar, M. F., Mujeed, A., Siddique, M. Y., Zafar, M., Saleem, M. A., Khan, A. M., et al. (2020). Structural dynamics of tween-based microemulsions for antimuscarinic drug mirabegron. Colloid Polym. Sci. 298, 263–271. doi:10.1007/s00396-020-04603-w
Nazar, M. F., Myakonkaya, O., Shah, S. S., and Eastoe, J. (2011b). Separating nanoparticles from microemulsions. J. Colloid Interface Sci. 354 (2), 624–629. doi:10.1016/j.jcis.2010.11.017
Nazar, M. F., Saleem, M. A., Bajwa, S. N., Yameen, B., Ashfaq, M., Zafar, M. N., et al. (2017). Encapsulation of antibiotic levofloxacin in biocompatible microemulsion formulation: insights from microstructure analysis. J. Phys. Chem. B 121 (2), 437–443. doi:10.1021/acs.jpcb.6b09326
Nazar, M. F., Saleem, M. A., Basharat, H., Nasrullah, A., Asif, H., Ashfaq, M., et al. (2021). Architecting water-dispersible organic nanopowder from volatile microemulsion: an emerging colloidal technology. Colloid Interface Sci. Commun. 45, 100536. doi:10.1016/j.colcom.2021.100536
Nazar, M. F., Yasir Siddique, M., Saleem, M. A., Zafar, M., Nawaz, F., Ashfaq, M., et al. (2018). Fourth-generation antibiotic gatifloxacin encapsulated by microemulsions: structural and probing dynamics. Langmuir 34 (36), 10603–10612. doi:10.1021/acs.langmuir.8b01775
O Dell, J. R. (1997). METHOTREXATE USE IN RHEUMATOID ARTHRITIS. Rheumatic Dis. Clin. N. Am. 23 (4), 779–796. doi:10.1016/s0889-857x(05)70360-4
Olivieri, L., Seiller, M., Bromberg, L., Besnard, M., Duong, T. N. L., and Grossiord, J. L. (2003). Optimization of a thermally reversible W/O/W multiple emulsion for shear-induced drug release. J. Control. Release 88 (3), 401–412. doi:10.1016/s0168-3659(03)00013-0
Pal, N., Saxena, N., and Mandal, A. (2017). Phase behavior, solubilization, and phase transition of a microemulsion system stabilized by a novel surfactant synthesized from castor oil. J. Chem. Eng. Data 62 (4), 1278–1291. doi:10.1021/acs.jced.6b00806
Pal, N., Verma, S. D., Singh, M. K., and Sen, S. (2011). Fluorescence correlation spectroscopy: an efficient tool for measuring size, size-distribution and polydispersity of microemulsion droplets in solution. Anal. Chem. 83 (20), 7736–7744. doi:10.1021/ac2012637
Paria, S., and Khilar, K. C. (2004). A review on experimental studies of surfactant adsorption at the hydrophilic solid–water interface. Adv. colloid interface Sci. 110 (3), 75–95. doi:10.1016/j.cis.2004.03.001
Rahdar, A., Hajinezhad, M. R., Nasri, S., Beyzaei, H., Barani, M., and Trant, J. F. (2020). The synthesis of methotrexate-loaded F127 microemulsions and their in vivo toxicity in a rat model. J. Mol. Liq. 313, 113449. doi:10.1016/j.molliq.2020.113449
Rahman, A., Rahman, M. M., Mollah, M. Y. A., and Susan, M. A. B. H. (2016). Dynamic percolation and swollen behavior of nanodroplets in 1-ethyl-3-methylimidazolium trifluoromethanesulfonate/triton X-100/cyclohexane microemulsions. J. Phys. Chem. B 120 (28), 6995–7002. doi:10.1021/acs.jpcb.6b04763
Rahman, H. M. A. U., Afzal, S., Nazar, M. F., Alvi, D. A., Khan, A. M., and Asghar, M. N. (2017). Phase behavior of a TX-100/oleic acid/water based ternary system: a microstructure study. J. Mol. Liq. 230, 15–19. doi:10.1016/j.molliq.2017.01.011
Rajinikanth, P., Balasubramaniam, J., and Mishra, B. (2007). Development and evaluation of a novel floating in situ gelling system of amoxicillin for eradication of Helicobacter pylori. Int. J. Pharm. 335 (1-2), 114–122. doi:10.1016/j.ijpharm.2006.11.008
Ray, S., Joy, M., Sa, B., Ghosh, S., and Chakraborty, J. (2015). pH dependent chemical stability and release of methotrexate from a novel nanoceramic carrier. RSC Adv. 5 (49), 39482–39494. doi:10.1039/c5ra03546e
Saleem, M. A., et al. (2023). “Chapter 11 - self-nanoemulsifying drug delivery systems with bioavailability potential,” in Novel platforms for drug delivery applications. Editors S. Das, S. Thomas, and P. P. Das (Germany: Woodhead Publishing), 257–275.
Saleem, M. A., Nazar, M. F., Yameen, B., Khan, A. M., Hussain, S. Z., and Khalid, M. R. (2018). Structural insights into the microemulsion-mediated formation of fluoroquinolone nanoantibiotics. ChemistrySelect 3 (41), 11616–11621. doi:10.1002/slct.201801925
Saleem, M. A., Yasir Siddique, M., Nazar, M. F., Khan, S. U. D., Ahmad, A., Khan, R., et al. (2020). Formation of antihyperlipidemic nano-ezetimibe from volatile microemulsion template for enhanced dissolution profile. Langmuir 36 (27), 7908–7915. doi:10.1021/acs.langmuir.0c01016
Saleem, M. N. M., Siddique, M. Y., Khan, A., Ashfaq, M., Hussain, S. Z., Khalid, M., et al. (2019). Soft-templated fabrication of antihypertensive nano-Irbesartan: structural and dissolution evaluation. J. Mol. Liq., 292. doi:10.1016/j.molliq.2019.111388
Siddique, M. Y., Alamgir, I., Nazar, M. F., Sumrra, S. H., Ashfaq, M., Safdar, M., et al. (2021a). Structural and probing dynamics of Brij-35-based microemulsion for fluoroquinolone antibiotics. Colloid Polym. Sci. 299 (9), 1479–1488. doi:10.1007/s00396-021-04871-0
Siddique, M. Y., Nazar, M. F., Mahmood, M., Saleem, M. A., Alwadai, N., Almuslem, A. S., et al. (2021b). Microemulsified gel formulations for topical delivery of clotrimazole: structural and in vitro evaluation. Langmuir 37 (46), 13767–13777. doi:10.1021/acs.langmuir.1c02590
Siddique, M. Y., Nazar, M. F., Saleem, M. A., Haider, S., Sumrra, S. H., Akhtar, M. S., et al. (2024). Formulation of gelled microemulsion for effective permeation of celecoxib across the skin barrier. ChemistrySelect 9 (3), e202302841. doi:10.1002/slct.202302841
Sultan Rana, A., Nazeer, M., Abd El-Gawad, H. H., Inam, M., Ibrahim, M. M., El-Bahy, Z. M., et al. (2023). Microemulsions as potential pesticidal carriers: a review. J. Mol. Liq. 390, 122969. doi:10.1016/j.molliq.2023.122969
Ullah, F., Iqbal, Z., Khan, A., Khan, S. A., Ahmad, L., Alotaibi, A., et al. (2022). Formulation development and characterization of pH responsive polymeric nano-pharmaceuticals for targeted delivery of anti-cancer drug (methotrexate). Front. Pharmacol. 13, 911771. doi:10.3389/fphar.2022.911771
Üstündağ-Okur, N., Gökçe, E. H., Bozbıyık, D. İ., Eğrilmez, S., Özer, Ö., and Ertan, G. (2014). Preparation and in vitro–in vivo evaluation of ofloxacin loaded ophthalmic nano structured lipid carriers modified with chitosan oligosaccharide lactate for the treatment of bacterial keratitis. Eur. J. Pharm. Sci. 63, 204–215. doi:10.1016/j.ejps.2014.07.013
Yadav, V., Jadhav, P., Kanase, K., Bodhe, A., and Dombe, S. (2018). Preparation and evaluation of microemulsion containing antihypertensive drug. Int. J. Appl. Pharm. 10 (5), 138–146. doi:10.22159/ijap.2018v10i5.27415
Zafar, S., Nazar, M. F., Siddique, M. Y., Haider, S., Alam, K., Saleem, M. A., et al. (2024). Formulation and evaluation of ophthalmic microemulsion for enhanced topical administration of brinzolamide. Front. Mater. 11. doi:10.3389/fmats.2024.1363138
Keywords: microemulsion, microenvironment, microstructure, nanodroplets, bioavailability
Citation: Siddique MY, Zafar S, Rizwan L, Saleem MA, Haider S, Azeem W, Alam K, Iqbal Y, Sumrra SH and Nazar MF (2024) Formulation and structural insight of biocompatible microemulsion for enhanced release profile of anticancer methotrexate. Front. Mater. 11:1409310. doi: 10.3389/fmats.2024.1409310
Received: 29 March 2024; Accepted: 10 May 2024;
Published: 31 May 2024.
Edited by:
Miloslav Pekař, Brno University of Technology, CzechiaReviewed by:
Nemany A. N. Hanafy, Kafrelsheikh University, EgyptAjaya Bhattarai, Tribhuvan University, Nepal
Copyright © 2024 Siddique, Zafar, Rizwan, Saleem, Haider, Azeem, Alam, Iqbal, Sumrra and Nazar. This is an open-access article distributed under the terms of the Creative Commons Attribution License (CC BY). The use, distribution or reproduction in other forums is permitted, provided the original author(s) and the copyright owner(s) are credited and that the original publication in this journal is cited, in accordance with accepted academic practice. No use, distribution or reproduction is permitted which does not comply with these terms.
*Correspondence: Muhammad Faizan Nazar, faizan.nazar@ue.edu.pk, faizan_qau@yahoo.com