Nanoscale Friction: Phonon Contributions for Single and Multiple Contacts
 Jeffrey L. Streator
- G. W. Woodruff School of Mechanical Engineering, Georgia Institute of Technology, Atlanta, GA, United States
A generic model has been developed to simulate the effect of phonon interactions during nanoscale sliding with an incommensurate interface. A rigid slider or array of sliders is translated across a 3D elastic slab whose mass elements are harmonically coupled, either in a simple cubic structure (for vast majority of cases) or in a face-centered cubic structure. Each slider interacts with the slab via the Lennard-Jones 6–12 intermolecular potential. Elastic waves are allowed to propagate without any damping and no energy is removed from the system. Boundary conditions are set sufficiently remotely that no significant wave energy returns to the interface from boundary reflection. Simulation results demonstrate that for such nanoscale contacts, (1) the presence of one slider can affect the friction felt by another slider through phonon generation; (2) friction force scales with contact width rather than with contact area; and (3) the friction force may be sensitive to the number of contact regions that comprise a given total area.
Introduction
For two contacting bodies, the friction force may be defined as the force acting in the plane of the interface that opposes the relative lateral displacement of one surface with respect to the other. The static friction force is the force that prevents slip, whereas kinetic friction is the interfacial force that opposes slip when two bodies are in relative tangential motion. One of the defining characteristics of kinetic friction is that it is dissipative, in that it coverts mechanical energy to other forms, eventually degrading to thermal energy. Identifying and understanding the mechanisms of frictional dissipation has long been of scientific interest (Brillouin, 1899; Prandtl, 1928; Tomlinson, 1929; Bikerman and Rideal, 1939; Frenkel and Kontorova, 1939) and there has been renewed focus on this topic, starting about 30 years ago (Sokoloff, 1993a,b, 1996; Brenner et al., 1994; Singer, 1994; Streator, 1994; Harrison et al., 1995; Krim, 1996; Robbins and Krim, 1998) with the introduction of the atomic force microscope (Binnig et al., 1986; Binnig, 1987; Mate et al., 1987, 1988; Kaneko, 1989), which enabled unprecedented spatial resolution in friction measurement. Interest in this question persists, as witnessed by a number of publications within the last 10 years (Ding et al., 2009; Hu, 2009; Benassi et al., 2012; Krim, 2012; Hu et al., 2013; Kajita et al., 2015; Wang et al., 2015; Temizer, 2016; de Mello et al., 2017; Krylov and Frenken, 2017).
Generally speaking, the starting point for accounting for dissipative effects is the recognition that each contacting body is composed of atomic and/or molecular particles that interact with particles of their own body as well as those of the opposing body via electrostatic potentials. At any given moment, the friction force is the result of an instantaneous summation of the particle forces exerted on a particular body in the plane of the interface and in a direction opposite that of its motion relative to the other body. While, at a given instant, the in-plane force experienced by a particular surface particle may have a component in the direction of motion (thereby assisting the motion), it is found that the net in-plane force experienced by a sliding body always opposes the sliding process.
Many investigations have been undertaken to better understand how the friction forces experienced by macroscopic bodies arise from atomic-level interactions. This quest has been a key area of focus for molecular dynamics (MD) simulations in the past 25 plus years or so, resulting in many papers on the subject. A somewhat recent review (Dong et al., 2013) provides a summary of the research on the topic of atomic-scale friction through early 2013. In the present work, we cite only those papers most relevant to the focus of our investigation: phononic contributions to friction, particularly in the case of elastic-only deformation. One of the early investigations of atomic-scale friction (Sorensen et al., 1996) used MD to study the contact between opposing Cu(111) faces, the upper half of the interface being the bottom surface of a tip, and the counter-face being the surface of a multi-layer flat. The authors of that work considered both “matching” cases, where the opposing surfaces had identical orientation, as well as non-matching cases, where the tip was rotated a specified angle about the vertical axis. The authors found that the matching cases were associated with interface stick-slip cycles, whereby the contacting tip surface would be initially stuck to the lower surface while the top surface atoms of the tip would continue with their prescribed lateral displacement. Eventually, a point of instability would be reached, and the built-up strain energy released, as the lower tip surface slipped in the direction of the prescribed motion. It was also observed that, owing to the hexagonal surface structure of the Cu(111) planes, there was significant tip surface displacement transverse to the direction of motion. In the case of non-matching surfaces, it was observed that a non-zero time-averaged friction force was evident for the smaller two contact regions (5 × 5 and 9 × 9 atoms), but essentially vanished for the largest tip surface (19 × 19 atoms). Significantly, the authors attributed the zero-average friction in this latter case to the vanishing of stick-slip motion, which was present in the cases corresponding to the smaller contact areas. It is noted that no wear was found in the simulation of Cu(111) on Cu(111). The authors also performed a simulation of sliding a Cu(100)-faced tip against a Cu(100) counter surface. In this case, slip occurred within the tip, along (111) planes, rather than at the interface between tip and flat, leading to an adhesive wear process and a friction curve that did not reflect periodicity with lateral displacement distance.
Another early MD study (Harrison et al., 1995) considered sliding friction between (111) surfaces of diamond and observed wear-less friction. Other investigators (Zhang and Tanaka, 1997) performed a 2D MD simulation of a diamond tip sliding over a copper flat. They observed fours regimes of interaction: a no-wear regime, an adhesion regime, a plowing regime and a cutting regime, with the occurrence of each determined primarily by the degree of normal interference (indentation depth). It was found that the no-wear regime persisted for a wide range of interference values, suggesting that it is possible for macroscopic bodies to slide without producing any wear.
When interfacial wear and/or significant plastic deformation is present, there is clearly irreversible work associated with the breaking of inter-atomic bonds, which would account for work done by friction. On the other hand, in cases for which no wear is present and for which any deformation is restricted to the elastic regime, the work of friction is balanced by elastic energy propagated into the bulk (Kajita et al., 2015). Ultimately, in a real material, this elastic wave energy is degraded into thermal energy, whereby the motions of atoms become uncorrelated and their kinetic energies become distributed in such a way that one can assign, at any particular time, a single temperature to a small, but finite region. Investigation of the mechanisms of such energy degradation, which, in the case of metals, would require detailing how free electrons exchange energy, back and forth, with the lattice, is beyond the scope of the current paper. Rather, it is of interest here to investigate how friction forces arise from elastic waves that propagate energy away from the interface into the bulk. One early modeling effort to describe the role of wave propagation in the development of friction (Streator, 1994) was based upon essentially a combination of the Tomlinson model (Tomlinson, 1929) and the Frenkel-Kontorova model (Frenkel and Kontorova, 1939). It was shown that interface instabilities excite particle vibrations whose energy propagates from the interface, thereby causing irreversibility and a positive average friction force. An important feature of that study was that the boundaries were chosen sufficiently remotely that no elastic waves would propagate back into the interface during the simulation.
One of the key questions that motivates the current study relates to the dependence of friction on contact area. As has been discussed (Dong et al., 2013), the friction force experienced with matching contacts (i.e., commensurate) tends to scale in proportion to area, whereas, the friction force for non-matching contacts appears to be independent of contact area. In the current work, we consider an incommensurate interface and explore whether the friction force for a given area of contact depends upon (a) the number of separate contact regions that comprise that area and (b) the overall shape of the contact region.
Model Interface
The model formulated here is intentionally generic and is not presumed to replicate any particular material interface. Rather it has been developed to investigate general behaviors that are expected to characterize qualitative trends with essentially any nanoscale sliding contacts that operate within a predominantly or purely elastic regime.
Interface Geometry
A profile of the typical interface in question is illustrated in Figure 1A, and a top view of the same is shown in Figure 1B. The upper body (slider) is a single-layer 2D rectangular array of rigidly connected, non-deforming surface particles, which model atoms. The nearest-neighbor distance within the slider is a. The lower body (elastic slab) is comprised of a 3D lattice of harmonically coupled particles, which are typically, and unless otherwise stated, in a simple cubic arrangement. The undeformed nearest-neighbor distance in the slab is b.
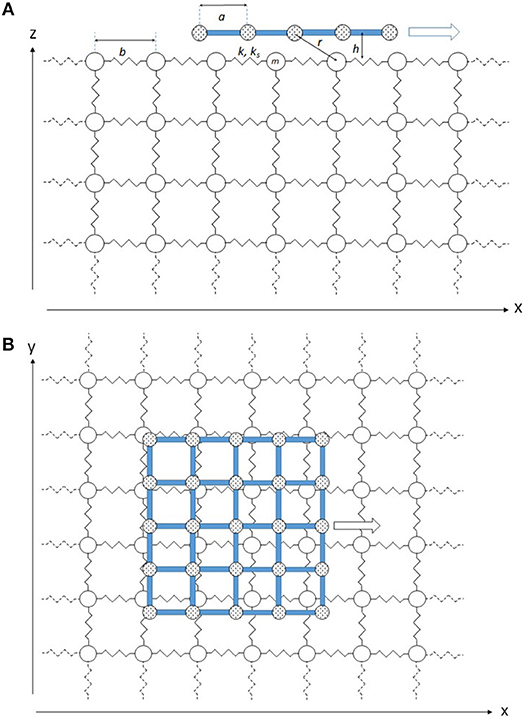
Figure 1. Schematic of model system: (A) cross section of typical rigid slider and elastic slab; (B) top view of system.
Interfacial Forces
The slider and slab interact through the familiar Lennard-Jones 6-12 intermolecular potential (e.g., Atkins, 1994). While Figure 1 shows a single contact region, simulations are also performed for multiple contact regions. Now consider the interaction between an arbitrary particle I of the slider and a surface particle j of the slab. Then the Lennard-Jones potential between them can be written as
where fmin is the minimum possible (most attractive) force that can exist between the two particles, req is the equilibrium spacing and rIj is the distance between the two particles. (By convention, a repulsive force is taken as positive, while an attractive force is taken as negative, so that fmin < 0). By differentiating the above expression, one can obtain the interaction force between the particles, which is directed along the line connecting the two particles. Performing this step and then accounting for the direction cosines, one obtains the following force components exerted on the slider particle I by the slab particle j:
In the foregoing, the coordinates of the slider and slab particles are given by (xI, yI, zI) and (xj, yj, zj), respectively.
Slab Properties
A given particle of the elastic slab interacts with each of its nearest neighbors via linear springs. For normal deformation, the spring constant is k, while for shear deformation, the spring constant is ks. Each particle of the elastic slab has mass m.
To achieve maximum generality, the formulation is placed in dimensionless form by choosing b (the slab lattice parameter) as the length scale, kb as the force scale, and b/co as the time scale, where co is the speed of propagation of longitudinal plane waves in the slab in the long wave-length limit (Ashcroft and Mermin, 1976). For the given simple cubic structure, it is easy to show that this propagation speed is given by .
Simulation Process
To initiate the simulation, the slider is placed at a chosen vertical distance (h) from the undeformed slab surface and with specified x and y coordinates. In almost all cases, the initial slider position is chosen so that the slider (or array of sliders) is centered with respect to the top surface of the slab. The slab particles start out completely motionless and are placed in the simple cubic configuration. The slab particles are allowed to relax in accordance with Newtonian equations of motion, where for the purposes of this step only, a damping coefficient is introduced to facilitate the achievement of static equilibrium. For the simulations involving the fcc slab, the relaxation process was facilitated by incrementally moving the slider toward the target vertical separation, with relaxation occurring for each step. After a specified number of time steps, the sliding phase is commenced, which proceeds in the x-direction. During the sliding process, damping is completely absent. The sliding velocity starts at zero and follows a sinusoidal quarter wave increase until reaching the target speed (Uo). During this acceleration phase, the displacement Δs of a chosen reference point of the slider is given by:
where t is the time elapsed from the initiation of sliding and l1 is the sliding distance during the acceleration phase. The acceleration phase ends when the argument to the cosine function reaches the value of π/2. After the target speed is reached, the speed of the slider is maintained constant for a specified sliding distance l2.
Simulation Parameters
Unless otherwise stated, calculations are performed for the following parameter values:
The simulations are performed with the slider aligned with the slab (see Figure 1B). Thus, with the chosen irrational value of a′, the interface can be characterized as aligned, but incommensurate. The Newtonian equations of motion, which govern the various masses of the slab, are integrated using a 4th order Runge-Kutta integration scheme (e.g., Chapra and Canale, 2006).
Boundary Conditions
Both the bottom and lateral boundaries of the elastic slab are held fixed. However, since it is of interest to investigate how friction arises from the transfer of phonon waves away from the surface into the slab, the dimensions of the slab are chosen to be sufficiently large so that negligible wave energy reflects from the boundary back into the interface. Now, for an isotropic elastic half-space, the pressure wave (or dilatational wave) has a speed a that generally exceeds the speed of longitudinal plane waves and depends on the value of Poisson's ratio (ν) (Graff, 1975). For example, with ν = 1/3, the pressure wave speed is 22.5% higher than the longitudinal wave speed. However, for ν = 0, the two speeds are identical. For our harmonically-coupled simple cubic elastic slab, which is able only to approximate the behavior of an isotropic half-space, we assume that the longitudinal plane wave speed co given above is the largest relevant wave speed.
Recall that the time scale of normalization is chosen as the time for one longitudinal plane wave to traverse a distance b, the nearest-neighbor distance of the slab. Also, a value of 0.77 is chosen for the ratio ks/k so that the ratio of shear wave speed to pressure wave speed would be around 0.5, which is typical for a solid body (Graff, 1975). This shear wave speed is slightly greater than of the Rayleigh surface wave (Graff, 1975). Now since the Rayleigh surface wave, unlike either the pressure or shear wave, retains much of its energy at the top surface of the slab, simulations must be performed in such a way that its reflections from the lateral boundaries do not make it back into the interface during the simulation time. Roughly speaking, the Rayleigh wave travels a dimensionless distance of 0.5 in a single dimensionless time unit. Thus, it takes 2n dimensionless time units for the Rayleigh surface waves to traverse n slab nearest-neighbor distances. Suppose, then, that the slider particles are centered with respect to the slab lateral boundaries, and that the dimensionless lengths of the slider (or of the array of sliders) along the x and y directions are and , respectively. Also suppose that the dimensionless lengths of the slab along the x and y directions are and , respectively. Then the dimensionless distance required for a longitudinal plane wave to reach an x-boundary and return to the interface is approximated by , and the associated dimensionless time for a Rayleigh wave is approximately twice this value, which is . Similarly, for surface waves traveling parallel to the y-axis, one has a go-and-return time of . Now consider longitudinal plane waves traveling in the negative z-direction. These waves must traverse a dimensionless distance of , which requires this same value of dimensionless time.
On the other side of things, the simulation time associated with slider motion is given by the time of the acceleration phase added to the time of the constant-speed sliding phase. This former time is given by , while the latter equals . In dimensionless terms, the total time is then given by . Using the simulation parameter values listed above, one gets a dimensionless sliding time (t′) equal to .
For all of the simulations with the simple cubic slab configuration, we choose (corresponding to 121 nodal points in each direction). Thus, in the z-direction, the longitudinal wave takes 240 dimensionless time units to return to the interface, which greatly exceeds the chosen dimensionless sliding time of 140. In the x-direction the critical dimensionless time for the return of reflected waves becomes . Keeping this value >140 requires to be <50. Similarly, must be no greater than 50 to ensure that no surface waves reflected from the y-boundaries enter the interface. For simulations involving the fcc geometry, the number of particles in each coordinate directions is also 121, but the dimensions in the y and z directions are different from those quoted above owing to the denser packing.
It is noted here that no thermostating or velocity scaling is performed in the current work so as to avoid biasing the computation of friction toward a particular method of removing energy (Braun, 2010; Benassi et al., 2012).
Results and Discussion
Results are now presented for various parameter combinations. To make the discussion less cumbersome, we omit, in most cases, explicit reference to the non-dimensional nature of the quantities discussed. It is to be understood that we have chosen, as described previously, values of time, length and force with which to normalize the dimensional quantities. In most cases, dimensionless parameters are identified as such with a prime symbol (′) on the associated dimensional parameter.
Slider Motion
Figure 2 displays the time histories of the slider displacement (left axis) and velocity (right axis) for the various simulations. As observed, the slider accelerates until a time of about 40 (precisely 12.5π) and then maintains a constant speed of 0.02 until the end of the simulation. The slider is observed to displace a distance of precisely 0.5 during the acceleration phase and then a distance of 2 during the constant-speed phase.
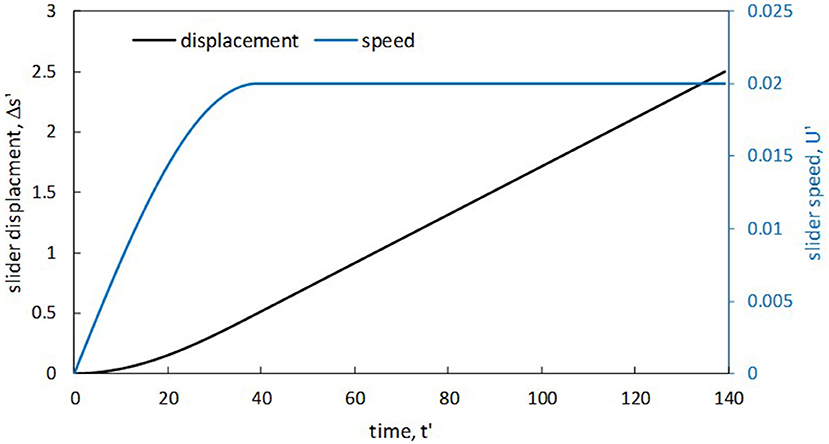
Figure 2. Prescribed time histories of slider displacement and velocity for the various simulations.
Friction Force vs. Slider Displacement
Figure 3 shows a representative result for friction force (F′) and normal load (W′) vs. slider displacement Δs′. The slider is comprised of a 5 by 5 grid of particles, having a nearest-neighbor distance (a′) of , and is placed at a separation (h′) of 0.7. As observed, the friction force begins at zero, rises smoothly (monotonically) and then falls somewhat sharply after a displacement value of about 0.25, even reaching significant negative values. Following this drop, oscillations appear in the friction force record, which persist throughout the rest of the sliding process and the friction force shows an overall near-linear increase, modulated by the aforementioned oscillations. This increase in friction is followed by a steeper decline. It is noticed that the overall shape of the friction record for displacement values between 1 and 2 is similar to that between 0 and 1, the biggest difference being that no oscillations are observed in the first part of the sliding process. Additionally, for the constant-speed phase, a high degree of repeatability is seen in the friction record in comparing the results for 1.5 ≤ Δs′ ≤ 2.5 to those corresponding to 0.5 ≤ Δs′ ≤ 1.5.
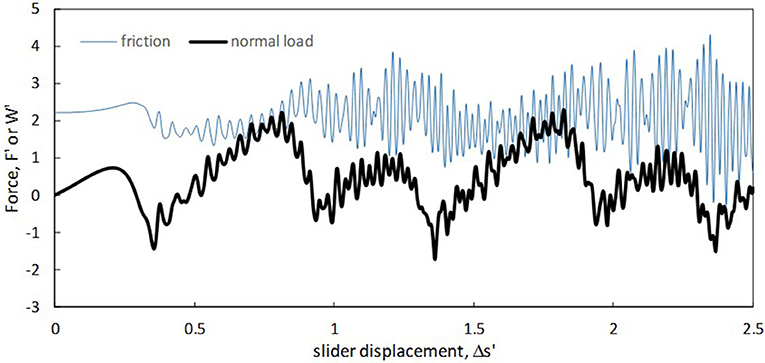
Figure 3. Time histories of friction and normal load for the case of a 5 × 5 slider grid with a vertical surface separation of 0.7.
The normal load record shows an oscillation whose onset and persistence is similar to that found with the friction force. However, the normal load does not show the same degree of repeatability, rather exhibiting a gradual increase in the amplitude of its oscillations with increasing displacement distance.
Effect of Load
The effect of normal load on friction was studied by varying the vertical separation (h′). In each simulation, the slider was comprised of a 4 by 4 grid of particles, corresponding to an area of (The contact area of a given slider grid is taken to be the size of the region bounded by the perimeter nodes.) The results are displayed in Figure 4, which reveals the friction force as a function of normal load. The corresponding (prescribed) values of the surface separation are included on the right axis. Both the reported friction and load values were averaged using values from the constant-speed sliding phases in each case. When the load is negative, which occurs for the higher values of surface separation, the friction force is seen to increase with increasing load, first mildly, then rapidly. Shortly after the load becomes positive, an inflection point is reached, so that the rate of increase of friction with load goes down. At the higher values of load, the friction is seen to experience a linear increase with load.
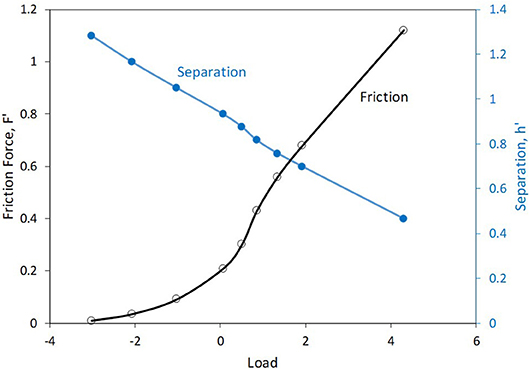
Figure 4. Friction force vs. normal load along with the associated vertical separation. Slider is composed of a 4 × 4 grid of particles.
Effect of Contact Area
Single Contact Regions of Square Shape
A set of simulations was performed, each involving a single slider contact region of square shape. Figure 5 shows how the friction force and normal load depend on contact area (A′). As observed, the friction force increases with increasing area in a sub-linear fashion, roughly following a power law trend with an exponent of 0.63. The normal load, on the other hand, experiences an almost perfectly linear trend with area, as witnessed by the proximity to unity of the square of the correlation coefficient.
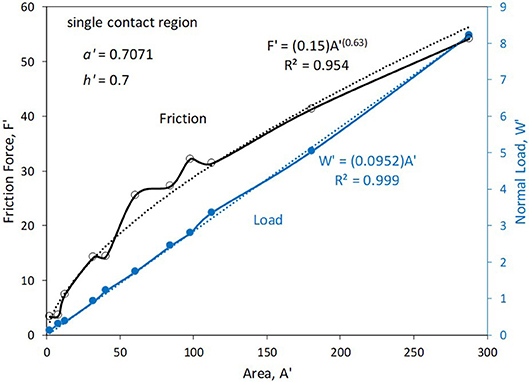
Figure 5. Friction force and normal load vs. contact area for single square regions of varying size.
Multiple Contact Regions of Square Shape
Figure 6 shows friction results for multiple contact regions. For this set of simulations, the total contact area was varied by increasing the number of sliders, starting with a square region of given size. The sliders are arranged symmetrically with respect to the center of the slab surface and are separated from each other by a distance of 10a in both x- and y-directions. The number of sliders progresses according to squares of consecutive integers (i.e., 1, 4, 9, etc.). An illustration of a 3 by 3 array of sliders is included in Figure 6 and the data points associated with this geometry are indicated. The simulation results correspond to arrays of contact regions based on three different individual contact areas: 2, 8, and 12.5. As observed, for each chosen individual contact area size, the friction force grows in proportion to the total area. However, while the results for individual areas of 8 and 12.5 are similar, there is much higher friction associated with a given total contact area when that area is comprised of multiple regions of area 2. In particular, when a total contact area equaling 32 is comprised of 16 regions, the friction force is 11.6, whereas when this same total contact area is formed by 4 regions, the friction force is 3.4. Note that the lower friction in the latter case cannot be attributed to a drop in normal load: for the case of 16 regions, which has the substantially higher friction, the normal load is 3.5, whereas for the case of 4 regions the normal load is higher at 5.9.
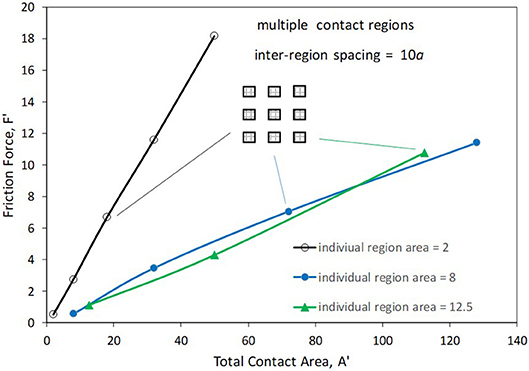
Figure 6. Friction force vs. total contact area for slider arrays. Each curve corresponds to a given individual slider area. Graphic shows the slider array configuration when 9 sliders are used.
Regions With Different Length-to-Width Ratios
Simulations were conducted to investigate the role of contact region shape: One set of sliders (“long” sliders) were given a y-direction length of 4a, with varying length in the x-direction (the direction of sliding), while the other set of sliders (“wide” sliders) were of length 4a along the x-direction and varying length in the y-direction. Figure 7 displays the results and shows the friction force as a function of area for the two sets of sliders. As observed, increasing the length of the slider in the direction of motion has little effect upon the resulting friction force. (There is some variation from one value of length to another, but the trend is flat.) On the other hand, increasing the dimension that is transverse to the direction of sliding results in a linear increase in friction force. For the largest contact area considered (98), the wide slider experiences a friction force that is more than 20 times that felt by the long slider.
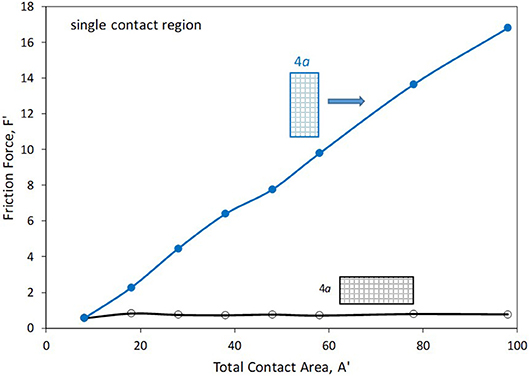
Figure 7. Friction force vs. contact area for long and wide sliders.
To investigate the robustness of foregoing effect, which corresponds to the rectangular-grid slider against the simple cubic slab configuration, simulations were conducted for a slider of hexagonal-grid geometry sliding against the (111) plane of a slab having a face-centered cubic (fcc) structure. The overall shape of the slider remained rectangular, but its particles were arranged in a manner that corresponds to the (111) plane of an fcc crystal. Additionally, the slab orientation was chosen so that its particles were separated by nearest-neighbor distance b along the x-axis. The slider was similarly aligned, but was given a nearest-neighbor distance of . As in the case of Figure 7 “long” sliders were all of the same width in the y-direction, but with increasing length in the x-direction, whereas, “wide” sliders, were of fixed length in the x-direction, but with varying width in the y-direction. For these tests, the slider was located at a distance of 0.5b above the undeformed slab. The results are displayed in Figure 8. As observed, the friction force for long sliders tends to remain flat with increasing area, whereas wide sliders exhibit a friction force that grows approximately linearly with increasing area. These results are qualitatively similar to those for the simpler geometry, as discussed above (see Figure 7). Moreover, the friction forces are of comparable magnitude for the same values of contact area.
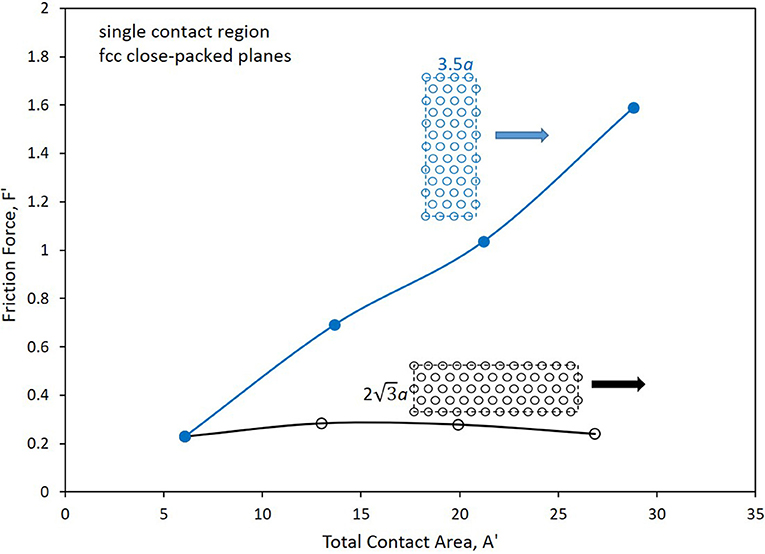
Figure 8. Friction force vs. contact area for long and wide sliders with close-packed slider on (111) plane of fcc slab.
Effect of Spacing Between Tandem Square Contact Regions
To investigate the possible influence of one contact region on the friction experienced by another, two identical square sliders, each having an area of 8, were separated along either the x-axis or y-axis by a specified distance. Figure 9 shows the effect of separating the contact regions along the direction of sliding. This figure shows the average friction force per region (to facilitate comparison to results obtained with a single contact region of the same area). The friction force shows an irregular oscillatory behavior, with a decreasing amplitude and increasing wavelength as the separation distance is increased. Note that the smallest value of separation is equal to a, so that this case actually represents a single rectangular contact region of dimension 9a by 4a. Thus, the total friction force (0.80), which is twice the value shown on the graph, is the same as plotted in Figure 7 for the “long” slider having an area of 18. As the separation is increased beyond the initial values, the friction force per section is seen to rise quickly, ultimately reaching a maximum value of 0.94 at a separation value of 1.33. Following this the friction force reaches a minimum of 0.27, which occurs when the separation distance is 1.77. For the large separations, the friction force per slider region hovers around a value near 0.55. This value is to be compared to the friction force for a single square slider region having an area of 8, which is 0.54 (see first data point in Figure 7 for both curves).
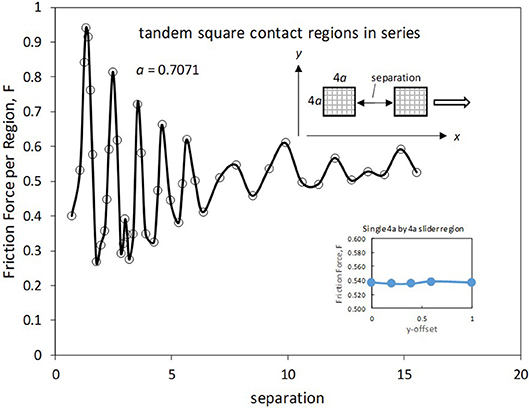
Figure 9. Friction force vs. inter-slider separation for separation along x-axis. Inset shows the effect of slider offset for an isolated slider.
Figure 9 includes an inset that shows the effect of offsetting a single slider a specified fraction of one slab lattice spacing along the x-direction. In the default case, the slider is perfectly centered with respect to the lateral boundaries of the slab, representing an offset of zero. That is, the “southwest” corner of the slider will be situated with a particular x-distance from the slab particle that has the largest x coordinate less than or equal to that of this slider corner. When an array of sliders is considered, the array is also centered, meaning that, for example, each slider region will have its southwest corner at a different x-position relative the default case. Moreover, along the x-axis each slider of the array will have a different offset (owing to the irrationality of a′). However, as seen in the inset, there is almost no effect of x-offset. Thus, the observed dependence of friction on separation distance in the x-direction may be attributed to the mutual influence of the slider regions on one another.
Additional insight into slider mutual influence can be seen in Figure 10. Figure 10A shows the friction record for the left slider of a pair of sliders that are separated by a dimensionless distance of along the x-axis, along with the friction record of an individual slider moving through precisely the same locations, but in the absence of the right slider. All differences, then, in the two friction records are related to the presence (or absence) of the tandem slider. As observed, there is a big effect on the friction experienced by a slider when another slider is present. First of all, the initial friction force (i.e., when the slider displacement is zero) is seen to be lower when there is a right slider present. This result is due to the (static equilibrium) surface deformation that the right slider causes in the slab surface region directly under the left slider. Secondly, there are higher-amplitude oscillations and an overall skewing toward higher friction values. It is noted that the average friction during the constant-speed phase for the left slider of the pair is 0.924, while that for the isolated slider is 0.537. Thus, the presence of the right slider causes a 72% increase in the friction force exerted on the left slider for this particular case.
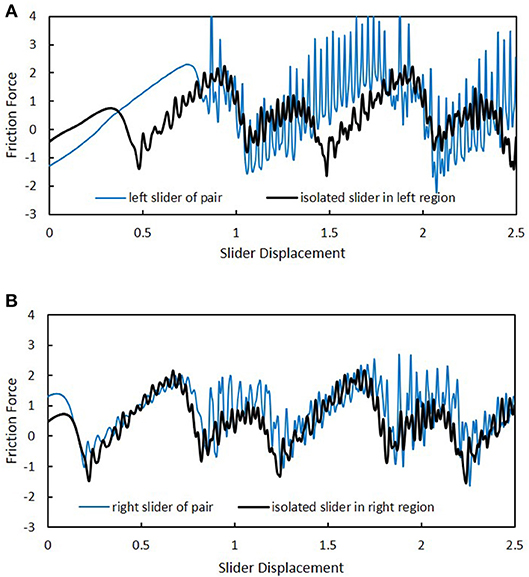
Figure 10. Comparison of slider friction in cases with and without a pairing slider. Pair is separated by along the x-axis. (A) Friction experienced by left slider of pair and by isolated slider at same locations. (B) Friction experienced by right slider of pair and by isolated slider at same locations.
Figure 10B compares the friction record of the right slider of the tandem to that of an isolated slider traversing the exact same positions over time. In this case, the differences in the two records don't appear to be as dramatic as in the case of Figure 10A. Nevertheless, the average friction for the right pair of the tandem is 0.909, as compared to a value of 0.537 for the right individual slider, representing a 69% increase in friction force felt by the right slider due to the presence of the left slider.
A qualitatively different result can also occur, as displayed in Figure 11. In comparison to Figure 10, the separation distance for the tandem sliders is now increased to and the slider positions for the isolated cases are shifted to coincide with the new locations. Figure 10A shows that the friction force is a little bit higher for the left slider at a given location when the right slider is present. The average friction force for the left slider during the constant speed phase is 0.591 with the right slider present, and 0.535 when it is isolated. On the other hand, the right slider experiences an average friction force of only 0.057 when the left slider is present, whereas it experiences a friction force of 0.535 when it slides alone. Owing to the complex, non-linear interactions between the slider particles and those of the slab surface, we are unable to explain, in simple terms, the reasons for the particular ways that one slider affects another as a function of in-plane separation. Such an endeavor is left for a future investigation. However, the results depicted in Figure 12 make it clear that phonons are primarily responsible. In this figure a comparison is made in the mean surface displacement (in the sliding direction) induced in the opposing region by an isolated slider—either left or right—for the configuration of Figure 11. As observed, the mean displacement caused in the left region by the right isolated slider is significantly greater than that induced in the right region by the left isolated slider. Since neither of these regions is in a contact zone, the characteristics of the displacement profiles are due primarily to surface waves that have been generated by the isolated slider as it slides in the opposing region. As seen at the beginning of the sliding process, where the displacement is zero, the induced displacement is of equal magnitude (about 0.7), but opposite sign, for the left and right cases. However, the low friction experienced by the right slider when the left slider is present, cannot be attributed to static deflection caused by the left slider. Notice, as shown in Figure 11B, the initial friction force on the right slider is actually higher when the left slider is present.
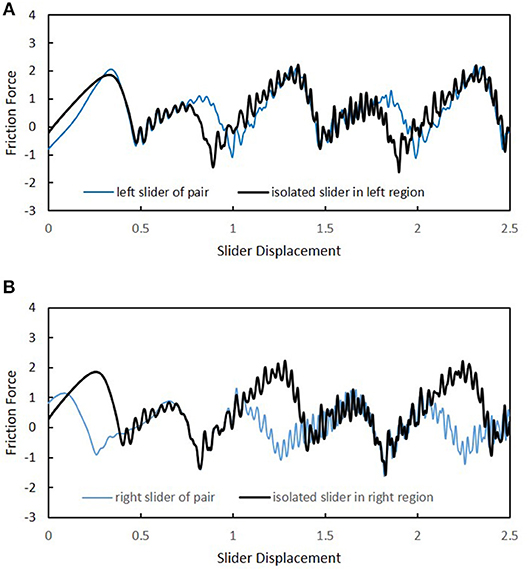
Figure 11. Comparison of slider friction in cases with and without a pairing slider. Pair is separated by along the x-axis. (A) Friction experienced by left slider of pair and by isolated slider at same locations. (B) Friction experienced by right slider of pair and by isolated slider at same locations.
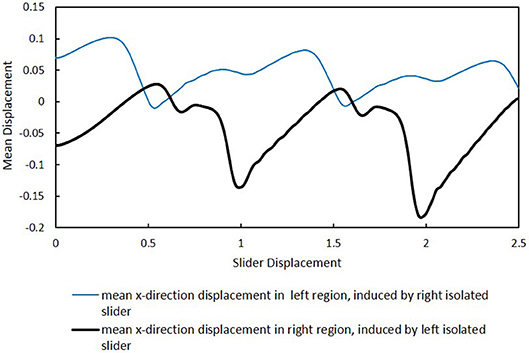
Figure 12. Comparison of mean displacements induced in opposite region by isolated slider.
Figure 13 shows results corresponding to tandem sliders separated along the y-axis by varying distance. As compared to the results for separation in the sliding direction (Figure 9), there are qualitative differences. First, as shown by the inset, there is a significant effect of slider offset. When this effect is accounted for by superposing the friction results for a single (isolated) slider, one sees that the mutual effect of the slider pair is to enhance the friction for each slider at small separations and leave it essentially unchanged at large separations. Note that, unlike the case of Figure 9, each slider influences the other in precisely the same way since the slider configuration is symmetric about the line parallel to the x-axis that goes through the center of the slab surface.
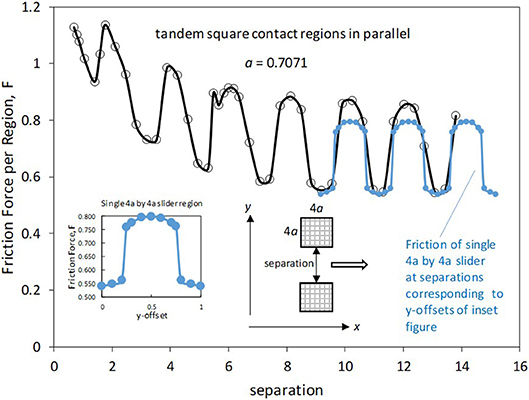
Figure 13. Friction force vs. inter-slider separation for separation along y-axis. Inset shows the effect of slider offset for an isolated slider.
Conclusions
A generic model of nanoscale sliding was developed to investigate the contributions of phonons to kinetic friction. A 2D rigid slider or, alternatively, a 2D array of sliders interacted with an elastic slab via a Lennard-Jones intermolecular potential. The elastic slab was comprised of 121 × 121 × 121 harmonically-coupled masses arranged in either a 3D simple cubic lattice or fcc structure. The vast majority of simulations were performed with the simple cubic structure, for which normal and shear spring constants were defined. For the simple cubic configuration, sliding occurred in the (100) surface of the slab. For the fcc structure sliding occurred on the (111) plane and the slider was similarly close-packed. In all cases, the nearest-neighbor distance within the slider to that of the slab was chosen to be yielding an incommensurate interface. Sliders were translated according to a specified velocity profile, starting from a rest position. All slab particles were initially motionless, and sliding commenced after the slab was allowed to relax to achieve static equilibrium with the slider. Simulations were performed to study the effects of normal load, contact area, slider-slider separation, and slider length-to-width ratio on friction force. The combination of slab size and slider translation speed was selected so as to avoid significant wave energy entering the interface after being reflected from slab boundaries. Results of the simulations lead to the following key findings for this class of nanoscale contacts:
1) The friction force on a given slider may be significantly affected by the presence of another slider nearby. When a pair of sliders translates in a series configuration, the average friction force per slider may either increase or decrease as compared to a slider translating by itself, depending on the precise in-plane separation between the sliders. When a pair of sliders translates in a parallel configuration, the friction experienced by each slider is enhanced. At large slider-slider separation, the sliders become independent of one another.
2) Friction force grows in proportion to contact region width (i.e., the dimension transverse to the sliding direction) rather than in proportion to contact area.
3) For the same total contact area, a large number of very small contact regions experiences a significantly larger force than a single contact region.
Author Contributions
The author confirms being the sole contributor of this work and has approved it for publication.
Funding
Open access publication fees are paid by discretionary funds provided to the author by the G. W. Woodruff School of Mechanical Engineering at the Georgia Institute of Technology.
Conflict of Interest Statement
The author declares that the research was conducted in the absence of any commercial or financial relationships that could be construed as a potential conflict of interest.
References
Benassi, A., Vanossi, A., Santoro, G. E., and Tosatti, E. (2012). Optimal energy dissipation in sliding friction simulations. Tribol. Lett. 48, 41–49. doi: 10.1007/s11249-012-9936-5
Bikerman, J. J., and Rideal, E. K. (1939). A note on the nature of sliding friction. Philos. Magaz. 27, 687–692. doi: 10.1080/14786443908562269
Binnig, G., Quate, C. F., and Gerber, C. (1986). Atomic force microscope. Phys. Rev. Lett. 56, 930–933. doi: 10.1103/PhysRevLett.56.930
Binnig, G. K. (1987). Atomic-force microscopy. Physica Scripta T19a, 53–54. doi: 10.1088/0031-8949/1987/T19A/008
Braun, O. M. (2010). Bridging the gap between the atomic-scale and macroscopic modeling of friction. Tribol. Lett. 39, 283–293. doi: 10.1007/s11249-010-9648-7
Brenner, D. W., Tupper, K. J., Sinnott, S. B., Colton, R. J., and Harrison, J. A. (1994). Structure, energy-dissipation, and nonadhesive friction - computer-simulations of sliding diamond interfaces and self-assembled monolayers. Abstr. Papers Am. Chem. Soc. 207:116.
Brillouin, M. (1899). Molecular theory of friction of smooth surfaces. Comptes Rendus Hebdomadaires Seances Academie des Sci. 128, 354–355.
Chapra, S. C., and Canale, R. P. (2006). Numerical Methods for Engineers. Boston, MA: McGraw-Hill Higher Education.
de Mello, S. R. S., da Costa, M. E. H. M., Menezes, C. M., Boeira, C. D., Freire, F. L., Alvarez, F., et al. (2017). On the phonon dissipation contribution to nanoscale friction by direct contact. Sci. Rep. 7:3242. doi: 10.1038/s41598-017-03046-8
Ding, L. Y., Gong, Z. L., and Huang, P. (2009). Energy dissipation mechanism of phononic friction. Acta Phys. Sin. 58, 8522–8528. doi: 10.7498/aps.58.8522
Dong, Y. L., Li, Q. Y., and Martini, A (2013). Molecular dynamics simulation of atomic friction: a review and guide. J, Vacuum Sci. Techno. A 31:030801. doi: 10.1116/1.4794357
Frenkel, J., and Kontorova, T. (1939). On the theory of plastic deformation and twinning. J. Physics Ussr 1, 137–149.
Harrison, J. A., White, C. T., Colton, R. J., and Brenner, D. W (1995). Investigation of the atomic-scale friction and energy-dissipation in diamond using molecular-dynamics. Thin Solid Films 260, 205–211. doi: 10.1016/0040-6090(94)06511-X
Hu, Y. Z. (2009). “Fundamentals of friction and energy dissipation,” in Advanced Tribology, eds J. Luo Y. Meng T. Shao, and Q. Zhao (Berlin; Heidelberg: Springer), 597. doi: 10.1007/978-3-642-03653-8_192
Hu, Y. Z., Ma, T. B., and Wang, H. (2013). Energy dissipation in atomic-scale friction. Friction 1, 24–40.doi: 10.1007/s40544-013-0002-6
Kajita, S., Tohyama, T., Washizu, H., Ohmori, T., Watanabe, H., and Shikata, S. (2015). Friction modification by shiftin phonon energy dissipation in solid atoma. Tribol. Onl. 10, 156–161. doi: 10.2474/trol.10.156
Kaneko, R. (1989). Scanning tunneling microscopy and atomic force microscopy - approach to micro-tribology. J. Japanese Soc. Tribol. 34, 19–22.
Krim, J. (2012). Friction and energy dissipation mechanisms in adsorbed molecules and molecularly thin films. Adv. Phys. 61, 155–323.doi: 10.1080/00018732.2012.706401
Krylov, S. Y., and Frenken, J. W. M. (2017). Energy dissipation accompanying atomic-scale friction: nonlocality and memory. Colloid J. 79, 341–345. doi: 10.1134/S1061933X17030073
Mate, C. M., Erlandsson, R., Mcclelland, G. M., and Chiang, S. (1988). Atomic force microscopy studies of frictional forces and of force effects in scanning tunneling microscopy. J. Vacuum Sci. Technol. Vacuum Surfaces Films 6, 575–576. doi: 10.1116/1.575167
Mate, C. M., Mcclelland, G. M., Erlandsson, R., and Chiang, S. (1987). Atomic-scale friction of a tungsten tip on a graphite surface. Phys. Rev.Lett. 59, 1942–1945. doi: 10.1103/PhysRevLett.59.1942
Prandtl, L. (1928). Mind model of the kinetic theory of solid bodies. Zeitschrift Fur Angewandte Mathematik Und Mechanik 8, 85–106. doi: 10.1002/zamm.19280080202
Robbins, M. O., and Krim, J. (1998). Energy dissipation in interfacial friction. MRS Bull. 23, 23–26. doi: 10.1557/S088376940003058X
Singer, I. L. (1994). Friction and energy-dissipation at the atomic-scale - a review. J. Vacuum Sci. Techno. Vacuum Surfaces Films 12, 2605–2616. doi: 10.1116/1.579079
Sokoloff, J. B. (1993a). Fundamental mechanisms for energy-dissipation at small solid sliding surfaces. Wear 167, 59–68. doi: 10.1016/0043-1648(93)90055-Q
Sokoloff, J. B. (1993b). Theory of energy-dissipation in sliding crystal-surfaces at nonzero temperature. Phys. Rev. B 47, 6106–6109. doi: 10.1103/PhysRevB.47.6106
Sokoloff, J. B. (1996). Theory of electron and phonon contributions to sliding friction. Phys. Sliding Friction 311:217–229. doi: 10.1007/978-94-015-8705-1_14
Sorensen, M. R., Jacobsen, K. W., and Stoltze, P. (1996). Simulations of atomic-scale sliding friction. Phys. Rev. B 53, 2101–2113. doi: 10.1103/PhysRevB.53.2101
Streator, J. L. (1994). “A molecurlarly-based model of sliding friction,” in Tribology Series, D. Dowson, C. M. Taylor, T. H. C. Childs, M. Godet, and G. Dalmaz (Amsterdam, Elsevier. 173-183. doi: 10.1016/S0167-8922(08)70306-7
Temizer, I. (2016). Sliding friction across the scales: thermomechanical interactions and dissipation partitioning. J. Mechanics Phys. Solids 89, 126–148. doi: 10.1016/j.jmps.2016.01.012
Tomlinson, G. A. (1929). A molecular theory of friction. Philosoph. Magaz. 7, 905–939. doi: 10.1080/14786440608564819
Wang, Z. J., Ma, T. B., Hu, Y. Z., Xu, L., and Wang, H. (2015). Energy dissipation of atomic-scale friction based on one-dimensional prandtl-tomlinson model. Friction 3, 170–182. doi: 10.1007/s40544-015-0086-2
Keywords: nanoscale friction, phonon, multiple contacts, sliding, contact area
Citation: Streator JL (2019) Nanoscale Friction: Phonon Contributions for Single and Multiple Contacts. Front. Mech. Eng. 5:23. doi: 10.3389/fmech.2019.00023
Received: 11 January 2019; Accepted: 15 April 2019;
Published: 16 May 2019.
Edited by:
Ashlie Martini, University of California, Merced, United StatesReviewed by:
Jinjin Li, Tsinghua University, ChinaWenzhong Wang, Beijing Institute of Technology, China
Copyright © 2019 Streator. This is an open-access article distributed under the terms of the Creative Commons Attribution License (CC BY). The use, distribution or reproduction in other forums is permitted, provided the original author(s) and the copyright owner(s) are credited and that the original publication in this journal is cited, in accordance with accepted academic practice. No use, distribution or reproduction is permitted which does not comply with these terms.
*Correspondence: Jeffrey L. Streator, jeffrey.streator@me.gatech.edu