Roughness of Deposited Carbon-Based Coatings and Its Statistical Characteristics at Nano and Microscales
 Feodor M. Borodich1*
  Emmanuel Brousseau1 Alastair Clarke1 Andrey Pepelyshev2 Juan Carlos Sánchez-López3
- 1School of Engineering, Cardiff University, Cardiff, United Kingdom
- 2School of Mathematics, Cardiff University, Cardiff, United Kingdom
- 3Materiales Funcionales Nanoestructurados, Instituto de Ciencia de Materiales de Sevilla, CSIC-Universidad de Sevilla, Seville, Spain
Topography of surfaces may influence many processes in tribology including friction and adhesion. Its influence is usually taken into account in various statistical models of rough surfaces. Most of these models are based on an explicit or implicit assumption of normality of the asperity heights or similar assumptions that involve Gaussian distributions. Recently it has been shown that the height distribution of surfaces prepared by grinding are not Gaussian at both nano and micro-scales, while topography of epoxy resin replicas of polishing papers having nominal asperity sizes up to several micrometers, was Gaussian. Here we study roughness of carbon-based coatings deposited by direct current pulsed magnetron sputtering with and without substrate bias voltage at micro and nano-scale. Hardness measured using a Berkovich indenter tip gave 43 (biased) and 14 (non-biased) GPa, respectively. First the heights of the nano-asperities were determined by AFM (Atomic Force Microscopy). Then the heights of the micro-asperities were measured by a profilometer (a stylus). Finally the same regions measured by stylus were again studied by AFM. Standard statistical parameters of surfaces are determined at each scale. It has been also shown that the stylus measurements did not cause plastic deformations of the harder (biased) sample because the distributions of heights at nano-scale were the same. Using the experimental data obtained, the assumption of the normal distribution for the roughness heights has been studied by application of various modern tests of normality. Measurements of surfaces by stylus and by AFM with the 117 nm steps showed that the surfaces satisfy the assumption of normality of the heights. However, further studies with the 10 nm AFM steps showed that the roughness of the non-biased sample is not normal. Hence, the applicability of the standard statistical models of adhesive contact between rough solids to the non-biased sample may be questionable.
1. Introduction
It is well-established that topography of solid surfaces involves finite scale roughness regardless of preparation method of the surfaces (Khusu et al., 1975; Goryacheva, 1997). In precision engineering practice surface roughness is a key factor in determining successful component performance, particularly in tribological applications (e.g., gears, bearings). Friction, wear and energy dissipation during sliding are strongly influenced by asperity deformation which is, in turn, controlled by the surface profile. Modern nanotechnology considers surfaces whose roughness is below the micro-meter scale and traditional statistical approaches to sur- face roughness have to be improved to achieve further progress in studying interactions at the nano/micro scales.
It has been shown recently that a model where the nano-scale asperities are mainly responsible for molecular and chemical interactions and the micro-scale asperities are responsible for modeling the mechanical interlocking of asperities may reflect the main features of friction (Borodich and Savencu, 2017). Hence, for proper modeling friction, it is important to get information about the surface roughness not only at microscale but also at nanoscale. This subject is a current challenging task in contact mechanics description and comprehension of nano-related phenomena as highlighted by Carpick in a very recent article appeared in Science, (Carpick, 2018).
The overwhelming majority of papers using statistical approaches to description of surface roughness are based on explicit or implicit assumption of normality (Gaussian) distribution of asperity heights. Let us explain the importance of the assumption of normality. For modeling tribological processes, both the vertical and horizontal distributions of the asperities should be used. As it was noted by Maugis (2000), two profiles may have the same height and peak height distributions, but they may differ in the horizontal extension. It is a common practice now to model the surface roughness profiles as graphs of stationary random processes. If the vertical distribution is normal (Gaussian) then it can be completely described by two parameters: (i) the height distribution and (ii) a correlation (auto-correlation) function (Linnik and Khusu, 1954a,b; Whitehouse and Archard, 1970; Khusu et al., 1975). Hence, the explicit or implicit assumption of the Gaussian distribution of heights is employed also in almost all established models of contact between rough adhesive surfaces. This is related to both non-adhesive models of contact and the classic models of adhesive contact between rough surfaces such as developed by Fuller and Tabor (1975), Maugis (2000), Galanov (2011), Fuller (2011), Galanov and Valeeva (2016); see also a review in Borodich et al. (2016).
Thus, if it is established that the surface roughness is Gaussian, then one can use the classic models of contact. Very recently, we tested the hypothesis of normality using mathematically rigorous approach (Borodich et al., 2016; Pepelyshev et al., 2018) on grinded surfaces. We showed that the asperities of grinding surfaces are not normal at both nano and microscales whilst intact surfaces of replicas of polishing papers are normal. Therefore, it is of high interest the validation of these assumptions in engineered surfaces and coatings submitted to friction and wear in order to afford correctly the theoretical description of the tribological phenomena employing the above models.
The auto-correlation function that characterizes the horizontal distribution of asperities of a rough surface profile, is often substituted by its Fourier transform that is called the spectral density function. However, if the process is not Gaussian then mean and covariance functions of a random process do not determine the finite-dimensional distributions of a random process (Gusak et al., 2012). As it was noted by Ghosal and Van der Vaart (2017), if a process is non-Gaussian then the properties of the sample paths are not fully determined by the mean and covariance functions. Therefore, the models based on the use of solely the covariance function (the spectral density function) are wrong from the statistical point of view and these models are not discussed here further.
Magnetron sputtering (MS) has developed rapidly over the last decades to the point where it has become established as the process of choice for the deposition of a wide range of industrially important functional coatings for mechanical, tribological, decorative, optical, or electrical applications. With the development of pulsed magnetron sputtering technologies, the limitations for depositing fully dense defect-free insulating materials could be overcome pulsing the direct current (DC) magnetron discharge in the mid-frequency range (100–350 kHz). In the last years, a new variant called high power pulsed magnetron sputtering (HiPIMS) and the later modification known as modulated pulsed power magnetron sputtering (MPPMS) produce a high degree of ionization of the sputtered species similar to an arc source but without generating macroparticles (Alami et al., 2009; Lin et al., 2010; Sarakinos et al., 2010). HiPPMS-grown films exhibit significantly smoother surfaces and are denser than the DC-MS ones.
Carbon-based (CB) coatings continue to draw significant attention form scientific and industrial communities because of their exceptional mechanical and tribological properties that can be tailored from superhard, like in diamond, to soft and lubricant, like in graphite. Their functionality can be controlled by modifying the sp3/sp2 carbon hybridization ratio, the hydrogen content or the incorporation of different alloying components, e.g., metals, non-metals, nanoparticles, etc. (Sánchez-López and Fernández, 2008). With the recent advances in deposition processes, it has now become a scientific issue to understand the effects of the plasma processes on the film structure and properties. The investigation of topographical features by applying statistical models results therefore very useful to establish correlation among them. Here we study roughness of two carbon-based coatings deposited by direct current pulsed magnetron sputtering with and without negative polarization of the substrates. The application of a bias voltage leads to an increment of energy of impinging ions affecting film nucleation and growth. Ion bombardment during the growth of thin films has a strong influence on the morphology, composition and microstructure, which largely determine film properties. A scientific issue is the understanding of the effect of ion energy flux delivered on the film growth and surface roughness. A mathematical description of surface asperities for both type of coatings can shed light on the influence of ion bombardment, a relevant key parameter particularly with the advent of high-density plasmas technologies (HiPIMS and MPPMS).
The paper is organized as follows. In section 2 we give some preliminary information concerning various carbon-based coatings. In section 3 we study topography of different amorphous carbon films prepared by DC-pulsed magnetron sputtering techniques with and without bias applied to the substrates.
The surface roughness was measured in three stages: (i) the roughness of intact samples is measured at nanometer scale using atomic force microscopy (AFM); (ii) the roughness of the same samples is measured at micrometer scale by a stylus profilometer, (iii) the roughness of the same samples whose roughness could be affected by the stylus is measured again at nanometer scale using AFM. The AFM steps were 117 nm except the additional AFM measurements that used 10 nm steps. Finally we discuss the applicability of statistical contact models to the amorphous carbon-based coatings deposited by direct current pulsed magnetron sputtering with and without substrate bias.
2. Carbon-Based Coatings
The CB coatings is a very wide class of materials including diamond, graphite, carbides, and amorphous carbon. DLC is a subclass of amorphous carbon that has some properties similar to properties of diamond. The hardest type of DLC is tetrahedral amorphous carbon (ta-C). Amorphous carbon and tetrahedral amorphous carbon films may be both hydrogenated (a-C:H and ta-C:H) and non-hydrogenated (a-C, and ta-C). They can be also doped by different elements including metals (e.g., W, Ti, Ni, and Cr) and non-metals (e.g., B, N, O, P, and Si). The tribology of these coatings was intensively studied and reviewed (see, e.g., Donnet and Erdemir, 2008 and chapters therein). It was established that the friction and wear properties of CB coatings are dependent on the surface topography, the structure of the films, the atmospheric conditions, and surface chemistry.
At the nanoscale, the effects of surface roughness and the underlying physical phenomena, such as adhesion between contacting objects, have a considerable influence on the interaction between surfaces. It is known that surface roughness is one of the main factors affecting friction and wear of rubbing solids. On the other hand, the deposition techniques may greatly influence the produced roughness of the surfaces. First, let us consider the case of rough abrasive surfaces and abrasive wear. For example, boron carbide (nominally B4C) coatings produced by sputter deposition on steel coupons (Harris et al., 2002) had a cauliflower-like shape with surface roughness of about 400 nm. This hard coating (23 GPa measured by nanoindentation) can substantially reduce the roughness of a steel counterpart, e.g., from 250 to 50 nm within less than 100 cycles of a pin-on-disc test through a mechanical polishing process. The number of the so-called sharp asperities of the coatings responsible for abrasion of the counter part is reduced as a power-law function of number of cycles (Borodich et al., 2002, 2003).
In many other cases, smooth carbon-based tribological coatings are able to provide an ultralow friction coefficient based on the low shearing forces between interacting surfaces. A typical phenomena observed in this situation is the formation of a third-body layer on the counterface material and the surface modification of the initial layer involving a graphitic-like transformation. This interfacial layer is able to accommodate sliding and adsorb deformation energy, resulting in low friction and reduced wear of the counterfaces. The atmosphere surrounding the tribological contact can affect by physical and chemical interactions the surface topography, transfer layer build-up, adhesion to mating surfaces and as a consequence the friction behavior. An illustrative example taken from the literature is carbon nitride (CNx) films where initial roughness is modified by tribochemical wear processes.
Originally CNx coatings were introduced as a superhard solid lubricant (Chen et al., 1993) because the coefficient of friction (COF) of steel-CN pair in unlubricated conditions was about 0.16. However, it was shown later that in special circumstances the coatings may demonstrate properties of superlubricity behavior depending on the test conditions and environments (Sánchez-López et al., 2002; Kato et al., 2003; Adachi and Kato, 2008; Fontaine et al., 2008). Oxygen gives a totally opposite effect on friction: it rises continuously up to 0.36. Surprisingly argon and helium gases gave an effect similar to oxygen. Tests performed under streams of oxygen and nitrogen gases show that if the initial cycles of sliding were in O2 gas stream and then in the N2 gas stream then the values of the COF reduces from about 0.1 to 0.005.
An attempt to explain these and other effects related to CB coatings was presented by Borodich et al. (2008). It was presented a collection of different wear and friction mechanisms that depend on the history of the rubbing process, including the history of gaseous atmosphere around the rubbing surfaces.
It is argued that the first stage of wear process (run-in) is abrasive. High flash temperature field on the summits of the protuberances (asperities) that arises due to rubbing, leads to 1st kind of thermal decomposition of the CNx that enhances parallel graphitization of initially amorphous films. This in turn leads to shearing of graphitizated parts of the protuberances. This kind of decomposition of the coating is accelerated in oxygen environment. To achieve super-low friction, one needs to produce a passivated (no dangling bonds) super-smooth surface, e.g., by sliding in air or O2 gas stream during initial cycles which leads to shearing of graphitizated bumps and super-finish of the CNx surfaces, and then by sliding in nitrogen atmosphere.
3. Experimental Samples and Devices
3.1. Samples
The two amorphous carbon (a-C) films used for this study were deposited on silicon substrates by DC-pulsed magnetron sputtering in Ar atmosphere (5 × 10⁻³ mbar) using a graphite target at 300 W. The pulse conditions were set at 250 kHz of frequency, 496 ns of duration (87.6% of duty cycle). A negative bias of approximately 150 V was applied to the substrate in one of the cases. Both processes were carried out at room temperature and the measured thicknesses were 700 and 1,300 nm for biased and non-biased samples, respectively. Carbon-based coatings prepared by plasma-assisted deposition methods at room temperature are generally amorphous as they are synthetized in conditions out of thermodynamic equilibrium. There are many papers based on DLC and a-C coatings where these structural characteristics are proven (see, e.g., Wang et al., 2010).
Hardness measurements carried out with a MTS Nanoindenter II XP using the continuous stiffness measurement (CSM) technique and a diamond Berkovich (three-sided pyramid) indenter tip gave 43 (biased) and 14 (non-biased) GPa, respectively. Scanning electron microscopy (SEM) data were recorded in a FEG Hitachi S4800 microscope operating at 5 kV.
3.2. The AFM
The AFM system used to measure the nanoscale topography of the sample was the XE-100 model from Park Systems. The probes employed were the CSG model from NT-NDT. These probes are utilized for contact mode AFM operations and are designed with a rectangular-type cantilever, which is Au-coated on its reflective side. These probes are made of single crystal silicon and have a nominal force constant of 0.11 N/m, as stated by the manufacturer. The typical curvature radius of the tip mounted at the free of the cantilever is stated to be 6 nm. In particular, the dimension of a scanned area was set at 30 x 30 μm. However, the scanned area was 40 x 40 μm for the first scan of the bias a-C sample. Additional AFM measurements were performed on 2.56 x 2.56 μm. In all cases 256 x 256 grid was used. This means that the AFM step was 117 nm for the area 30 x 30 μm and 10 nm for the area 2.56 x 2.56 μm, respectively.
3.3. The Profilometer
The surfaces of the samples at micrometer scale were measured using a Taylor Hobson Form Talysurf Series 2 stylus profilometer. This equipment uses a conical diamond-tipped stylus, with a 2 μm spherical tip radius. An inductive gauge with a resolution of 16 nm over a vertical measurement range of 1 mm is used to measure stylus deflection as it is moved over the surface being measured by the traverse unit, a highly accurate linear slide. Roughness measurements are typically made at 0.25 μm spacing, and can be exported from the system as raw measurements, or after leveling, form removal, filtering or other processing. The instrument used in this paper is also fitted with a motorized y-axis stage, which allows a series of two-dimensional (line) measurements to be taken and post-processed to form a three-dimensional areal measurement of surface roughness. Typically, these measurements are spaced at 1 μm in the y direction. The dimension of a scanned area was set at 40 x 120 μm.
4. Statistical Approaches to Rough Surfaces
A review of statistical approaches to surface roughness was given by Borodich et al. (2016). The first attempt to use the random process approach in tribology is due to Linnik and Khusu (1954a,b). They suggested to represent a profile z(x) of a polished surface as a realization from some normal stationary process whose auto-correlation function
can be approximated as
where R(0) and α are parameters which describe the roughness, is the average value (the mean line) of the profile function z(x) and δ is the lag. The auto-correlation function can be substituted by its Fourier transform – the power spectral density G(ω):
where ω is the signal frequency. For the exponential auto-correlation function the power spectral density is
The asperity heights were calculated from the middle line of the profile, that, in turn, was calculated by the least square method. This was leading to introduction of additional parameters. Using this description, Linnik and Khusu (1954a,b) (see also Khusu et al., 1975) measured (i) the fraction of the horizontal line at a specific level, which lies within the roughness profile, i.e., they calculated the Abbott-Firestone curve, and (ii) the total area of the profile cove above this horizontal line. They reported a quite good agreement of the obtained results with their particular experimental observations. They suggested also to use the Abbe test for checking that the expectations of all values are the same, i.e., there is no trends in data.
Whitehouse and Archard (1970) argued that a profile of a random rough Gaussian surface can be represented by the waveform of a random signal that is completely defined by two parameters: a height distribution and an auto-correlation function defined in Equation (1). Sometimes this statement is misunderstood and one can find a wrong interpretation that Whitehouse and Archard (1970) suggested to employ fractal approach.
As it has been shown above (see also a review by Borodich et al., 2016), the crucial assumption of many models of contact is that the surface roughness is Gaussian. Hence, it is important to check if the height distribution of the tested surfaces follow the normal distribution.
A large number of methods for testing for normality has been developed (Thode, 2002). Each normality test is based on a particular test statistic that is used to give a quantitative estimation of proximity between an observed sample of measurements and the theoretical normal distribution. The assumption of normality is especially critical when characteristics of roughness profiles are derived. The main methods for testing for normality are the following tests: Kolmogorov-Smirnov (KS), Lilliefors (LF), Shapiro-Wilk (SW), Anderson-Darling (AD), Cramervon Mises (CVM), the Pearson, and Shapiro-Francia (SF). These tests were already used for checking normality of grinding surfaces (Borodich et al., 2016) and surfaces of replicas of polishing paper samples (Pepelyshev et al., 2018). Here we will present the tests for the sake of completeness. Using the test statistic, each of the above tests produces a numerical characteristic that is called the p-value. This number characterizes the significance at the scale [0, 1] that the hypothesis of the normality is true for the observed measurements. One can nominate the acceptable significance level, say 5%. If the p-value is less than this level then the hypothesis of normality should be rejected. Alternatively, if the number is within the significance level, then one can conclude that the height distribution is normal. Note that the acceptable significance level is a probability to reject the hypothesis of normality even if it is true.
To describe the tests, we introduce notations: z(1), …, z(n) is a permutation of the sample z1, …, zn such that z(1) ≤ … ≤ z(n), , where Φ is the cumulative distribution function of the standard normal distribution, and and σs are mean and standard deviation of the sample.
4.1. The KS Test
The Kolmogorov-Smirnov (KS) test for a sample is based on comparison of an empirical distribution function (edf) FN(t) and the theoretical cumulative distribution function (cdf) F(t) of the test distribution; specifically, the test statistic is
where F(z) is the cdf of Gaussian (normal) distribution and
is the edf of the sample (z1, z2, …, zN).
A limitation of the KS test is its high sensitivity to extreme values.
4.2. The LF Test
The Lilliefors (LF) test is a correction of the KS test in a way to be more conservative. The test statistic is the maximal absolute difference between empirical and theoretical cdf as D = max{D+, D−}, where
The LF test is slightly better than the KS test because the LF test is more conservative.
4.3. The AD Test
The Anderson-Darling (AD) test is based on a squared difference between the edf and theoretical cdf, the test statistic is
The Anderson-Darling test is sensitive to discrepancies in the tails of the distribution.
4.4. The CVM Test
The Cramer-von Mises (CVM) test is also based on a squared difference between the edf and theoretical cdf. The test statistic is
The CVM test is uniform to discrepancies in different parts of the distribution.
4.5. The SW Test
The Shapiro-Wilk (SW, or Shapiro) test is based on the correlation between the data and the corresponding normal scores,
where . The Shapiro-Wilk test has better power than the KS test and the LF test. The Shapiro-Wilk test is known as the best choice for testing the normality of data.
4.6. The Pearson Test
The Pearson chi-square test is built on creating the classes are build in such a way that they are equiprobable under the hypothesis of normality, where the number of classes is chosen as m = 2n2/5. The Pearson statistic is given by
where Cj is the number of counted observations and Ej is the number of expected observations under the hypothesis of normality in the j-th class.
4.7. The SF Test
The Shapiro-Francia (SF) test is simply the squared correlation between the ordered sample values and the (approximated) expected ordered quantiles from the standard normal distribution, the test statistic is
where μi are standard normal ordered statistics.
All of the above mentioned tests have been employed in the present study.
5. Results and Discussion
In the present study, we have used two amorphous carbon samples deposited on rectangular silicon substrates: a-C and a-C (bias). For each of the samples, we measured 9 patches located at 3 x-positions and 3 y-positions, i.e., 3 top patches, 3 middle patches, and 3 bottom ones. First we have taken AFM measurements. Then the stylus profilometer measurements have been taken. Finally, the same patches that had been measured by the stylus profilometer, were again studied by AFM.
A number of parameters were kept constant for each AFM scan. The frequency of scanning was 0.6 Hz and the load applied by the tip was 21 nN. The proportional and integral gains of the feedback loop of the AFM instrument were also kept constant throughout. A procedure was implemented to ensure that the areas scanned with the AFM would be comprised within the regions inspected with the stylus instrument. This procedure could also provide a reasonable degree of positioning repeatability between the AFM scans made prior to the stylus measurements and those made subsequently. In particular, the edges of the sample were first aligned with the edge of the field of view of the CCD camera of the AFM instrument. This CCD camera provided a resolution of 1 μm. Then, a micrometre stage built-in the AFM instrument was used to position the tip at specific distances from the sample edges which were used as references. This micrometer stage provided a resolution of 5 μm. Each AFM scans was saved in the ASCII file format for further analysis with the statistical methods described in this paper.
Using 3D scan data, we calculated the main standard parameters: the mean roughness of the surface Ra and the standard deviation or the root mean square (rms) Rrms for the roughness profile z(x) at an interval [−L, L]:
which are shown in Tables 1, 2. Note that tables contains NA (not applied) in few cells due to failings in measurements. We can see that calculated parameters for the first AFM scan and the second AFM scan are very close each other, the difference is just few Angstroms. Small variations of parameters from path to patch can be explained by some small waviness.
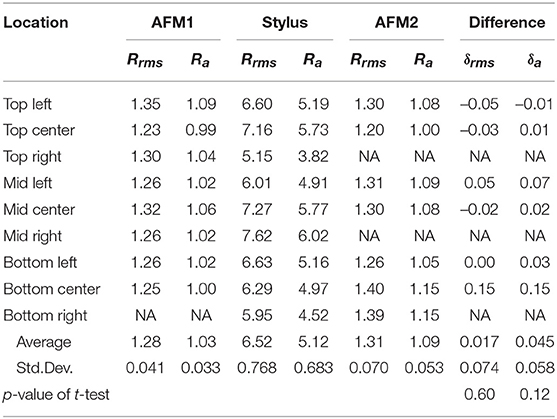
Table 1. The root mean square Rrms and the mean roughness Ra for 9 patches of the a-C (bias) sample at 3 rounds of measurements, all measurements are in nm, and differences , .
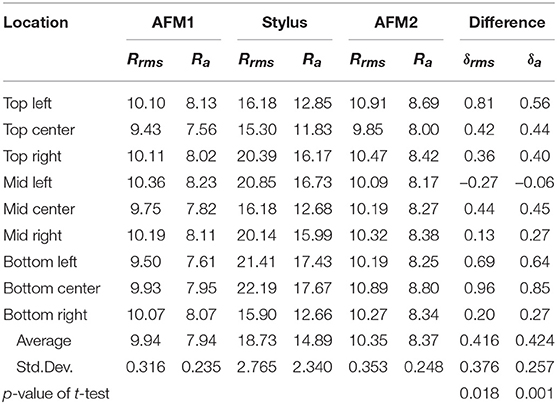
Table 2. The root mean square Rrms and the mean roughness Ra for 9 patches of the a-C sample at 3 rounds of measurements, all measurements are in nm, and differences , .
Because we have used a single measurement of each patch we did not calculate the standard error. However, it was assumed that the surfaces were coated homogeneously and roughness can be considered as a stationary random field. Therefore, due to ergodicity, the average value over several measurements of one patch has the same behavior as averaging over the space (the patches).
To study the statistical difference between surface parameters Rrms and Ra of AFM1 and AFM2 measurements, we have to use the paired t-test for the two dependent set of measurements, whose p-value is given in the last table row. In Table 1 shows that p-values for the paired t-test for are larger than 0.05. This means that there is no significant difference in roughness parameters between AFM1 and AFM2 columns of the table (the AFM measurements of the samples before and after the stylus measurements) of the a-C (bias) sample, which has hardness 43 GPa. In Table 2 shows that p-values for the paired t-test are smaller than 0.05. This means that there is some difference in roughness parameters between AFM1 and AFM2 measurements of the a-C sample, which has hardness 14 GPa. Specifically, the roughness parameters Rrms and Ra for AFM2 measurements are larger on 4% than for AFM1 measurements.
Figures 1–6 contain (i) the images of the 3D scan data, (ii) 3D graphs for a small region of 3D data, (iii) a profile along a line of 3D data together with results of normality tests and main standard parameters.
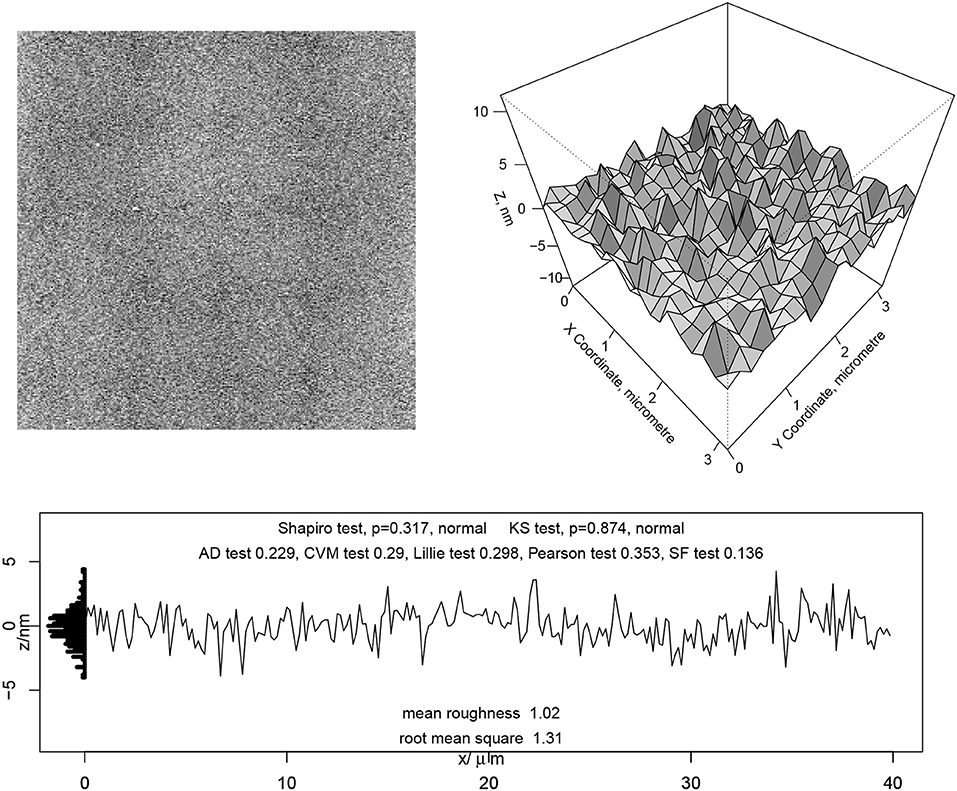
Figure 1. The AFM scan of the a-C (bias) sample. (Left) full measured patch 40 x 40 μm. (Right) extracted small region 3 x 3 μm. (Bottom) A typical profile with normality tests and two descriptive statistics (values are in nm): the root mean square (rms) and the mean roughness.
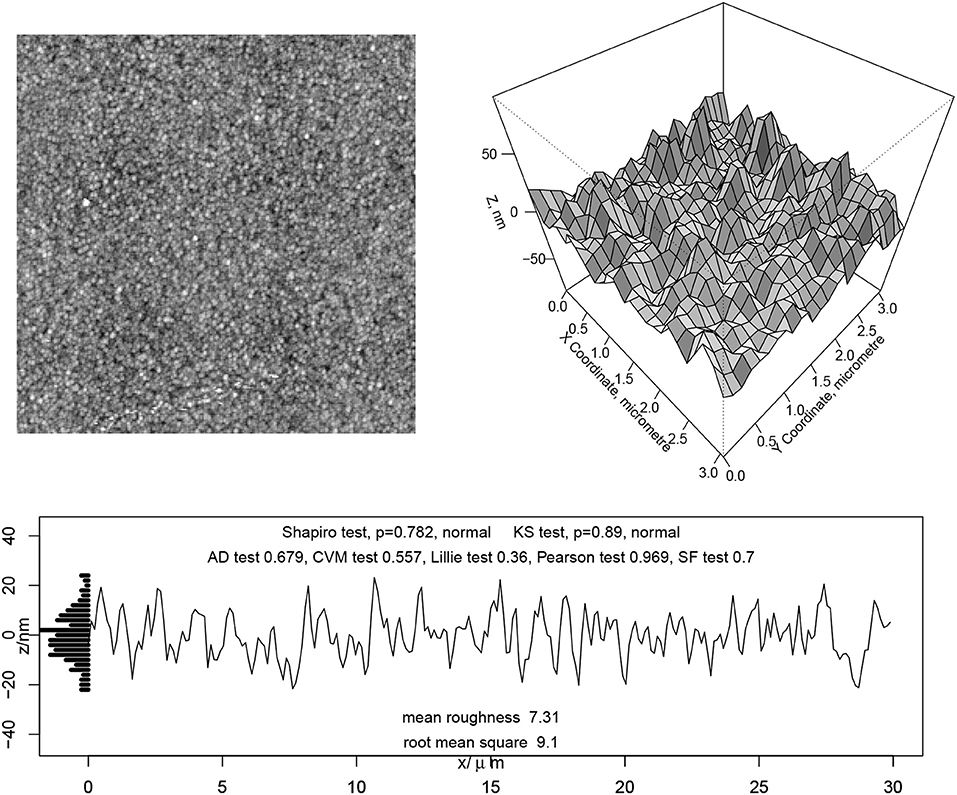
Figure 2. The AFM scan of the a-C sample. (Left) full measured patch 30 x 30 μm. (Right) extracted small region 3 x 3 μm. (Bottom) A typical profile with normality tests and two descriptive statistics (values are in nm): the root mean square (rms) and the mean roughness.
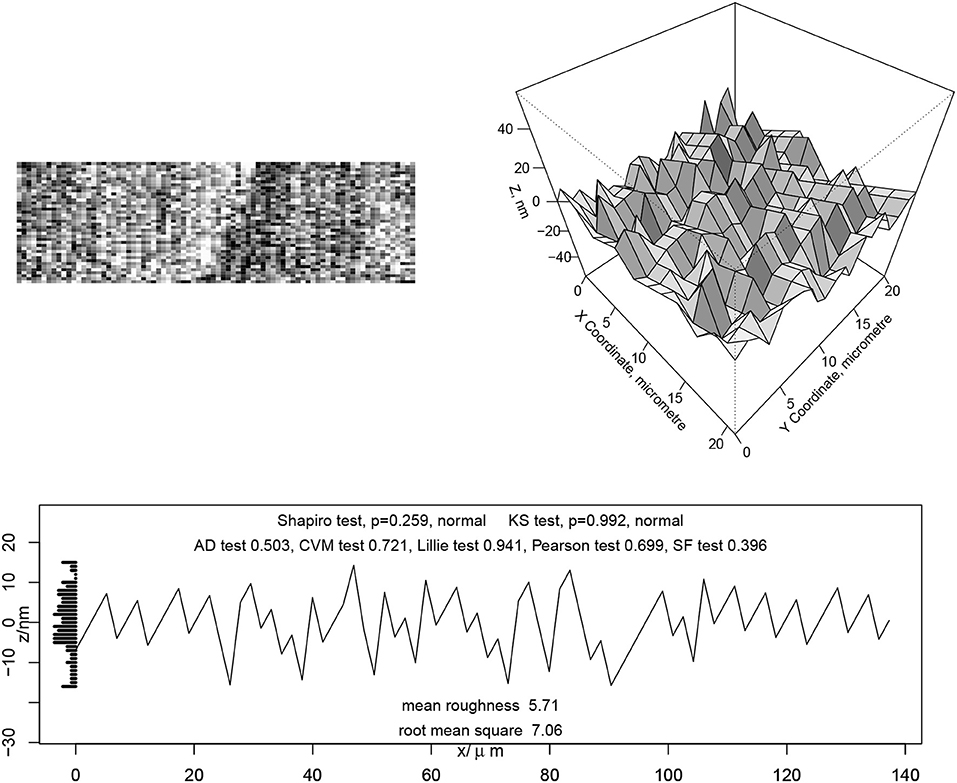
Figure 3. The profilometer scan of the a-C (bias) sample. (Left) full measured patch 40 x 120 μm. (Right) extracted small region 20 x 20 μm. (Bottom) A typical profile with normality tests and two descriptive statistics (values are in nm): the root mean square (rms) and the mean roughness.
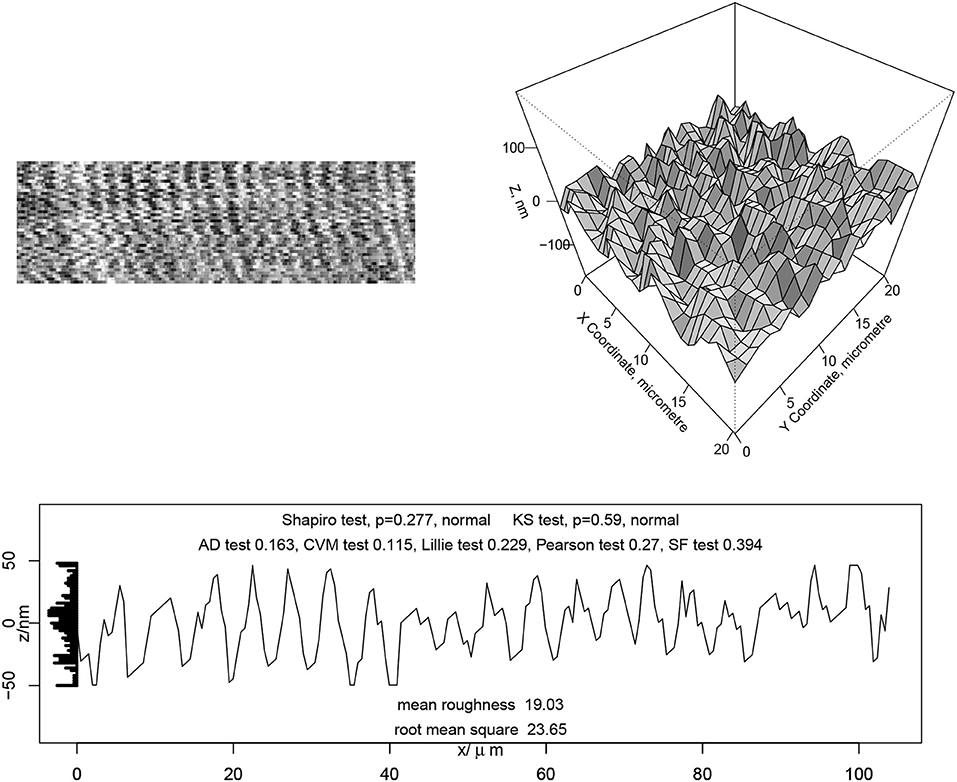
Figure 4. The profilometer scan of the a-C sample. (Left) full measured patch 40 x 120 μm. (Right) extracted small region 20 x 20 μm. (Bottom) A typical profile with normality tests and two descriptive statistics (values are in nm): the root mean square (rms) and the mean roughness.
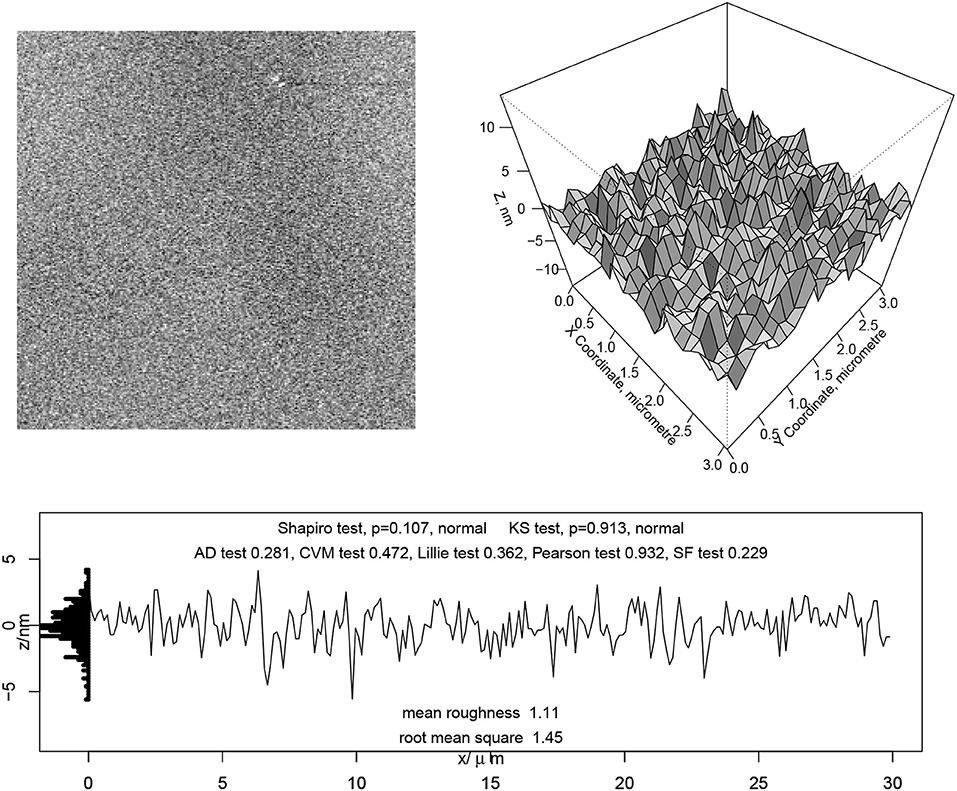
Figure 5. The AFM scan of the a-C (bias) sample after profilometer measurements. (Left) full measured patch 30 x 30 μm. (Right) extracted small region 3 x 3 μm. (Bottom) A typical profile with normality tests and two descriptive statistics (values are in nm): the root mean square (rms) and the mean roughness.

Figure 6. The AFM scan of the a-C sample after profilometer measurements. (Left) full measured patch 30 x 30 μm. (Right) extracted small region 3 x 3 μm. (Bottom) A typical profile with normality tests and two descriptive statistics (values are in nm): the root mean square (rms) and the mean roughness.
We can see that the 3D data exhibits a random behavior and normality tests confirms that the height distributions of both samples are normal at both nanometer and micrometer scales.
Figure 7 shows SEM planar views of the two a-C samples deposited on silicon substrates by pulsed DC-magnetron sputtering. The surface of the a-C (bias) sample (Figure 7, left) appears featureless while the SEM image of the a-C sample prepared without bias (Figure 7, right) displays a random granular structure, typical of a columnar film growth. The AFM scans with the could not allow us to recognize this structure at 117 nm AFM step, however, the structure could be clearly recognized when 10 nm AFM step was used (see Figure 8).
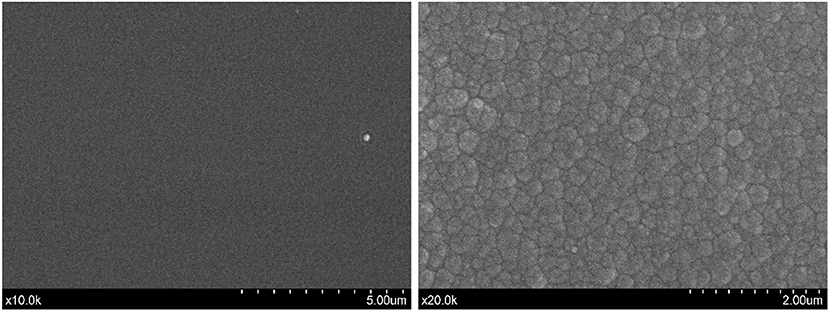
Figure 7. The SEM images. (Left) the a-C (bias) sample. (Right) the a-C sample.
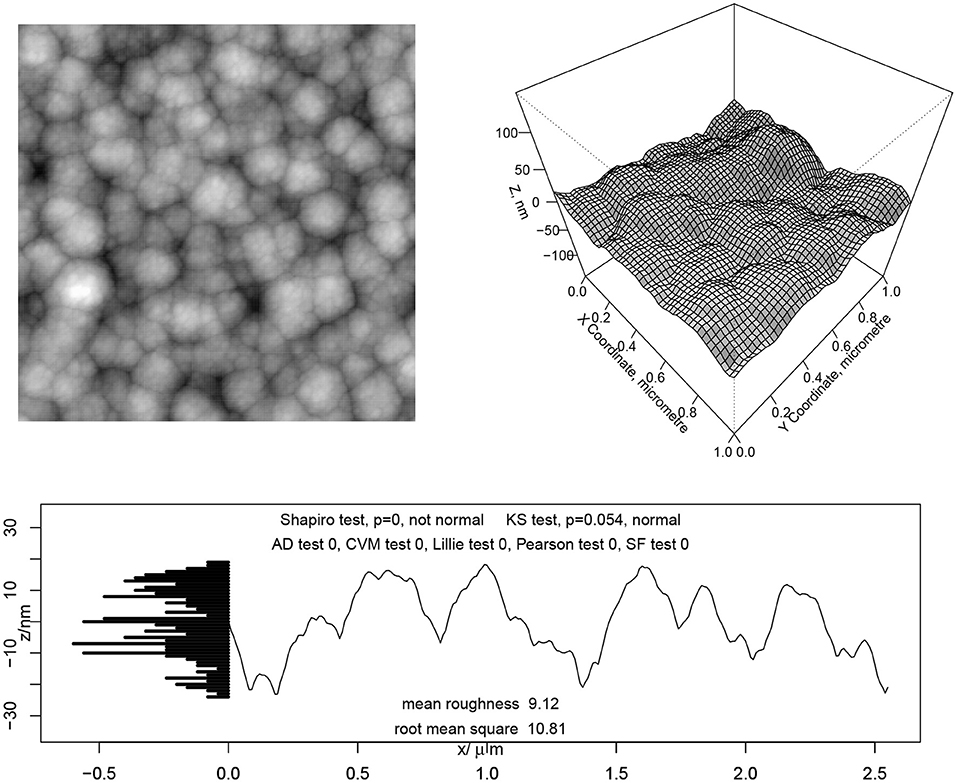
Figure 8. The AFM scan with 10 nm step of the a-C sample after profilometer measurements. (Left) full measured patch 2.56 x 2.56 μm. (Right) extracted small region 1 x 1 μm. (Bottom) A typical profile with normality tests and two descriptive statistics (values are in nm): the root mean square (rms) and the mean roughness. The cauliflower-like structure can be clearly seen.
It is interesting to test the normality of the non-biased a-C sample surface having the cauliflower-like structure. Employing the above described tests of normality, it was obtained that almost all tests showed that the roughness is not normal. Only the weak Kolmogorov-Smirnov test gave p = 0.054 that was slightly greater than the significance level chosen p = 0.05. Hence, if the governing tribological processes are influenced by this fine scale, then the classic theories based on assumption of the normality of the surface roughness cannot be applied to these non-biased a-C coatings. For example, the adhesive contact models introduced by Fuller (2011) and Galanov (2011) are based on the assumption, while the adhesion is very important at the nanoscale.
It is clear that the nature of the deposited material and the deposition conditions may greatly influence surface roughness of carbon-based coatings. Note the surface roughness of the tungsten-containing diamond-like carbon (W-DLC) coatings sputter-deposited onto steel coupons used in by Harris and Weiner (1998), boron carbide coatings shown in Borodich et al. (2002) or studied by Siniawski et al. (2004) and the above described non-biased a-C coatings have the cauliflower-like shape. However, the Ra values of these a-C films are much lower that Ra of the boron carbide samples studied by Siniawski et al. (2004). Although the carbon samples grown at room temperature by DC-magnetron sputtering are structurally disordered, they are much smoother than sputter-deposited W-DLC (Harris and Weiner, 1998) or the boron carbide coatings (Siniawski et al., 2004). In turn, the increase in ion energy and bombardment produced by the bias voltage applied to the substrate is clearly reflected in a further surface smoothening and film densification, as denoted by the significant increase in hardness up to 43 GPa.
6. Conclusion
A brief review of studies of surface topography of some modern carbon-based coatings has been presented. Then roughness of amorphous carbon coatings deposited by DC-pulsed magnetron sputtering with and without substrate bias was measured at nano- and microscales. The measurements of the heights of the nano-asperities and the heights of the micro-asperities were measured by AFM and stylus profilometer respectively.
A comparison of AFM measurements before and after the stylus profilometer measurements did not show any statistical difference for the biased sample whose hardness was 43 GPa. However, the stylus profilometer may cause some plastic deformations of the non-biased a-C surface whose hardness was 14 GPa.
It is shown that carbon films prepared by DC-pulsed magnetron sputtering are very smooth at micrometre scale particularly under the additional ion bombardment provided by application of a negative bias. The increase of ion flux and energies leads to flatter surfaces and compact morphologies.
As it has been mentioned, the main assumption of the classic models of surface roughness including approaches by Linnik and Khusu (1954a,b), Whitehouse and Archard (1970), and Khusu et al. (1975) is that the asperity heights satisfy Gaussian distributions. The same assumption is used in several modern theories of adhesive contact between rough surfaces (see e.g., Maugis, 2000; Fuller, 2011; Galanov, 2011). Using the experimental data obtained, the assumption of the normal distribution for the roughness heights has been studied by application of various modern tests of normality.
Measurements of surfaces by stylus and by AFM with the 117 nm steps showed that the surfaces satisfy the assumption of normality of the heights. However, further studies with the 10 nm steps showed that the roughness of the non-biased sample is not normal. Hence, the applicability of the above mentioned statistical models of adhesive contact between rough solids to the non-biased sample may be doubtful. Their applicability may depend on elastic properties of a counterpart material. Indeed, as it follows from Tables 1, 2, the Rrms measured by AFM was below 1.5 nm for the biased a-C sample and below 10.5 nm for the non-biased a-C sample. As it has been recently shown for such small roughness (Pepelyshev et al. 2018), a soft counterpart surface may create a full contact. Hence, in such problems only the microscale roughness will govern the contact.
Author Contributions
FB substantial contributions to the conception and design of the work, analysis, and interpretation of data for the work. EB experimental studies of roughness at nanometer scale and description of the equipment. AC experimental studies of roughness at microscale by a profilometer and description of the equipment. AP experimental studies of roughness at microscale by a profilometer, statistical analysis of the results, interpretation of data for the work. JS-L preparation of samples, revising the work critically for important intellectual content, analysis, and interpretation of data for the work.
Conflict of Interest Statement
The authors declare that the research was conducted in the absence of any commercial or financial relationships that could be construed as a potential conflict of interest.
Acknowledgments
The collaboration of the authors on the topic of the paper was initiated within the CARBTRIB International network. The authors are grateful to the Leverhulme Trust for support of the CARBTRIB Network. One of the authors (JS-L) would like to acknowledge Dr. Santiago Dominguez-Meister for his support in sample preparation, C. Serra and CACTI facilities at the University of Vigo for nanoindentation measurements and M.C. Jiménez de Haro (ICMS) for her technical and valuable support in SEM observations. The authors are grateful to an reviewer for insisting on performance of the additional AFM measurements with 10 nm step that influenced significantly the final results for non-biased a-C coatings.
References
Adachi, K., and Kato, K. (2008). “Tribology of carbon nitride coatings,” in Tribology of Diamond-Like Carbon Films, eds C. Donnet and A. Erdemir (Boston, MA: Springer), 339–361.
Alami, J., Bolz, S., and Sarakinos, K. (2009). High power pulsed magnetron sputtering: fundamentals and applications. J. Alloys Comp. 483, 530–534. doi: 10.1016/j.jallcom.2008.08.104
Borodich, F. M., Chung, Y.-W., and Keer, L. M. (2008). “Environmental and surface chemical effects on tribological properties of carbon-based coatings,” in Tribology of Diamond-Like Carbon Films, eds C. Donnet and A. Erdemir (Boston, MA: Springer), 282–290.
Borodich, F. M., Harris, S. J., and Keer, L. M. (2002). Self-similarity in abrasion of metals by nano-sharp asperities of hard carbon containing films. Appl. Phys. Lett. 81, 3476–3478. doi: 10.1063/1.1519099
Borodich, F. M., Keer, L. M., and Harris, S. J. (2003). Self-similarity in abrasiveness of hard carbon-containing coatings. J. Tribol. Trans. ASME 125, 1–7. doi: 10.1115/1.1509773
Borodich, F. M., Pepelyshev, A., and Savencu, O. (2016). Statistical approaches to description of rough engineering surfaces at nano and microscales. Tribol. Int. 103, 197–207. doi: 10.1016/j.triboint.2016.06.043
Borodich, F. M., and Savencu, O. (2017). “Hierarchical models of engineering rough surfaces and bioinspired adhesives,” in Bio-Inspired Structured Adhesives, eds L. Heepe, S. Gorb, and L. Xue (Cham: Springer), 179–219. doi: 10.1007/978-3-319-59114-8_10
Carpick, R. W. (2018). The contact sport of rough surfaces. Science 359, 38. doi: 10.1126/science.aaq1814
Chen, M. Y., Lin, X., Dravid, V. P., Chung, Y. W., Wong, M. S., and Sproul, W. D. (1993). Synthesis and tribological properties of carbon nitride as a novel superhard coating and solid lubricant. Tribol. Trans. 36, 491–495. doi: 10.1080/10402009308983188
Donnet, C. and Erdemir, A. (eds.) (2008). Tribology of Diamond-Like Carbon Films. Boston, MA: Springer.
Fontaine, J., Donnet, C., and Erdemir, A. (2008). “Fundamentals of the tribology of DLC coatings,” in Tribology of Diamond-Like Carbon Films, eds C. Donnet and A. Erdemir (Boston, MA: Springer), 139–154.
Fuller, K. (2011). Effect of surface roughness on the adhesion of elastomers to hard surfaces. Mater. Sci. Forum 662, 39–51. doi: 10.4028/www.scientific.net/MSF.662.39
Fuller, K. N. G., and Tabor, D. (1975). The effect of surface roughness on the adhesion of elastic solids. Proc. R. Soc. Lond. A 345, 327–342. doi: 10.1098/rspa.1975.0138
Galanov, B. A. (2011). Models of adhesive contact between rough elastic bodies. Int. J. Mech. Sci. 53, 968–977. doi: 10.1016/j.ijmecsci.2011.07.010
Galanov, B. A., and Valeeva, I. K. (2016). Sliding adhesive contact of elastic solids with stochastic roughness. Int. J. Eng. Sci. 101, 64–80. doi: 10.1016/j.ijengsci.2015.12.007
Ghosal, S., and Van der Vaart, A. (2017). Fundamentals of Nonparametric Bayesian Inference, Vol. 44. New York, NY: Cambridge University Press.
Gusak, D., Kukush, A., Kulik, A., Mishura, Y., and Pilipenko, A. (2012). Theory of Stochastic Processes. New York, NY: Springer-Verlag.
Harris, S. J., Krauss, G. G., Simko, S. J., Baird, R. J., Gebremariam, S. A., and Doll, G. (2002). Abrasion and chemical-mechanical polishing between steel and a sputtered boron carbide coating. Wear 252, 161–169. doi: 10.1016/S0043-1648(01)00868-7
Harris, S. J., and Weiner, A. M. (1998). Scaling relationships for the abrasion of steel by DLC coatings. Wear 223, 31–36. doi: 10.1016/S0043-1648(98)00297-X
Kato, K., Umehara, N., and Adachi, K. (2003). Friction, wear and N2-lubrication of carbon nitride coatings: a review. Wear 254, 1062–1069. doi: 10.1016/S0043-1648(03)00334-X
Khusu, A. P., Vitenberg, Yu. R., and Palmov, V. A. (1975). Roughness of Surfaces: Theoretical Probabilistic Approach (in Russian). Moscow: Nauka.
Lin, J., Moore, J. J., Sproul, W. D., Mishra, B., Wu, Z., and Wang, J. (2010). The structure and properties of chromium nitride coatings deposited using dc, pulsed dc and modulated pulse power magnetron sputtering. Surf. Coat. Technol. 204, 2230–2239. doi: 10.1016/j.surfcoat.2009.12.013
Linnik, Yu. V., and Khusu, A. P. (1954a). Mathematical and statistical description of unevenness of surface profile at grinding (Russian). Uspekhi Matematicheskikh Nauk 9:255.
Linnik, Yu. V., and Khusu, A. P. (1954b). Mathematical and statistical description of unevenness of surface profile at grinding (Russian). Bull. USSR Acad. Sci. Div. Technol. Sci. 20, 154–159.
Pepelyshev, A., Borodich, F. M., Galanov, B. A., Gorb, E. V., and Gorb, S. N. (2018). Adhesion of soft materials to rough surfaces: experimental studies, statistical analysis and modelling. Coatings 8:350. doi: 10.3390/coatings8100350
Sánchez-López, J. C., Belin, M., Donnet, C., Quiros, C., and Elizalde, E. (2002). Friction mechanisms of amorphous carbon nitride films under variable environments: a triboscopic study. Surf. Coat. Technol. 160, 138–144. doi: 10.1016/S0257-8972(02)00397-3
Sánchez-López, J. C., and Fernández, A. (2008). “Doping and alloying effects on DLC coatings,” in Tribology of Diamond-Like Carbon Films: Fundamentals and Applications, eds A. Erdemir and C. Donnet (New York, NY: Springer), 311.
Sarakinos, K., Alami, J., and Konstantinidis, S. (2010). High power pulsed magnetron sputtering: a review on scientific and engineering state of art. Surf. Coat. Technol. 204, 1661–1684. doi: 10.1016/j.surfcoat.2009.11.013
Siniawski, M. T., Harris, S. J., Wang, Q., Chung, Y.-W., and Freyman, C. (2004). Effects of thickness and roughness variations on the abrasiveness of a thin boron carbide coating. Tribol. Lett. 17, 931–937. doi: 10.1007/s11249-004-8102-0
Wang, Y., Li, H., Ji, L., Zhao, F., Liu, X., Kong, Q., et al. (2010). The effect of duty cycle on the microstructure and properties of graphite-like amorphous carbon films prepared by unbalanced magnetron sputtering. J. Phys. D Appl. Phys. 43:505401. doi: 10.1088/0022-3727/43/50/505401
Keywords: roughness, normality tests, carbon-based coatings, nanoscale, microscale
Citation: Borodich FM, Brousseau E, Clarke A, Pepelyshev A and Sánchez-López JC (2019) Roughness of Deposited Carbon-Based Coatings and Its Statistical Characteristics at Nano and Microscales. Front. Mech. Eng. 5:24. doi: 10.3389/fmech.2019.00024
Received: 11 January 2019; Accepted: 15 April 2019;
Published: 14 May 2019.
Edited by:
Ashlie Martini, University of California, Merced, United StatesReviewed by:
Yulia Makhovskaya, Institute for Problems in Mechanics (RAS), RussiaSergei Yulievitch Tarasov, Institute of Strength Physics and Materials Science (RAS), Russia
Ivan Argatov, Technische Universitt Berlin, Germany
Copyright © 2019 Borodich, Brousseau, Clarke, Pepelyshev and Sánchez-López. This is an open-access article distributed under the terms of the Creative Commons Attribution License (CC BY). The use, distribution or reproduction in other forums is permitted, provided the original author(s) and the copyright owner(s) are credited and that the original publication in this journal is cited, in accordance with accepted academic practice. No use, distribution or reproduction is permitted which does not comply with these terms.
*Correspondence: Feodor M. Borodich, BorodichFM@cardiff.ac.uk