Sdq-Sdr Topological Map of Surface Topographies
 Árpád Czifra*
  István Barányi
- Institute of Mechanical Engineering and Security Sciences, Óbuda University, Budapest, Hungary
The reliable characterization of surface topographies—especially in case of tribological processes—requires complex and comprehensive solution methods. The use of a combination of roughness parameters offers effective solutions in many cases. In our study, we found a close correlation between the Sdq-Sdr parameter pair and we applied the two parameters as a topological map. Surface topographies resulting from different machining techniques (turned, milled, ground, honed, electric discharge machined, and sintered) were placed in the topological map and their possibilities of use were explored. It was established that surfaces with an orientation characteristically have lower Sdq-Sdr value pairs than non-oriented or multi-oriented surfaces; however, surface defects, injuries and machining discrepancies increase the values of Sdq-Sdr parameters. Then the Sdq-Sdr topological map was applied for worn surfaces resulting from abrasive and tribochemical processes, and it was established that the worn surfaces examined are characterized by small Sdq-Sdr values. Test results showed that in case of manufacturing processes, the topological map is suitable for identifying manufacturing discrepancies and manufacturing defects, and it highlights structural changes in the microgeometry in the course of the wear process.
Introduction
The microgeometry and microtopography of technical surfaces are most widely characterized by the use of roughness (waviness or unfiltered) parameters. Whatever evaluation technique is concerned, ranging from the most well-known M system through the motif method favored by the French automotive industry to the dominant wavelength published by the VDI (the German Engineering Association), each standard and recommendation uses indices and parameters. Due to the complexity of surfaces and the diversity of microgeometries and microtopographies, today there are nearly a hundred standard indices for characterizing surfaces already. It has become evident by now that surface properties cannot be precisely described by using one single parameter, therefore more than one roughness indices appear in an increasing number of technical documentation.
It has also been a known fact for long that certain index combinations can characterize surfaces efficiently, while other combinations are less efficient. The most well-known correlation refers to the relation between average roughness (Ra) and roughness height (Rz). The ratio of the two parameters Rz/Ra indicates the type of machining. In case of a ground surface, for instance, this ratio is between 5.8 and 9.5, while in the case of a turned surface, values between 3.4 and 7.5 can be measured depending on the characteristics of the machining process (Palásti et al., 2012).
Parameter combinations can be specified in the form of a so-called topological map, representing surfaces in function of the two parameters used for characterization. The most well-known topological map can be found at Whitehouse (Whitehouse, 1994), which locates each machining type in the coordinate system of RSk (skewness) and Rku (kurtosis). The two amplitude parameters (only depending on height coordinates) are mathematically independent of each other, but in practice they display a nearly parabolical connection. This parameter combination is applied in the work of Horváth et al. (2015). They examined the impact of the edge geometry of a chipping tool and they found it to be a decisive factor in the location on the topological map. Sedlaček et al. (2017) examined the role of surfaces in operation using the Ssk-Sku parameter combination (the 3D equivalents of the Rsk-Rku parameters) and found a correlation between the parameter pair and friction conditions in the boundary and mixed lubrication regimes. Dzierwa et al. (2020) use the parameter pair for characterizing the wear behavior of surfaces. They state the following: “Ssk and Sku parameters characterizing the shape of the surface ordinate distribution had significant impacts on the volumetric wear. A decrease in the value of the Ssk parameter and an increase in the value of Sku led to a reduction in the wear volume.”
A less known topological map but with a similar function was presented by Petropoulos et al. (2006), who characterized the chipping process using the so-called “Beta function chart” based on the parameters created by themselves.
Modern manufacturing technology and tribology present new challenges and result in the appearance of surfaces which are impossible or difficult to characterize by traditional roughness parameters. Pagani et al. (2017) seek for a generally extensible definition for the characterization of free-form surfaces in case of the parameters Sa, Sq, Ssk, Sku, Sdq, and Sdr.
In our present study we looked for parameter combinations that can characterize surfaces by forming a topological map similarly to the above. Tests were based on 3D measurements and covered—in addition to amplitude parameters—spacing, hybrid and operational parameters as well. Our purpose was to create a topological map possible to be applied similarly to the Ssk-Sku map, but different in terms of content and information. Our tests covered the interpretation and utilization of the topological map created in case of surfaces of a variety of manufacturing technologies, also using the location of differently worn surfaces on the topological map.
Materials and Methods
Five machining procedures were examined in the course of our study: turning, milling, grinding, honing, and electric discharge machining. The measured surfaces originated from the database set up from measurements conducted in the course of the past 20 years at the Donát Bánki Faculty of Mechanical Engineering and Security Sciences of Óbuda University. More than 100 microtopographies were evaluated. These included surfaces of different materials machined with mixed chipping parameters. Measurement details are available in the following references (Czifra, 2009; Barányi et al., 2011a,b; Czifra and Palásti, 2013). The other part of the database consisted of topographies produced in the course of wear processes. One of the groups of worn surfaces was created by abrasive wear processes where surfaces were characterized by scratches and grooves, while the other group of worn surfaces consisted of topographies to be characterized by splits/accretions as a result of adhesion or tribochemical processes. Wear test results and measurement methodologies are available in the following references (Czifra et al., 2008; Czifra and Horváth, 2011).
As regards measurement properties, each surface examined was produced form a surface part of 1 × 1 mm2 with increments of 2 × 2 μm in order to prevent the distortion of parameters by differences in measurement settings.
Various parameter combinations were examined: Sq-Sz; Sal-Sq; Sal-Str; Sdq-Sq; Sdq-Spk; Sdr-Sq; Sdq-Sdr; Spk-Sq; and Sk-Sq. The definitions of the topographical parameters listed are available in the ISO standard (ISO 25178/2-2012, 2012).
Only in case of Sdq-Sdr parameter pair was high correlation founded. The main task of the research was to prove that this correlation is not only a mathematical or theoretical result, but it has physical (geometrical) background and it has relevance in production and tribological processes.
Results
Figure 1 shows the interrelation between the Sdq and Sa parameters, and the Sdq-Sdr connection in case of the surfaces examined. As in most of the cases examined, in case of the Sdq-Sa parameter connection the two parameters demonstrate behaviors independent of each other (the value of the correlation coefficient R2 is only 0.343 even in case of the power function showing the best fit). This means that the joint use of the two parameters does not provide additional information on the description of surfaces as opposed to the separate use of the two parameters.
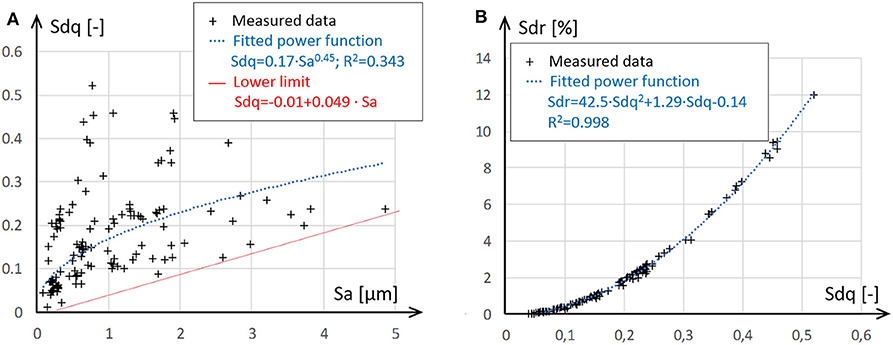
Figure 1. Topological maps for the 117 topographies examined; (A) Sdq-Sa map; (B) Sdq-Sdr (hybrid) map.
There was an interesting correlation in case of the Sdq-Sdr parameter pair. Both parameters are classified into the group of hybrid parameters. These parameters include both height and spacing properties. Both parameters characterize surface configuration, although in different ways. The Sdq or SΔq parameter is the geometric mean of surface microgeometry inclination; to put it more simply, the average slope of the surface. In terms of meaning, it denotes the average steepness of the gradient between measurement points. That is, the more articulated the surface, the higher is the value thereof; however, its value depends on direction and is related to roughness amplitude parameters. The Sdr parameter is denominated as surface ratio. This parameter shows the ratio of the size of the surface covering the measured microtopography to the sampling area. It applies here as well that the more articulated the surface, the higher is the value of the parameter. The mathematical definition and software implementation of the two parameters for a discrete sampling case is included in Leach (2013). Mathematical definition of the parameters:
where: A—sampling area, ∂z(x,y)/∂x—gradient associated with the point located at the place x,y along the x axis, ∂z(x,y)/∂y—gradient associated with the point located at the place x,y along the y axis.
On the other hand, there is a strong interconnection between the Sdq-Sdr parameter pair. Two characteristic features can be noticed on the map. One of them is the extremely strong correlation of the two parameters (the value of the correlation coefficient R2 is 0.998). From the mathematical point of view, the parameters are specified independently of each other, since in the case of Sdq the parameter is calculated from the quadratic mean of the gradients in the x and y directions (see Equation 1), while in the case of Sdr the digitized surface is covered with triangular plates and the total surface area thereof will be the starting point for specifying the parameter (see Equation 2). The length of the sides of the triangular plates included in Equation (2) is related to the gradients, but their area shows an approximative connection only if the gradient is very small because this way the triangular plates are nearly rectangular. In case of high gradients, this approximative connection ceases to exist. In order to demonstrate this, we measured asphalt topographies different from technical surfaces, where the value of Sdq was 1.41. The value of Sdr was calculated using the fitted curve shown in Figure 1, which should have been 86.21 (if this point is also fitted to the curve). On the contrary, the Sdq value of the measured surface was 23.99.
It can be clearly observed that in addition to cases having a direction (turned, ground, milled), the data points of non-oriented (electric discharge machined, sintered) or multi-oriented (honed) surfaces are also properly fitted to the curve, just as the data points of worn topographies.
An interesting feature of the Sdq-Sdr parameter connection (hereinafter: hybrid topological map) is that although they are really finely fitted to the curve, they still cover a wide range, which obviously indicates dissimilar properties of surfaces.
Figure 2 compares the Ssk-Sku topological map and the hybrid topological map in the case of all topographies examined so as to disclose whether the two maps have similar or dissimilar properties. Figure 2A shows the Ssk-Sku map, where the well-known correlations can be observed: turning and electric discharge machining are typically located on the right half of the map, while grinding, milling or honing are dominantly placed on the left side. For the sake of greater clarity, each of the machining and wear types were substituted by data points derived from the arithmetic average of measurement points. In case of Ssk-Sku, this is shown in Figure 2B, for the Sdq-Sdr parameter connection, in Figure 2C. By comparing the two maps, completely different behaviors can be noticed in terms of locations on the map, which indicates that the Ssk-Sku and the Sdq-Sdr maps carry absolutely different information. The following statements can be made by comparing the two maps:
- The two extreme positions of the Ssk-Sku map are represented by abrasive wear and turning, while on the hybrid map these appear as absolutely close points located in the middle of the data field.
- The 3 surface types located in the middle of the Ssk-Sku map include milled, ground, and electric discharge machined ones. On the hybrid map, the milled and ground types are very close to each other but in the left corner of the map, while the electric discharge machined one the farthest possible therefrom.
- The sintering technology is close to wear cases on the Ssk-Sku map, while being relatively distant therefrom on the hybrid map.
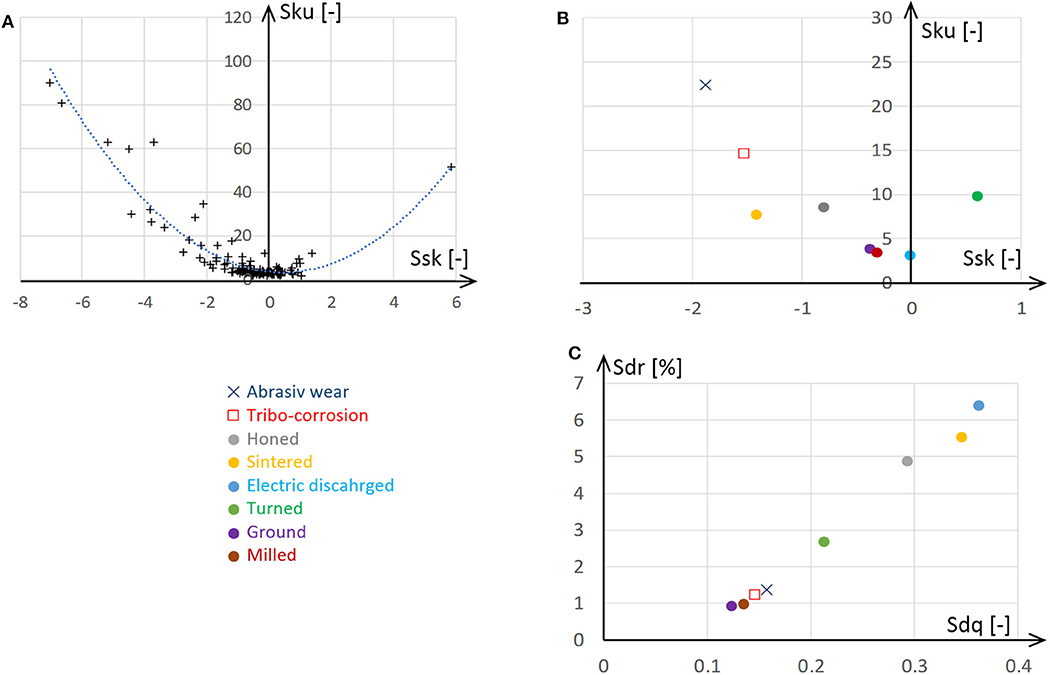
Figure 2. (A) Ssk-Sku map for all the examined topographies; (B) Ssk-Sku map with the average of categories; (C) Sdq-Sdr map with the average of categories.
Discussion
A strong correlation in itself does not express any characteristic features, but the orderliness of parameters and the wide range they encompass raises the issue what geometrical and tribological properties can be associated with each region of the hybrid map. Can any features be detected on the surfaces the description of which can be useful from the point of view of the role in operation? Actually, we sought for an answer to whether the map can be used for anything.
In order to answer this question, the topographical maps pertaining to each region were inspected in case of each category. Table 1 contains the bottom and top values of the ranges belonging to each category in respect of the Sdq and Sdr parameters. A further part of inquiries were targeted to the investigation of the characteristics by reason of which a topography is placed in the bottom or top part of the given range.
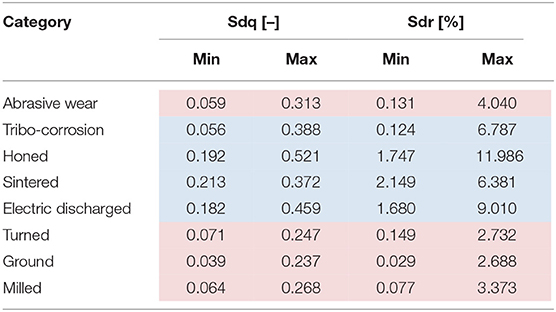
Table 1. Value ranges associated with the machining and wear categories on the Sdq-Sdr map.
By analyzing Table 1, it is conspicuous that in respect of machining, surfaces with orientation fall within the smaller Sdq and Sdr range (red background). Figure 3 shows the map by grouping the types of machining. The red circles show oriented types of machining (turned, ground, milled), while the blue x-es show multi-oriented or non-oriented machining types (honed, electric discharge machined, sintered). Figure 4 shows a topography of each machining type. The two regions are very well-separated. The value range of oriented topographies is 0.039–0.268 (2.23–15.35°) for the Sdq parameter, while 0.182–0.521 (10.43–29.85°) for other types of machining. Although there is some overlap between the two zones, the difference in terms of location is obvious.
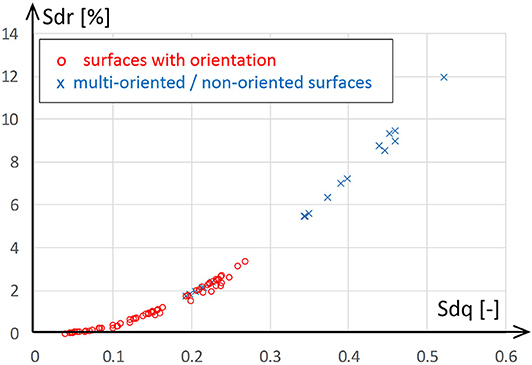
Figure 3. Sdq-Sdr map for surfaces with orientation and multi-oriented/non-oriented surfaces.
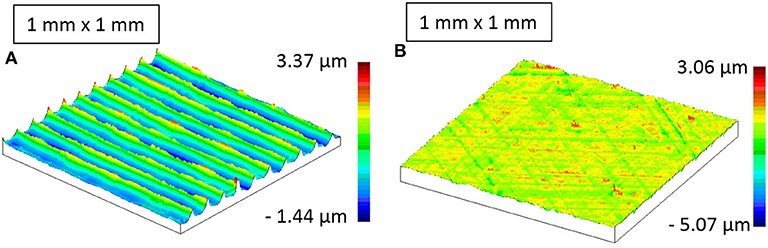
Figure 4. (A) Turned surface topography (Sdq = 0.081; Sdr = 0.253%); (B) Honed surface topography (Sdq = 0.213; Sdr = 2.149%).
The mathematical definition of the Sdq parameter helps understand this difference. According to Equation (1), the examination of the gradient is defined in the two directions of the measurement, and the square root is extracted from their square sum. In case of a surface with considerable orientation, the slope of the surface can be defined in a direction perpendicular to orientation, but very low values can be measured parallelly with orientation. Figure 4A shows even and fine machining work by turning. Machining traces are orderly: no machining defects or major surface injuries can be seen. Parallelly with the ridges of traces by turning or in the valleys a gradient of 0 is expected “in theory,” in the knowledge of the kinematics of the machining tool. Non-oriented or multi-oriented surfaces have slopes in several directions (see Figure 4B), so the mathematical definition will obviously yield a higher value. This is the explanation for the fact that oriented surfaces tend to be located in the left corner of the map, while honed, sintered and electric discharge machined surfaces are shifted to the right.
By examining the data included in Table 1, however, it can be noticed that the statement above is true in a comprehensive manner; at the same time, the points of machining by turning, grinding or milling are spread over a wide range and show overlaps with electric discharge machining, honing, and sintering.
In order to understand this, let us examine surfaces in detail, as hybrid parameters do not primarily characterize dominant topographical parameters (e.g., traces of machining), but rather include small surface details with exactly the same or even more weight. Low Sdq and Sdr values indicate less articulated surfaces clear of local elevations. This also means that not only the traces of machining are even, but the details of machining traces as well, meaning that smooth surfaces free from breaks and articulations can be observed within each trace, too.
Figure 5A obtains an insight into a turning trace of the turned surface shown in Figure 4. Apart from the “ridges” of the surface of machining, a fine, even, smooth surface can be observed, which justifies the low value of hybrid parameters. Similar surfaces can be detected in case of further surfaces with similar Sdq and Sdr values (see Figure 5B).
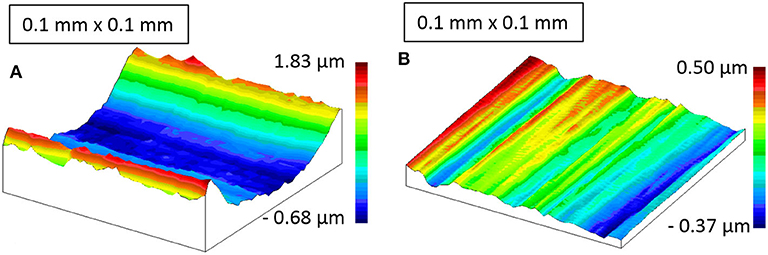
Figure 5. (A) Machining trace of a turned surface (Sdq = 0.081; Sdr = 0.253%); (B) Machining trace of a milled surface (Sdq = 0.064; Sdr = 0.077%).
Figure 6 shows a turning topography which pertains to the right side region of machining by turning on the hybrid map. Figure 7 shows the surface pertaining to the right side region in case of milling.
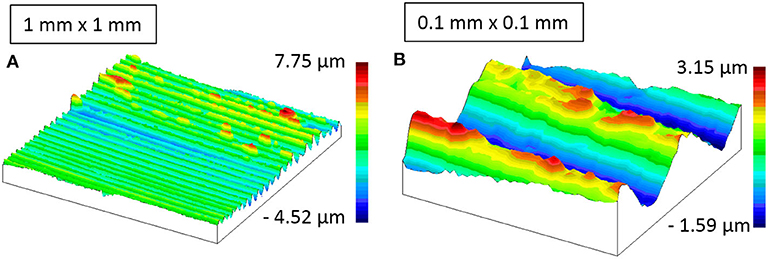
Figure 6. Topography of a turned surface (Sdq = 0.231; Sdr = 2.264%). (A) 1 mm by 1 mm measuring area. (B) 0.1 mm by 0.1 mm measuring area.
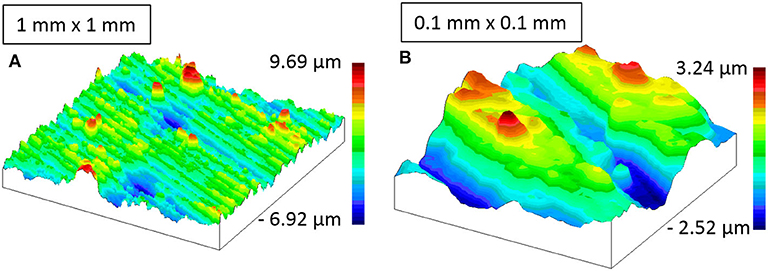
Figure 7. Topography of a milled surface (Sdq = 0.231; Sdr = 2.557%). (A) 1 mm by 1 mm measuring area. (B) 0.1 mm by 0.1 mm measuring area.
In case of the two topographies presented, the surface contains rough machining injuries. The surface is broken up by splits, smears, asperities, and deep valleys at some places. This strong articulation is manifested in the rise of hybrid parameters. Figures 6B, 7B clearly show the sharp protrusions and breaks at the asperities of machining traces; but in addition, valleys are also articulated, and local elevations can be found here as well. On the basis thereof, the Sdq-Sdr topological map is suitable for characterizing machined surfaces in respect of quality assurance. Yildirim points out (Yildirim et al., 2019) that surface roughness significantly changes as a result of tools being worn. However, the value of the Ra or Rz parameters examined does not only depend on the wear of tools, but on machining parameters as well, so their absolute value cannot be used directly for characterizing the wear of tools. On the other hand, the Sdq and Sdr parameters do not closely depend on average surface roughness (both of them are ratios without a unit of measurement), therefore their use can be favorable for forecasting the wear of tools.
A detailed topography analysis was also performed in case of non-oriented surfaces. Figure 8 shows topography details of honed and electric discharge machined surfaces with small Sdq-Sdr values compared to machining, while Figure 9 contains details of topographies falling within the right side of the map.
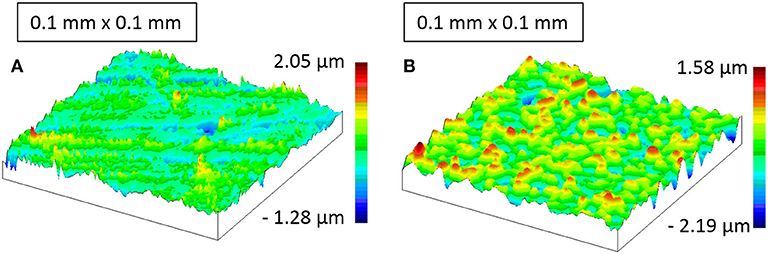
Figure 8. (A) Honed surface (Sdq = 0.197; Sdr = 1.839%); (B) Electric discharge machined surface (Sdq = 0.182; Sdr = 1.680%).
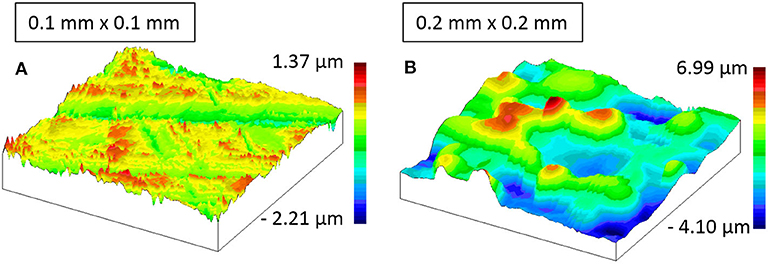
Figure 9. (A) Honed surface (Sdq = 0.452; Sdr = 9.367%); (B) Electric discharge machined surface (Sdq = 0.459; Sdr = 9.010%).
In case of the honed surface, two fundamental differences can be found between the two topographies. One of them is that the surface with the smaller Sdq-Sdr values is machined more evenly. In case of the other surface, transversal scratches are deeper and broader in one of the directions (for this reason, the valley depth of the topography is also larger as it can be read from the scale in the figure). Protruding asperities can be found in case of both surfaces, but their height, extension and dominance is larger than in the case of the surface to be characterized by higher Sdq-Sdr values.
In case of the electric discharge machined surface (Figures 8B, 9B), the most important difference is shown by the fact that the surface with higher Sdq-Sdr parameters is much rougher, its roughness being considerably higher. The two surfaces do not show significant discrepancies in terms of character and structure. No topographical features can really be found that would justify such considerable discrepancy of hybrid parameters. Looking back on Figure 1, it was established that there is no close connection between the average roughness of the surface (Sa) and the RMS slope (Sdq). Still, Figure 1 shows some correlation: a “bottom envelope” can be fitted to the set of points (red straight line). This means that large Sdq can be found even in case of fine surfaces (small Sa values), but no extremely low RMS slope values can be found in case of rough surfaces. This impact can prevail in the present case: a rougher topography with similar properties can be characterized by a larger Sdq-Sdr value pair.
The last part of investigations involved the comparison of machined and worn topographies in order to establish whether the hybrid topological map has any kind of tribological content.
Figures 10, 11 show pairs of surfaces worn by abrasion and tribochemical corrosion, respectively. The surface parts shown in figures A come from the left side of the map, and the surfaces on figures B from the right side of the map. In case of wear by abrasion, the surface on the left side (Figure 10A) shows the signs of extremely fine mild wear. A clear orientation can be observed together with even and fine traces of wear. Scratches within the wear direction—characteristic of wear by abrasion—also appear in case of higher Sdq-Sdr value pairs, but they are much rougher and more marked. At deeper scratch traces, the material is squeezed to the brink of the wear trace. This more coarse and intensive groove formation is interconnected with higher Sdq and Sdr values.
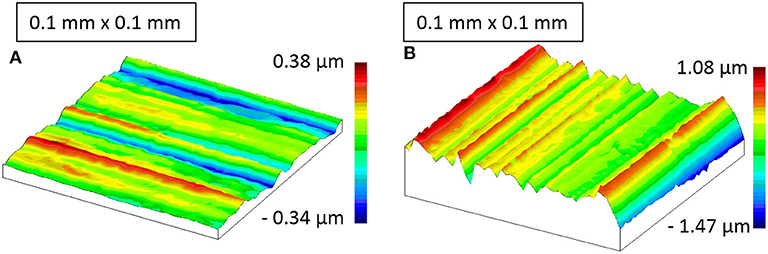
Figure 10. Surface details of wear by abrasion (A) Sdq = 0.063; Sdr = 0.139%; (B) Sdq = 0.304; Sdr = 4.090%.
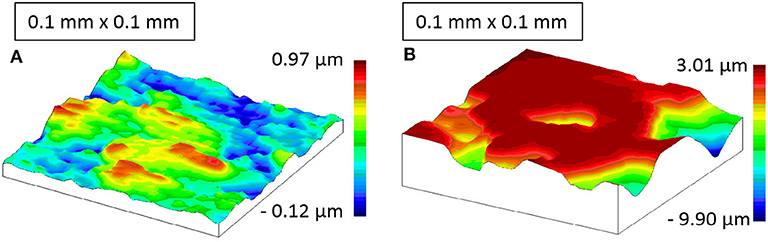
Figure 11. Surface of tribochemical wear (A) Sdq = 0.083; Sdr = 0.258%; (B) Sdq = 0.388; Sdr = 6.787%.
As a result of tribochemical reactions, a transfer film layer developed on the surface (Lestyán et al., 2004), which was “smeared” on the surface due to the intensive heat impact, and then the hard film layer was broken by considerable mechanical stress and the wear particles got torn from there (see Figure 12). This piling and breaking appeared at both members of the contacting material pair, but in a different format. Figure 11A shows a very smooth surface with oriented tears of minor extension. This surface shows the smallest Sdq and Sdr values among the worn topographies examined. The worn surface is nearly “perfectly” plain; parameter values are increased by some tears appearing. Among the worn surfaces examined, the highest Sdq and Sdr parameter values were measured in case of the topography shown in Figure 11B. This can be justified by the relatively dense and deep and non-oriented tears. At the same time, this cannot be considered as a particularly high value when examining non-oriented surfaces (see Figure 3).
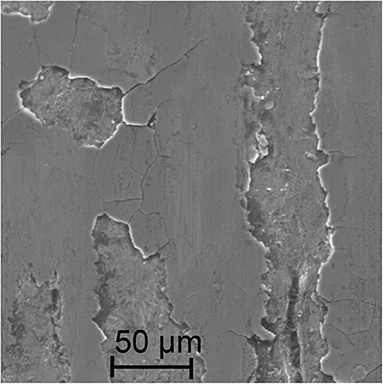
Figure 12. SEM image of tribochemical wear.
In case of worn surfaces, it can be stated in summary that the statements on orientation and surface fineness can be justified here as well, but it is also an interesting experience in case of the topographies examined that wear processes reduce these impacts and position surfaces in the left hand side region close to origin on the Sdq-Sdr map.
Conclusions
Based on our investigations, the following statements can be made:
A close correlation can be shown between the Sdq-Sdr parameters. In the value ranges of 0–0.52 of the Sdq parameter and 0–12 of the Sdr parameter, the correlation coefficient of the two parameters was R2 = 0.998 in case of the topographies examined.
In case of machined surfaces, the Sdq values of surfaces with orientation fell within the value range of 0.039 and 0.268 (2.23–15.35°), while the Sdq parameter of non-oriented or multi-directional topographies is within the 0.182–0.521 (10.43–29.85°) value range.
In respect of types of machining, topographies to be characterized by rougher surfaces or machining defects had higher Sdq-Sdr value pairs than higher quality and finer surfaces of even machining.
The statements on orientation and on the evenness of surface properties could be justified even in case of worn surfaces, both in case of abrasion and tribochemical wear processes. This means that mild wear surfaces have smaller Sdq-Sdr value pairs.
It could be observed in case of worn surfaces that the Sdq and Sdr parameter values were kept relatively low or at medium values by the wear process (Sdq below 0.4), when the surface was strongly articulated and non-oriented.
Data Availability Statement
The original contributions presented in the study are included in the article/supplementary material, further inquiries can be directed to the corresponding author/s.
Author Contributions
ÁC proposed the concept of Sdq-Sdr topological map and prepared the manuscript. IB conducted and evaluated the measurements. All authors contributed to the article and approved the submitted version.
Conflict of Interest
The authors declare that the research was conducted in the absence of any commercial or financial relationships that could be construed as a potential conflict of interest.
References
Barányi, I., Czifra, Á., and Kalácska, G. (2011a). “Power spectral density (PSD) analysis of machined surfaces,” in IX. International Multidisciplinary Conference (Nyíregyháza), 37–43.
Barányi, I., Kalácska, G., and Czifra, Á. (2011b). Three-dimensional Fourier analysis of the surface microtopography. Mech. Eng. Lett. R D 5, 161–165. Available online at: https://www.gek.szie.hu/english/sites/default/files/R&D%20Mechanical%20Engineering%20Letters%20vol5%202011.pdf
Czifra, Á. (2009). Sensitivity of power spectral density (PSD) analysis for measuring conditions. Stud. Comput. Intell. 43, 505–517. doi: 10.1007/978-3-642-03737-5_36
Czifra, Á., and Horváth, S. (2011). Complex microtopography analysis in sliding friction of steel-ferodo material pair. Meccanica 46, 609–617. doi: 10.1007/s11012-010-9422-9
Czifra, Á., and Palásti, K. B. (2013). “Microtopographic features of worn surfaces,” in 5th World Tribology Congress (WTC 2013) (Torino), 1–4.
Czifra, Á., Váradi, K., and Horváth, S. (2008). Three dimensional asperity analysis of worn surfaces. Meccanica 43, 601–609. doi: 10.1007/s11012-008-9136-4
Dzierwa, A., Pawlus, P., and Zelasko, W. (2020). The influence of disc surface topography after vapor blasting on wear of sliding pairs under dry sliding conditions. Coatings 10:102. doi: 10.3390/coatings10020102
Horváth, R., Czifra, Á., and Drégelyi-Kiss, Á. (2015). Effect of conventional and non-conventional tool geometries to skewness and kurtosis of surface roughness in case of fine turning of aluminium alloys with diamond tools. Int. J. Adv. Manuf. Technol. 78, 297–304. doi: 10.1007/s00170-014-6642-5
ISO 25178/2-2012 (2012). Geometrical Product Specifications (GPS)–Surface Texture: Areal–Part 2: Terms, Definitions and Surface Texture Parameters.
Lestyán, Z., Váradi, K., Albers, A., and Arslan, A. (2004). “Finite element thermal analysis of an alumina ceramic-steel sliding friction system,” in 8th International Conference on Tribology (Veszprém), 162–167.
Pagani, L., Qi, Q., Jiang, X., and Scott, P. J. (2017). Towards a new definition of areal surface texture parameters on freeform surface. Measurement 109, 281–291. doi: 10.1016/j.measurement.2017.05.028
Palásti, K. B., Sipos, S., and Czifra, Á. (2012). “Interpretation of “Rz = 4 × Ra” and other roughness parameters in the evaluation of machined surfaces,” in 13th International Conference on Tools (Miskolc), 237–244.
Petropoulos, G. P., Pandazaras, C. N., Vaxevanidis, N. M., and Antoniadis, A. (2006). Multi-parameter identification and control of turned surface textures. Adv. Manuf. Technol. 29, 118–128. doi: 10.1007/s00170-004-2483-y
Sedlaček, M., Gregorčič, P., and Podgornik, B. (2017). Use of the roughness parameters ssk and sku to control friction–a method for designing surface texturing. Tribol. Trans. 60, 260–266. doi: 10.1080/10402004.2016.1159358
Keywords: roughness, topography, tribology, wear, topological map, RMS surface slope, area ratio
Citation: Czifra Á and Barányi I (2020) Sdq-Sdr Topological Map of Surface Topographies. Front. Mech. Eng. 6:50. doi: 10.3389/fmech.2020.00050
Received: 29 April 2020; Accepted: 05 June 2020;
Published: 14 July 2020.
Edited by:
Xianping Liu, University of Warwick, United KingdomReviewed by:
Lei Wang, Harbin Institute of Technology, ChinaYoshitaka Nakanishi, Kumamoto University, Japan
Copyright © 2020 Czifra and Barányi. This is an open-access article distributed under the terms of the Creative Commons Attribution License (CC BY). The use, distribution or reproduction in other forums is permitted, provided the original author(s) and the copyright owner(s) are credited and that the original publication in this journal is cited, in accordance with accepted academic practice. No use, distribution or reproduction is permitted which does not comply with these terms.
*Correspondence: Árpád Czifra, czifra.arpad@bgk.uni-obuda.hu