Effectiveness of Thermal Properties in Thermal Energy Storage Modeling
 Law Torres Sevilla
 Jovana Radulovic
- University of Portsmouth, Portsmouth, United Kingdom
This paper studies the influence of material thermal properties on the charging dynamics in a low temperature Thermal Energy Storage, which combines sensible and latent heat. The analysis is based on a small scale packed bed with encapsulated PCMs, numerically solved using COMSOL Multiphysics. The PCMs studied are materials constructed based on typical thermal properties (melting temperature, density, specific heat capacity (solid and liquid), thermal conductivity (solid and liquid) and the latent heat) of storage mediums in literature. The range of values are: 25–65°C for the melting temperature, 10–500 kJ/kg for the latent heat, 600–1,000 kg/m3 for the density, 0.1–0.4 W/mK (solid and liquid) for the thermal conductivity and 1,000–2,200 J/kgK (solid and liquid) for the specific heat capacity. The temperature change is monitored at three different positions along the tank. The system consists of a 2D tank with L/D ratio of 1 at a starting temperature of 20°C. Water, as the heat transfer fluid, enters the tank at 90°C. Results indicate that latent heat is a leading parameter in the performance of the system, and that the thermal properties of the PCM in liquid phase influence the overall heat absorption more than its solid counterpart.
Introduction
In recent years, where the world is straying away from harmful and environmentally damaging methods of harvesting energy such as fossil fuels, there has been a lot of development on renewable technologies. Many of these, including for instance wind and solar energy systems, are intermittent and volatile in nature (Zhou et al., 2019). In order to exploit the true potential of these energy collection methods, it is necessary to pair them with other existing technologies that enable their further usage and availability, while mitigating the gap that exists between the consumers and the providers. Out of all the available storage solutions, this paper discusses the use of Thermal Energy Storage (TES) to balance the disarray.
Thermal Energy Storage
Broadly speaking, there are two main types of TES: sensible heat and latent heat (Guruprasad et al., 2017; Enescu et al., 2020).
Sensible heat is the amount of heat absorbed that results in temperature increase. It can be expressed as the following:
where Q is the amount of heat absorbed (J), m is the mass (kg), Cp is the specific heat capacity (J/kgK) and ΔT is the change in temperature (K).
Latent heat is the amount of heat absorbed by the material during a phase change. There are three types of phase change materials: solid-solid, solid-liquid and liquid-gas. Often, melting systems (solid-liquid) are employed, as changes from liquid-gas have drawbacks and complications due to large volume changes and high pressures, and solid-solid alternatives have very low latent heat (Zhang et al., 2016; Feng et al., 2020). It can be expressed as the following:
where Q is the amount of heat absorbed (J), m is the mass (kg) and L is the latent heat (J/kg).
Characteristics of the storage medium which dictate other TES parameters are the operating temperature range, system size, heat transfer fluid and system costs (Guelpa and Verda, 2019). Hence, selection of the material with desirable thermal properties is essential. For instance, a material that offers a fast charging time may have a poor heat absorption. Understanding how the thermal properties of materials affect the TES performance and heating dynamics is a key element to an adequate and educated material selection.
Current Literature
A plethora of authors carried out a material-based analysis on TES systems for both sensible and latent heat. The materials employed in sensible heat TES are concrete, rocks, sand and minerals which have advantages such as low cost, easily available and well understood (Jemmal et al., 2016; Ahmed et al., 2020). Others include molten salts, frequently utilized for the high temperature systems, which can be categorized as carbonate, fluoride, chloride and nitrate salts (Mohan et al., 2019). Properties of typically used materials are given in Table 1.
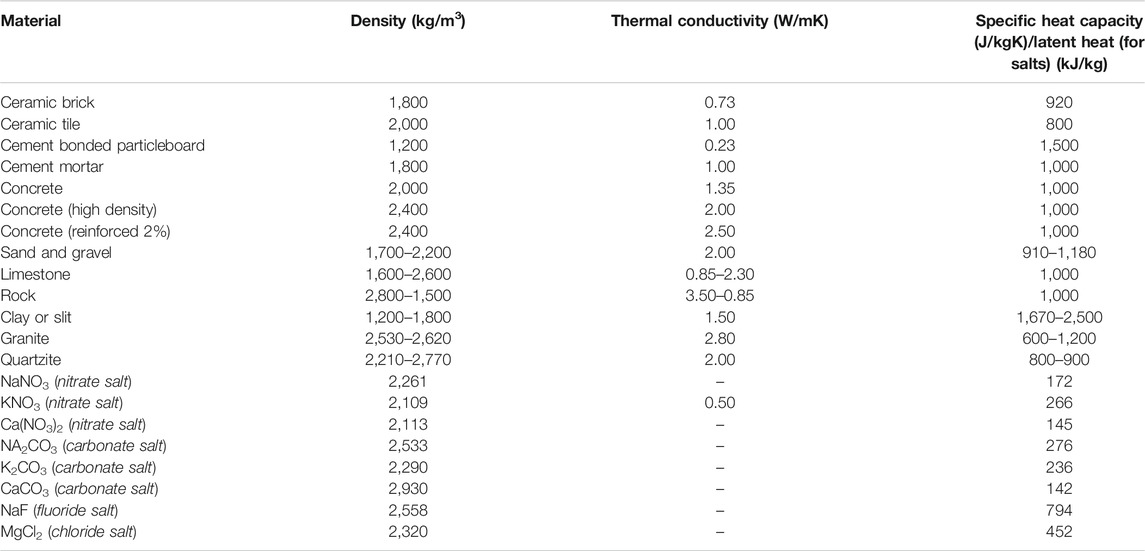
TABLE 1. Examples of sensible heat storage materials and their thermal properties (Grirate et al., 2014; Alva et al., 2017; Lizana et al., 2017; Alva et al., 2018).
For latent heat TES, the materials used are phase change materials (PCMs). Common PCMs are solid-liquid types and these can be classified into organic compounds (which include paraffins, fatty acids, alcohols and esters), inorganic compounds (which include metals and salt hydrates) and eutectics (Lizana et al., 2018). Typical properties of PCMs are given in Table 2.
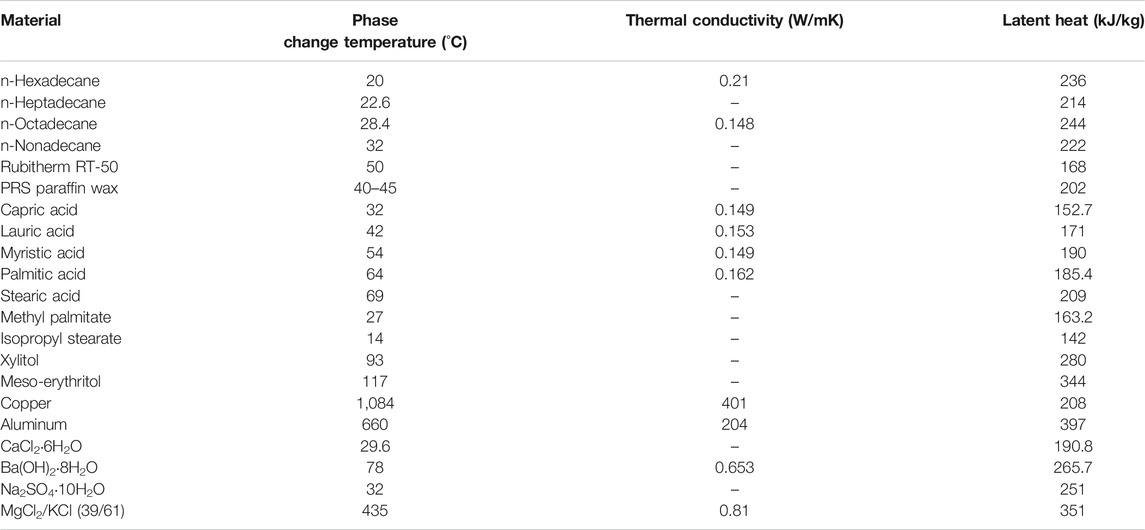
TABLE 2. Examples of latent heat storage materials and their thermal properties (Pielichowska and Pielichowski, 2014; Alva et al., 2017; Alva et al., 2018).
The values in the tables demonstrate a wide range of thermal properties, some spanning across an order of magnitude. While certain material thermal properties are advantageous, other quantitative parameters have far from desirable values; for example, some organics PCMs have relatively low latent heat and thermal conductivity. Hence, suggestions and advances for material enhancement and novel constructions to augment thermal properties are reported frequently in literature.
Ghalambaz et al. (2021) test the performance of a nano-enhanced PCM to be implemented a shell and tube TES unit. The PCM, capric acid, is enhanced with two nano-additives: copper or graphene oxide. The system is solved numerically using a finite element-based Galerkin algorithm, and then optimized using the Taguchi Optimization Approach. They conclude the addition of the nano-additives improve melting rate, and that the copper ones are more effective.
Chen et al. (2019) propose a metal foam enhancement for a PCM-based TES solved numerically in the software ANSYS. The materials used are Water, Paraffin RT 58 and Copper, varying the porosity by 0.85, 0.90, and 0.95. They test different inlet velocities (0.04, 0.05, 0.08, and 0.10 m/s) and inlet temperatures (340, 350, and 360 K). They conclude the performance of the system improves greatly by inserting the metal foam in both the storage medium and HTF, decreasing charging/discharging times by 84.9%. Mhiri et al. (2020) also explore the idea of using foam to enhance thermal conductivity, as well as leakage issues, for a PCM to be used in TES. The nanocomposite consists of a paraffin/graphite mixture embedded in a carbon foam by vacuum impregnation. Three different volume fractions (0, 1, and 2 wt%) are tested for each porosity (0.9, 0.95, and 0.98) in a 3D numerical simulation in COMSOL Multiphysics. Results show that the addition of both the graphite and foam can increase the thermal conductivity of the material up to 9 times of the pure paraffin one, and enhances the melting process of the PCM by a range of 21–42%.
Qureshi et al. (2021) again approach the idea of using material enhancements to create a metal foam PCM composite (MFPCM). The PCM, Rubitherm RT42, is combined with AlSi10 Mg powder and 3D printed as a novel approach into three Triply Periodic Minimal Surfaces (TPMS). Furthermore, the designs were built in CAD and solved in ANSYS FLUENT 18.0. Their results conclude that the melting time of the PCM was reduced by approximately 31–40.3% depending on the TPMS. All results had improved heat transfer coefficients, the best one being 523 W/m2K for the IWP design.
Zhou et al. (2020) construct a hybrid microencapsulated PCM to increase the thermal conductivity of paraffin. They use graphene oxide (GO) and graphene nanoplates (GNP) in different mass fractions to create a nano-sized coating which enhances the thermal conductivity from 0.67 to 0.9 W/mK, while the energy storage capacity does not suffer major compromises.
Li et al. (2020) apply expanded graphite to n-eicosane via vacuum impregnation as a composite PCM for electro-driven TES. The analysis indicated that the composite has enhanced values of 199.4 and 199.2 J/g for melting and freezing, respectively. Furthermore, the thermal conductivity was 14.4 times greater than that of pure n-eicosane (3.56 W/mK), at a 15 wt% value.
Pradeep et al. (2020) investigate the impact of silver nanoparticles in a thermal energy storage using the PCM paraffin wax. The considered mass fractions of silver are 0.05 and 0.1% and the melting and solidification rates of the paraffin with and without it are studied. Adding the nanoparticles raises or lowers the average temperature by 11 and 29.5% for 0.05 and 0.1%, respectively.
Wen et al. (2021) investigate a low-cost composite consisting of the carbonized biomass of maize straw (CMS) and stearic acid (SA). It is prepared via the vacuum impregnation process and thermal stability, thermal reliability and thermal conductivity of the SA/CMS are investigated. Results show that the thermal conductivity increased by 87.5% to 0.3 W/mK. Furthermore, compared with the original SA, the melting time of the composite is reduced 50% and the freezing time reduced 73%. Numerous studies focus on improving the material properties using different methods, particularly thermal conductivity enhancement, but there is a lack of literature that connect the thermal conductivity directly to heat absorbed and charging time outputs. Although the focus of this paper is not limited to thermal conductivity only, and includes other relevant parameters, there are very little reports in literature that really tackle the impact of thermal properties in general on the system performance.
Gadd and Werner (2015) present a theoretical heat transfer model to predict the rate of energy storage and energy storage density as functions of PCM thermal properties. They propose two scenarios derived from two geometries, a simple Cartesian wall scenario and a more complex cylindrical phase change one. They conclude that improving thermal conductivity helps increase the rate of energy stored, yet is not helpful for improving the energy storage density. In a Cartesian system, the energy storage density remains unchanged and decreased for the cylindrical one. They also insist that there is a trade-off in the material choice depending on whether the rate of energy storage or the energy storage density is paramount.
Purpose of Study
After examining the current literature, a need for further evaluation of thermal parameters and their influence on the system performance became obvious. The chosen outputs to be linked to the thermal properties are heat absorbed and charging time. This paper, therefore, offers an analysis of hypothetical material thermal properties in order to provide more insight into the effect of individual material parameters found in conventional and/or novel materials in TES systems. Furthermore, results can aid users in their material selection, material enhancement and contribute positively toward the optimization of TES systems.
Materials and Methods
In this paper, hypothetical TES materials were studied in order to evaluate the effect of individual thermal properties on charging heating dynamics. Water was selected as the heat transfer fluid (HTF) due to its well-known and favorable thermal properties (low cost, high specific heat, thermal conductivity etc.) (Parhizi and Jain, 2019) and its effectiveness with the system’s operating temperature range. The system consists of a packed bed containing PCM in encapsulated spheres and the analysis focuses on the charging aspect and influence of specific material parameters on the system performance.
System Design
The system is formed of a symmetrical, single, cylindrical tank domain of 0.5 m in height and diameter, alongside a tank frame with a thickness of 0.025 m. This is modeled numerically as a flat 2D surface, representing a center cross-section slice of the cylinder itself. It is packed with a set of 19 × 17 encapsulated spheres containing hypothetically constructed PCM, where the outer shell of the capsule is considered thin and negligible, the inner sphere radius being 0.0125 m. The HTF enters the system at a constant temperature of 90°C at an inlet velocity of 0.01 m/s. There are a single inlet and outlet of 0.12 m in length, both placed at the center of the tank (Figure 1). The system starts with still water inside the tank at an ambient temperature of 20°C.
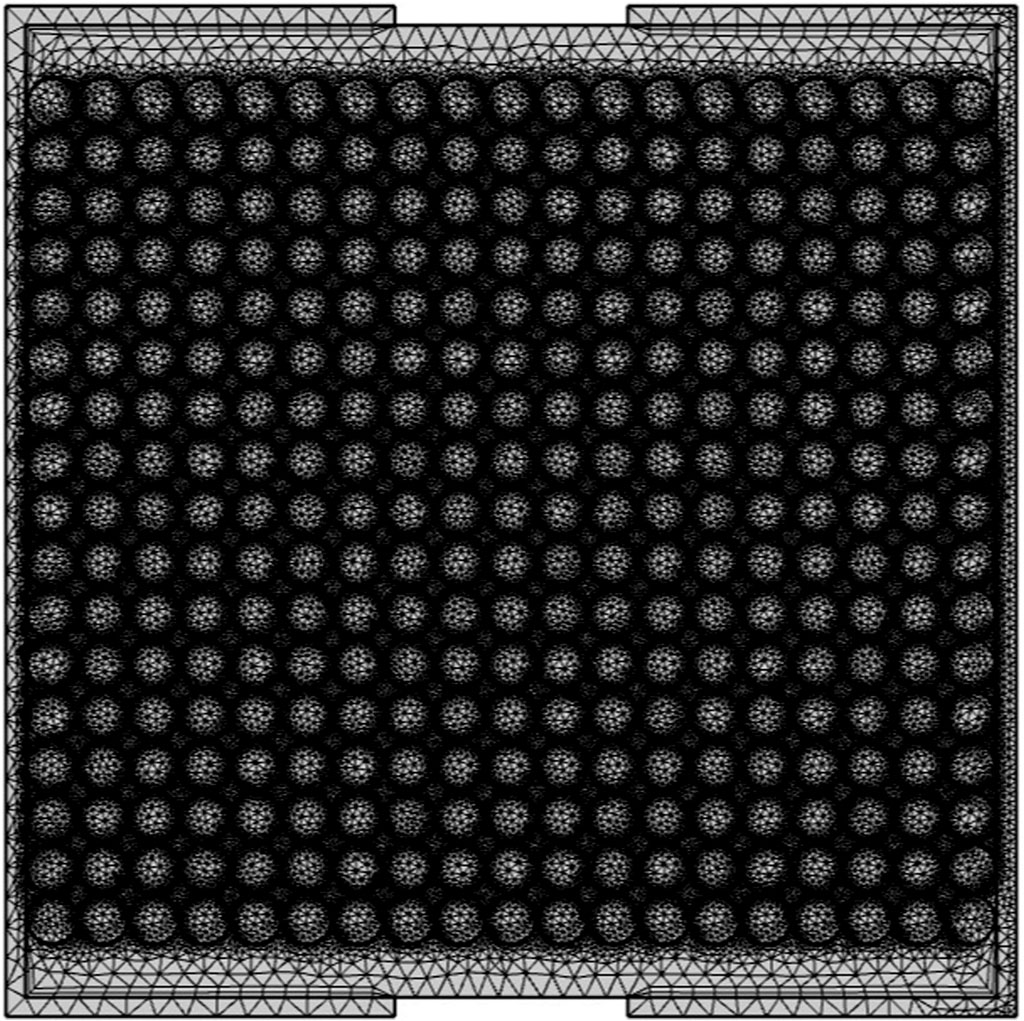
FIGURE 1. Coarse physics generated 2D mesh of the system in COMSOL multiphysics.
The system mesh is generated by the software COMSOL Multiphysics and was set to be extremely coarse as the difference in temperature with a finer one was approximately ±1 K and this setting significantly saved the computational cost. It was also physics controlled, with approximately 138,000 mesh elements (mostly triangular prisms). The temperature is recorded over 60 min and extracted for three different positions along the tank, labeled and shown in Figure 2.
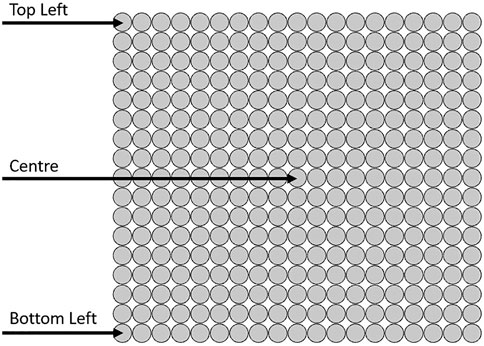
FIGURE 2. Positions along the tank which will monitor and record temperature.
Boundary Conditions and Assumptions
Two physics models, “Laminar Flow” and “Heat Transfer in Fluids” were coupled with “Nonisothermal Flow”. The heat transfer problem was solved using the heat equation for non-uniform isotropic mediums and Fourier’s law:
where ρ is density (kg/m3), Cp is the heat capacity at constant pressure (J/K), T is temperature (K), t is time (s), u is velocity (m/s), q is the heat flux (W/m2), Q is the heat source (J), Qp is heat pressure work (J/K), Qvd is heat viscous dissipation (J/s) and k is the thermal conductivity (W/mK).
The solution method is a Newton-type iterative method used to solve nonlinear systems of partial differential equations. The boundary conditions at the wall are no slip and the tangential velocity is equal to zero. At the inlet, the boundary is a fully developed velocity profile, yet the outlet boundary condition is set to pressure, where initial pressure is zero and the model suppresses backflow. The HTF is modeled as laminar and incompressible, and materials are assumed to be homogeneous and isotropic. The outside of the tank is assumed to be perfectly insulated and there is no heat dissipation or heat losses due to radiation. Lastly, the spheres are modeled as circles that do not undergo deformation.
In addition, the heat capacity ratio, utilization ratio and charging efficiency are to be calculated (Xu et al., 2015):
where Hrc is the heat capacity ratio, ρHTF is the density of the HTF (kg/m3), CHTF is the specific heat capacity of the HTF (J/kgK), e is the void fraction, ρs is the density of the material (solid) (kg/m3) and CHTF is the specific heat capacity of the material (solid) (J/kgK).
where R is the utilization ratio, VPCM is the total PCM volume (m3) and VTANK is the tank available volume (m3).
where η is overall charging efficiency, TAV is the average temperature reached by PCMs (K) and TIN is the inlet temperature of the HTF (K).
Hypothetical Material Construction
Hypothetical materials were constructed using adequate thermal property ranges acquired from the literature. To precisely determine how material properties dictated the system outputs, a base case with fixed thermal parameters was created (C1). From here, one material property was varied at a time, while all the others remained fixed. These variations were based on existing materials (such as paraffin types) and values previously reported by multiple authors in literature. The varying parameters for the material construction were melting temperature, latent heat and specific heat capacity (solid and liquid), density and thermal conductivity (solid and liquid).
Each tested material was given a unique identifier code to simplify the analysis (Tables 3–5). Thermal property values for the codes are assumed to be equal to the ones in the base case unless stated otherwise in the tables. For instance, for code CL1, the only variation was in the latent heat. The base case C1 had the following parameters:
1. Melting temperature: 45 °C.
2. Latent heat: 200 kJ/kg.
3. Density: 800 kg/m3
4. Thermal Conductivity
a. Solid: 0.4 W/mK
b. Liquid: 0.2 W/mK
5. Specific Heat Capacity
a. Solid: 2,000 J/kgK
b. Liquid: 2,200 J/kgK.
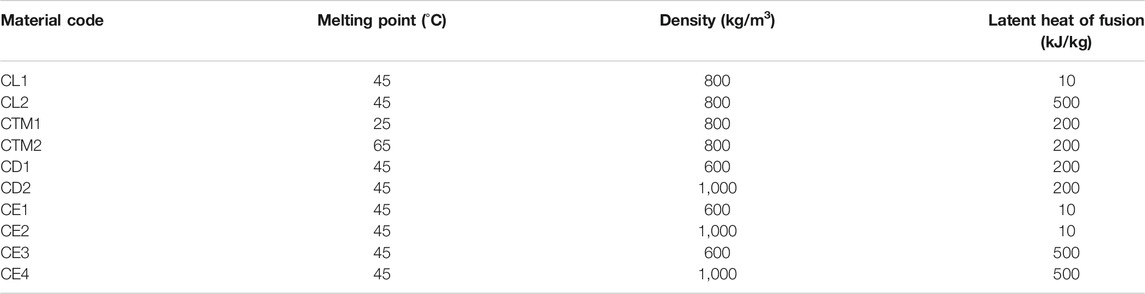
TABLE 3. Material codes and their corresponding material properties with respect to the base case C1
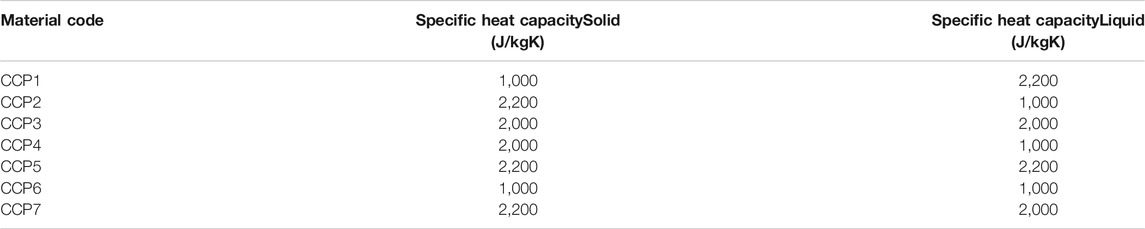
TABLE 4. Material codes for specific heat capacity changes only with respect to the base case C1
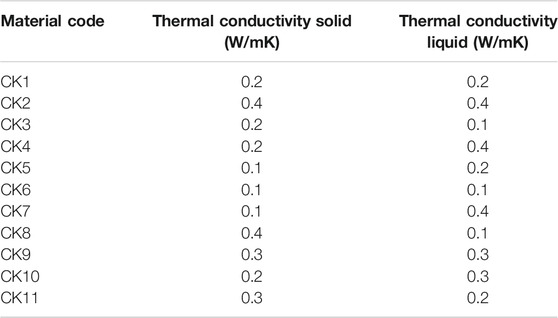
TABLE 5. Material codes for thermal conductivity changes only with respect to the base case C1.
Model VALIDATION
The model validation was carried out based on the results reported by Tay et al. (2015) that focus on a single symmetrical tank latent heat 2D system of dimensions 0.15 m × 1 m, with an inner pipe carrying the HTF (Therminol VP1) of diameter 12.70 mm and length of 1 m. The PCM is a stationary NaNO3 wrapped around the pipe with diameter of 0.15 m and length of 1 m. The initial temperature of the system was 250°C, Therminol VP1 mass flow rate was 0.01 kg/s, with inlet temperature of 350°C. Over 40 h of simulation time temperature were monitored at nine points across the tank length. A comparison of our results and those reported in (Wen et al., 2021) are shown in Figure 3 for a selected point across the system (point T8 in (Wen et al., 2021)). Our results show a lag in the initial charging stage (up to 5 h). Across the thermal plateau, results are in good agreement with the model, where the maximum difference observed is < 5°C. The general shape of the temperature curve indicates that our model captures the overall latent and sensible heat uptake. Final temperatures reached are in excellent agreement.
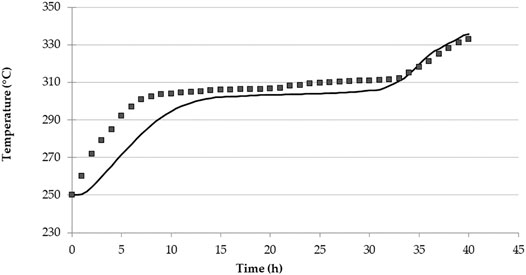
FIGURE 3. PCM heating process model validation: comparison of Tay et al. (2015) results (square symbols) with our simulation model (solid line).
Results
The following section presents all the results.
Density, Latent Heat and Melting Temperature
Temperature change graphs were plotted for all material codes in Table 3, for all three positions along the tank. Each material code is explicitly compared to the base case in order to effectively ascertain how the effect of varied properties are affecting the heating dynamics and temperature distribution across the tank (Figures 4–6).
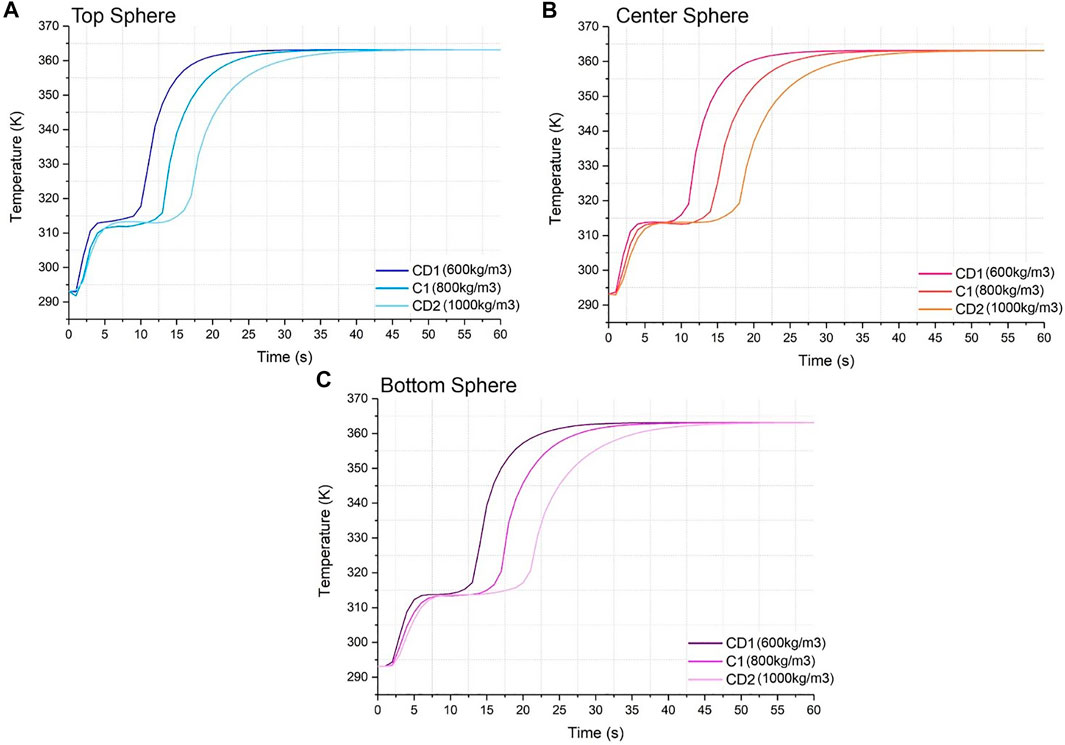
FIGURE 4. Temperature vs. time graph for material codes C1, CD1 and CD2 for (A) top sphere, (B) center sphere, and (C) bottom sphere.
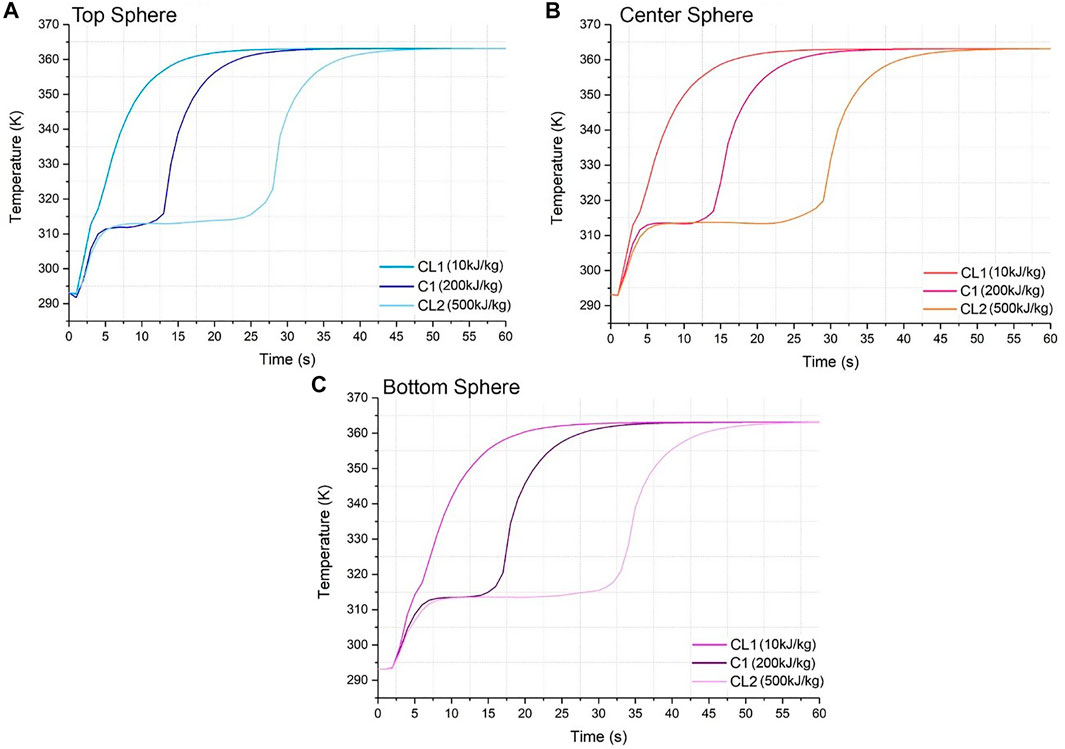
FIGURE 5. Temperature vs. time graph for material codes C1, CL1 and CL2 for (A) top sphere, (B) center sphere, and (C) bottom sphere.
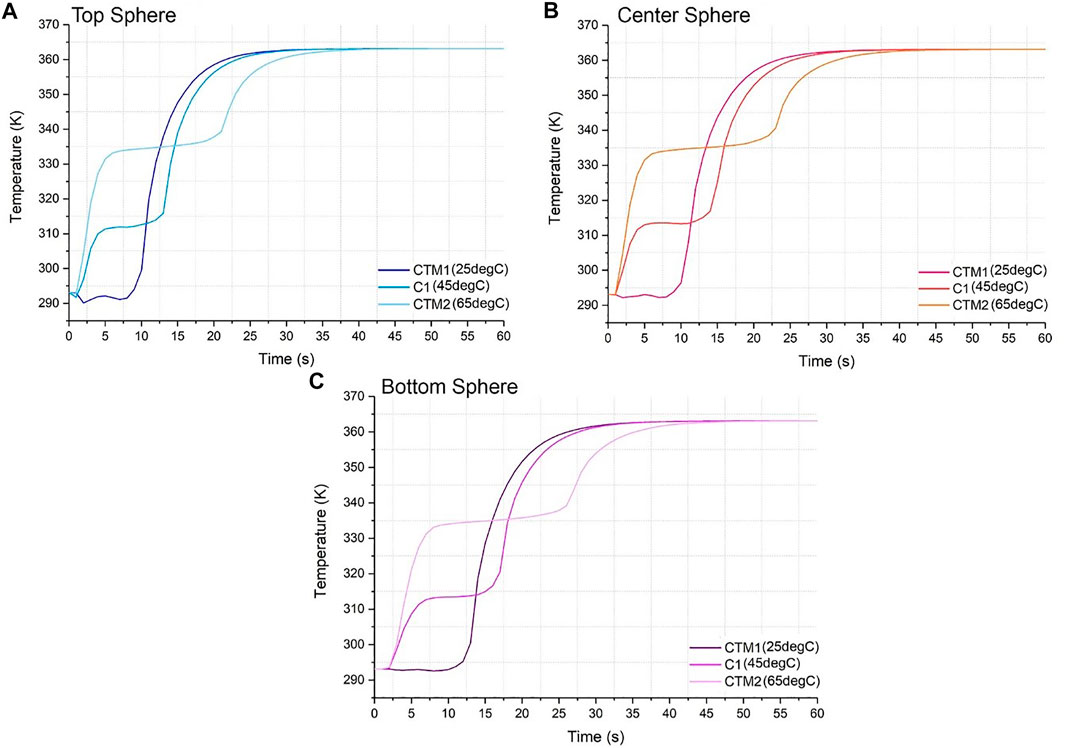
FIGURE 6. Temperature vs. time graph for material codes C1, CTM1 and CTM2 for (A) top sphere, (B) center sphere, and (C) bottom sphere.
Specific Heat Capacity and Thermal Conductivity
Contour temperature plots (Figures 7, 8) show the influence of both the specific heat capacity and the thermal conductivity of solid and liquid phases. Presented temperature values are for the center sphere position and at a time of 20 min into the simulation.
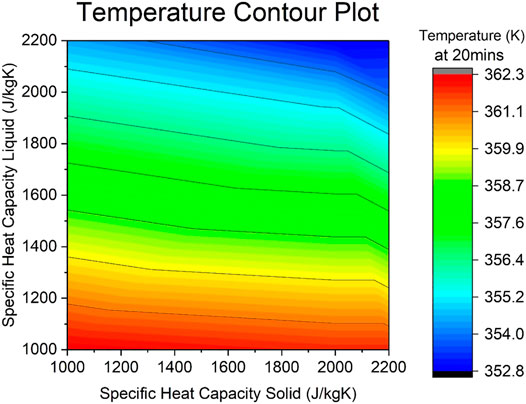
FIGURE 7. Temperature contour plot for specific heat capacity (liquid and solid) for CCP1 to CCP7.
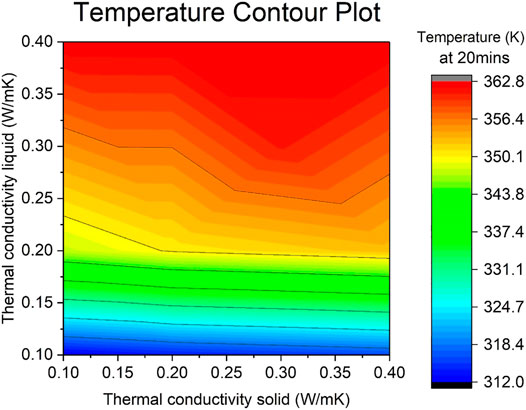
FIGURE 8. Temperature contour plot for thermal conductivity (liquid and solid) for CK1 to CK11.
Heat Absorbed (Density and Latent Heat)
The relationship between the latent heat and density regarding the heat absorption per sphere (for the center sphere) is shown on Figure 9.
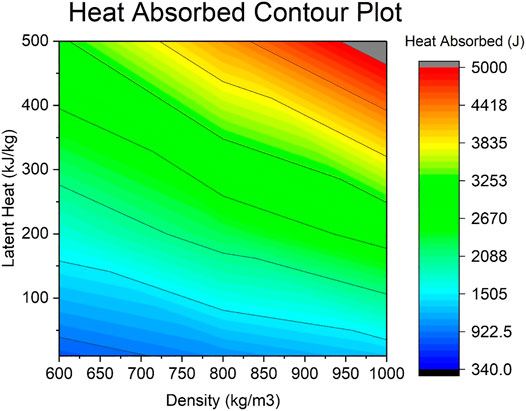
FIGURE 9. Heat absorbed contour plot for density and latent heat for CD1–CD2 and CE1–CE4.
Heat Capacity Ratio, Utilization Ratio and Overall Efficiency
The values for the heat capacity ratio and overall efficiency were calculated and can be found on Tables 6–8. The utilization ratio is a constant value relevant to the design and was calculated to be 0.6342.
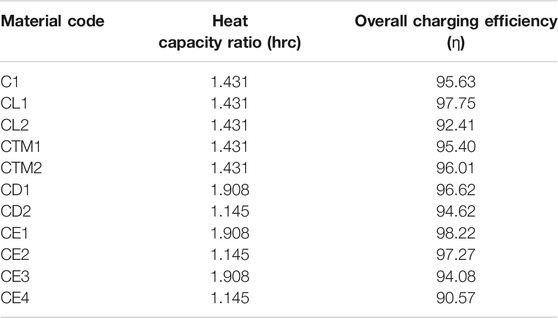
TABLE 6. Material codes and their heat capacity ratios and overall charging efficiencies.
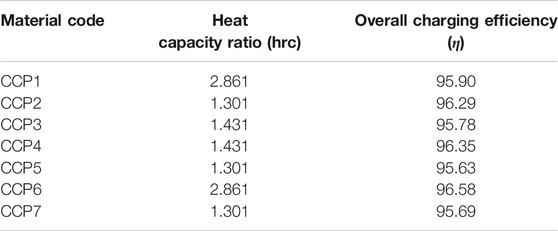
TABLE 7. Material codes for specific heat capacity and their heat capacity ratios and overall charging efficiencies.
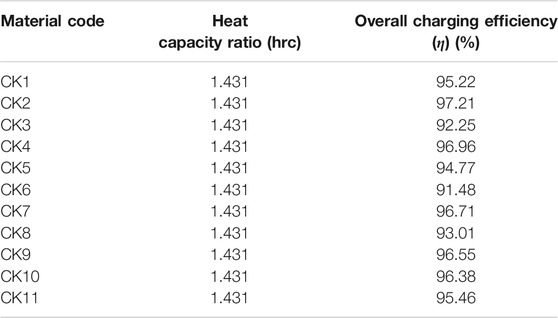
TABLE 8. Material codes for thermal conductivity and their heat capacity ratios and overall charging efficiencies.
Discussion
The following section discusses and analyses all previously showcased results.
Density, Latent Heat and Melting Temperature
The discussion focuses on the thermal parameters found in Figures 4–6.
Density
The heating dynamics do not differ for three positions across the tank as shown in Figure 4. However, the density for the material does alter the charging time and heat absorption of the system, causing it to experience some visible lag when approaching the final temperature of the HTF. Nonetheless, all codes (C1, CD1 and CD2) reach the inlet temperature within the simulation time.
Looking at Figure 4A, specifically for the top position, all materials are heated sensibly to phase change within approximately 4–6 min. The material with the highest density, CD2, shows a longest thermal plateau, approximately 9 min, while the CD1 phase change was approximately 6 min, which allows it to charge to the maximum temperature fastest at roughly 22 min, where the curve starts to plateau. The larger heat absorption time for CD2 then delays the liquid sensible heat absorption period and causes this material to reach the maximum temperature at approximately 37 min into the simulation, 15 min slower than CD1. Figures 4B,C show the same pattern. Furthermore, for Figures 4A–C, all density lines converge at times 40 min, 42 and 47 min, respectively. At these times, the system has reached thermal stability and all the tank is at the inlet temperature.
It is established that a higher density favors a higher latent heat absorption, yet also the higher the density, the slower the charging time. This is further proven in Figure 9, where the relationship between high density and high heat absorption is clearly seen on the top right corner of the contour plot where the red-coloured high values concentrate. In Figure 9 it is seen that even at the lowest possible latent heat of 10 kJ/kg, as the density increases it does not escape the blue region that corresponds to the low heat absorption from 340 to 1,505 J. However, the opposite cannot be said for the lowest density of 600 kg/m3, as an increase in latent heat leads to greater heat absorption values in the region of 340–3,253 J. This is roughly double the density’s maximum, which leads to the conclusion that the latent heat parameter and the latent heating is much more significant to this system than the density and sensible heating. Also, for a maximum density of 1000 kg/m3, a value of 460 kJ/kg is needed to reach the maximum heat absorption of 5,000 J.
In terms of sphere position, from the top sphere to the bottom sphere there is not a noticeable difference in the initial sensible heat phase, yet there is a larger phase change period for all materials. This is due to the water entering the system at a very slow velocity, impacting the amount of heat received by the bottom sphere which is furthest away from the inlet. There is roughly a 10 min difference between the time where CD1 reaches the settling temperature between Figures 4A,C, where 4(1) charges the fastest. Also, there is a wider time gap between the material lines as the sphere position strays from the inlet, where the lines are more separated in 4(c) than in 4(a). However, this difference is barely impactful and therefore negligible.
Latent Heat
The characteristic shape of the temperature curve for a latent heat system is visible in Figure 5 for CL2. The shape of the CL1 curve resembles an exponential growth, where the horizontal line which denotes the phase change of the material is only minor. This is because the latent heat was minute for CL1 (10 kJ/kg) and therefore the material is heating, almost solely, sensibly. As expected, a higher latent heat value for the material requires a higher heat absorption time, clearly seen in the difference between CL1 and CL2. The phase change time for CL1 is roughly 1 min, while for CL2 it is 20 min of latent heat absorption. Also, CL1 approaches the HTF temperature at 17 min, whereas CL2 takes slightly over double the amount of time as the line plateaus at 37 min. The gaps of time between each line for all positions are much larger than in the equivalent graphs for density when it was varied. The gaps between lines for Figure 5A at, for instance, the point where the second sensible heat commences after the phase change are 8 min from CL1 to C1 and 15 min from C1 to CL2. For 5(b) this happens at 9 min from CL1 to C1 and 16 min from C1 to CL2. Lastly, for 5(c) this happens at 12 min from CL1 to C1 and 18 min from C1 to CL2. Similar to the trend observed for higher density, the higher the latent heat, the slower the charging time and the longer it takes to reach the final inlet temperature. For Figures 5A–C, all latent lines converge at times 47, 50, and 55 min, respectively. At these times, the system has reached thermal stability and all the tank is at the inlet temperature. These are significantly slower compared to the density ones, with a difference of approximately 7–8 min between the range of values varied for each code. Therefore, the latent heat is a more influential factor.
As expected, looking back at Figure 9 again shows that a high latent heat provides a high heat absorption per sphere. When the latent heat is fixed at its highest value, 500 kJ/kg, the range of heat absorption achieved by varying the density goes from 3,253 to 5,000 J. This supports the notion that the latent heat affects and changes the system more than density. It is important to notice too that the range of heat absorption is very large and greatly affected by latent heat and density, since it can go from a low 340–5,000J, which is over 14 times higher for this system. As done previously, for a maximum latent heat of 500 kJ/kg, a value of 940 kg/m3 is needed to reach the maximum heat absorption of 5,000 J.
By analyzing different in positions along the tank, CL2 in Figure 5A commences the second sensible heat absorption at 25 min, whereas on Figure 5C this happens at 32 min, with a difference of 13 min. Again, this variance is larger than the density one (previously marked as 10 min), reinforcing the idea that latent heat as a parameter has a larger influence on the system behavior. 8 and 12–27.
Melting Temperature
The heating dynamics in Figure 6 changed drastically as melting temperature was varied. Since the melting temperature of CTM1 was low (25°C) and close to the initial temperature of 20°C, the phase change commences almost immediately as the HTF enters the tank at a time of 5 min for Figure 6A, 7 min for 6(c). The phase change duration is relatively short, 10 min for Figure 6A, 12 min for 6(c). CTM1 continues to charge rapidly as it heats up sensibly in its liquid state, denoted by the steep line and commencing to plateau toward the HTF inlet temperature at roughly 20 min for Figure 6A, 22 min for 6(c).
Similarly, CTM2 starts its phase change process at the same time as CTM1 and this happens for all positions. Nonetheless, the phase change time differs, where the thermal plateau stops after 22 min since the start of the simulation for Figure 6A, 27 minutes for 6(c). Therefore, the phase change time for CTM2 was a total of 17 min for 6(1) and 20 min for 6(c), different for CTM1 where it was the same for all positions. Furthermore, CTM2 approaches its final temperature at 32 min for 6(1) and 37 min for 6(c), with a variance of 12 and 15 min compared to CTM1, respectively. For Figures 6A–C, all melting temperature lines converge at times 37 min, 40 and 45 min, respectively. At these times, the system has reached thermal stability and all the tank is at the inlet temperature. This is the fastest the codes reach thermal stability compared to density and latent heat.
This data suggests that a higher melting temperature slows the charging process as the system takes longer to reach the final temperature, yet as the phase change time is longer, a higher melting temperature will yield a higher heat absorption than a lower one. When compared to the previous sections, the changes and differences between materials and positions are larger than the ones from Figure 4, yet lower than Figure 5. This suggests that even though melting temperature is more influential to the system than density, latent heat appears the most influential of the three.
Specific Heat Capacity and Thermal Conductivity
The discussion focuses on the thermal parameters found in Figures 7–9.
Specific Heat Capacity
From the contour plot in Figure 7 it is evident that the temperature reached by the system after 20 min of simulation time is influenced by the specific heat capacity, where the range of the temperatures go from approximately 362–352 K, a difference of 10 K. The highest temperatures reached by the system lie at the bottom of the graph, where the specific heat capacity of the liquid is at its lowest value of 1,000 J/kgK. The coldest temperature region lies at the top right corner, where both the specific heat capacities are at a maximum value (2,200 kJ/kgK for both the liquid and solid). Hence, the lower the value of the specific heat capacity of the liquid, the higher the reached temperature of the system.
If the specific heat capacity of the solid is fixed at its maximum (2,200 kJ/kgK), the range of temperatures achieved by varying the liquid counterpart goes from 352.8 to 362.3 K (which are the minimum and maximum values). Equally so, if the specific heat capacity of the solid is fixed at its minimum (1,000 kJ/kgK), the range of temperatures achieved by varying the liquid counterpart is still almost the entire results range (from ∼355 to 362.3 K). If the opposite is done and the liquid one is fixed instead at a maximum of 2,200 kJ/kgK, the range considerably decreases from 352.8 to ∼355 K. When fixing the minimum of 100kJ/kgK, the range establishes at very positive values of ∼360–362.3 K.
This suggests that the specific heat capacity of the liquid is a much higher influential factor to the charging and heating dynamics of the system than its solid counterpart, especially at lower values where the role of the solid seems negligible as red lines are near horizontal. This is logical, as the melting temperature of 45°C is closer to the into the inlet temperature of 25°C than the HTF 90°C one, so the material spends more time in its liquid form. Nevertheless, as both values increase, the influence of the solid becomes more visible as the lines start to curve downwards, and these also suggest that the higher value of the specific heat capacity, the lower the temperature reached.
Thermal Conductivity
Compared to Figure 7, the range between the maximum and minimum temperatures in the contour plot in Figure 8 is significantly larger, a difference of 50 K, suggesting the importance of the thermal conductivity over the specific heat capacity in TES performance. The red hot region sits on the top area where the thermal conductivity of the liquid is its highest, especially on the top right corner as the lines bend downwards as the solid values also increase. The lower cold region is marked at the near horizontal blue lines where the thermal conductivity of the liquid is the lowest.
If the thermal conductivity of the solid was fixed at its maximum value of 0.4 W/mK, the thermal conductivity of the liquid varies from 318.4 to 362.8 K. However, when fixing thermal conductivity of the solid at its minimum value of 0.1 W/mK, the thermal conductivity of the liquid varies from 312.0 to 362.8 K. On the contrary, fixing the liquid at a maximum of 0.4 W/mK causes the solid counterpart to always reaches the maximum temperature of 362.8 K. When fixing the liquid at a minimum of 0.1 W/mK, the temperature ranges from 312 to 318.4 K.
This indicates the higher the thermal conductivity of the liquid, the higher the temperature reached by the system. Similar to the previous section, the liquid section seems to be more influential than its solid counterpart, yet again becomes being more contributing as the values increase. For this parameter, nonetheless, there is a very large difference in temperatures between doubling the value from 0.1 to 0.2 W/mK (range of 30 K), to further doubling it from 0.2 to 0.4 W/mK (range of 10 K). Benefit from increasing the value above 0.3 is lessened and this is denoted from the red area being larger than the one in Figure 7, shown from the middle of the graph onwards, approximately.
Heat Capacity Ratio and Overall Efficiency
Since in this system the heat capacity ratio is a parameter affected only by the density and specific heat capacity of the PCM, most of the presented results in Tables 6–8 have the same value. Ultimately, the changes happened only for material codes that varied density (CD1, CD2, CE1, CE2, CE3 and CE4) and specific heat capacity of the solid (CCP1, CCP2, CCP5, CCP6 and CCP7).
Looking firstly at the density ones, the ratios range from a minimum of 1.145 (for density at 600 kg/m3) to a maximum of 1.908 (for density at 1,000 kg/m3), a difference of 0.763. For the specific heat capacity of the solid, they range from 1.301 (for Cps at 1,000 kJ/kgK) and 2.861 (for Cps at 2,200 kJ/kgK), a difference of 1.56. The ratio is considerably larger for the specific heat ones. Focusing now on the overall efficiency, the percentages range from 90.57 to 98.22%. The most efficient in terms of charging was the case CE1, which had a 98.22% efficiency. This difference of 7.65% is from simply selecting a material with the right thermal parameters. Other sources in literature that utilize different methods to improve efficiency report increased percentages that may vary from 5 to 40% (Al-Azawii et al., 2020; Dai et al., 2020). This is as expected and agrees with the other results, as this test had the lowest density and latent heat values, which earlier were mentioned to grant the fastest charging time. Likewise, the lowest efficiency was 90.57% which was for test CE4, that had the highest density and latent heat values. Other efficiencies, such as the ones in codes which varied the specific heat capacity parameter, were more modest and ranged from a minimum of 95.63% to a maximum of 96.58%. The lowest happened for code CCP5, which had values for Cp solid/liquid of 2,200/2,200 kJ/kgK, respectively. The largest happened for CCP6 which had values for Cp solid/liquid of 1,000/1,000 kJ/kgK, respectively. Again, these are in good agreeance with the previously stated assumptions. Lastly, efficiencies in the thermal conductivity tests were more extreme than the Cp ones, and ranged from a minimum of 91.48% to a maximum of 97.21%. The lowest happened for code CK6, which had values for Cp solid/liquid of 0.1/0.1 W/mK, respectively. The largest happened for CK2 which had values for Cp solid/liquid of 0.4/0.4 W/mK, respectively. Once again, these are in good agreeance with the previously stated assumptions.
Conclusion
This paper offers a systematic approach to evaluating the effect of PCM thermal properties on heating dynamics and TES system performance. Low density and low latent heat reduce the charging time of the system to up to 15 min, whereas low specific heat capacity of the liquid and high thermal conductivity of the liquid positively influence maximum charging temperatures, increasing the value up by a maximum 50 K for thermal conductivity and 10 K for specific heat capacity. Selecting the right material can increase the overall charging efficiency by 7.65%. Furthermore, the specific heat capacity and thermal conductivity of the liquid are more influential than those of the solid. Lastly, a high density and latent heat are beneficial for maximum heat absorption, drastically affecting the heat absorption to range from 340 to 5,000 J.
Data Availability Statement
The original contributions presented in the study are included in the article/Supplementary Material, further inquiries can be directed to the corresponding author.
Author Contributions
JR and LTS developed and designed the study. LTS performed the modeling and analysis. LTS and JR wrote sections of the manuscript. Both authors contributed to manuscript revision, read, and approved the submitted version.
Conflict of Interest
The authors declare that the research was conducted in the absence of any commercial or financial relationships that could be construed as a potential conflict of interest.
References
Ahmed, N., Elfeky, K. E., Lu, L., and Wang, Q. W. (2020). Thermal Performance Analysis of Thermocline Combined Sensible-Latent Heat Storage System Using Cascaded-Layered PCM Designs for Medium Temperature Applications. Renew. Energ. 152, 684–697. doi:10.1016/j.renene.2020.01.073
Al-Azawii, M. M. S., Jacobsen, D., Bueno, P., and Anderson, R. (2020). Experimental Study of Thermal Behavior during Charging in a Thermal Energy Storage Packed Bed Using Radial Pipe Injection. Appl. Therm. Eng. 180, 115804. doi:10.1016/j.applthermaleng.2020.115804
Alva, G., Lin, Y., and Fang, G. (2018). An Overview of Thermal Energy Storage Systems. Energy 144, 341–378. doi:10.1016/j.energy.2017.12.037
Alva, G., Liu, L., Huang, X., and Fang, G. (2017). Thermal Energy Storage Materials and Systems for Solar Energy Applications. Renew. Sust. Energ. Rev. 68, 693–706. doi:10.1016/j.rser.2016.10.021
Chen, X., Li, X., Xia, X., Sun, C., and Liu, R. (2019). Thermal Performance of a PCM-Based Thermal Energy Storage with Metal Foam Enhancement. Energies 12, 3275. doi:10.3390/en12173275
Dai, R., Mostaghimi, J., Li, N., Deng, T., Wang, Q., and Zeng, M. (2020). Charging Time and Energy Storage Rate Analysis of Fin Effect inside the Horizontal Tube for Thermal Energy Storage. J. Clean. Prod. 273, 123030. doi:10.1016/j.jclepro.2020.123030
Enescu, D., Chicco, G., Porumb, R., and Seritan, G. (2020). Thermal Energy Storage for Grid Applications: Current Status and Emerging Trends. Energies 13 (2), 340. doi:10.3390/en13020340
Feng, P. H., Zhao, B. C., and Wang, R. Z. (2020). Thermophysical Heat Storage for Cooling, Heating, and Power Generation: A Review. Appl. Therm. Eng. 166, 114728. doi:10.1016/j.applthermaleng.2019.114728
Gadd, H., and Werner, S. (2015). “Thermal Energy Storage Systems for District Heating and Cooling,” in Advances in Thermal Energy Storage Systems: Methods and Applications. 1st ed. Editor F. L. Cabeza (Sweden: Woodhead Publishing Series in Energy: Halmstad University), Chapter 18, 467–478. doi:10.1533/9781782420965.4.467
Ghalambaz, M., Mehryan, S. A. M., Veisimoradi, A., Mahdavi, M., Zahmatkesh, I., Kazemi, Z., et al. (2021). Melting Process of the Nano-Enhanced Phase Change Material (NePCM) in an Optimized Design of Shell and Tube Thermal Energy Storage (TES): Taguchi Optimization Approach. Appl. Therm. Eng. 14, 116945. doi:10.1016/j.applthermaleng.2021.116945
Grirate, H., Zari, N., Elamrani, I., Couturier, R., Elmchaouri, A., Belcadi, S., et al. (2014). Characterization of Several Moroccan Rocks Used as Filler Material for Thermal Energy Storage in CSP Power Plants. Energ. Proced. 49, 810–819. doi:10.1016/j.egypro.2014.03.088
Guelpa, E., and Verda, V. (2019). Thermal Energy Storage in District Heating and Cooling Systems: A Review. Appl. Energ. 252, 113474. doi:10.1016/j.apenergy.2019.113474
Guruprasad, A., Lingkun, L., Xiang, H., and Guiyin, F. (2017). Thermal Energy Storage Materials and Systems for Solar Energy Applications. Renew. Sust. Energ. Rev. 68, 693–706.
Jemmal, Y., Zari, N., and Maaroufi, M. (2016). Thermophysical and Chemical Analysis of Gneiss Rock as Low Cost Candidate Material for Thermal Energy Storage in Concentrated Solar Power Plants. Solar Energ. Mater. Solar Cell 157, 377–382. doi:10.1016/j.solmat.2016.06.002
Li, C., Zhang, B., and Liu, Q. (2020). N-eicosane/expanded Graphite as Composite Phase Change Materials for Electro-Driven Thermal Energy Storage. J. Energ. Storage 29, 101339. doi:10.1016/j.est.2020.101339
Lizana, J., Chacartegui, R., Barrios-Padura, A., and Ortiz, C. (2018). Advanced Low-Carbon Energy Measures Based on Thermal Energy Storage in Buildings: A Review. Renew. Sust. Energ. Rev. 82, 3705–3749. doi:10.1016/j.rser.2017.10.093
Lizana, J., Chacartegui, R., Barrios-Padura, A., and Valverde, J. M. (2017). Advances in Thermal Energy Storage Materials and Their Applications towards Zero Energy Buildings: A Critical Review. Appl. Energ. 203, 219–239. doi:10.1016/j.apenergy.2017.06.008
Mhiri, H., Jemni, A., and Sammouda, H. (2020). Numerical and Experimental Investigations of Melting Process of Composite Material (nanoPCM/carbon Foam) Used for Thermal Energy Storage. J. Energ. Storage 29, 101167. doi:10.1016/j.est.2019.101167
Mohan, G., Venkataraman, M. B., and Coventry, J. (2019). Sensible Energy Storage Options for Concentrating Solar Power Plants Operating above 600 °C. Renew. Sust. Energ. Rev. 107, 319–337. doi:10.1016/j.rser.2019.01.062
Parhizi, M., and Jain, A. (2019). The Impact of Thermal Properties on Performance of Phase Change Based Energy Storage Systems. Appl. Therm. Eng. 162, 114154. doi:10.1016/j.applthermaleng.2019.114154
Pielichowska, K., and Pielichowski, K. (2014). Phase Change Materials for Thermal Energy Storage. Prog. Mater. Sci. 65, 67–123. doi:10.1016/j.pmatsci.2014.03.005
Pradeep, N., Paramasivam, K., Rajesh, T., Purusothamanan, V. S., and Iyahraja, S. (2020). Silver Nanoparticles for Enhanced Thermal Energy Storage of Phase Change Materials. Mater. Today Proc. 13, 49. doi:10.1016/j.matpr.2020.02.671
Qureshi, Z. A., Al-Omari, S. A. B., Elnajjar, E., Al-Ketan, O., and Al-Rub, R. A. (2021). Using Triply Periodic Minimal Surfaces (TPMS)-based Metal Foams Structures as Skeleton for Metal-Foam-PCM Composites for Thermal Energy Storage and Energy Management Applications. Int. Commun. Heat Mass Transfer 124, 105265. doi:10.1016/j.icheatmasstransfer.2021.105265
Tay, N. H. S., Belusko, M., Liu, M., and Bruno, F. (2015). Investigation of the Effect of Dynamic Melting in a Tube-In-Tank PCM System Using a CFD Model. Appl. Energ. 137, 738–747. doi:10.1016/j.apenergy.2014.06.060
Wen, R., Liu, Y., Yang, C., Zhu, X., Huang, Z., Zhang, X., et al. (2021). Enhanced Thermal Properties of Stearic Acid/carbonized Maize Straw Composite Phase Change Material for Thermal Energy Storage in Buildings. J. Energ. Storage 36, 102420. doi:10.1016/j.est.2021.102420
Xu, B., Li, P., Chan, C., and Tumilowicz, E. (2015). General Volume Sizing Strategy for Thermal Storage System Using Phase Change Material for Concentrated Solar Thermal Power Plant. Appl. Energ. 140, 256–268. doi:10.1016/j.applthermaleng.2019.114154
Zhang, H., Baeyens, J., Cáceres, G., Degrève, J., and Lv, Y. (2016). Thermal Energy Storage: Recent Developments and Practical Aspects. Prog. Energ. Combustion Sci. 53, 1–40. doi:10.1016/j.pecs.2015.10.003
Zhou, Q., Du, D., Lu, C., He, Q., and Liu, W. (2019). A Review of Thermal Energy Storage in Compressed Air Energy Storage System. Energy 188, 115993. doi:10.1016/j.energy.2019.115993
Zhou, Y., Li, C., Wu, H., and Guo, S. (2020). Construction of Hybrid Graphene Oxide/graphene Nanoplates Shell in Paraffin Microencapsulated Phase Change Materials to Improve Thermal Conductivity for Thermal Energy Storage. Colloids Surf. A: Physicochemical Eng. Aspects 597, 124780. doi:10.1016/j.colsurfa.2020.124780
Keywords: thermal properties, Energy storage (ES), phase change material, PCM, COMSOL, numerical modeling
Citation: Torres Sevilla L and Radulovic J (2021) Effectiveness of Thermal Properties in Thermal Energy Storage Modeling. Front. Mech. Eng 7:690793. doi: 10.3389/fmech.2021.690793
Received: 04 April 2021; Accepted: 30 April 2021;
Published: 17 May 2021.
Edited by:
Ali Sohani, K. N. Toosi University of Technology, IranReviewed by:
Seyedeh FarzanehMousavi Motlagh, University of Tehran, IranMohammad Hassan Shahverdian, K. N. Toosi University of Technology, Iran
Saman Samiezadeh, Iran University of Science and Technology, Iran
Mohammad Hossein Moradi, Karlsruhe Institute of Technology (KIT), Germany
Copyright © 2021 Torres Sevilla and Radulovic. This is an open-access article distributed under the terms of the Creative Commons Attribution License (CC BY). The use, distribution or reproduction in other forums is permitted, provided the original author(s) and the copyright owner(s) are credited and that the original publication in this journal is cited, in accordance with accepted academic practice. No use, distribution or reproduction is permitted which does not comply with these terms.
*Correspondence: Jovana Radulovic, jovana.radulovic@port.ac.uk