Lunar plume-surface interactions using rarefiedMultiphaseFoam
 Z. Cao
 C. White
 M. B. Agir
 K. Kontis
- 1James Watt School of Engineering, University of Glasgow, Glasgow, United Kingdom
- 2PeriDynamics Research Centre, Department of Naval Architecture, Ocean and Marine Engineering, University of Strathclyde, Glasgow, United Kingdom
Understanding plume-surface interactions is essential to the design of lander modules and potential bases on bodies such as the Moon, as it is important to predict erosion patterns on the surface and the transport of the displaced regolith material. Experimentally, it is difficult to replicate the extra-terrestrial conditions (e.g. the effects of reduced gravity). Existing numerical tools have limited accessibility and different levels of sophistication in the modelling of regolith entrainment and subsequent transport. In this work, a fully transient open source code for solving rarefied multiphase flows, rarefiedMultiphaseFoam, is updated with models to account for solid-solid interactions and applied to rocket exhaust plume-lunar regolith interactions. Two different models to account for the solid-solid collisions are considered; at relatively low volume fractions, a stochastic collision model, and at higher volume fractions the higher fidelity multiphase particle-in-cell (MPPIC) method. Both methods are applied to a scaled down version of the Apollo era lunar module descent engine and comparisons are drawn between the transient simulation results. It is found that the transient effects are important for the gas phase, with the shock structure and stand-off height changing as the regolith is eroded by the plume. Both models predict cratering at early times and similar dispersion characteristics as the viscous erosion becomes dominant. In general, the erosion processes are slower with the multiphase particle-in-cell method because it accounts for more physical effects, such as enduring contacts and a maximum packing limit. It is found that even if the initial volume fraction is low, the stochastic collision method can become unreliable as the plume impinges on the surface and compresses the regolith particles, invalidating the method’s assumption of only binary collisions. Additionally, it is shown that the breakdown of the locally free-molecular flow assumption that is used to calculate the drag and heat transfer on the solid particles has a strong influence on the temperatures that the solid particles obtain.
1 Introduction
The plume from reverse-thrusters or the main-thruster of a landing module can present various risks to the lander itself. The plume surface interaction (PSI) can be characterised through various mechanisms, such as cratering of the regolith, erosion, and ejecta dynamics Korzun et al. (2022). During the erosion and ejecta processes, the rocket exhaust plume will fluidise granules on the lunar surface, and the entrained particles can interact with the landing module, changing its stability characteristics.
It was reported by the Apollo astronauts that the entrained dust deteriorated the view from optical windows, and reduced the efficiency of solar panels and thermal protection systems. In addition, the regolith material has been found to attach to surfaces, forming a dust coating layer on thermal radiators, space suits, and astronauts, which interfered with their normal operation Immer et al. (2011). Understanding PSI physics therefore has an important role to play in protecting the landing module itself and facilities around the landing site Immer et al. (2011).
The rocket plume on the Moon or asteroids with a near-vacuum environment will experience multiple flow regimes: inside the thruster and near the thruster exit, the gas is continuum. The supersonic plume expands rapidly in the radial and axial directions as it exits the nozzle, and the flow will enter the slip, transition, and finally free-molecular Knudsen number regimes Bird and Brady (1994). If there is significant compression near the surface, the flow may re-enter the transition, slip, and continuum regimes.
Although most plumes from a descent engine on both Mars and the Moon are underexpanded, the atmospheric difference between the Moon and Mars causes a significant change in the plume structure Mehta et al. (2013), i.e. the flow is significantly more under-expanded in the lunar situation. As a result, the evolution of dust erosion is influenced by variations in the plume structure. The plume may be deflected when the landing module approaches the ground, and this deflected plume impingement on the landing module’s components may raise loads and heat fluxes Rahimi et al. (2020).
Data, including videos recorded during actual missions and lab experiments (Immer et al., 2011; Roberts, 1963; Land and Clark, 1965; Guleria and Patil, 2020; Kuhns et al., 2021), has been extensively used to understand PSI behaviour, but it is easily influenced by the thrust level, nozzle height, angle of the nozzle, the period of firing, and soil physical properties (Scott and Ko, 1968. Metzger et al., 2009) have concluded that the plume impingement will move regolith particles owing to a combination of any four mechanisms: viscous erosion, diffused gas eruption, bearing capacity failure, and diffusion-driven shearing. It has been found that viscous erosion is the most important mechanism during the period of landing Metzger et al. (2011).
Guleria and Patil (2020) found craters in five different forms, including saucer, parabolic, parabolic with an intermediate region, U, and conical slants with a curved bottom. Their experiments proved that the particle size and distribution have a significant impact on the crater shape, dimensions, and the formation mechanism, but this experiment is done intrusively with the nozzle close to a transparent splitter plate to allow observation of the crater formation.
The stereophotogrammetry technique has also been used to circumvent the intrusiveness of the splitter plate and record the three-dimensional time-resolved and stereo geometrical information of the crater formation process Stubbs et al. (2021). However, these experiments were conducted under the ambient Earth atmosphere rather than in a vacuum chamber. In the Physics Focused Ground Test campaign at NASA Korzun et al. (2022), a series of scaled ground tests have been conducted to provide benchmarking PSI data in a low-pressure environment. In their experimental design, a splitter plate with a 38° leading edge was implemented to bisect the plume and allow for the observation of two-dimensional soil erosion.
Metzger (2016) reported a series of experiments for scaling of the dust particle erosion rate in lunar and Martian conditions. He presented a figure of the crater formed under the conditions of the lunar and Martian rocket plume impingement. The size of the crater formed in rarefied conditions was larger than that under ambient Earth atmospheric conditions, and neither an intermediate region nor a rim Guleria and Patil (2020) was found in this crater. Metzger (2016) recognised that the surface erosion rate according to experiments in the continuum flow regime resulted in an under-estimation in the transition flow regime and implied that the Knudsen number exacerbated the complexity of the plume erosion physics.
The difficulty of obtaining an adequate similitude of a planetary environment and nozzle characteristics, including gas species, pressure, temperature, gravity, nozzle Reynolds numbers, etc., in a laboratory experiment remains a formidable obstacle. Attempts have been made by conducting experiments in a chamber falling from a tower Kuhns et al. (2021) to replicate the extraterrestrial environment, but the experiments were limited by the size of the chamber. Hence, there is a definite need for numerical techniques to simulate this complicated phenomenon, and several such methods can be found in the literature.
The Eulerian-Eulerian framework and the Eulerian-Lagrangian framework are the most common methods for simulating gas-solid two-phase flows, such as PSI, in conventional computational fluid dynamics (CFD). Rahimi et al. (2020) used the Navier-Stokes equations to solve the gas flow and introduced the Roberts erosion model to calculate the mass flow rate of the lunar dust fluidised by the plume and presented the near-field two-phase flow results. Since this technique represents the lunar surface as an inlet boundary condition for the solid phase, the process of cratering formation cannot be observed. Shallcross (2021) considered both phases to be continuum and extended the Euler-Lagrangian method to compressible flows. This new method was validated through a simulation of PSI on Mars.
However, extreme environments, such as the vacuum on the Moon and asteroids in space, do not allow the gas phase to be treated as a continuum. The direct simulation Monte Carlo (DSMC) method is a standard method to provide numerical solutions of rarefied gas flows, particularly at higher Knudsen numbers. Hence, the Lagrangian-Lagrangian method is also common in simulations of gas-solid flows in rarefied gas environments.
Gallis et al. (2001) proposed a one-way coupling interphase model based on the DSMC framework for calculating the momentum and heat transfer from a monatomic gas to the solid phase in each computational cell; this method has been the basis for simulations of rarefied gas-solid flows in the Lagrangian-Lagrangian framework. Gallis’ approach was extended to include the effect of the solid phase on the gas phase by Burt and Boyd (2004) and this was called the direct two-way coupling model.
The indirect two-way coupling method proposed by Gimelshein et al. (2004) improved the efficiency of the work of He et al. (2011), where a two-phase rocket plume and a regolith layer was simulated. In He et al. (2011), the total number of regolith simulator particles was initially around 8,000, therefore solid-solid interactions were handled using a neighboring-cell contact detection scheme and a hard sphere model He et al. (2012). It was found that the solid particles increase the pressure and temperature of the gas phase in the vicinity of the nozzle axis. Morris et al. (2015) treated the granular collisions as inelastic based on a stochastic method and the generalised no time counter method for the selection of collision pairs in a cell because the granular volume fraction was assumed to be negligible; only binary solid-solid collisions were considered. In addition, the regolith layer is not modelled, instead the boundary below the nozzle exit injected solid particles into the domain using an erosion model. The solver proposed in Morris et al. (2015) was applied to simulate a multiphase flow field caused by single- and four-engine rockets in Morris et al. (2016).
The Lagrangian-Lagrangian approach is not restricted to works based on the framework developed by Gallis et al. (2001). Liu et al. (2010) proposed a method to simulate PSI using a macroscopic one-way coupling method (i.e. only considering the effect of the gas phase on solid particles), but unlike the work of He et al. (2012) and Morris et al. (2015), a pure DSMC simulation was carried out first to acquire a steady state gas field and then an overlay method was used to conduct one-way interphase coupling and the subsequent solid particle trajectories. Li et al. (2019) proposed a macroscopic two-way coupling method and compared it with the microscopic method proposed by Burt and Boyd (2004). They showed that the particle velocities acquired through the microscopic method were slower than those from the macroscopic one. Chinnappan et al. (2021) developed codes based on the framework of DSMC and simulated lunar dust dispersion due to the rocket plume with the same nozzle as in Morris et al. (2015) at different hovering altitudes. Similar to the work of Liu et al. (2010), the ejection of solid particles according to an erosion flux based on the dynamic pressure above the lunar surface was conducted after acquiring the gas phase steady state using the DSMC method. The solid phase evolution based on steady gas flow field is not realistic because the gas flow field is influenced by the granular flow and vice versa.
In addition, simplified solid-solid interactions (i.e. only binary collisions) and models (i.e. the regolith layer replaced by a boundary condition) (Rahimi et al., 2020; Morris et al., 2015; Li et al., 2019; Chinnappan et al., 2021; Geng et al., 2014; Liu et al., 2010) cause unnatural accumulations and unrealistic movements in the regolith layer due to the lack of considerations of close-packing limits and enduring contacts and collisions. If the lunar regolith layer on the ground is viewed as a surface using an erosion model, the cratering and the transient changes in the gas flow field caused by cratering are unable to be observed. At the same time, the number of regolith particles introduced into the computational domain by to the erosion model is unbounded. The number of regolith particles introduced is related to the surface shear stress and the thrust of the nozzle, which is finite and should decrease with time as the dust layer is eroded. However, mass conservation is not considered in the existing erosion models, leading to an overestimation of the amount of solid particles entrained by the plume when the simulation is run for a long time to reach a steady granular flow. In addition, the aforementioned codes and software are in-house and commercial codes with limited accessibility to the public.
The current work provides a description of a new method for solving multiphase flows with a rarefied gas phase. It includes the effects of the close-packing limit and enduring contacts and collisions between solid particles. In previous work Cao et al. (2022), the current authors developed an open source solver for solving one and two-way coupled rarefied multiphase flows, rarefiedMultiphaseFoam, within the framework of OpenFOAM. The main objectives of the current work are to extend the rarefiedMultiphaseFoam solver through the addition of a stochastic collision model and the multiphase particle-in-cell (MPPIC) method Andrews and O’Rourke (1996) for dealing with solid-solid interactions, and to conduct PSI simulations with these two different solid-solid collision models under the same gas phase conditions.
2 Numerical methods
RarefiedMultiphaseFoam Cao et al. (2022) is a newly-developed open source code for providing solutions of rarefied two-phase flow problems. It is based on dsmcFoamPlusWhite et al. (2018). In this solver, the DSMC method is fully responsible for the gas phase, with the momentum and energy exchange between the two phases calculated through an interphase coupling model.
The validation and development of the rarefiedMultiphaseFoam solver and a description of the dsmcFoamPlus solver can be found in Refs. Cao et al. (2022) and White et al. (2018), respectively. In our previous work Cao et al. (2022), solid-solid interactions were not accounted for, but in the case of PSI, volume fraction can become large on the surface and solid-solid interactions should be accounted for.
According to Figure 2.6 of Crowe et al. (2011), solid-solid interactions can be ignored when the solid phase volume fraction, or solid particle number density, is sufficiently low. When the granular flow enters the dense flow regime, the solid particle phase becomes collision-dominated. As the solid phase volume fraction continuously grows, collision-dominated flow will transfer to contact-dominated flow due to the enhancement of enduring contacts Crowe et al. (2011).
In this work, we present two methods intended to be used at different solid particle number densities: the stochastic collision method for a dilute solid phase, and the MPPIC method for a dense solid phase. A brief description of the two methods will be presented in the following sections.
2.1 Stochastic collision model
The stochastic collision method is a method for dealing with solid-solid collisions via randomly selecting collision pairs in a computational cell. Stochastic collision methods are commonly used in Lagrangian simulations Schmidt and Rutland (2000). Compared with more deterministic methods (such as the event-driven molecular dynamics Bannerman et al. (2011)), the advantage of the stochastic method is the computational time-saving in searching for collision pairs Zhang et al. (2015) and removing the need for a variable time-step and the so-called “neighbour list” Bannerman et al. (2011) for each particle to determine the next collision event that will occur. A representative method is the O’Rourke method O’Rourke (1981), which has been a standard method in some commercial codes Schmidt and Rutland (2000) and has been used in modelling spray dryers Mezhericher et al. (2012), however, the O’Rourke method suffers from an unthorough collision kernel, unconvincing collision determination, and an unlimited time step Zhang et al. (2015). Based on the O’Rourke method, the no time counter (NTC) method Schmidt and Rutland (2000) and the “Collision Zhang&Bo” method Zhang et al. (2015) were derived to improve the accuracy and efficiency. The generalised NTC method was used in Morris et al. (2015) to simulate lunar regolith dispersion caused by PSI.
After the determination of collision pairs, collisions are performed to calculate the post-collision velocities using either the hard sphere model or the soft sphere model Crowe et al. (2011). The soft sphere model is also known as the discrete element method, and it is based on the modelling of mechanical elements, e.g. a spring and a dash-pot. The computational expense of the soft sphere model is much higher than that of the hard sphere model because the collisions and contacts are solved by integrating the equations of motion Crowe et al. (2011). Hence, we only consider the hard sphere model in this work for simplicity. The post-collision velocities are given explicitly in the hard sphere model, but only binary collisions are considered Crowe et al. (2011) because the solid particle number density is assumed to be small.
2.1.1 Collision detection scheme
The NTC method is that in each cell, the number of inter-particle (ip) collision pairs that should be selected and tested for collision, Nip, is
where Wp is the number of real solid particles that each simulator represents, Np is the instantaneous number of simulator particles in the cell,
where Rf is a random fraction between [0,1]. If they are accepted for collision, momentum will be exchanged between the two simulators particles through a hard sphere collision model.
2.1.2 Hard sphere model
The hard sphere model has been widely implemented in the simulation of rocket plume and lunar dust interactions He et al. (2012); Morris et al. (2015); Zheng et al. (2015). It expresses the relationship between the post-collision velocity and the coefficients of restitution and friction. It has been pointed out in Crowe et al. (2011) that solid-solid sliding is also an important process influencing particle movements. In the current work, we do not take solid-solid sliding into account, leaving it for future work.
For simplicity, the granular hard sphere model used in Morris et al. (2015) is implemented here and the post-collision velocity of particles p and q is updated through
where
In the previous equations, m is individual particle mass,
2.2 The multiphase particle-in-cell (MPPIC) method
The MPPIC method was pioneered by Andrews and O’Rourke (1996) for efficiently dealing with the interactions of a dense solid phase (i.e. high solid particle number density) in simulations of multiphase flows, e.g. fluidised beds. Similar to the DSMC method, the solid phase in the MPPIC method is expressed in the Lagrangian framework, and each solid simulator particle represents a large number of real solid particles that have the same location, size, density, and velocity. The method circumvents the numerically expensive particle collision detection schemes when modelling solid-solid collisions.
The solid phase transport equation of the solid particle probability distribution function fp, without the consideration of the collision term, is
where the terms on the left hand side are the variation of number of the distribution function with time, convection in the physical space, and external body forces in the velocity space, respectively Snider (2001). Generally, the total acceleration
in the MPPIC method, where θp is the local volume fraction of the solid phase, ρp is the solid particle mass density, ∇p is the gas phase pressure gradient,
A packing model is not sufficient to describe solid-solid interactions because the packing model, including the particle stress model, only prevents particles from entering cells when the particle volume fraction tends to the close-packing value and it does not describe the effect of solid-solid collisions. It has been pointed out that the particle velocity distribution gradually tends to an isotropic, Gaussian distribution through solid-solid collisions and that the high-frequency collisions in dense granular flow increase particle stresses O’Rourke et al. (2009). Therefore, damping and return-to-isotropy models are also included. The details of the derivations of the models can be found in Refs. O’Rourke and Snider (2010) and O’Rourke and Snider (2012) and they will not be repeated here. The models for the damping term and the return-to-isotropy have previously been implemented in OpenFOAM.
We take advantage of rarefiedMultiphaseFoam and the MPPIC method both being implemented within OpenFOAM and combine these two methods together. The gas-phase evolution is controlled by the DSMC method, and the MPPIC method is fully responsible for the solid-solid interactions when a high solid number density is considered.
The accelerations due to the gas phase, incorporating the drag and buoyancy forces, are updated through the interphase coupling model. The MPPIC method is reproduced in the source code of rarefiedMultiphaseFoam and has been extended to simulate axisymmetric geometries through the addition of radial weighting factors. The latest flow chart of rarefiedMultiphaseFoam is shown in Figure 1.
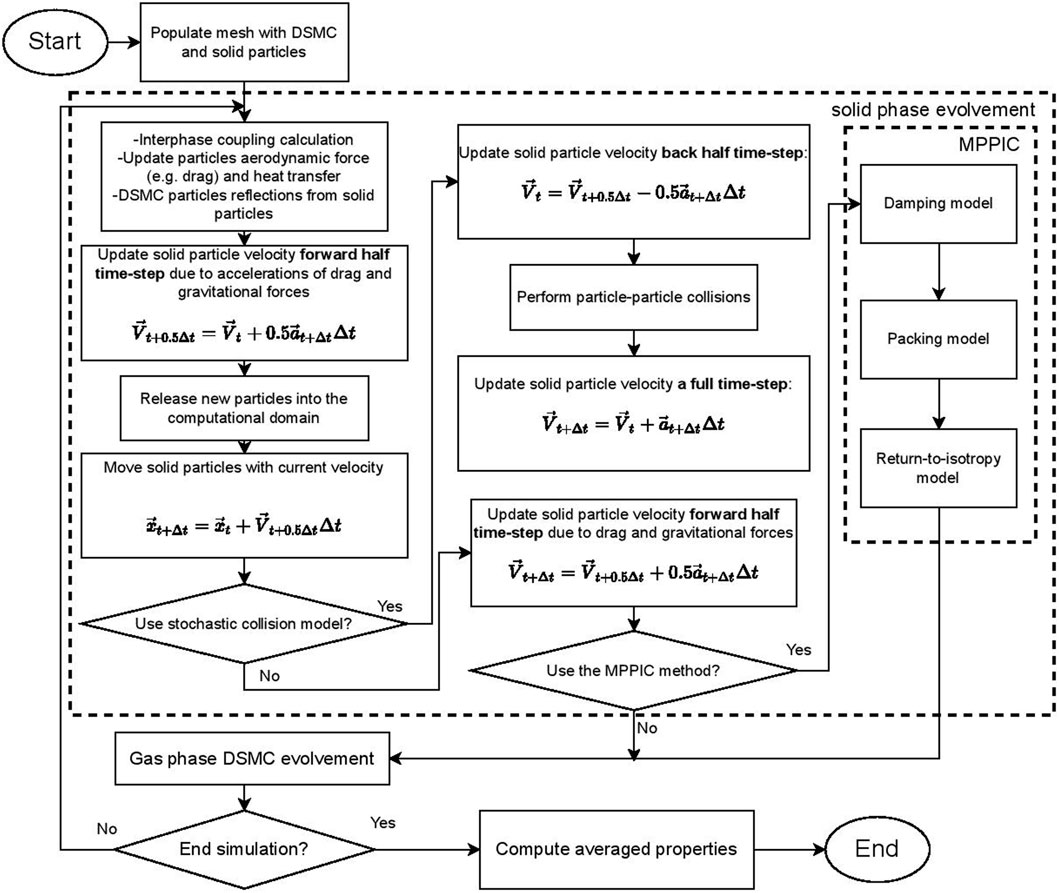
FIGURE 1. Solver flow chart.
3 Validation of the multiphase particle-in-cell method
The MPPIC method is responsible for solid-solid interactions, including enduring and transient contacts. Before any application, a gravity-controlled sedimentation case, proposed by Snider Snider (2001), is repeated under vacuum conditions (i.e. there is no gas phase) in order for the focus to be on the MPPIC implementation within rarefiedMultiphaseFoam.
The domain is a hexahedron with dimensions of 0.138 × 0.138 × 0.3 m and is composed of 9,000 cells (15 × 15 × 40). The six surfaces are all considered to have diffuse wall boundary conditions. The solid particle material density is 2,500 kg/m3 and their diameter is 0.3 mm. The number of simulator particles in the domain is 162,232, with each representing 749 real solid particles. The gravitational acceleration is 9.8 m/s2 and the time-step is 0.001 s. The solid particles are initially stationary and distributed evenly throughout the domain. As the simulation begins, the particles will sediment towards the bottom of the domain through the action of gravity. The dual averaging method and the extended Harris and Crighton particle stress model Harris and Crighton (1994); Snider (2001) are used. The particle stress in Eq. 7 is calculated through Eq. 8 according to the Harris and Crighton particle stress model,
where Ps is a constant in the range of 5–200 with units of pressure Snider et al. (1997), β is suggested to be a constant between two and five by Auzerais et al. (1988), θcp is the value of close-packing volume fraction of the solid particles, and ɛ is 1 × 10⁻⁷. Here Ps and β are 10 Pa and 2, respectively according to Snider et al. (1997). The close packing volume fraction θcp is 0.6.
The particle distribution is shown in Figure 2. Near the beginning (t = 0.01 s), particles are initialised uniformly in the domain with a volume fraction of 0.3. As the solid particles begin to settle, the volume fraction at the top decreases to zero, while that at the bottom tends to close-packing value. Eventually, when all the particles have settled, there is a clear cut off at half the height of the domain where no solid particles remain above.
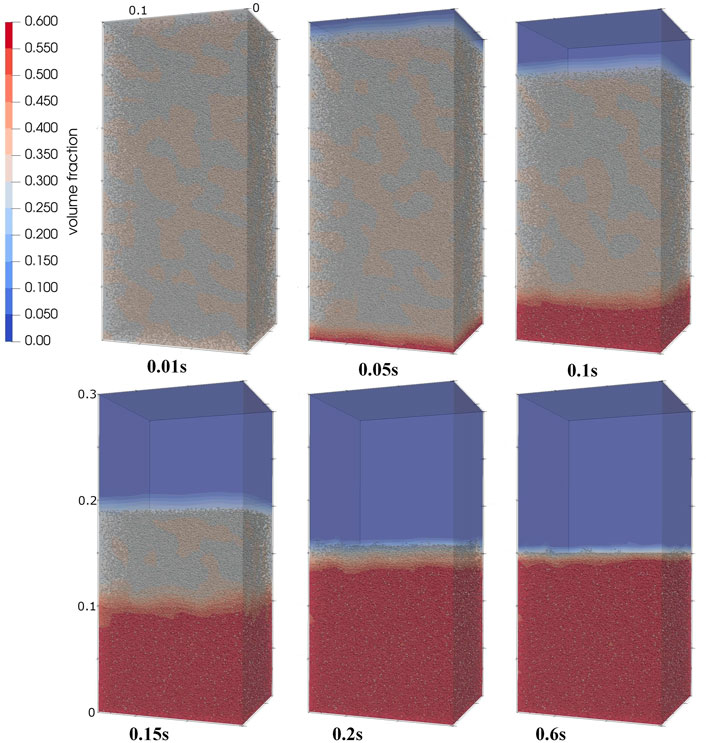
FIGURE 2. Contours of solid phase volume fractions with time during the process of sedimentation.
The volume fractions with time are compared quantitatively in Figure 3. In the z-direction, the domain is discretized into 40 layers and the volume fraction values in Figure 3 are averaged ones in the x − and y − directions at each layer to reduce the statistical noise. At t = 0.1 s, 0.2 s and 0.6 s, the volume fractions agree well with those from Snider (2001). If the statistical noise is neglected, the reason for the discrepancy at t = 0.15 s is likely to be caused by the drag force and the coefficient restitution. Firstly, because of the absence of gas in our test, there is no drag force acting on the solid particles. Particles sediment faster than those decelerated by the drag forces, resulting in a higher volume fraction between 0.08 m and 0.125 m and a smaller volume fraction between 0.19 m and 0.21 m.
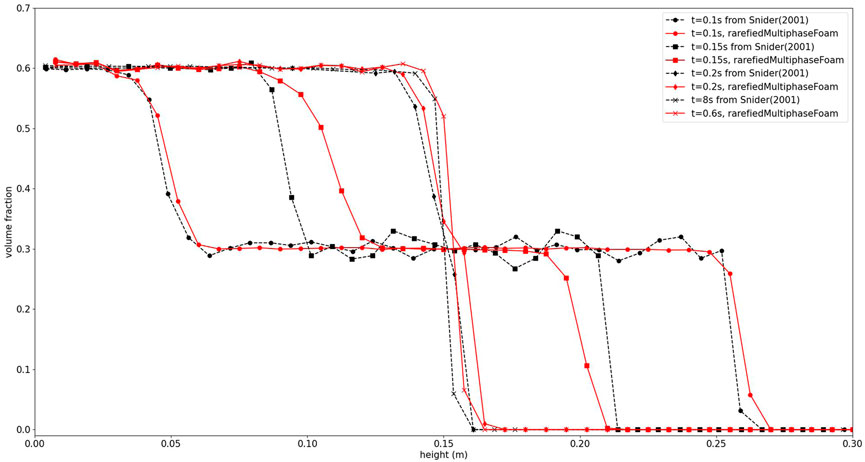
FIGURE 3. Solid phase volume fraction with time. Comparison between the result from Snider (2001) and that from rarefiedMultiphaseFoam. Figure updated.
Secondly, there are a small amount of particles that bounce back from the top sedimentation layer at 0.2 s in Figure 7 of Snider (2001) and at 0.15 s in Figure 2, but the volume fraction distribution close to the top of the sedimentation layer in the two figures is slightly different. This might be caused by a difference in the coefficient of restitution used in the validation case. The coefficient of restitution in our test is 0.85, but the coefficient of restitution is not given in Snider (2001). A comparison of the effects of the coefficient of restitution is shown in Figure 4. Except for the difference in the coefficient of restitution, the rest of the conditions are the same. A higher coefficient of restitution means less kinetic energy loss during collisions. It is obvious that the particles with a higher coefficient of restitution bounce back higher than those with a small coefficient, indicating the importance of the coefficient of restitution.
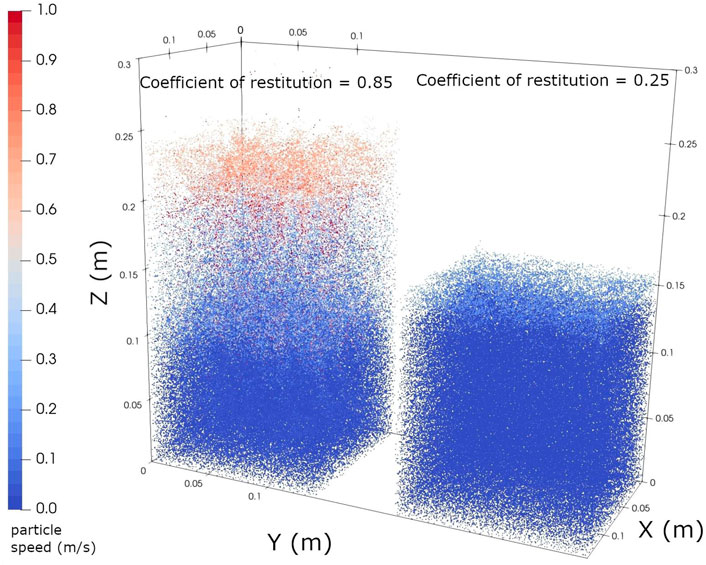
FIGURE 4. Comparison of the particle distribution with different coefficient of restitution at 0.2s.
4 Plume-surface interaction simulation
The main thruster will fire before the landing module touches the ground to allow for a safe landing on the Moon. At the very moment before the reverse thruster begins to fire, the module can be considered to be hung above the lunar surface. Since the flow field inside the nozzle is not considered in this work, a nozzle exit surface is used to replace the whole nozzle. When the nozzle begins to fire, the high-speed gas flow impinges on the ground and interacts with the lunar surface and the regolith particles resting on the surface. With the help of the stochastic collision and MPPIC methods, the regolith layer can be modelled as a collection of particles resting on a solid surface, from which regolith particles are entrained in the gas flow and ejected into the domain, resulting in a cratering and dispersal process. The simulations were conducted on the regional high performance computing machine ARCHIE-WeSt, using 40 cores per task and each simulation required 2 weeks of wall time.
In Figure 8B of Morris et al. (2015), the Apollo era lunar descent engine is simulated. The nozzle radius was 0.81 m and the standoff height of the nozzle was 2 m. In the current work, we scale down the nozzle exit radius and stand-off height by a factor of 100 to reduce the computational expense. This has the effect of increasing the Knudsen number and reducing the Reynolds number of the problem. The nozzle stagnation temperature and pressure are maintained at the same as in the previous work, and the inflow profiles for velocity, density, and temperature are also simply scaled down. The dimensions of the axisymmetric computational geometry are shown in Figure 5. The time-step is 2.5 × 10⁻⁹ s. The boundary condition at the bottom of the computational domain was a specular wall in He et al. (2012), but here, a simple diffuse wall boundary condition with a coefficient of restitution in the normal direction is applied.

FIGURE 5. Computational domain for the plume-surface interaction study.
Like previous simulations of plume-surface interactions with the larger nozzle, water vapour is used as working gas in this simulation, with molecular mass and diameter of 2.99 × 10⁻²⁶ kg and 4.5 × 10⁻¹⁰ m, respectively. Both the rotational degrees of freedom and the number of vibrational modes are 3. The exponent of the viscosity-temperature power law for the variable hard sphere collision model is 0.75. The vibrational modes are modelled with a harmonic oscillator model, with characteristic vibrational temperatures for bend, symmetric stretch, and asymmetric stretch modes are 2294 K, 5261 K and 5432 K, respectively. The number density, temperature, and velocity distributions are non-uniform and have been extracted from the distribution profiles at the nozzle exit in Figure 5 of Morris et al. (2015) (and scaled down to fit the smaller nozzle exit radius in the current work).
In the DSMC method, the no time counter method is implemented for collision partner selection of the DSMC particles, and the variable hard sphere model with the Larsen-Borgnakke energy redistribution model is used to conduct collisions. For the solid phase, the interphase coupling model with the indirect two-way coupling scheme is used in this work to calculate the momentum and energy exchange between the gas phase and the solid phase.
In terms of the regolith material, we assume it to be unconsolidated and the solid particle diameter is set to 2.8 × 10⁻⁷ m to try and ensure the particle local free-molecular assumption Gallis et al. (2001). The material density is 3,100 kg/m3. The specific heat capacity and the surface thermal accommodation coefficient are 2180 J/kgK and 0.89, respectively. The regolith is intialised in the ‘dust layer’ indicated in Figure 5 and is initially assumed to be stationary with a temperature of 200 K. Lunar regolith particles contain multiple types of metallic elements and the coefficient of restitution is related to material, direction of impact, and coefficient of friction Willert (2020), which is not the focus of this work. For simplicity, we assume a loss of 15% momentum of dust particles through collisions and that the coefficient of restitution is 0.85.
4.1 Case I: Stochastic particle collision model
The details of the mesh are shown in Table 1. The radius of the domain is 45 mm. The dust number density is 2.175 × 10¹⁶ m−3, corresponding to a volume fraction of 0.0025% (i.e. the dilute granular flow regime) and each simulator particle represents 25 real solid particles. Gravitational acceleration is implemented in the domain outside of the ‘dust layer’, i.e. above x = 0 in Figure 5. The no time counter method and the hard sphere model are used in this simulation. The number of solid simulator particles is around 100,000. The simulation end time is set at 0.375 m, and there are around 13.7 million DSMC simulator particles in the domain. Due to the solid particles moving through the domain and the two-way coupled nature of the simulation, the DSMC does not reach a ‘steady-state’ and both phases are fully transient.
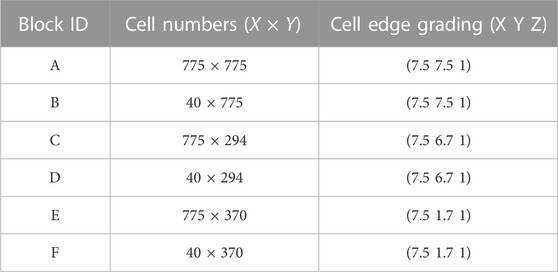
TABLE 1. Mesh detail with stochastic collision model.
4.2 Case II: Multiphase particle-in-cell method
The details of the mesh are shown in Table 2. The radius in the case with the MPPIC method is increased to 65 mm. It is pointed out that the best estimation of the bulk density of the lunar regolith is 1,500 kg/m3Carrier et al. (1991), which leads to the close-packing state in each cell, and it would therefore take a relatively long time (in comparison to the time step) to allow the plume to entrain the regolith particles, leading to a prohibitively expensive computational cost for the current work. Therefore, we use a regolith number density of 2.175 × 10¹⁸ m−3, corresponding to a volume fraction of 2.5% and the bulk density of approximately 77.5 kg/m3 (i.e. the collision-dominated granular flow regime). Each solid simulator represents 376 real solid particles, for a total of around one million solid simulators in the ‘dust layer’ initially. It has been found that the maximum volume fraction of a container filled by perfect same-size spheres is approximately 0.64 Torquato et al. (2000), but in this test case, we set the close-packing volume fraction as 0.62.

TABLE 2. Mesh detail with the MPPIC method.
It is known that Ps must be large enough to avoid exceeding the close packing volume fraction in dynamic calculations Snider et al. (1997). If Ps is small, a cell having a volume fraction value greater than the close-packing value will take longer to balance to the close-packing value, meanwhile an extremely small value will lead to failure of expelling particles from the cell whose volume fraction exceeds the close-packing value. Increasing the exponent β can effectively limit particle dispersion in low volume fraction regions Snider et al. (1997). However, the choice of Ps and β is empirical and no reports of the effects of the choices of Ps and β in PSI simulations can be found. Hence, Ps and β for the Harris and Crighton model are set to be typical values to allow for a stable result; Ps and β are taken as 50 Pa and 3, respectively. The averaging method used in the MPPIC method is the dual method. Explicit packing, damping, and return-to-isotropy models are used. The damping time and the return-to-isotropy time expressed in Equations (45) in O’Rourke and Snider (2010) and (19) in O’Rourke and Snider (2012) are considered. There are approximately 16.7 million DSMC particles at the final time-step. Similar to the stochastic simulation, the case is entirely transient and there is no ‘steady-state’ for either the gas or solid phases.
5 Results and discussions
Figures 6,7 show the two-phase flow evolution for both cases. The gas flows are initially decelerated by a strong normal shock wave above the layer of solid particles. The normal shock wave moves towards the nozzle exit initially and then reverses direction and stops at a position of around X = 10 mm. The somewhat unusual shock wave shape has also been found by previous authors Morris et al. (2015) and is due to the nozzle exit conditions and the stand-off height. The regolith layer evolution can be divided into two stages: cratering and dispersal. It is clear that a boundary layer with a thickness of around 0.001 m has formed above the regolith layer when the MPPIC method is used, see Figure 7 at t = 7.5 × 10⁻⁶ s and Figure 8, while this boundary layer is not found with the stochastic method, Figure 6, indicating that the top surface of the regolith layer acts like a diffuse wall in the MPPIC case. The boundary layer gradually thickens in Figure 8 as the radial distance increases because of the decrease of the pressure in the radial direction. At 3.75 × 10⁻⁴ s, the solid particles in the vicinity of Y = 15 mm in the stochastic collision case have been transported towards and away from the axis, but there is still a full layer of solid particles at 5 × 10⁻⁴ s in the MPPIC case. The cratering process with the MPPIC method is slower than that with the stochastic collision method. A detailed discussion of the evolution of the solid particle phase will be presented later.
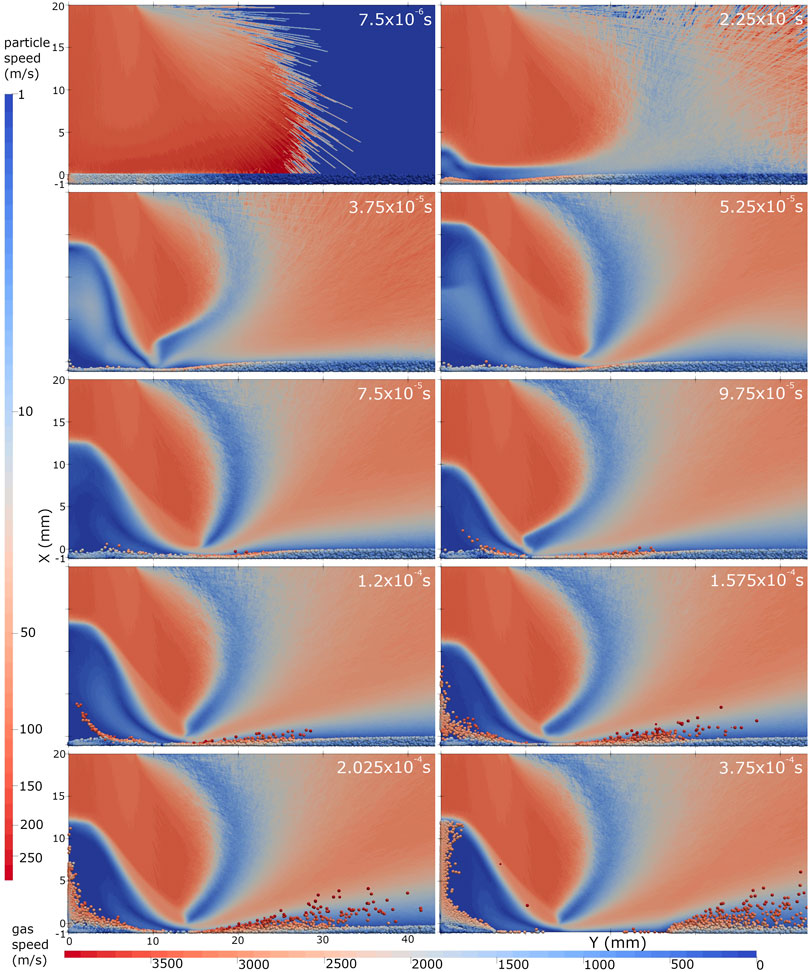
FIGURE 6. Overview of the two-phase flow evolution with the stochastic method.
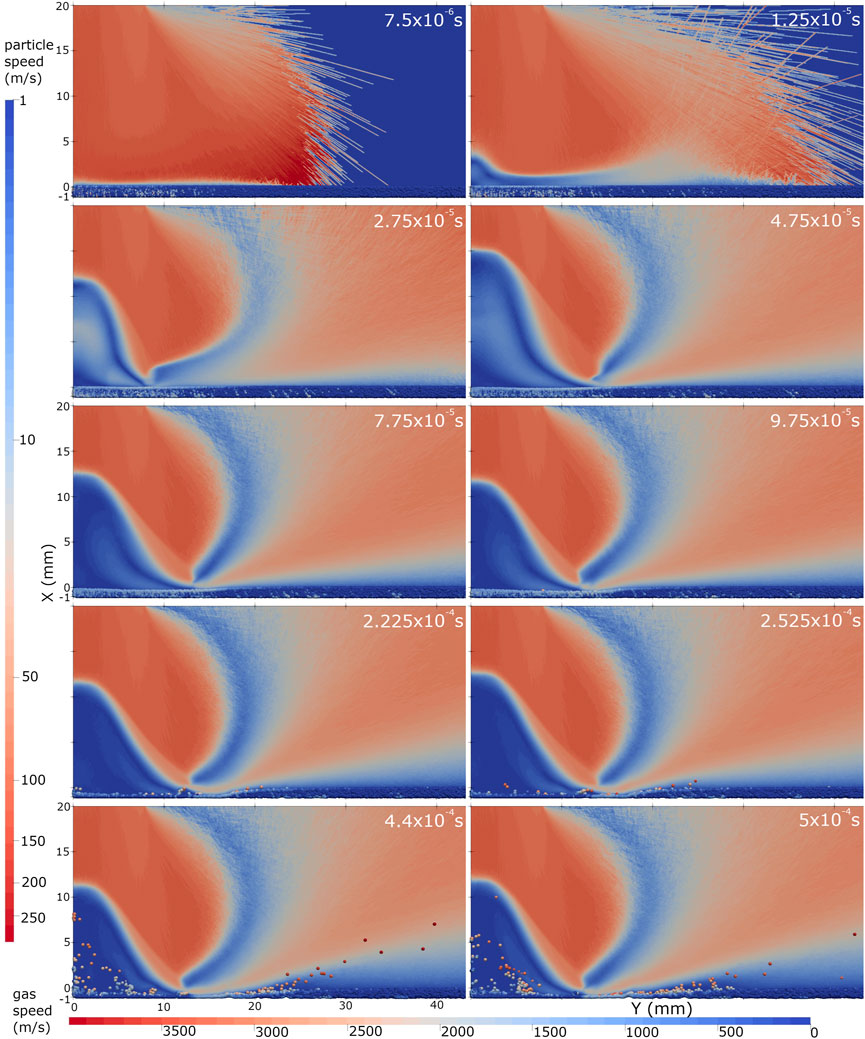
FIGURE 7. Overview of the two-phase flow evolution with the MPPIC method.
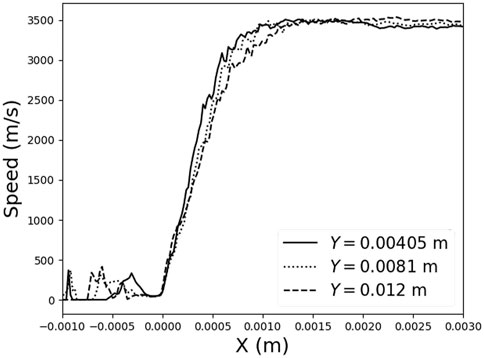
FIGURE 8. Boundary layer thickness at t = 7.5 × 10⁻⁶ s of Case II.
5.1 Gas flow field
Figure 9 presents the comparison of the gas velocity field between the stochastic collision and MPPIC methods. The basic structure, including the normal shock wave, oblique shock wave and the vortex below the nozzle exit, are similar to, but not identical with that shown in Figure 8B in Morris et al. (2015), likely because the nozzle has been scaled down by a factor of 100 in the current work, increasing the Knudsen number and decreasing the Reynolds number. The high-speed flow from the nozzle is blocked by the lunar surface and decelerated over a short distance. This deceleration and increase in the gas pressure is processed by the strong normal shock wave. At the same time, the pressure balance between the region close to the stagnation point with high pressure and the region off the nozzle axis is processed by a relatively weak oblique shock wave Morris et al. (2015). This oblique shock wave connects with the curved shock at Y = 14 mm. Although the initial environment is vacuum, a vortex can still form because pressure is sufficiently high to exceed the critical Knudsen number controlling the formation of a vortex Cao et al. (2021). Due to the volume fraction being small in the stochastic collision model case, the gas flow passes through the lunar regolith and impinges on the lunar surface. For the MPPIC case, which simulates a higher volume fraction, the top layer of the regolith acts as a diffuse surface for the gas flow, which then diffuses through the porous medium relatively slowly. At the same time, the regolith layer will start to become eroded through the actions of pressure and shear stress. This fundamental phenomenon is shown in Figure 10.
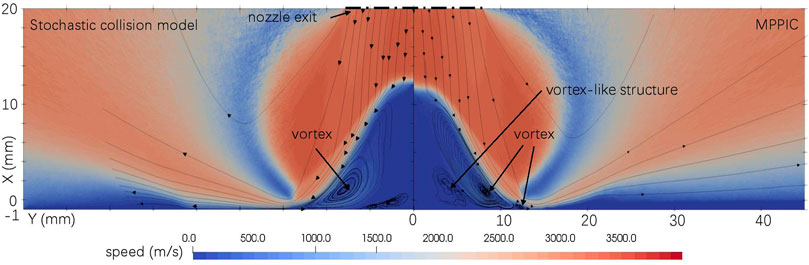
FIGURE 9. Comparison of gas velocity field between the stochastic collision model and MPPIC at t = 0.375 m.

FIGURE 10. Gas velocity field at various times for the MPPIC case.
It is obvious that the structure of the reflected flow close to the regolith layer towards the far field changes with time. As the dust layer is eroded by the plume, the ejection angle, marked by the dashed lines in Figure 10, increases. The wall vortex downstream of the normal shock wave in Figure 9 is distorted, because of the formation and changes in the shape of the crater, and a secondary vortex occurs at 0.5 m due to the entrained solid particles. It should be noted that there is a vortex-like structure in the downstream of the normal shock wave in both cases, as shown in Figure 9. Since the MPPIC case has more solid simulator particles and the interphase coupling models in both cases are the same, the formation of this structure may be caused by the entrained solid particles. In addition, the height and size difference of the vortex-like structure in both cases might be the result of different solid particle distributions in space. The gas pressure at the joint of the oblique and the curved shock (around Y = 14 mm), corresponding to the deepest erosion of the dust layer, increases with the MPPIC method, according to Figure 11. Figure 12 presents a comparison of the gas temperature field of both cases. The temperature distribution at the curved shock is similar, but the distributions at the normal and oblique shock waves and their downstream fields are distorted by the solid particles. In particular, along the axis, the normal shock wave thickness seems to be compressed by the solid particles at X = 12 mm in the stochastic collision model case.
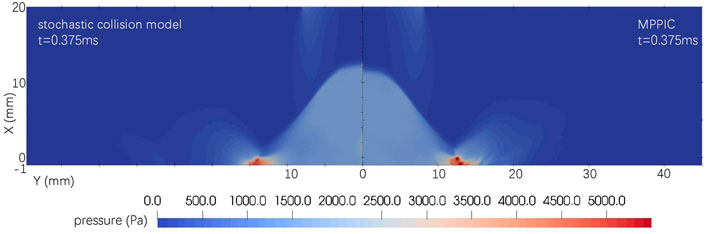
FIGURE 11. Comparison of gas pressure field between the stochastic collision model and MPPIC at t = 0.375 m.
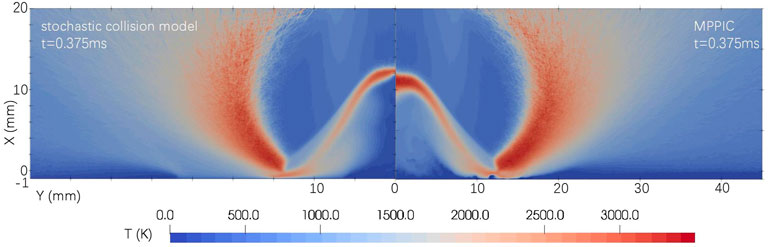
FIGURE 12. Comparison of gas overall temperature field between the stochastic collision model and MPPIC at t = 0.375 m.
The reason why the height of the normal shock wave is different in the two cases is due to the different behaviour of the solid phase. First, the gas field in Figures 11, 12 will not reach a steady state unless the solid phase stops evolving. The MPPIC case has more solid particles than the stochastic collision case, and the solid particle velocities with MPPIC increase more slowly because of the consideration of multiple collisions and contacts. The time spent to reach a pseudo-steady state for the gas phase increases because of the increase of entrained solid particles. Secondly, as the crater becomes deeper, the stagnation point in the MPPIC case also moves downwards, which has a significant impact on the gas flow evolution, especially the change of the height of the normal shock wave, as can be seen in Figures 6, 7. The solver in this work has the advantage of being fully transient for both the gas and solid phases, allowing for thorough capture of the interaction details.
Figure 13 presents the gas pressure, temperature, and velocity distributions along the symmetry axis for the MPPIC case. According to the distribution of the gas pressure and axial velocity components, it can be seen that the normal shock wave moves to a lower position at 0.45 m and then moves back to its initial position at 0.5 m. The movement of the normal shock wave can also be found in the pressure and temperature distribution of Figure 14. Furthermore, the pressure and temperature distribution downstream of the normal shock wave have been distorted because of the existence of the solid particles while the main shape of the radial velocity along the axis does not change much.
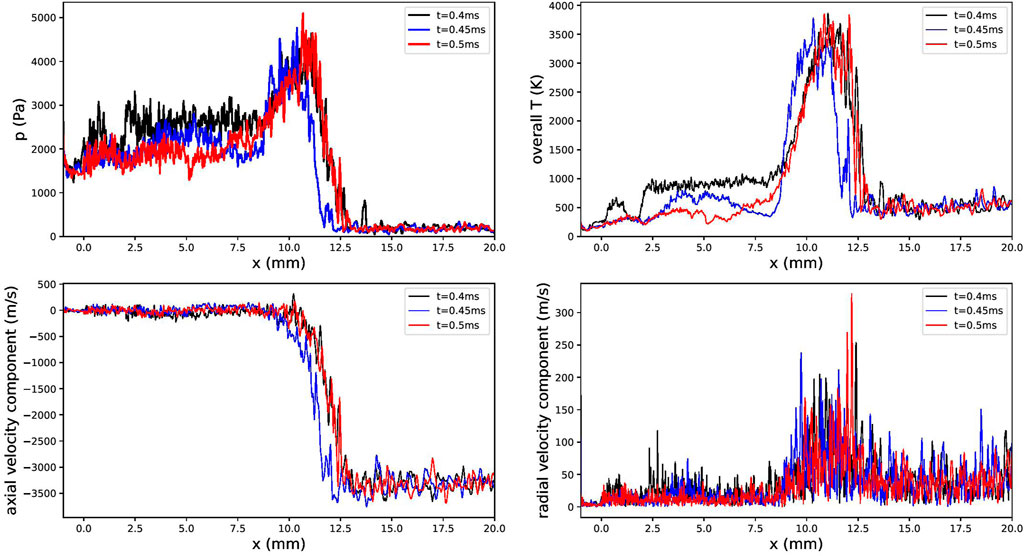
FIGURE 13. Physical properties along the symmetry axis for the MPPIC case.
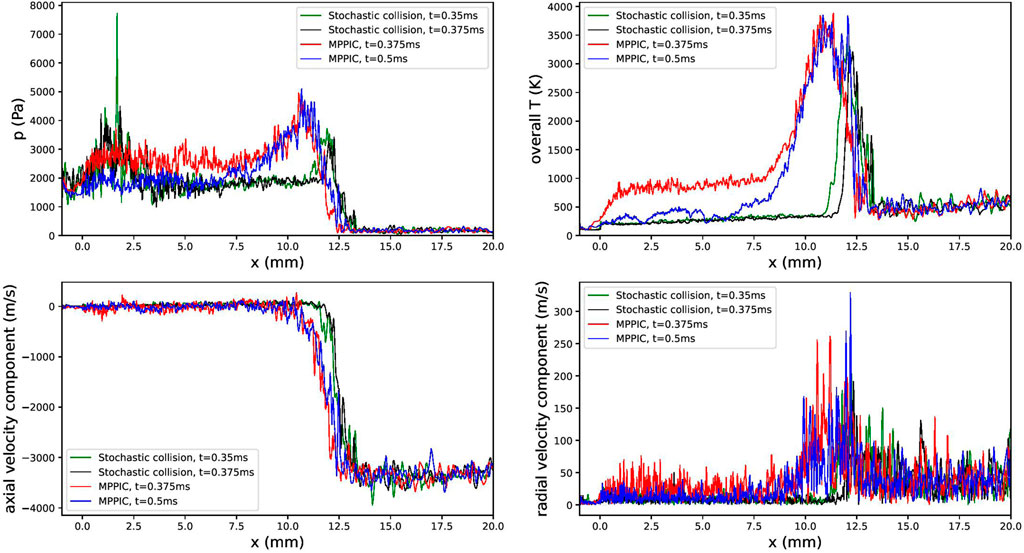
FIGURE 14. Comparison of physical properties along the symmetry axis for the MPPIC and stochastic collision model cases.
It must be pointed out that the influence of the gas flow field due to cratering and dispersal of the regolith layer will certainly change the surface properties of the top of the regolith layer, particularly the surface shear stress. This implies that a method using an erosion model and a simple plane surface representing the lunar surface to simulate the plume-surface interactions is not ideal.
5.2 Regolith layer evolution
The evolution of the regolith layer in the early stages of the gas impingement is shown in Figures 15, 16 as plots of the solid particle speeds with time, for the stochastic collision model and the MPPIC model, respectively. In both cases, the cratering process can be clearly observed, but it is a faster process with the stochastic method. Without consideration of the close packing limit, the regolith layer in the stochastic collision model is compressed and penetrated by the gas flow relatively quickly, which is not realistic because it is not possible for dust particles to sediment with a low solid volume fraction in reality. Since the solid volume fraction in the stochastic collision model is dilute and only binary collisions are considered, particles respond faster to the gas phase than with the MPPIC method. At 0.05 m, the solid particles in the stochastic collision method are already about to be dispersed by the flow, whereas the regolith layer in the MPPIC case is still in the early stages of cratering. The delay of cratering and smaller velocity of solid particles with the MPPIC method implies that the regolith layer impedes the spread of the gas through the pores and that enduring and transient contacts within the solid phase limit the movement of solid particles, which is more realistic. It can be concluded that the MPPIC method is more appropriate for PSI simulations.
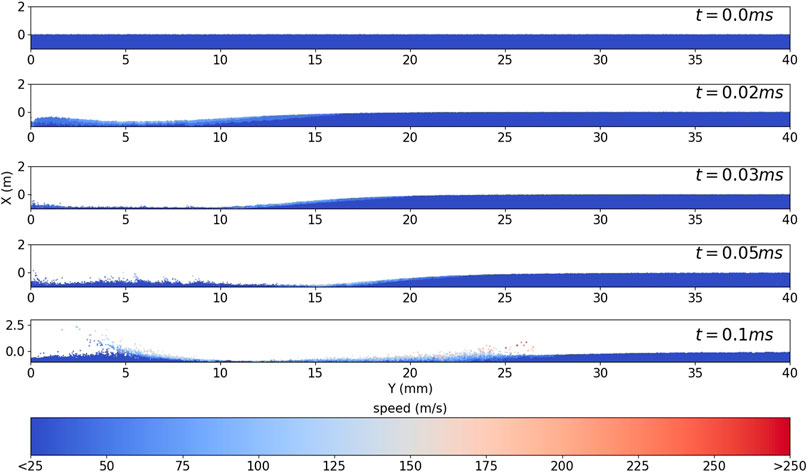
FIGURE 15. Regolith layer evolution with the stochastic model: cratering.
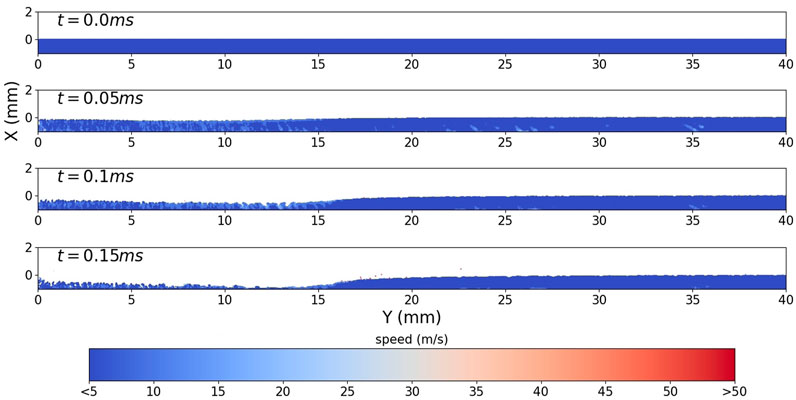
FIGURE 16. Regolith layer evolution with the MPPIC method: cratering.
After the initial cratering process, solid particles begin to be dispersed from the regolith layer through two different processes. Considering first the stochastic model in Figure 17, at t = 0.2 m and 0.28 m, a large number of particles are lifted by the vortex that is generated below the shock wave and gather near the symmetry axis, then move upwards towards the strong normal shock wave. However, the normal shock wave limits the height that the particles can reach. Subsequently, particles move off the axis along the oblique shock wave, as shown at t = 0.375 m. Meanwhile, at larger axial distances (Y = 15 mm), solid particles are entrained in the gas flow and ejected upwards and radially outwards. The mass ejected from the regolith layer is relatively high in this case, such that there are very few solid particles left between radial distances of Y = 5 mm and Y = 25 mm at t = 0.375 m.
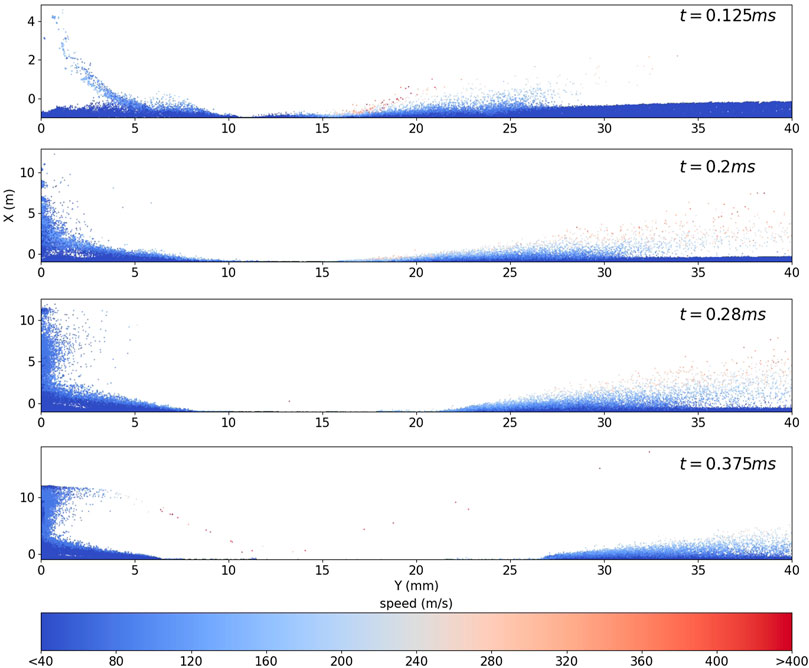
FIGURE 17. Regolith layer evolution with the stochastic model: dispersion.
Similar dispersion phenomena can also be found in Figure 18 with the MPPIC method, where the dispersion generally takes a similar form but happens over a longer time scale with the MPPIC method and distinct structures and an uneven regolith layer surface can be observed in the solid phase. The distribution of solid particles between Y = 5 mm and Y = 10 mm is influenced by the vortex, and the vortex is distorted by the solid particle distribution, as shown in Figure 10, where a secondary vortex was also observed in the gas phase at later times. It can be noted that some solid particles are lifted between Y = 11 mm and Y = 15 mm and form wave-like structures in Figure 18 by this secondary vortex; similar structures can be observed in sand surfaces scoured by the wind in the desert, such as Figures 26(b) and 26(f) in Kok et al. (2012). The top surface of the regolith layer becomes uneven as time progresses because of the scouring of the gas flow in the radial direction, which is also known as wind-blown sand transport. Ejected particles from the dust layer are accelerated to 50–100 m/s before moving to the far field. Wind-blown sand transport has been widely studied under atmospheric conditions (Jin et al., 2021; Kamath et al., 2022) rather than in rarefied conditions. The interparticle calculation models used, such as the Kamath model Kamath et al. (2022), are not directly applicable to lunar plume-surface interactions due to the lack of the consideration of the rarefaction and Reynolds number effects, which would result in inaccuracies in the calculation of the drag force on regolith particles and the subsequent particle trajectories. Hence, the Reynolds number and the Knudsen number effects should be added into the Kamath model Kamath et al. (2022) using corrected drag coefficient or adding another coefficient into the drag force calculation. In addition, to be more accurate, the Kamath model Kamath et al. (2022) can be extended to account for electrostatic forces caused by charging during interparticle contacts. In addition, an appropriate interphase coupling method (i.e. a method for calculating the momentum and heat transfer between gas and solid particles) should be added because the gas flow and the solid particles are influencing each other during the interactions. Additionally, the atmospheric boundary layer profiles used in Kamath model are likely to take a different shape under rarefied flow conditions.Figure 19 shows the solid phase volume fraction distribution for the MPPIC case at three different times. As expected, the volume fraction increases at t = 0.1 m at the top of the regolith layer due to the plume exerting a downwards force on the solid particles. Considering Y = 13 mm to be the location to calculate the fraction of solid particles that move towards or away from the symmetry axis, 6.35% of particles move towards the axis in the stochastic case, but this value is only 3.62% when the MPPIC method is used. This is because more types of solid-solid interactions are modelled with MPPIC, so that particles are not as easily lifted off the surface. Particle over packing, i.e. the particle volume fraction exceeding the close-packing volume, does occur in the MPPIC case. The maximum volume fraction in the domain is around 0.75 at 0.02 m and it decreases to approximately 0.66 at 0.5 m. This phenomenon is caused by the use of the damping model and it has previously been mentioned in Caliskan and Miskovic (2021). The damping model is suggested to be used in the closely-packed region Caliskan and Miskovic (2021), but no detailed information of the effect of combinations of the MPPIC submodels on the results of PSI can be found. Hence, further study of the influence of the MPPIC method on PSI simulations is necessary.
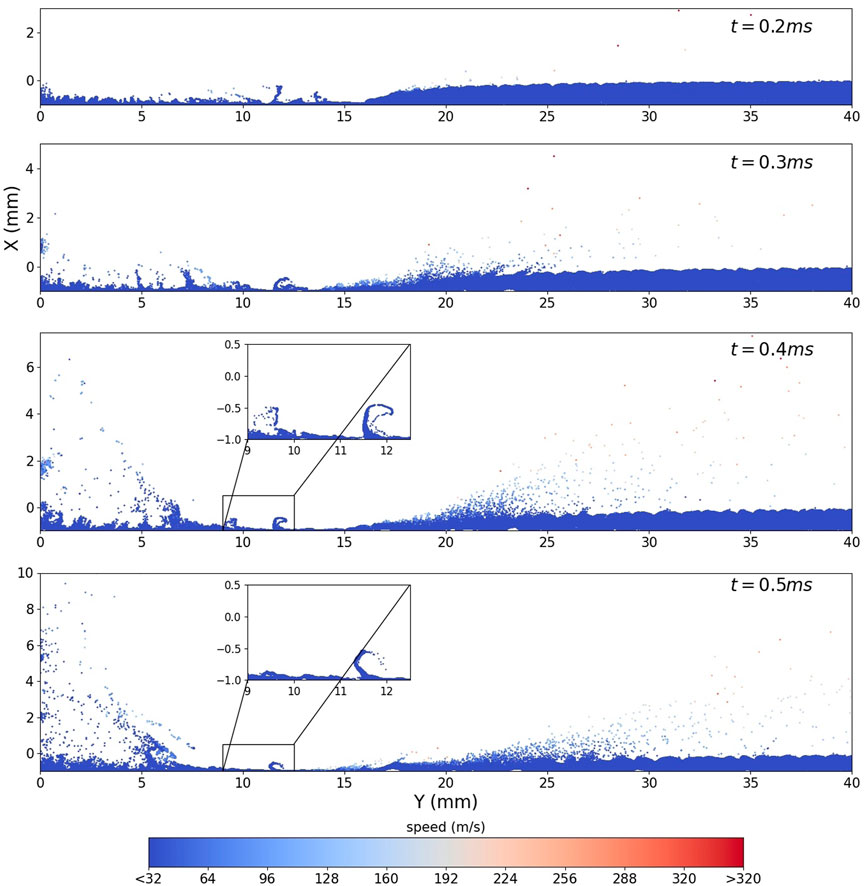
FIGURE 18. Regolith layer evolution with the MPPIC method: dispersion.
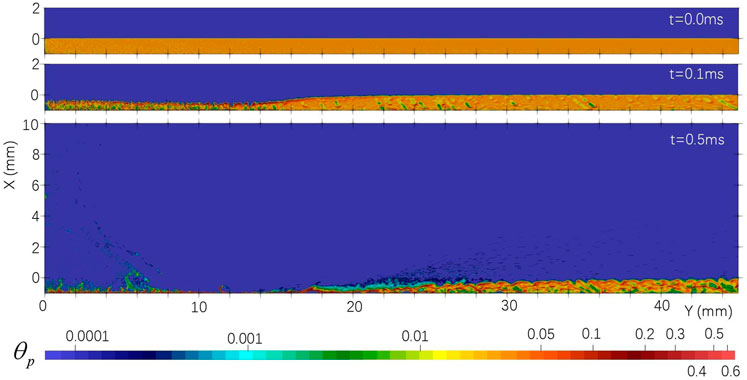
FIGURE 19. Solid phase volume fraction in the MPPIC case.
Figure 20 shows contours of the solid particle based local Knudsen number, Knp, at different time intervals, using the MPPIC method. The Knudsen here is defined as the ratio of the local gas mean free λ and the solid particle diameter Dp. It should be noted that the calculation of the momentum and heat transfer between the phases is based on a locally free-molecular assumption, which requires that Knp be greater than 10. However, this assumption does not hold in the vortex region, at the top of the regolith layer, and near the stagnation region. The range of invalidity generally increases with physical time as the shock wave forms and gas diffuses through the regolith layer. Particularly at the location of the greatest pressure (between Y = 10 mm and Y = 15 mm, see Figure 11) between t = 0.3 m and 0.5 m, Knp enters the slip flow regime. The breakdown of the locally free-molecular assumption will cause inaccuracies in the interphase coupling calculation (e.g. the drag coefficients on the solid particles due to the gas phase will be over-estimated). This will introduce errors in the subsequent solid particle paths and behaviour, as is also mentioned in Morris et al. (2012); Figure 21 compares the drag coefficient according to Eq. 7 (free-molecular model) of Bird and Brady (1994) with that based on the improved Loth empirical model equations Loth et al. (2021). It is clear that a decrease in the local particle Knudsen number significantly increases the error. For a Mach number of 0.5, the difference in the drag coefficient between the free-molecular condition and the Loth equation is 13.36% for Knp = 1 and 5.97% for Knp = 3. The particle Knudsen number close to the stagnation region in Figure 20 is in the range of 2–8, so the error is smaller than 10%. However, the particle Knudsen number in the small vortex at Y = 12 mm is smaller than 1, which leads to higher discrepancies. Further extension of the solver is necessary to correct the drag force calculation in the interphase coupling model.The solid particle temperatures at the end of each simulation are shown in Figure 22. The maximum particle temperature with the stochastic method is 1326 K and that with the MPPIC method is 739 K because the dust dispersal process is faster with the stochastic method. The temperature of particles in the regolith layer between Y = 0 mm and Y = 10 mm is in the range of 100–130 K, which is lower than the initial value of 200 K, while particles are heated when they are lifted above the dust layer or blown to the far field. In the MPPIC case, solid particles in the secondary vortex are further cooled between Y = 10 mm and Y = 15 mm. The cooling of the regolith particles is attributed to the inappropriate calculation of the interphase heat transfer (similar to that shown for the drag forces above) and indicates that the interphase heat transfer calculation is more sensitive to the particle Knudsen number than the drag forces. The calculation of the interphase heat transfer requires the local free-molecular condition for the gas phase (Knp > 10) Gallis et al. (2001), but the mean free path at the locations where solid particles are cooled is below this limit, resulting in an inaccurate result of heat transfer between the gas and the solid particles. More evidence for this conclusion can be found in Figures 20, 22, where the regions that solid particles are cooled in both cases coincides with the regions where Knp is in the range of 2–5 (i.e. the transition flow regime).
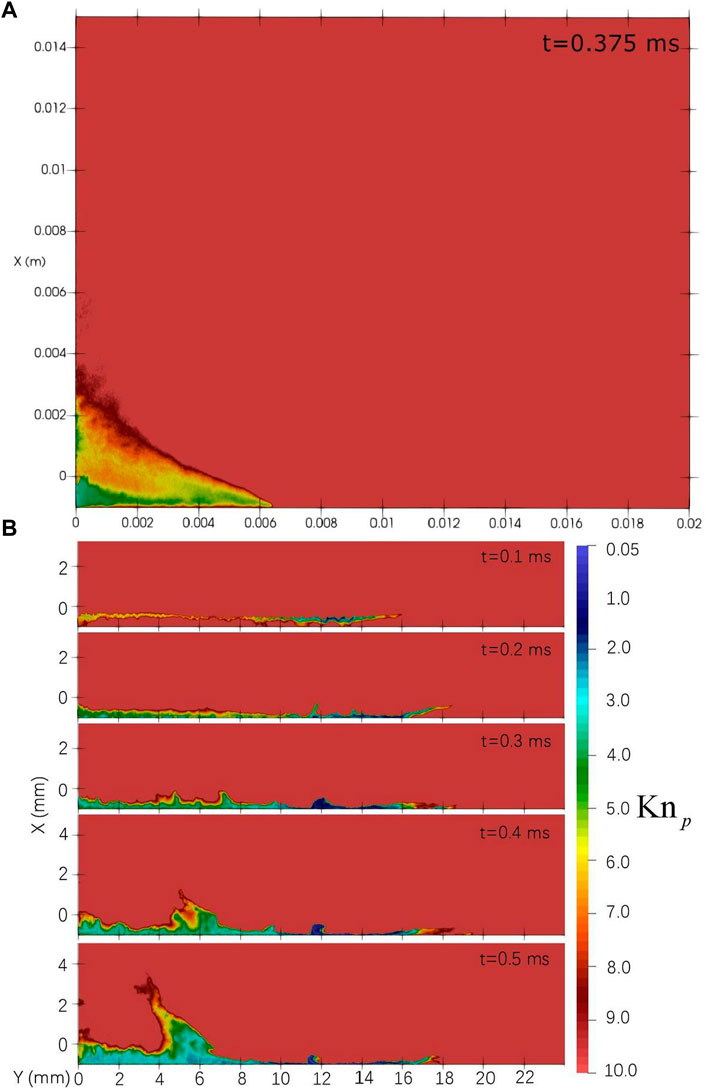
FIGURE 20. Distribution of Knp [(A) Case I, (B) Case II], where Knp is the ratio of the local gas MFP and the solid particle diameter.
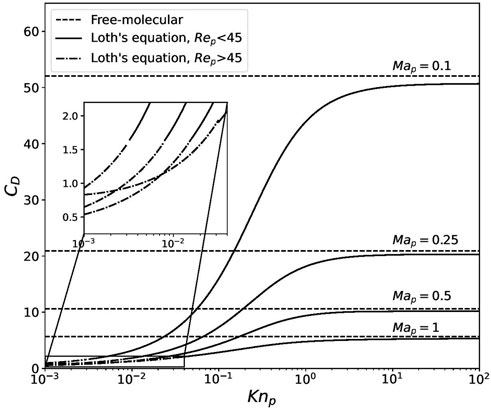
FIGURE 21. Drag coefficient VS particle Knudsen number for Loth’s equations Loth et al. (2021) and the free-molecular model Bird and Brady (1994) in subsonic flow conditions.
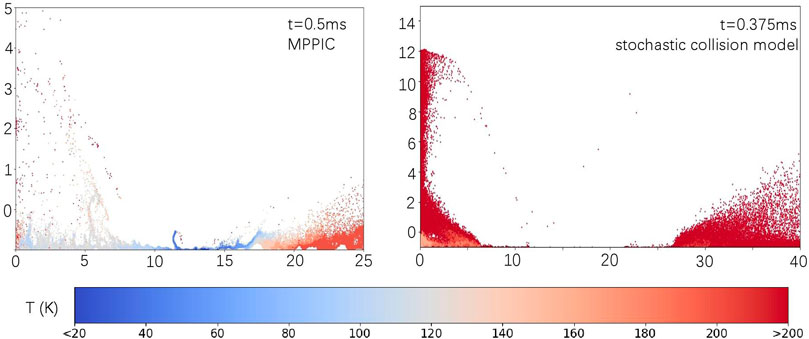
FIGURE 22. Examples of particle temperature distributions using the stochastic collision model (right) and the MPPIC method (left).
6 Conclusion and future work
In this work, the calculation of solid-solid interactions for multiphase simulations is implemented within the framework of rarefiedMultiphaseFoam for two different situations; low volume fraction with the stochastic collision model and higher volume fractions with the MPPIC method. The updated solver is then applied to rocket exhaust plume-lunar regolith interactions. Comparisons between the transient simulation results of a scaled-down version of the lunar module descent engine from the Apollo era using both methods have been made. A key finding is that the transient effects are also important for the gas phase, with the shock structure and stand-off height changing significantly as the regolith layer is eroded by the plume.
Similar regolith cratering and dispersion processes are observed with both methods and the entrained solid particles have a significant impact on the gas flow evolution, including the formation of additional vortices, the movement and the thickness of shock waves, and the reflected flow towards the far field. The MPPIC method is able to provide more realistic results of the regolith layer evolution in PSI simulations because it accounts for important effects such as close-packing limits and enduring contacts. The MPPIC method allows the top of the regolith layer to be closer to a diffuse boundary condition for the gas phase and slows down the regolith layer evolution due to the more complex solid-solid interactions. Even when the initial volume fraction is low, the stochastic collision method becomes unreliable as the regolith layer becomes compressed by the gas as it cannot account for the close-packing limit. It is observed that the calculation of drag forces and heat transfer in the interphase two-way coupling model is sensitive to particle Knudsen number, which introduces significant errors in the solid particle temperatures that are obtained.
Future work can be conducted on studying the solid phase evolution using different particle stress models, such as Lun’s model Lun et al. (1984), and systematic investigation of the influence of combinations of the MPPIC submodels on the PSI simulations. Due to the limitation of the free-molecular assumption on the calculation of the drag forces and heat fluxes to the solid particles, more work can be done on the extension of the code to improve the interphase coupling calculation when the flow enters the transition Knudsen number regime. More PSI simulations on the Moon, asteroids, or even comets Jia et al. (2017); Christou et al. (2018), as well as dwarf planets such as Pluto Telfer et al. (2018), could be considered with the addition of solid particle phase change (i.e. a continuous phase change from the solid phase to the gas phase). A series of lab experiments of PSI in rarefied conditions can be carried out to validate the solver. The electrostatic force caused by charging during contacts can make a finite contribution to the particle trajectories during PSIs. To be more accurate, the influence of electrostatic forces can be realised by adding a new acceleration term on the right hand side of Eq. 7 and the corresponding numerical algorithms with moderate simplifications can be found in Grosshans and Papalexandris (2017); Tan et al. (2019); Grosshans et al. (2021). The electrostatic force can be considered in future work.
Data availability statement
The raw data supporting the conclusion of this article will be made available by the authors, without undue reservation.
Author contributions
ZC: Writing—Original draft preparation, Validation and testing, Data curation, Visualization, Software programming. CW: Data curation, Visualization, Supervision, Writing—Reviewing and Editing, Software programming. MA: Visualization, Writing—Reviewing and Editing. KK: Supervision, Writing—Reviewing and Editing.
Acknowledgments
Results were obtained using the ARCHIE-WeSt High Performance Computer (www.archie-west.ac.uk) based at the University of Strathclyde.
Conflict of interest
The authors declare that the research was conducted in the absence of any commercial or financial relationships that could be construed as a potential conflict of interest.
Publisher’s note
All claims expressed in this article are solely those of the authors and do not necessarily represent those of their affiliated organizations, or those of the publisher, the editors and the reviewers. Any product that may be evaluated in this article, or claim that may be made by its manufacturer, is not guaranteed or endorsed by the publisher.
References
Andrews, M. J., and O’Rourke, P. J. (1996). The multiphase particle-in-cell (MP-PIC) method for dense particulate flows. Int. J. Multiph. Flow 22 (2), 379–402. doi:10.1016/0301-9322(95)00072-0
Auzerais, F., Jackson, R., and Russel, W. (1988). The resolution of shocks and the effects of compressible sediments in transient settling. J. Fluid Mech. 195, 437–462. doi:10.1017/s0022112088002472
Bannerman, M. N., Sargant, R., and Lue, L. (2011). DynamO: a free \calO (N) general event-driven molecular dynamics simulator. J. Comput. Chem. 32 (15), 3329–3338. doi:10.1002/jcc.21915
Bird, G. A., and Brady, J. (1994). Molecular gas dynamics and the direct simulation of gas flows, 42. Oxford: Clarendon Press.
Burt, J., and Boyd, I. (2004). “Development of a two-way coupled model for two phase rarefied flows,” in 42nd AIAA Aerospace Sciences Meeting and Exhibit, Reno, NV, January 5–8, 2004, 1351.
Caliskan, U., and Miskovic, S. (2021). A chimera approach for mp-pic simulations of dense particulate flows using large parcel size relative to the computational cell size. Chem. Eng. J. Adv. 5, 100054. doi:10.1016/j.ceja.2020.100054
Cao, Z., Agir, M., White, C., and Kontis, K. (2022). An open source code for two-phase rarefied flows: rarefiedmultiphasefoam. Comput. Phys. Commun. 276, 108339. doi:10.1016/j.cpc.2022.108339
Cao, Z., White, C., and Kontis, K. (2021). Numerical investigation of rarefied vortex loop formation due to shock wave diffraction with the use of rorticity. Phys. Fluids 33, 067112. doi:10.1063/5.0054289
Carrier, W. D., Olhoeft, G. R., and Mendell, W. (1991). “Physical properties of the lunar surface,” in Lunar sourcebook, 475–594.
Chinnappan, A. K., Kumar, R., and Arghode, V. K. (2021). Modeling of dusty gas flows due to plume impingement on a lunar surface. Phys. Fluids 33, 053307. doi:10.1063/5.0047925
Christou, C., Dadzie, S. K., Thomas, N., Marschall, R., Hartogh, P., Jorda, L., et al. (2018). Gas flow in near surface comet like porous structures: Application to 67P/Churyumov-Gerasimenko. Planet. space Sci. 161, 57–67. doi:10.1016/j.pss.2018.06.009
Crowe, C. T., Schwarzkopf, J. D., Sommerfeld, M., and Tsuji, Y. (2011). Multiphase flows with droplets and particles. Boca Raton, FL: CRC Press.
Gallis, M., Torczynski, J., and Rader, D. (2001). An approach for simulating the transport of spherical particles in a rarefied gas flow via the direct simulation Monte Carlo method. Phys. Fluids 13, 3482–3492. doi:10.1063/1.1409367
Geng, D., Ren, D., Ye, Q., Ma, Y., Zheng, G., and Cui, Y. (2014). A new computational method for the interaction between plume field and soil particles. J. Astron. 35, 884–892.
Gimelshein, S., Alexeenko, A., Wadsworth, D., and Gimelshein, N. (2004). “The influence of particulates on thruster plume/shock layer interaction at high altitudes,” in 43rd AIAA Aerospace Sciences Meeting and Exhibit, Reno, NV, January 10–13, 2005, 766.
Grosshans, H., Bissinger, C., Calero, M., and Papalexandris, M. V. (2021). The effect of electrostatic charges on particle-laden duct flows. J. Fluid Mech. 909, A21. doi:10.1017/jfm.2020.956
Grosshans, H., and Papalexandris, M. V. (2017). On the accuracy of the numerical computation of the electrostatic forces between charged particles. Powder Technol. 322, 185–194. doi:10.1016/j.powtec.2017.09.023
Guleria, S. D., and Patil, D. V. (2020). Experimental investigations of crater formation on granular bed subjected to an air-jet impingement. Phys. Fluids 32, 053309. doi:10.1063/5.0006613
Harris, S., and Crighton, D. (1994). Solitons, solitary waves, and voidage disturbances in gas-fluidized beds. J. Fluid Mech. 266, 243–276. doi:10.1017/s0022112094000996
He, X., He, B., and Cai, G. (2012). Simulation of rocket plume and lunar dust using dsmc method. Acta Astronaut. 70, 100–111. doi:10.1016/j.actaastro.2011.07.014
He, X., He, B., and Cai, G. (2011). Two-phase coupled model for dsmc plume simulation. J. Propuls. Technol. 032 (002), 214–219.
Immer, C., Lane, J., Metzger, P., and Clements, S. (2011). Apollo video photogrammetry estimation of plume impingement effects. Icarus 214, 46–52. doi:10.1016/j.icarus.2011.04.018
Jia, P., Andreotti, B., and Claudin, P. (2017). Giant ripples on comet 67P/Churyumov–Gerasimenko sculpted by sunset thermal wind. Proc. Natl. Acad. Sci. 114, 2509–2514. doi:10.1073/pnas.1612176114
Jin, T., Wang, P., and Zheng, X. (2021). Characterization of wind-blown sand with near-wall motions and turbulence: From grain-scale distributions to sediment transport. J. Geophys. Res. Earth Surf. 126, e2021JF006234. doi:10.1029/2021jf006234
Kamath, S., Shao, Y., and Parteli, E. J. (2022). Scaling laws in Aeolian sand transport under low sand availability. Geophys. Res. Lett. 49 (11), e2022GL097767. doi:10.1029/2022gl097767
Kok, J. F., Parteli, E. J., Michaels, T. I., and Karam, D. B. (2012). The physics of wind-blown sand and dust. Rep. Prog. Phys. 75 (10), 106901. doi:10.1088/0034-4885/75/10/106901
Korzun, A. M., Eberhart, C. J., West, J., Liever, P., Weaver, A., Mantovani, J., et al. (2022). “Design of a subscale, inert gas test for plume-surface interactions in a reduced pressure environment,” in AIAA Scitech 2022 Forum, San Diego, CA & Virtual, January 3–7, 2022. doi:10.2514/6.2022-1808
Kuhns, M., Metzger, P., Dove, A., Byron, J., Lamb, S., Roberson, T., et al. (2021). Deep regolith cratering and plume effects modeling for lunar landing sites. Earth Space 2021, 62–78. doi:10.1061/9780784483374.007
Land, N. S., and Clark, L. V. (1965). Experimental investigation of jet impingement on surfaces of fine particles in a vacuum environment. Washington, DC: National Aeronautics and Space Administration.
Li, Y., Ren, D., Bo, Z., Huang, W., Ye, Q., and Cui, Y. (2019). Gas-particle two-way coupled method for simulating the interaction between a rocket plume and lunar dust. Acta Astronaut. 157, 123–133. doi:10.1016/j.actaastro.2018.12.024
Liu, D., Yang, S., Wang, Z., Liu, H., Cai, C., and Wu, D. (2010). “On rocket plume, lunar crater and lunar dust interactions,” in 48th AIAA Aerospace Sciences Meeting Including the New Horizons Forum and Aerospace Exposition, Orlando, FL, January 4–7, 2010, 1161.
Loth, E., Tyler Daspit, J., Jeong, M., Nagata, T., and Nonomura, T. (2021). Supersonic and hypersonic drag coefficients for a sphere. AIAA J. 59 (8), 3261–3274. doi:10.2514/1.j060153
Lun, C., Savage, S. B., Jeffrey, D., and Chepurniy, N. (1984). Kinetic theories for granular flow: inelastic particles in Couette flow and slightly inelastic particles in a general flowfield. J. Fluid Mech. 140, 223–256. doi:10.1017/s0022112084000586
Mehta, M., Sengupta, A., Renno, N. O., Norman, J. W. V., Huseman, P. G., Gulick, D. S., et al. (2013). Thruster plume surface interactions: Applications for spacecraft landings on planetary bodies. AIAA J. 51 (12), 2800–2818. doi:10.2514/1.j052408
Metzger, P. T., Latta, R. C., Schuler, J. M., and Immer, C. D. (2009). “Craters formed in granular beds by impinging jets of gas,” in AIP Conference Proceedings, Golden, CO, June, 2009 (American Institute of Physics), 767–770.
Metzger, P. T. (2016). “Rocket exhaust blowing soil in near vacuum conditions is faster than predicted by continuum scaling laws,” in Earth and Space 2016: Engineering for Extreme Environments, Orlando, FL, April 11–15, 2016 (Reston, VA: American Society of Civil Engineers), 58–66.
Metzger, P. T., Smith, J., and Lane, J. E. (2011). Phenomenology of soil erosion due to rocket exhaust on the moon and the mauna kea lunar test site. J. Geophys. Res. Planets 116, E06005. doi:10.1029/2010je003745
Mezhericher, M., Levy, A., and Borde, I. (2012). Probabilistic hard-sphere model of binary particle–particle interactions in multiphase flow of spray dryers. Int. J. Multiph. Flow 43, 22–38. doi:10.1016/j.ijmultiphaseflow.2012.02.009
Morris, A. B., Goldstein, D. B., Varghese, P. L., and Trafton, L. M. (2015). Approach for modeling rocket plume impingement and dust dispersal on the moon. J. Spacecr. Rockets 52, 362–374. doi:10.2514/1.a33058
Morris, A. B., Goldstein, D. B., Varghese, P. L., and Trafton, L. M. (2016). Lunar dust transport resulting from single-and four-engine plume impingement. AIAA J. 54, 1339–1349. doi:10.2514/1.j054532
Morris, A., Goldstein, D., Varghese, P., and Trafton, L. (2012). Modeling the interaction between a rocket plume, scoured regolith, and a plume deflection fence. Earth space 2012, 189–198. doi:10.1061/9780784412190.022
O’Rourke, P. J. (1981). Collective drop effects on vaporizing liquid sprays. Ph.D. thesis. Princeton, NJ: Princeton University.
O’Rourke, P. J., and Snider, D. M. (2010). An improved collision damping time for MP-PIC calculations of dense particle flows with applications to polydisperse sedimenting beds and colliding particle jets. Chem. Eng. Sci. 65 (22), 6014–6028. doi:10.1016/j.ces.2010.08.032
O’Rourke, P. J., and Snider, D. M. (2012). Inclusion of collisional return-to-isotropy in the MP-PIC method. Chem. Eng. Sci. 80, 39–54. doi:10.1016/j.ces.2012.05.047
O’Rourke, P. J., Zhao, P. P., and Snider, D. (2009). A model for collisional exchange in gas/liquid/solid fluidized beds. Chem. Eng. Sci. 64 (8), 1784–1797. doi:10.1016/j.ces.2008.12.014
Rahimi, A., Ejtehadi, O., Lee, K., and Myong, R. (2020). Near-field plume-surface interaction and regolith erosion and dispersal during the lunar landing. Acta Astronaut. 175, 308–326. doi:10.1016/j.actaastro.2020.05.042
Roberts, L. (1963). “The action of a hypersonic jet on a dusty surface,” in Proceedings of 31st Annual Meeting of the Institute of Aerospace Science, New York, NY, January 21–23, 1963, 63–50.
Schmidt, D. P., and Rutland, C. (2000). A new droplet collision algorithm. J. Comput. Phys. 164 (1), 62–80. doi:10.1006/jcph.2000.6568
Scott, R. F., and Ko, H.-Y. (1968). Transient rocket-engine gas flow in soil. AIAA J. 6, 258–264. doi:10.2514/3.4487
Shallcross, G. (2021). Modeling particle-laden compressible flows with an application to plume-surface interactions. Ph.D. thesis. Ann Arbor, MI: The University of Michigan.
Snider, D. M. (2001). An incompressible three-dimensional multiphase particle-in-cell model for dense particle flows. J. Comput. Phys. 170 (2), 523–549. doi:10.1006/jcph.2001.6747
Snider, D. M., Orourke, P. J., and Andrews, M. J. (1997). An incompressible two-dimensional multiphase particle-in-cell model for dense particle flows. Tech. rep. NM (United States): Los Alamos National Lab.
Stubbs, D. C., Silwal, L., Thurow, B. S., Hirabayashi, M., Raghav, V., and Scarborough, D. E. (2021). Three-dimensional measurement of the crater formation during plume–surface interactions using stereo-photogrammetry. AIAA J. 60, 1316–1331. doi:10.2514/1.j060835
Tan, Z., Liang, C., Chen, X., and Li, J. (2019). Comparisons of TFM and DEM-CFD simulation analyses on the influence mechanism of electrostatics on single bubble in gas-solid fluidized bed. Powder Technol. 351, 238–258. doi:10.1016/j.powtec.2019.04.019
Telfer, M. W., Parteli, E. J., Radebaugh, J., Beyer, R. A., Bertrand, T., Forget, F., et al. (2018). Dunes on Pluto. Science 360 (6392), 992–997. doi:10.1126/science.aao2975
Torquato, S., Truskett, T. M., and Debenedetti, P. G. (2000). Is random close packing of spheres well defined? Phys. Rev. Lett. 84 (10), 2064–2067. doi:10.1103/physrevlett.84.2064
White, C., Borg, M. K., Scanlon, T. J., Longshaw, S. M., John, B., Emerson, D., et al. (2018). dsmcFoam+: An OpenFOAM based direct simulation Monte Carlo solver. Comput. Phys. Commun. 224, 22–43. doi:10.1016/j.cpc.2017.09.030
Willert, E. (2020). Stoßprobleme in Physik, Technik und Medizin: Grundlagen und Anwendungen. Berlin: Springer Nature.
Zhang, H., Liu, Q., Qin, B., and Bo, H. (2015). Simulating particle collision process based on Monte Carlo method. J. Nucl. Sci. Technol. 52 (11), 1393–1401. doi:10.1080/00223131.2014.1003152
Keywords: direct simulation moate carlo method, multiphase flow, plume-surface interaction, multiphase particle-in-cell, openfoam
Citation: Cao Z, White C, Agir MB and Kontis K (2023) Lunar plume-surface interactions using rarefiedMultiphaseFoam. Front. Mech. Eng 9:1116330. doi: 10.3389/fmech.2023.1116330
Received: 05 December 2022; Accepted: 06 January 2023;
Published: 19 January 2023.
Edited by:
Stylianos Varoutis, Karlsruhe Institute of Technology (KIT), GermanyReviewed by:
Eric Josef Ribeiro Parteli, University of Duisburg-Essen, GermanyVladimir Titarev, Federal Research Center Computer Science and Control (RAS), Russia
Copyright © 2023 Cao, White, Agir and Kontis. This is an open-access article distributed under the terms of the Creative Commons Attribution License (CC BY). The use, distribution or reproduction in other forums is permitted, provided the original author(s) and the copyright owner(s) are credited and that the original publication in this journal is cited, in accordance with accepted academic practice. No use, distribution or reproduction is permitted which does not comply with these terms.
*Correspondence: Z. Cao, caoziqu@qq.com