Highly underexpanded rarefied jet flows
 N. Y. Bykov
 Yu. E. Gorbachev
 S. A. Fyodorov
- 1Peter the Great St. Petersburg Polytechnic University, St. Petersburg, Russia
- 2Department of Physics, Novosibirsk State University, Novosibirsk, Russia
- 3Soft-Impact, Ltd., St. Petersburg, Russia
A highly underexpanded jet outflow into the background in transition and scattering regimes is studied computationally. The direct simulation Monte Carlo method and Navier–Stokes equations are used. The main parameters’ impact on the jet flow is analyzed. It is shown that a drastic flow structure transformation occurs in a relatively narrow Reynolds numbers’ range, 5 ≤ ReL ≤ 30, featuring the jet–surrounding gas interaction. At ReL = 5, a shock wave structure that is typical for the underexpanded jet degenerates completely. The existing empirical expressions application for the estimation of the characteristic dimensions of the shock wave structure in the transition regime leads to significant inaccuracy. For the considered parameters’ range, the approaches based on the direct simulation Monte Carlo method and Navier–Stokes (NS) equations’ solution lead to similar results in the nozzle region, where the flow regime is hydrodynamic. Nevertheless, the NS approach employment for the assessment of flow parameters within rarefied shock layers is debatable.
1 Introduction
Supersonic underexpanded gas jets have been the subject of research since the 1960s (Dulov and Lukyanov, 1984; Avduevski et al., 1989; Franquet et al., 2015; Sutton and Biblarz, 2017). A jet expansion is characterized by the expansion ratio n = pa/p∞, where pa is the gas pressure at the nozzle outlet and p∞ is the background gas pressure. Highly underexpanded jets (n ≫ 1) are associated with the spacecraft rocket engines’ operation in the rarefied Earth and other planets’ atmosphere. The study of such jets is necessary for minimizing contamination and spacecraft surface damage caused by the jets (Cai et al., 2022) and for optimizing the operations during a spacecraft launch and landing. A special case is the outflow of rarefied jets from low-thrust engines used in the spacecraft control systems (Micci and Ketsdever, 2000). Such jets are characterized by moderate values of the Reynolds number Re∗, calculated by the parameters of the nozzle throat, and a wide range of Reynolds number ReL, which determines the jet–environment interaction regime.
In cluster beam deposition technologies (Hagena, 1980; 1987) and vacuum gas jet technologies of nanostructured film deposition (Bykov et al., 2019; Starinskiy et al., 2022), a highly underexpanded jet is formed when flowing from a source/crucible into a low-pressure chamber. The gas dynamic parameters of the jet have a decisive influence on the cluster synthesis processes, and their evaluation is necessary for technologies’ optimization. A significant part of the operating range of vacuum technologies corresponds to low and moderate Reynolds numbers Re∗ and ReL.
Experimental studies of underexpanded gas jets at low ReL have been carried out and described in a large number of publications, such as in Rebrov et al. (1971), Volchkov et al. (1973), Kisliakov et al. (1975), and Dubrovin et al. (2022). Despite that, theoretical studies related to n ≫ 1 and ReL < 100 parameters’ range are quite insufficient. Simulations for this range are challenging due to the following reasons. The flow regime in the mixing region is transitional in terms of the Knudsen number or even a free molecular one. At some locations, non-equilibrium effects arise, which complicate the entire jet flow calculation using traditional methods based on the solution of the Navier–Stokes (NS) equations. The use of computational approaches based on the kinetic gas models, such as the direct simulation Monte Carlo (DSMC) method (Bird, 1994; 2013), is optimal for low values of ReL which include outflow into the vacuum (ReL = 0) (Sharipov, 2004; Varoutis et al., 2008; Bykov and Zakharov, 2022). However, the DSMC method is resource intensive. On the one hand, it requires the simulation of a dense flow in the chamber and nozzle, and on the other hand, for n ≫ 1, a sufficiently large computational domain is required in the jet expansion region both in the axial and radial directions that requires the employment of additional simulation techniques, such as the use of radial weight factors that can lead to the violation of conservation laws (Bird, 1994); another way is to employ supercomputer systems (Kashkovsky et al., 2023). The use of hybrid approaches, which implies matching the solution of the NS equations for a hydrodynamic region and the kinetic approach for a rarefied region (George, 2000; Schwartzentruber and Boyd, 2015; Suss et al., 2023), is also possible. However, it does not solve the problem since a large jet expansion region simulation is its most resource-intensive part. The question on the correct solution match at the corresponding transition boundary also arises (Tcheremissine, 2023).
The aim of this work is to study a highly underexpanded jet flow in the mentioned parameters’ range (n ≫ 1, ReL < 100). The study involves the analysis of the main parameter impact on the flow structure inside a conical nozzle and an expanding jet, refinement of ReL values for which there are no shock waves in the mixing region, discussion on the suitability of the available empirical expressions for estimating jet dimensions, and analysis of a correctness of flow modeling using the NS approach.
The study is organized as follows. In the next section, the problem statement is formulated and the approaches used are described. The third section is devoted to the analysis of simulation results. The last section draws the conclusions.
2 Problem statement
2.1 Geometry and flow parameters
The argon outflow from a conical nozzle into the background gas is considered (Figure 1). The computational domain consists of a chamber, in which the stagnation gas parameters (p0 and T0) are fixed (domain A), a diverging conical nozzle (domain B), and the region of jet expansion outside the nozzle (domain C). The nozzle is a divergent cone with length Ln = 6 mm, throat diameter d∗ = 1 mm, outlet diameter da = 3.6 mm, and nozzle half-angle θa ≈ 12.2°. The throat corresponds to the minimum cross-section of the nozzle’s conical part. In the considered geometry, it coincides with the coordinates’ origin, as shown in Figure 1.
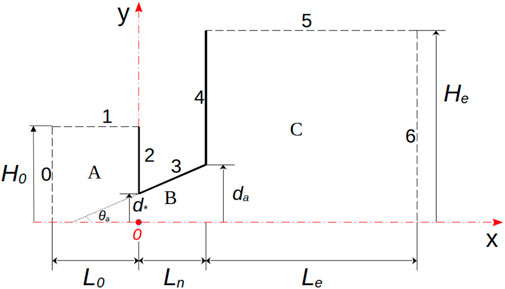
FIGURE 1. Computational domain (not to scale).
The chamber (stagnation) pressure, p0, and the background gas pressure, p∞, are varied at close values of gas temperatures in the chamber and background T0/T∞∼ 1 (Table 1).
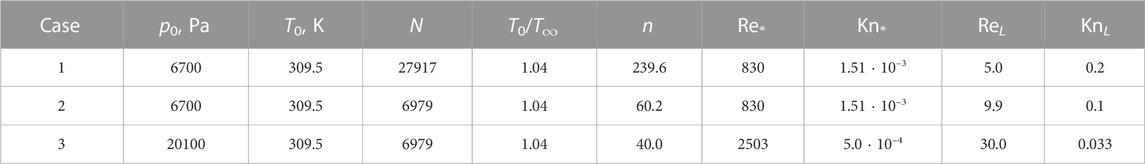
TABLE 1. Main flow parameters.
The flow in the nozzle is determined by the Reynolds number Re∗, calculated from the parameters of the gas in the throat or by the corresponding Knudsen number Kn∗. The interaction of the outflowing gas with ambient gas is characterized by the Reynolds number Re that is determined by environmental parameters, the characteristic jet size, and the characteristic outflow velocity. Re∗ and Re are related to each other. When the gas in the chamber and background gas are the same and their temperatures are equal, the additional dimensionless parameters that determine the flow are the expansion ratio n, Mach number at the nozzle outlet, Ma, and Prandtl number, Pr (Dulov and Lukyanov, 1984). The considered flow parameters are summarized in Table 1.
The Reynolds number in the nozzle throat is determined as
where ρ∗ and v∗ are the gas mass density and velocity in the throat (averaged over the section), respectively, and μ(T∗) is the gas viscosity at the throat temperature T∗. The Knudsen number (Bird, 1994) can be estimated as
where γ = 1.67 is the specific heat ratio, ω is the exponent in the viscosity–temperature dependence, and M∗ is the Mach number in the throat. For estimation of the main parameters, it is assumed that M∗ = 1.
The Reynolds number characterizing the flow regime in the expansion region is defined as Re = ρ∞vmL/μ∞ = αReL (Dulov and Lukyanov, 1984). Herein, ρ∞ and μ∞ are the density and viscosity of the ambient gas, respectively; vm is the maximum outflow velocity; L is the characteristic size of the underexpanded jet, estimated as the distance to the Mach disk, xc, or to the corresponding intersection point of an oblique shock and axis (see Section 3.2); ReL is defined as
where N = p0/p∞ is the nozzle pressure ratio. The parameter α is a weak function of the Mach number at the nozzle outlet, specific heat ratio, and half-angle and is of the order of unity. Therefore, instead of Re, parameter ReL is frequently used (Rebrov et al., 1971; Dulov and Lukyanov, 1984). The corresponding Knudsen number (Dulov and Lukyanov, 1984) can be estimated as
where λ∞ is the mean free path of molecules in the ambient gas. Equation 4 assumes an equality of the stagnation and ambient temperatures.
As shown in Table 1, the considering regimes of the nozzle flow are hydrodynamic, while the regime of the jet with a background interaction is transitional in terms of the Knudsen number.
2.2 DSMC method parameters
The Bird’s classical algorithm using the no time counter (NTC) scheme (Bird, 1994; Bird, 2013) is employed in DSMC simulations. Elastic collisions are described by the variable hard sphere (VHS) model, for which the collision diameter was determined by the particle relative velocity c as
where, for argon, dref = 4.17 ⋅ 10–10 m, cref = 558.3 m/s, (Tref = 273 K), and ω = 0.81 (Bird, 1994). This equation implies that μ ∼ Tω (Eq. 6).
The dimensions of domain (A) are L0 = 2d∗ and H0 = 1.35d∗, and the dimensions of domain (C) are Le = 330d∗ and He = 45d∗. At the boundaries 0 and 1, the gas is assumed to be at rest. Diffuse reflection with total energy accommodation and temperature T0 is assumed at boundaries 2, 3, and 4. The conditions at boundaries 5 and 6 are similar to the “gas at rest” condition: incident particles are removed from the simulation, and the particles flowing into this region correspond to a semi-Maxwellian distribution function with parameters p∞ and T∞.
A zone mesh with a different number of cells within each zone is used in the simulations. The zones are of a rectangular or triangular shape and consist of rectangular and triangular cells. The DSMC mesh for the whole domain and nozzle region is shown in Supplementary Figure S1. The number of zones varies from 272 to 400, the total number of cells varies from 106 to 3.5 ⋅ 106, and the number of computing particles varies from 5 ⋅ 108 to 109, depending on the simulation case. Additional verification simulations, in which the number of cells in the nozzle and the area adjacent to it varies, showed the practical absence of dependence of the solution with a further decrease in cell size. The in-house DSMC code (Bykov and Gorbachev, 2019) is employed, and the algorithm is parallelized by the spatial decomposition method and performed on the Polytechnic Tornado cluster of the supercomputer center of the Peter the Great St. Petersburg Polytechnic University.
The code verification was performed in several previous works, such as in Bykov and Gorbachev (2019) and Bykov and Zakharov (2022). Herein, we present a comparison of flow through nozzle DSMC results against solution results of the NS equations.
2.3 Simulation using the Navier–Stokes equations
Supersonic jet modeling was performed using the OpenFOAM package, version 2112, distributed under the GNU GPL license. A set of equations describing the transient flow of viscous compressible gas was used—the mass conservation equation (continuity equation), momentum conservation equation (motion equation), and energy conservation equation—which were closed by the ideal gas law and Newtonian law for viscous stress tensor (Greenshields et al., 2009).
The power law of dependency of viscosity on temperature for argon was used as follows:
where ω is as given in (5), A = 2.25 ⋅ 10–7, and the viscosity units are Pa⋅s.
An unsteady viscous gas flow solver rhoCentralFOAM was used. It is based on the Kurganov–Tadmor central-upstream difference scheme. The rhoCentralFOAM solves momentum and mass conservation equations using the time separation approach. The inviscid equations are solved explicitly to obtain the predicted variable value. Then, the diffusion terms are added in the form of implicit corrections to the original inviscid equations (Greenshields et al., 2009).
The computational domain for NS simulations was taken to be the same as that for DSMC (see Figure 1). At the inlet and outlet sections (borders 0 and 6), the soft boundary conditions are used as
where
Although the conditions at boundary 1 inside the chamber between the DSMC and NS approaches differs, they lead to the same mass flux through the throat.
The outer boundary (5) represents a far field with fixed pressure. In the case of an inflow, the temperature boundary condition is switched from a zero normal gradient to a fixed value at T = T∞:
The problem is solved using the transient approach, where at the initial moment, discontinuity in the pressure field is assumed: a high pressure p0 at chamber (A) and a low pressure p∞ in nozzle (B) and expansion region (C). During computation, steady fields are obtained.
A 2D structured mesh with approximately 200,000 cells with near-surface layer resolution is used. The computational mesh is shown in Supplementary Figure S2. To see the cell size effect, additional simulations are performed, which show that the solution obtained on the 200,000 cells mesh is not dependent on the cell size.
3 Results
3.1 Nozzle flow
The simulation results, of both the DSMC and NS, show a non-monotonic behavior of the gas dynamic parameters inside the nozzle (Figures 2, 3). In the paraxial region of the nozzle, the density and temperature maxima and the minimum Mach number are observed. The behavior of the parameters in the flow regions near the nozzle wall and near the axis significantly differs. These features of the flow are due to the following factors.
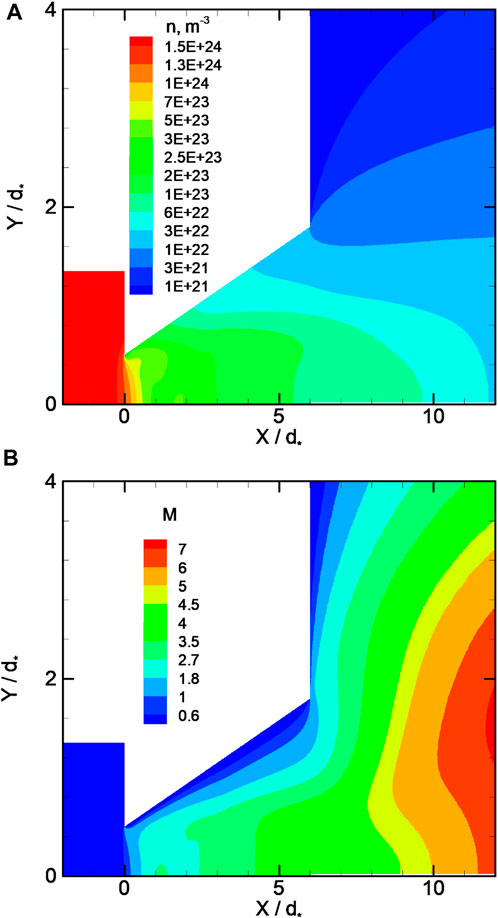
FIGURE 2. Distribution of fields inside nozzle (DSMC simulations, case 2). Number density (A) and Mach number (B).
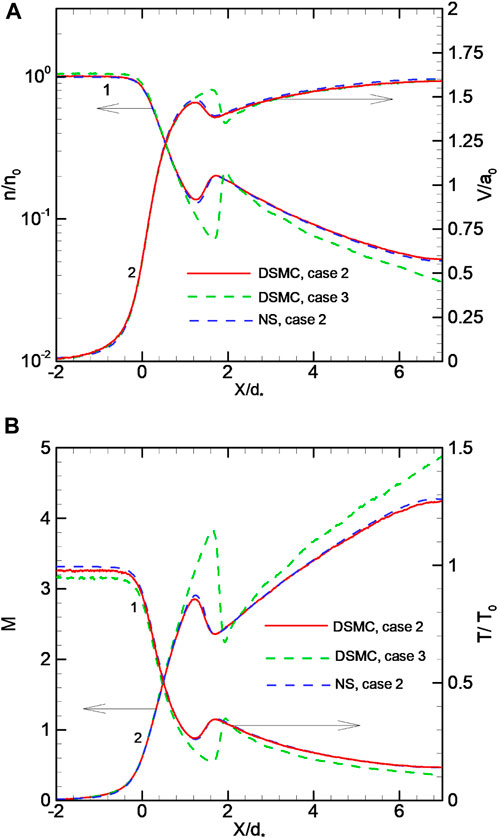
FIGURE 3. Number density (1) and velocity (2) (A); temperature (1) and Mach number (2) (B) distributions along the flow axis for cases 2 and 3. a0 is the sound velocity in the chamber.
First, an oblique shock is formed inside the conical nozzle (Ivanov et al., 1999). A sharp expansion of the flow directly behind the throat and further interaction of the flow with the wall leads to the appearance of a positive pressure gradient along the wall near the throat. A local increase in pressure near the surface leads to the formation of a shock wave. With the increase in chamber pressure, the intersection zone of shock with the flow axis shifts toward the nozzle outlet (Figure 3). The intensity of shock also increases. In cases 2 and 3 (inside the nozzle, cases 1 and 2 are identical), for which the stagnation pressure in the chamber differs by the factor of 3, the ratio of the Mach numbers on the axis behind and before shock is approximately 1.22 (case 2) and 1.78 (case 3), respectively. After the shock, the axial parameters inside the nozzle vary monotonically; the density and temperature decrease, while the velocity and Mach number increase. In the general case, shock reflected from the axis can reach the nozzle wall, be reflected from it, and “return” to the downstream axis.
Second, the flow in the near-wall region is affected by the boundary conditions on the wall. In the axial region, the temperature decreases with increasing distance from the throat, except at the vicinity of the shock. There is practically no temperature gradient along the wall surface. The gas temperature is close to the wall temperature. At the wall, the gas decelerates and a subsonic flow region is formed. The sound line starts at the top of the throat and closes at the nozzle edge.
Despite the rather high values of the Reynolds number, there is no region of one-dimensional isentropic expansion, and viscous effects manifest themselves in the entire region of the flow through the nozzle.
For the Re∗ numbers given in Table 1, the flow regime through the nozzle is close to hydrodynamic. This makes it possible to carry out a calculation using the NS equations and compare the modeling results obtained by different approaches. The axial distributions of the parameters obtained by solving the NS equation for case 2 are shown in Figure 3, and an almost complete agreement of the results is seen.
3.2 Expanding jet flow
The flow in a supersonic underexpanded jet for high Reynolds numbers ReL has been widely studied (Dulov and Lukyanov, 1984; Avduevski et al., 1989; Rebrov, 2001; Franquet et al., 2015; Sutton and Biblarz, 2017). Depending on the value of ReL, the flow in the jet expansion region can be laminar or turbulent. In the initial section behind the nozzle, a barrel shock is formed, which confines the region of free expansion of the jet. At small expansion ratio values, the jet consists of some periodically repeating structures, such as the barrels (Mach diamonds). This mode is characterized by a regular reflection of a barrel shock from the axis (no Mach disk). The pressure ratio increases above a certain value n∗, which leads to the appearance of a central shock wave, the Mach disk. An increase in n leads to the gradual vanishing of all barrels, except the first one. The shock wave structure includes the barrel shock, Mach disk, and reflected oblique shock (Supplementary Figure S3A). The distance to the Mach disk at high Reynolds numbers ReL can be estimated using the Lewis–Carlson expression (Lewis and Carlson, 1964) as follows:
where Ma is the Mach number at the nozzle outlet. Equation 11 is the result of experimental data processing for nitrogen, helium, and carbon dioxide jets. For sound outflow through an orifice in the hydrodynamic regime, the following expression (Ashkenas and Sherman, 1965) can be used:
The last equation is convenient because it does not require a knowledge of the parameters in a nozzle outlet section.
With a significant decrease in the ReL number down to approximately 100, two trends are observed. The first trend is in the thickening of the barrel shocks and Mach disk, as well as the jet gas and ambient gas mixing layer at the jet boundary. The flow is restructured from the laminar regime to the scattering regime (Muntz et al., 1970), in which the observed flow in the far field of the jet acquires a diffusion character.
The second trend is in the evolution of a shock wave structure. In the experiments with a decrease in ReL below a certain value (e.g., ReL ≈ 350 for CO2), a transition to a quasi-regular reflection of an incident oblique shock, the so-called X-shaped configuration, is observed (Kisliakov et al., 1975; Rebrov, 2001) (Supplementary Figure S3B). In the region of the X-shaped configuration, there is a sharp increase in density that is relative to the maximum, which is possible for a direct shock in an inviscid gas.
Herein, we present the simulation results of an underexpanded jet outflow for extremely low ReL (ReL ≤ 30, Table 1).
For case 3, ReL = 30 (KnL = 0.033), the density field is shown in Figure 4. The formation of a shock structure is clearly seen (Supplementary Figure S3C). The jet core is confined by the oblique shock. Shock is smeared (Figures 4, 5, 6) and located close to the jet axis at a distance that is less than Y < 10d∗ = 2.8da. The influence of the reflected shock on the flow is limited by the radial coordinate Y ∼ 20d∗. In the expansion region, the density minimum is close to the environment density. A minimum on temperature distribution and maximum on Mach number distribution along the axis are observed in the region before the shock–axis intersection region. The temperature and density minima and Mach number maximum positions do not coincide. According to the data presented in Figure 6, the Mach number reaches its maximum value on axis M
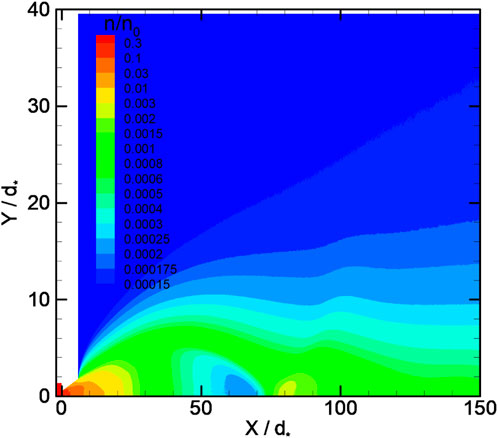
FIGURE 4. Number density field for case 3.
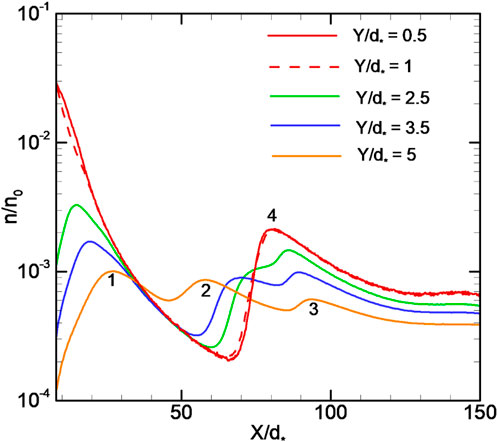
FIGURE 5. Number density distribution in the longitudinal direction for case 3.
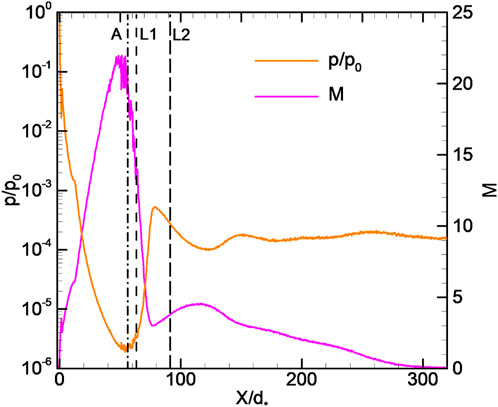
FIGURE 6. Mach number and pressure distributions along the flow axis for case 3.
Due to rarefaction, the shock waves are smearing and no more the infinitely thin layers. For the considered flow case, the presence of a small radius Mach disk (Supplementary Figure S3A) is questionable. The shock wave configuration obtained in the simulations is very close to the X-shaped configuration, as previously described by Kisliakov et al. (1975) and Rebrov (2001) (Supplementary Figure S3B). The latter assumes an absence of the Mach disk, a quasi-regular intersection of the incident oblique shock with the flow axis and supersonic flow behind the X-point. A reflection of the incident shock from an axis should lead to the presence of the two density maxima of the longitudinal distribution near the axis that correspond to the incident and reflected shock, respectively. In Figure 5, at the coordinates Y/d∗ = 3.5 and 5, three density maxima are observed. The first (number 1 in the figure) corresponds to the density change when the line with Y/d∗ = 3.5 or 5 intersects the beginning of the oblique shock layer near the nozzle. The other two maxima (2 and 3) are the aforementioned line intersections at the end of the incident shock and reflected shock (near the interaction region), respectively. As Y/d∗ decreases, starting from Y/d∗ ∼ 1.5, maxima 2 and 3 degenerate into one maximum 4. For Y/d∗ = 0.5 and 1, the density distributions in the shock region on the jet centerline practically coincide, demonstrating only one density maximum.
One of the goals of this work was to analyze the possibility of using the empirical equations for estimating the location of the intersection of shock and the axis. The location of shock may be predicted by using equation (11) or (12). The corresponding lines (marked as L1, L2, and A) are depicted in Figure 6 (also see Supplementary Figure S4). Equation 11 requires nozzle outlet parameters Ma and pa. For the considered cases, such parameters vary by the radial coordinates at the nozzle exit. The parameters can be estimated as axial parameters (line L1 in Figure 6) or averaged parameters (line L2). The shock location can be defined as the position of the maximal density gradient within the shock. Equation 12, which is valid for sound outflow in the hydrodynamic regime, underestimates a shock location coordinate. The same situation exists with the assessment by (11) using the average parameters at the nozzle outlet (line A). On the contrary, the assessment by (11), with the use of axial parameters, overestimates a shock location coordinate (Supplementary Figure S4). It can be seen that all the shock location predictions are not satisfactory for the considered parameters’ range.
With a threefold decrease in the Reynolds number to ReL = 9.9 (KnL = 0.1, case 2), the flow pattern changes significantly. The shock structure is no longer observed (Figure 7). However, the isolines of the parameters are significantly deformed in relation to the case ReL → 0. The deformation of the isolines is the most pronounced for the density field (Figure 7). Thus, we can conclude that a smeared and degenerate shock wave structure exists for this situation. This statement somewhat corrects the conclusion (Dulov and Lukyanov, 1984) about the complete degeneration of such a structure at ReL = 10. A plateau is observed on the axial density distribution corresponding to the coordinates 40 < X/d∗ < 60 (Supplementary Figure S5), which can be identified with the interaction of smeared oblique shock with the flow axis. The Mach number reaches its maximum value M
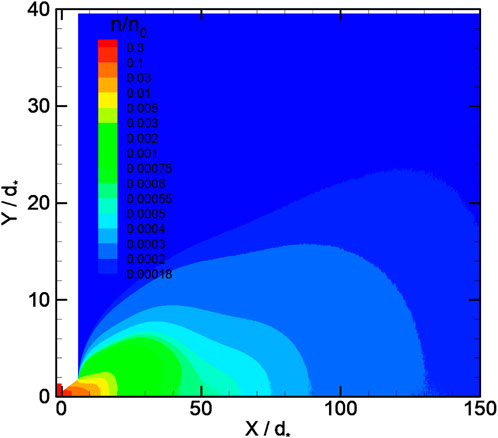
FIGURE 7. Number density field for case 2.
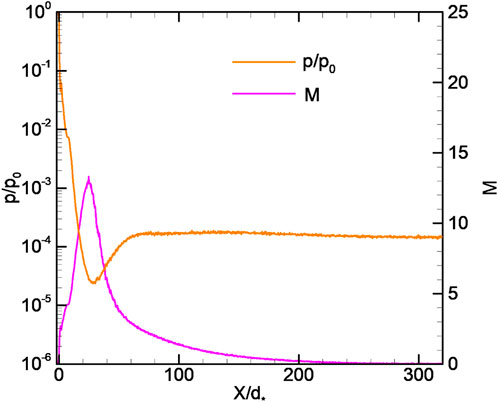
FIGURE 8. Mach number and pressure distributions along the flow axis for case 2.
Further reduction of the Reynolds number to ReL = 5 (KnL = 0.2, case 1) leads to a complete shock wave degeneration (Figure 9). Density field isolines’ deformation is no longer observed. In contrast to the outflow into vacuum, the Mach number and temperature fields have a maximum and minimum, respectively, but no oscillations of the parameters are observed. The gas dynamic parameters’ axial distributions are shown in Figure 10, Supplementary Figure S6. The plateau on the density distribution disappears, which confirms the complete degeneration of the shock waves. The distance to shock may be estimated by (11) or (12), but it does not make sense for this case.
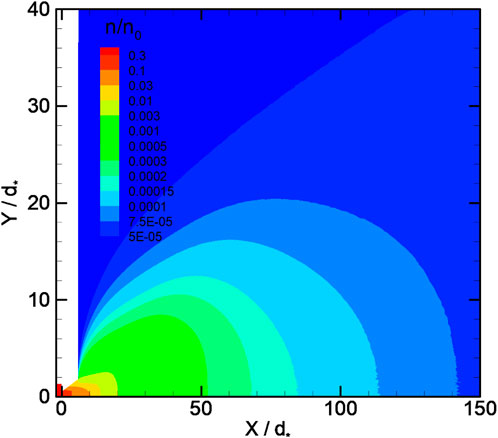
FIGURE 9. Number density field for case 1.
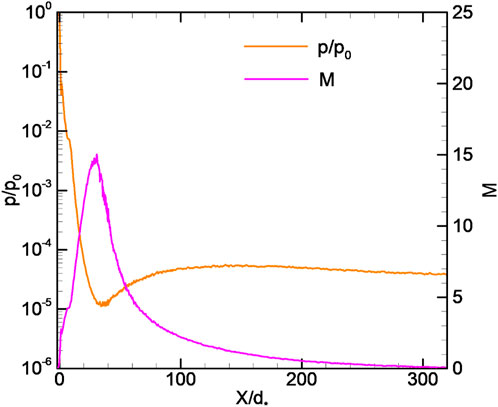
FIGURE 10. Mach number and pressure distributions along the flow axis for case 1.
The change in the shock wave structure in a strongly underexpanded jet at low ReL numbers can be clearly seen in Supplementary Figure S7. In case 1, the density decreases monotonically; in case 2, a step appears on the density distribution; and in case 3, the structure shown in Supplementary Figure S3B becomes pronounced.
3.3 Relevancy analysis of calculations based on Navier–Stokes equations
The calculations for all the cases were performed on the basis of the NS equations as well. The corresponding computational parameters and boundary conditions are described in Section 2.3.
Figures 11A, B show the axial parameters’ distributions in the jet, which include the flow deceleration region, for case 1 (ReL = 5, KnL = 0.2). In the initial part of the jet, the solutions based on the NS and DSMC methods coincide with each other. However, the NS approach predicts a larger size for the initial jet region up to the point where the flow deceleration begins, which corresponds to the maximum velocity in the jet. Accordingly, the Mach number limiting values achievable in the jet, predicted on the basis of the NS equations, turn out to be higher, and the limiting density and temperature values are lower in relation to that predicted by the DSMC method. The thickness of the layer in which the flow deceleration occurs turns out to be smaller than that predicted by the NS equations. This conclusion is consistent with the one proposed by Greenshields and Reese (2007) and Scanlon et al. (2015), where the discrepancies between the experimental data and NS solution for the problem of the shock wave thickness determination in a rarefied gas are discussed. A larger density gradient in the shock wave obtained from solving the NS equations, with respect to the numerical solution of the Boltzmann equation or the DSMC results for Mach number M ≫ 1, was also observed in the study conducted by Shoev et al. (2020) and Poleshkin and Kudryavtsev (2023). The density distribution described by the NS equations clearly shows a low-intensity jump, which is not typical for the considered case (ReL = 5 and KnL = 0.2), corresponding to the scattering regime (Dulov and Lukyanov, 1984; Avduevski et al., 1989). As discussed previously, the shock wave degenerates with Reynolds number reduction. Case 1 corresponds to the intermediate situation when it is completely smeared when simulated within the DSMC method, but not yet smeared when simulated by NS equations. Thus, in this case, there is a qualitative difference between the results of the methods used.
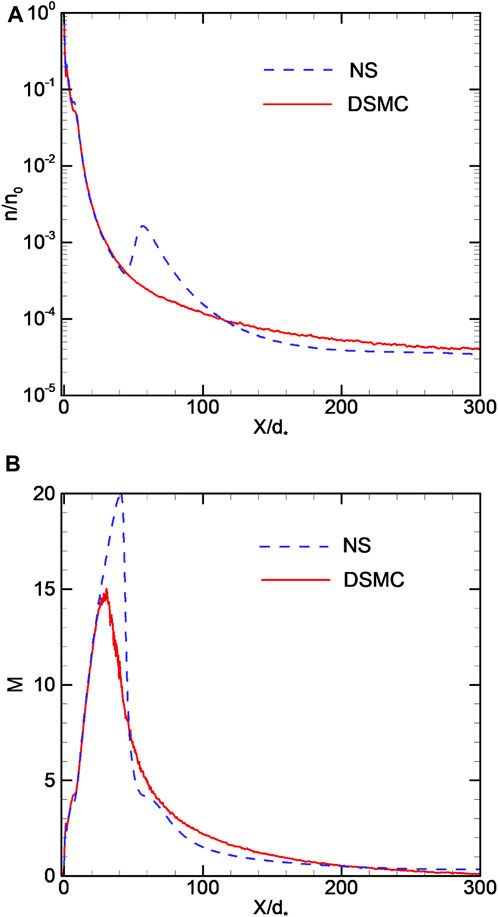
FIGURE 11. Number density (A) and Mach number (B) distributions along the flow axis for case 1.
As ReL increases, the situation changes (Supplementary Figure S8). At ReL = 30, there is a qualitative agreement between the results of different methods. Both methods reproduce the shock structure that is typical for the considered parameters. However, as previously discussed, NS predicts higher Mach numbers.
The reason for the discrepancy between the NS equations and DSMC method solutions can be related with the high degree of non-equilibrium flows within the shock layers. Supplementary Figure S9 shows the distributions of the translational temperature components on the axis for cases 1 and 3. In case 1, the translational non-equilibrium turns out to be high and reaches the values Rn = (Tx − Ty)/T ∼ 50% in the jet deceleration region, where Tx and Ty are the x- and y-temperature components that are the mean values of the corresponding molecular kinetic energy components, determined by the molecular velocity components vx and vy, respectively. Within the shock layer for case 3, similar to the previous case, Rn increases up to
4 Conclusion
The DSMC and NS simulations of the underexpanded jet outflow from a conical nozzle into the background was performed for low Reynolds number values, 5 ≤ ReL ≤ 30, responsible for the jet–ambient gas interaction regime. In the indicated range of ReL, a drastic change in the flow structure in the expansion region outside the nozzle was observed. The flow at ReL = 30 contained a shock structure that is typical for a highly underexpanded jet. Such a structure was somewhat smeared. With the Reynolds number decreasing, the shock structure was significantly smeared. Nevertheless, a weak trail of shocks were preserved even at ReL = 9.9. At ReL = 5, shocks completely degenerate. For such a regime, the results of DSMC and NS are qualitatively different; an approach based on the solution of NS equations continues the shock wave structure prediction. At ReL = 30, a qualitative agreement and satisfactorily quantitative agreement in the results within the shock layer region were observed.
The flow inside the conical nozzle had a complex structure that was affected by internal shock and the presence of the flow-limiting surface. For the considered Re∗ range, 800 < Re∗ ≤ 2500, the nozzle flow showed a pronounced 2D structure. The axial distribution of the parameters calculated by the DSMC and NS approaches was in perfect agreement with each other.
The presence of a complex shock structure both in the nozzle and jet expansion region, with sufficiently non-linear behavior of gas dynamic parameters, should be taken into account when studying condensation and other relaxation processes and when interpreting the corresponding experimental results.
Data availability statement
The original contributions presented in the study are included in the article/Supplementary Material; further inquiries can be directed to the corresponding author.
Author contributions
NB: conceptualization, methodology, formal analysis, visualization, validation, manuscript writing—original draft, review, and editing. YG: supervision, methodology, conceptualization, and manuscript writing—review and editing. SF: validation, formal analysis, visualization, and manuscript writing—review and editing. All authors contributed to the article and approved the submitted version.
Funding
The work was completely performed at the Novosibirsk State University using the computational capabilities of the Peter the Great St.Petersburg Polytechnic University with the financial support of the Russian Science Foundation (grant no. 22-11-00080).
Acknowledgments
The computational resources were provided by the supercomputer center of Peter the Great St. Petersburg Polytechnic University. The authors would like to sincerely acknowledge their colleagues from the Novosibirsk State University—Alexander Zarvin and Kirill Dubrovin—for their fruitful discussions.
Conflict of interest
Author YG was employed by the company Soft-Impact, Ltd.
The remaining authors declare that the research was conducted in the absence of any commercial or financial relationships that could be construed as a potential conflict of interest.
Publisher’s note
All claims expressed in this article are solely those of the authors and do not necessarily represent those of their affiliated organizations, or those of the publisher, editors, and reviewers. Any product that may be evaluated in this article, or claim that may be made by its manufacturer, is not guaranteed or endorsed by the publisher.
Supplementary material
The Supplementary Material for this article can be found online at: https://www.frontiersin.org/articles/10.3389/fmech.2023.1216927/full#supplementary-material
References
Ashkenas, H., and Sherman, F. S. (1965). “Structure and utilization of supersonic free jets in low density wild tunnels,” in Rarefied gas dynamics: Proc. Of 4th int symp. Editor J. H. de Leeuw (N.Y.: Academic Press), 84–105.
Avduevski, V. S., Ashratov, E. A., Ivanov, A. V., and Pirumov, U. G. (1989). Gas dynamics of supersonic non-isobaric jets. Moscow: Mashinistroenie.
Bird, G. A. (1994). Molecular gas dynamics and the direct simulation of gas flows. Oxford: Clarenton Press.
Bykov, N. Y., and Gorbachev, Y. E. (2019). Cluster formation in copper vapor jet expanding into vacuum: the direct simulation Monte Carlo. Vacuum 163, 119–127. doi:10.1016/j.vacuum.2019.02.007
Bykov, N. Y., and Lukyanov, G. A. (1998). Structure and parameters of the shock layer formed when a supersonic underexpanded jet interacts with a counterpropagating hypersonic flow in the transition regime. Tech. Phys. 43, 755–760. doi:10.1134/1.1259069
Bykov, N. Y., Safonov, A. I., Leshchev, D. V., Starinsky, S. V., and Bulgakov, A. V. (2019). The gas-jet method of deposition of nanostructured silver films. Tech. Phys. 64, 776–789. doi:10.1134/S1063784219060045
Bykov, N. Y., and Zakharov, V. V. (2022). Rarefied gas mixtures with large species mass ratio: outflow into vacuum. Phys. Fluids 34, 057106. doi:10.1063/5.0089628
Cai, G., Liu, L., He, B., Ling, G., Weng, H., and Wang, W. (2022). A review of research on the vacuum plume. Aerospace 9, 706. doi:10.3390/aerospace9110706
Cercignani, C. (1975). Theory and application of the Boltzmann equation. Edinburgh and London: Scottish Academic Press.
Dubrovin, K. A., Zarvin, A. E., Kalyada, V. V., and Yaskin, A. S. (2022). Influence of the outflow initial parameters on the transverse dimensions of underxpanded argon jets in presence of condensation. Vacuum 207, 111651. doi:10.1016/j.vacuum.2022.111651
Franquet, E., Perrier, V., Gibout, S., and Bruel, P. (2015). Free underexpanded jets in a quiescent medium: A review. Prog. Aerosp. Sci. 77, 25–53. doi:10.1016/j.paerosci.2015.06.006
George, J. D. (2000). A combined CFD-DSMC method for numerical simulation of nozzle plume flows. Ithaca: Cornell University.
Greenshields, C. J., and Reese, J. M. (2007). The structure of shock waves as a test of brenner’s modifications to the Navier-Stokes equations. J. Fluid Mech. 580, 407–429. doi:10.1017/S0022112007005575
Greenshields, C. J., Weller, H. G., Gasparini, L., and Reese, J. M. (2009). Implementation of semi-discrete, non-staggered central schemes in a colocated, polyhedral, finite volume framework, for high-speed viscous flows. Int. J. Numer. methods fluids 63, 1–21. doi:10.1002/fld.2069
Hagena, O. F. (1987). Condensation in free jets: comparison of rare gases and metals. Z Phys D - Atoms, Mol. Clust. 4, 291–299. doi:10.1007/BF01436638
Hagena, O. F. (1980). Nucleation and growth of clusters in expanding nozzle flows. Surf. Sci. 106, 101–116. doi:10.1016/0039-6028(81)90187-4
Ivanov, M. S., Markelov, G. N., Ketsdever, A. D., and Wadsworth, D. C. (1999). Numerical study of cold gas micronozzle flows. AIAA 1999. doi:10.2514/6.1999-166
Kashkovsky, A. V., Kudryavtsev, A. N., and Shershnev, A. A. (2023). Numerical investigation of the rarefied supersonic underexpanded jet structure using the dsmc method. Thermophys. Aeromechanics 30, 29–36. doi:10.1134/s0869864323010043
Kisliakov, N. I., Rebrov, A. K., and Sharafutdinov, R. G. (1975). On the structure of low-density high-pressure jets behind a supersonic nozzle. Appl. Mech. Theor. Phys. 1975, 42–52.
Lewis, C. H., and Carlson, D. J. (1964). Normal shock location in underexpanded gas and gas-particle jets. AIAA 2, 776–777. doi:10.2514/3.2409
Micci, M. M., and Ketsdever, A. D. (Editors) (2000). “Micropropulsion for small spacecraft,” Progress in astronautics and aeronautics (Reston, VA: American Institute of Aeronautics and Astronautics).
Muntz, E. P., Hamel, B. B., and Maguire, B. L. (1970). Some characteristics of exhaust plume rarefaction. AIAA J. 8, 1651–1658. doi:10.2514/3.5960
Poleshkin, S. O., and Kudryavtsev, A. N. (2023). Investigation of shock wave internal structure with different kinetic models. AIP Conf. Proc. 2504, 030097. doi:10.1063/5.0132379
Rebrov, A. K., Chekmarev, S. F., and Sharafutdinov, R. G. (1971). The effect of sparsity on the structure of a free nitrogen jet. Appl. Mech. Tech. Phys. 1971, 136–144.
Rebrov, A. K. (2001). Free jets in vacuum technologies. J. Vac. Sci. Tech. A 19, 1679–1687. doi:10.1116/1.1382649
Scanlon, T., White, C., Borg, M. K., Cassineli, P. R., Farbar, E., Boyd, I. D., et al. (2015). Open-source direct simulation Monte Carlo chemistry modeling for hypersonic flows. AIAA 53, 1670–1680. doi:10.2514/1.J053370
Schwartzentruber, T. E., and Boyd, I. D. (2015). Progress and future prospects for particle-based simulation of hypersonic flow. Prog. Aerosp. Sci. 72, 66–79. doi:10.1016/j.paerosci.2014.09.003
Sharipov, F. (2004). Numerical simulation of rarefied gas flow through a thin orifice. J. Fluid Mech. 518, 35–60. doi:10.1017/S0022112004000710
Shoev, G. V., Timokhin, M. Y., and Bondar, Y. A. (2020). On the total enthalpy behavior inside a shock wave. Phys. Fluids 32, 041703. doi:10.1063/5.0005741
Starinskiy, S. V., Safonov, A. I., Shukhov, Y. G., Sulyeva, V. S., Korolkov, I. V., Volodin, V. A., et al. (2022). Nanostructured silver substrates produced by cluster-assisted gas jet deposition for surface-enhanced Raman spectroscopy. Vacuum 199, 110929. doi:10.1016/j.vacuum.2022.110929
Suss, A., Mary, I., Garrec, T. L., and Mariél, S. (2023). A hybrid lattice Boltzmann - Navier-Stokes method for unsteady aerodynamic and aeroacoustic computations. J. Comput. Phys. 485, 112098. doi:10.1016/j.jcp.2023.112098
Sutton, G. P., and Biblarz, O. (2017). Rocket propulsion elements. ninth edition. United States: Wiley.
Tcheremissine, F. G. (2023). Solution of the Boltzmann equation in the continuum flow regime. Comput. Math. Math. Phys. 63, 319–331. doi:10.1134/S0965542523020057
Varoutis, S., Valougeorgis, D., Sazhin, O., and Sharipov, F. (2008). Rarefied gas flow through short tubes into vacuum. J. Vac. Sci. Technol. A A 26, 228–238. doi:10.1116/1.2830639
Keywords: underexpanded jet, rarefied gas, nozzle flow, shock wave structure, DSMC, CFD
Citation: Bykov NY, Gorbachev YE and Fyodorov SA (2023) Highly underexpanded rarefied jet flows. Front. Mech. Eng 9:1216927. doi: 10.3389/fmech.2023.1216927
Received: 04 May 2023; Accepted: 18 July 2023;
Published: 09 August 2023.
Edited by:
Oleg Sazhin, Ural Federal University, RussiaReviewed by:
Sean O’Byrne, University of New South Wales Canberra, AustraliaElena Kustova, Saint Petersburg State University, Russia
Copyright © 2023 Bykov, Gorbachev and Fyodorov. This is an open-access article distributed under the terms of the Creative Commons Attribution License (CC BY). The use, distribution or reproduction in other forums is permitted, provided the original author(s) and the copyright owner(s) are credited and that the original publication in this journal is cited, in accordance with accepted academic practice. No use, distribution or reproduction is permitted which does not comply with these terms.
*Correspondence: Yu. E. Gorbachev, yuriy.gorbachev@gmail.com