Extensive study of flow characters for two vertical rectangular polygons in a two-dimensional cross flow
- 1Department of Mathematics, The Government Sadiq College Women University, Bahawalpur, Pakistan
- 2Department of Mathematics, The Islamia University, Bahawalpur, Pakistan
- 3Department of Sciences and Humanities, National University of Computer and Emerging Sciences, Islamabad, Pakistan
- 4Department of Mathematics, Fast Nuces, Islamabad, Pakistan
- 5Comsats University, Islamabad, Pakistan
Fluid dynamics problems have a significant impact on the growth of science and technologies all over the world. This study investigates viscous fluid’s behavior when interacting with two rectangular polygons positioned vertically and aligned in a staggered configuration. Two physical parameters, Reynolds Number and Gap spacings, are discussed using the Lattice Boltzmann Method for two-dimensional flow. Results are discussed in vortex snapshots, time trace histories of drag and lift coefficient, and power spectra analysis of lift coefficient. Nine distinct flow vortex streets are identified based on increasing gap spacings between the pair of two rectangular polygons. The vortex shedding mechanism is disturbed at small gap spacings and becomes optimal at large gap spacings. Different physical parameters of practical importance, like mean drag coefficient, root mean square values of drag coefficient, root mean square values of lift coefficient, and Strouhal number, approach the single rectangular polygon value at large gap spacings.
1 Introduction
Fluid forces play a vital role in engineering applications, such as when an object is moving in a fluid, and energy is required to move that object. The engineers are mainly concerned with resistance to this movement through reducing drag force (CD) and transverse fluctuating force (CL); such force acts on a body that produces vertical vibration and may cause damage to the structure of an object. Effective flow control is essential to save energy and reduce vibrations to avoid damaging the structure. In this regard, a comprehensive analysis of the delay of the vortex shedding mechanism and the reduced fluid forces adjacent to the bluff body has attracted significant attention from researchers in the last few decades because of its great significance. The investigation of bluff body fluxes is essential to science and engineering due to their diverse flow characteristics and applications. Circular, square, or rectangular objects are typical examples of bluff bodies. Chimneys, tall structures, overhead power-line packages, wind tunnels, chemical reactions in towers, microelectromechanical systems (MEMS), and fiber cooling are just a few practical uses for the flow past bluff bodies. Numerous fluid dynamic phenomena, including vortex shedding, flow separation, and reattachment, frequently occur in the flows around bluff bodies. Fluid dynamics are drastically altered when the number and alignment of multiple bluff bodies are changed.
Many theoretical, experimental, and numerical studies are performed in these aspects to analyze wake structure under the effects of different parameters. Researchers (Gad-el-Hak, 2000; Salmasi et al., 2013; Mohammadi and Taleghani, 2014; Abdolahipour et al., 2022a; Rahni et al., 2022; Shams Taleghani and Sheikholeslam Noori, 2022) investigated flow control basics and strategies to achieve transition delay, detachment prevention, lift augmentation, drag reduction, vortex suppression, noise reduction, and heat and mass transfer enhancements. Taleghani, A. S., et al. (Bajalan et al., 2011; Mirzaei et al., 2012; Taleghani et al., 2018; Noori et al., 2020; Abdolahipour et al., 2021; Noori et al., 2021; Abdolahipour et al., 2022a; Abdolahipour et al., 2022b) investigated different phenomena like ionic wind velocity in quiescent air at atmospheric pressure caused by a dielectric barrier discharge plasma actuator, effect of modulated pulse jet vortex generator, Enhancing pressure on a supercritical high-lift wing by applying a Modular and Simple Pulse Jet Vortex Generator, flow field properties of a baseline single pulsed jet actuator, airfoil’s active flow control using a plasma actuator, acoustic streaming in a drop created by surface acoustic waves, a sessile drop’s dynamic behavior, and behavior of a circular cylinder with an airfoil through experimental methods. Luo, X et al. (Luo et al., 2021) provided a feature analysis on flow characteristics in the laminar unsteady incompressible flow regime when fluid flows past an oscillating circular cylinder. Incoming flows are affected by the drag force, while the lift force acts perpendicular to the drag force. As the flow field changes, the lift force coefficient, influenced by vortex shedding, becomes a valuable descriptor for the vortex condition. Wang, F., & Lam, K. M (Wang and Lam, 2021). presented a comprehensive study on the complex turbulent wake around a short wall-mounted cylinder immersed in a thick, turbulent boundary layer with an aspect ratio (AR = 2). The study highlighted an excellent comparison of the low-order statistics of velocity fields between PIV and LES, which does not necessarily guarantee a satisfactory reproduction of the coherent structures. Shahab, M., et al. (Shahab et al., 2021) presented a systematic study on a T-shaped control plate’s influence on fluid flow characteristics around a square cylinder at Re = 100–250 with varying lengths. The results revealed the existence of an optimum length for the T-shaped control plate that leads to a reduction in fluid forces. For Re = 100, 150, and 200, the optimum length is 0.5; for Re = 250, the optimum length is 2. Ahmad, S., et al. (Ahmad et al., 2021) presented a two-dimensional numerical study on the wake characteristics and Strouhal number (St) discontinuity in the flow past a rectangular cylinder. They observed different flow patterns with AR ranging from 0.05–1 and Re ranging from 75 to 150. They found that an aspect ratio exists where the St exhibited a discontinuity. Specifically, for Re = 145 and 150, a discontinuity in the St is observed at 0.5 ≤ AR ≤ 0.6. In a study by Shui, Q., et al. (Shui et al., 2021), numerical simulations were employed to investigate the flow characteristics across a pair of square cylinders arranged in tandem at Re = 100. Their research involved an in-depth exploration of the flow structures within the far-wake regions behind the downstream square cylinders, enabling the identification of the mechanisms responsible for their formation. Abbasi, W. S., et al. (Abbasi et al., 2021) numerically studied the flow control around two square cylinders using a flat plate set in the wake to investigate the optimum conditions for modifying vortex shedding and reducing fluid forces. The gap spacing varied between 0.5 ≤ G ≤ 10, with fixed Re = 150. They reported that the control plate did not always suppress fluid forces and control vortex shedding, as its presence in the wake could have critical effects on fluid forces and vortex shedding. Kumar, D., & Sen, S (Kumar and Sen, 2021). numerically investigated the flow-induced vibrations of two tandem square cylinders using a stabilized space-time finite-element algorithm at Re = 100 with mass ratio m* = 10. Both cylinders are placed in the co-shedding pattern gap spacing 5. In contrast, hysteresis is only detected around the onset of the lock-in regime. Seyed-Aghazadeh, B. et al. (Seyed-Aghazadeh et al., 2021) experimentally studied Flow-induced vibration (FIV) of the high-mass ratio of isolated and tandem flexible cylinders with fixed boundary conditions subjected to uniform flow. They examined the dynamic response of the cylinder for a range of center-to-center gap spacing, covering 3 to 9 times the cylinder diameter. Qiu, T. et al. (Qiu et al., 2021) conducted a numerical study on the spacing effects in 2D vortex-induced vibrations of tandem square cylinders at Re = 150 and 2 ≤ XG ≤ 6. They find four distinct wake patterns in the lock-in regime: 2S pattern with chaotic wake flow, the 2S pattern of the reattachment regime, the two-row vortex pattern of the reattachment regime, and the two-row vortex pattern of the co-shedding regime. Zhou, C. Y (Zhou et al., 2021). investigated the wake and force statistics of flow past two tandem rectangles at four different Reynolds numbers (75, 100, 125, and 150) with 0.5 ≤ XG ≤ 10. The authors presented detailed wake patterns and force coefficient results for different geometrical configurations and Reynolds numbers. Islam, S. U., et al. (Islam et al., 2018) presented a comprehensive numerical investigation into the aerodynamic behavior of three inline rectangular cylinders with varying AR = 0.25 to 3 and XG = 0.5 to 7 with Re = 150. They indicated that the AR significantly influences the flow behavior around the rectangular cylinders. The study reveals that some specific aspect ratios may lead to vortex shedding, while others exhibit more stable flow patterns. Rahimi, H., et al. (Rahimi et al., 2020) numerically presented a comprehensive study of flow behavior between two side-by-side (SBS) circular cylinders at large Reynolds number 1× 10⁶ with eleven different gaps spacing to cover both laminar and turbulent flow regimes. They observed that for different gap spacing of cylinders led to variations in the vortex shedding frequency and intensity, impacting the aerodynamic forces experienced by the cylinders. Zia ul, I., et al. (Zia ul et al., 2021) discussed the study of fluid flow past two square cylinders positioned SBS and explored using dual splitter plates as a flow control technique. They declared that an increase in splitter plate length influences the wake structure by enhancing the wake length by stabilizing the shear layers before their roll-up. Rahman, H., et al. (Rahman et al., 2022) investigated the fluid flow dynamics around two SBS square cylinders with and without a splitter plate with the help of LBM. Fixed Reynolds number (Re = 150) with various gap spacing (0 ≤ YG ≤ 4) and configurations of the square cylinders are considered to explore different flow regimes and conditions. Additionally, at intermediate gap spacings, these values are reduced for all values of splitter heights. Chatterjee, D., et al. (Chatterjee et al., 2010) numerically investigated the flow across a row of five square cylinders set SBS and normal to the oncoming flow at Re = 150 and four gap spacings (1.2, 2, 3, and 4). They examined that at small gaps values, the flow exhibited chaotic behavior with prominent secondary frequencies. Aboueian, J. et al. (Aboueian and Sohankar, 2017) numerically investigated the flow across two square cylinders arranged in staggered alignment. In the modulated periodic regime, it was found that the multiple frequencies observed in the global forces acting on the downstream cylinder were more closely related to differences in the vortex-shedding frequencies of individual cylinders rather than individual shear layers. Hishikar, P. et al. (Hishikar et al., 2021) analyzed the influence of different flow parameters past two circular cylinders in an affected region using different CFD simulations at 40 ≤ Re ≤ 5 × 10⁶. They determined that for different Re and G the Strouhal number does not increase linearly in the tandem alignment of the cylinders. Nazeer, G., et al. (Nazeer et al., 2019) focused on the flow characteristics around a configuration of seven square cylinders arranged in a staggered pattern using SRT-LBM to simulate the flow behavior. They analyzed vortex-shedding mechanisms occurring in the wake of the downstream row of cylinders. They also found that the secondary cylinder interaction frequency had a considerable impact on the hydrodynamic forces experienced by the cylinders. Islam, S. U., et al. (Islam et al., 2019) presented a numerical exploration of the flow behavior around multiple staggered rows of square cylinders. The study investigates the combined effects of Reynolds number and gap spacing on the two-dimensional cross-flow across the staggered configuration. At higher Reynolds numbers and specific gap spacings, the primary vortex shedding frequency dominates the flow behavior, while the secondary frequency becomes negligible. Fezai, S., et al. (Fezai et al., 2021) conducted a numerical examination of flow behavior around a configuration of three-square cylinders staggered in two triangular arrangements at 1 ≤ Re ≤ 110. Their research establishes the critical Reynolds number for both triangular configurations and highlights the substantial impact of the arrangement type on the bifurcation point. Abdolahipour, S (Abdolahipour, 2023). numerically examined the influence of low and high-frequency actuation on enhancing the aerodynamic capabilities of the supercritical airfoil for potential integration into a high-lift or flight control mechanism. The results of the study indicated that employing pulsed jet actuation upstream of the separation point on the supercritical airfoil at a high angle of attack successfully delayed flow separation across all actuation frequencies.
After conducting an extensive review of existing research, it has been observed that previous studies have predominantly focused on circular and square cylinders. The present study aims to contribute to understanding the flow past rectangles arranged in a staggered configuration. This research aims to open new drag reduction and flow control possibilities in practical engineering applications.
2 Lattice Boltzmann Method
In the present study, the Lattice Boltzmann method (LBM) is employed as a numerical technique to solve the governing equations of fluid flow. LBM is a relatively new computational fluid dynamics (CFD) method compared to traditional approaches like finite difference, finite volume, and finite element methods (Mohammad, 2011a). It has gained popularity in the last 2 decades due to its numerous advantages, including easy implementation, sufficient accuracy, handling complex geometries, and parallel computation [ (Chopard et al., 2002)–39]. LBM is considered a powerful tool for investigating fluid flow problems numerically.
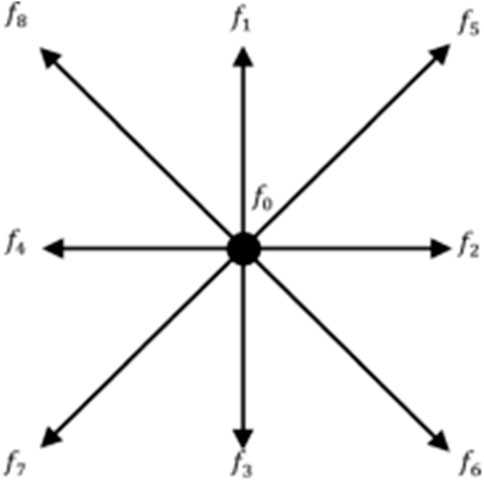
In LBM, different lattice models are used based on the specific problem under consideration (Mohammad, 2011b). For two-dimensional (2D) problems, the two-dimensional nine-velocity-particles model (D2Q9) is commonly used and employed in the current study. This model consists of nine discrete velocity directions, eight moving particles along the axis and diagonal directions, and one stationary rest particle at the model’s center (see Figure 1).
The above equations (1) and (2) can be derived from the Boltzmann equation, which describes the behavior of particles in a gas using the Chapman-Enskog expansion (Viggen, 2009). However, in LBM, a simplified form of the Boltzmann equation, known as the lattice Boltzmann equation, is used to simulate fluid flow instead of directly solving the Navier-Stokes equations.
The lattice Boltzmann equation (LBE) represents the evolution of discrete distribution functions, fi, which indicate the position of particles in the lattice at time t,
Where,
The constraints for density and velocity are expressed as follows (Okajima, 1982):
The lattice Boltzmann equation (Eq. 3) involves streaming (LHS) and collision (RHS) steps, representing the movement and interactions of particles in different directions. The LBM approach allows for efficient and accurate simulation of nearly incompressible flows, making it suitable for various applications in fluid dynamics research and modeling.
3 Problem description
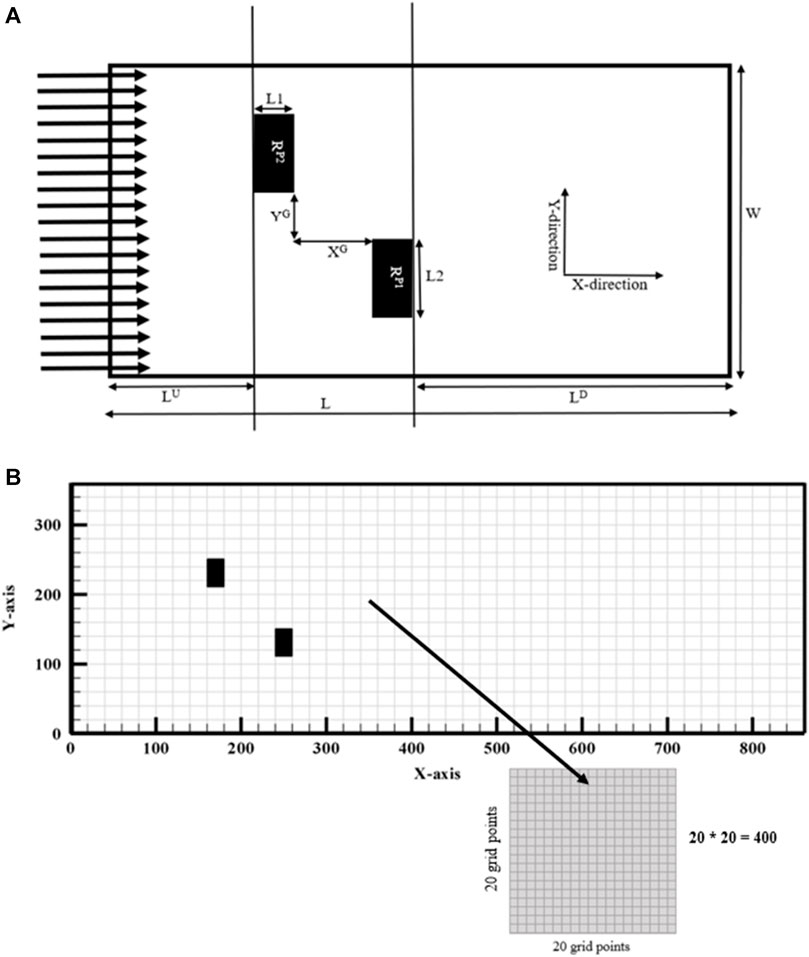
This numerical study aims to investigate the variation in flow characteristics between two rectangular polygons, RP1 and RP2, due to varying parameters of practical significance. In the geometry illustration see Figure 2A, two rectangular polygons, RP1 and RP2, are aligned vertically and placed along the center line of a rectangular flow stream. Here, vertical alignment defines the difference in length and width of the polygons. The length “L1″ of the polygon is the side parallel to the X-axis, whereas the width “L2″ of the polygon is the side parallel to the Y-axis. When L2 ≥ L1, polygons are aligned vertically so that the flow separation region is much larger than the flow reattachment region. L1 is d, L2 is 2d, with an aspect ratio (AR) of 0.5, where AR is the length-to-width ratio. d represents the dimensions of a rectangular polygon. “L" represents the total length of the channel, while “W" represents the total width of the rectangular flow stream. Upstream distance “LU” is the distance from the inlet to the RP2 polygon, where the flow is laminar and continuous. Downstream distance “LD” is the distance from the RP1 polygon to the outlet, where the flow is rotational and turbulent. In general, “G" represents the distance between two polygons. In this investigation, the X-direction gap “XG” and the Y-direction gap “YG” have the same value. G = G*/d gives the dimensionless distance between two polygons. The total length of the rectangular computing channel is now L = LU + L1 + XG + L1 + LD. The distribution of mesh (L × W) for the proposed investigation is shown in Table 1. LU = 8d, LD = 25d and W = 16d is shown to be a suitable computational domain.
The Lattice Boltzmann numerical algorithm simulates flow over a single square polygon, three square polygons in tandem and side by side, and now staggered polygons. Simulations are carried out for flow over two staggered square polygons at G = 1.5 for grid sizes d = 10, 20, and 30. The computational domains for d = 10, 20, and 30 grid sizes are chosen to be (366 × 116, 731 × 231, and 1,096 × 346). Table 2 calculates mean drag coefficient for different grid sizes. Increased grid size shows that CDMEAN monotonically decreases until d = 30. Grid size refinement can increase computing cost and impact physical parameter critical values. Thus, analysis shows that d = 20 is the best grid size in terms of accuracy, efficiency, and computing cost see Figure 2B.
The flow experienced no-slip boundary conditions (u = v = 0) on the walls of the polygons. The no-slip boundary condition is applied using the bounce-back boundary condition (Namvar and Leclaire, 2023) when using LBM. The bounce-back technique states that distributed particles return to their original node after a given time. Fitting the unknown density distribution function on the wall node is most manageable with the bounce-back approach. The mathematical expression of the bounce-back scheme is derived from the kinetic equation of modulo 8. By taking distribution functions f4, f7, and f8 at nodes 4, 7, and 8, particles impact the solid surface, are reflected in opposite directions, and occupy the space of particles with distribution functions f2, f5, and f6 by the following expression
The flow enters the system with a uniform inflow velocity (u = Uo, v = 0 and Uo = 0.04385964). The viscous nature of the fluid causes it to separate into parts. It spins through the polygons and proceeds towards the exit of the channel. There, the fluid encounters the convective boundary conditions in the form of the discretized distribution function is given as follows
which are employed to restrict the flow of the opposite direction in the channel. Because the width of the rectangular flow stream needs to be chosen carefully, such that the lower and the higher walls do not affect the flow before and after the Fluid Dynamical system, periodic boundary conditions are imposed. Generally it is demonstrated as
4 Code validation analysis
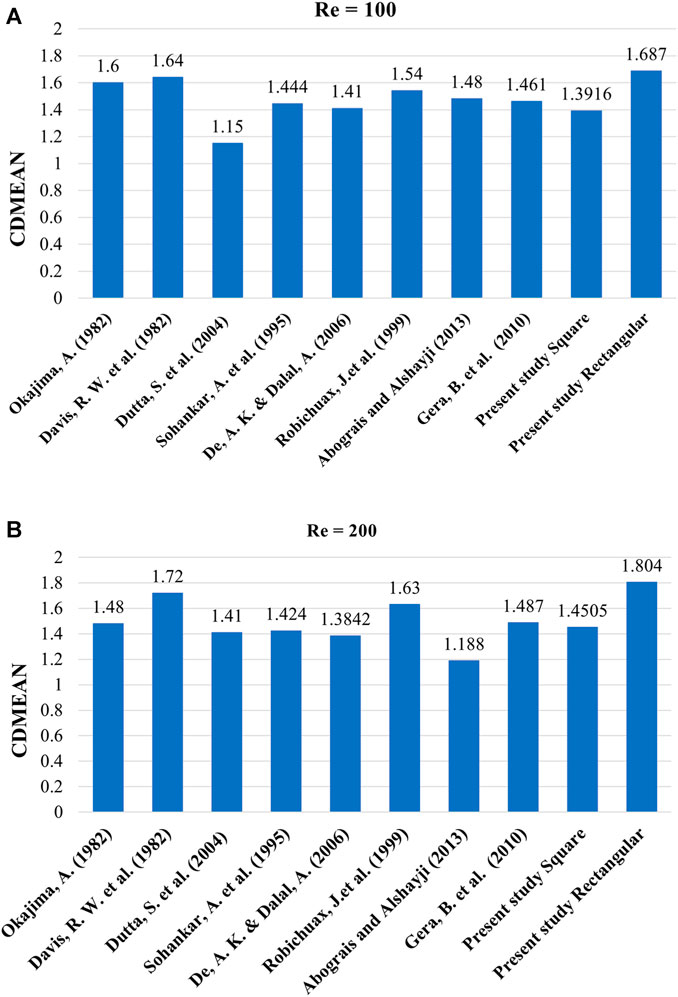
The lattice Boltzmann Method (LBM) has been utilized to investigate flow characteristics over various arrangements of bluff bodies, including single, numerous aligned in tandem, side-by-side (SBS), and staggered configurations. To assess the accuracy of the current code, simulations were performed on an isolated square polygon and an isolated rectangular polygon, both at a Reynolds number of 150. Two parameters that hold practical significance, namely, the drag coefficient (CD) and the Strouhal number (St) are computed. The results obtained from the simulations are compared with the findings reported in the existing scholarly literature, see Figures 3A, B.
The obtained results at Re = 100 and 200 Figures 3A, B concur highly with the previously conducted experimental and numerical investigations of Okajima, A., (Okajima, 1982), Davis, R. W. et al., Dutta, S. et al., Sohankar, A. et al., Robichuax, J. et al., and Gera, B. et al. (Davis and Moore, 1982; Sohankar et al., 1995; Robichaux et al., 1999; Dutta et al., 2004; Gera et al., 2010). Minor disparities are apparent due to variations in experimental and numerical setups employed by different scientists. These variations can introduce changes to the outputs of the problems, such as modifications to boundary conditions, channel length, width, mesh resolution, and the choice of fluid. The characteristics can influence the CD and St of the situation under consideration.
Simulations were carried out for two square polygons in both side-by-side (SBS) and staggered arrangements to validate the code further. The simulations were conducted at a Reynolds number 73 and a gap ratio 4. The outcomes are compared with the research conducted by Islam, S. U (Islam et al., 2019). and Agarwal, A (Agrawal et al., 2006). presented in Table 3. This comparison highlights the substantial influence of various configurations of bluff bodies in a crossflow on the physical properties of the fluid. The present discourse has established that utilizing the 2D Lattice Boltzmann code is a reliable approach for examining the fluid dynamics of the flow through two rectangular polygons arranged in a staggered configuration.
A comparative table is constructed between square and rectangular polygon at different Re to validate the code further. Remarkable results are observed. Values of CDMEAN for different Reynolds numbers are greater for rectangular polygon as compared to square polygon. Similar behavior is obseved by CLRMS. On the Contrary, values of St for different Reynolds number are greater for Square polygon as compared to rectangular polygon see Table 4. Similar behavior is observed for CDRMS.
5 Results and discussion
This numerical study examines the flow characteristics of two rectangular polygons positioned vertically in a staggered arrangement in a two-dimensional flow field. The Reynolds Number (Re =
The calculation of VSM involves the utilization of the two-dimensional vorticity equation. The mathematical expression for the vorticity at a specific place inside a flow field is given by the curl of the linear velocity vector, denoted as
Before examining the flow characteristics surrounding two staggered vertically positioned rectangular polygons, we investigated the flow interaction with a square and vertically positioned rectangular polygon at a Reynolds number 150. Figures 3A–L presents the results as a vortex snapshot, time histories of CD and CL plots, power spectrum plots of CL, velocity and pressure plots.
The phenomenon of vortex shedding is apparent in Figures 4A, B, wherein both square and vertically positioned rectangular polygons exhibit the shedding of vortices alternately. Solid lines indicate that negative vortices are being shed from the top left corner of the polygons. In contrast, positive vortices, represented by dashed lines, are being shed from the bottom left corner. The vortices exhibit vertical movement and alternate motion within the distant region, forming a consistent pattern known as the Von Karman Vortex Street (VKVS). This flow regime is exclusive to a specific range of velocities, as it limits the range of Reynolds numbers employed.
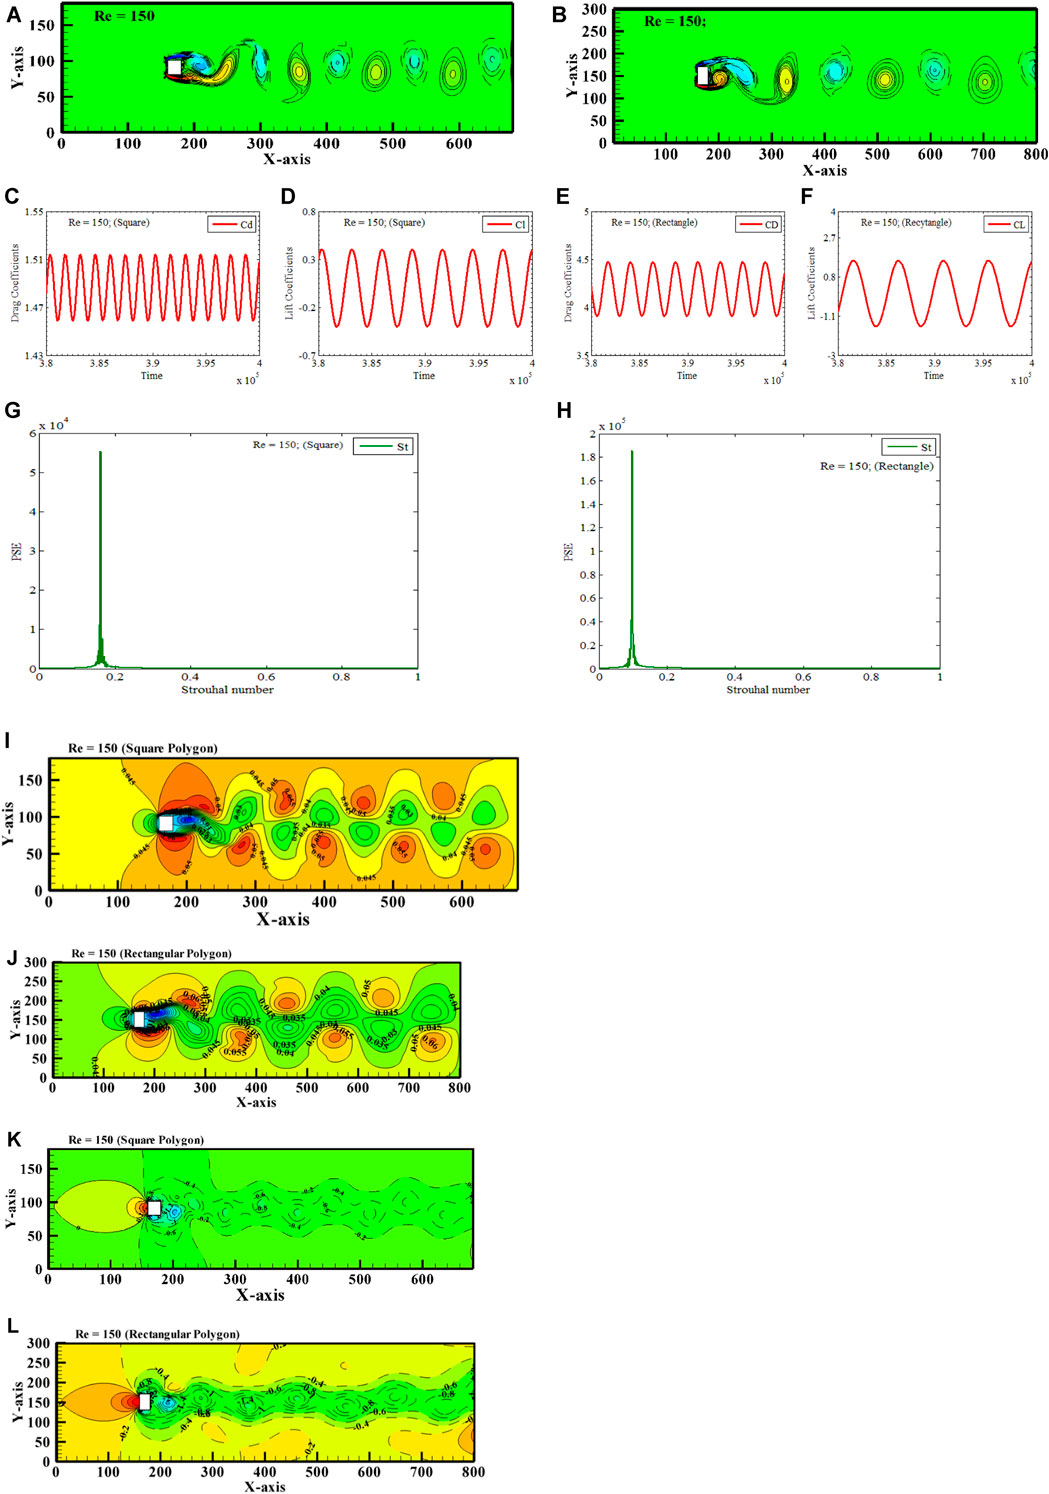
FIGURE 4. Von Karman Vortex Street (A, B) Vorticity contours (C–F) Time-trace signals of CD and CL (G, H) Power Energy Spectrum of CL, (I, J) Velocity profile and (K, L) Pressure profile for circular and vertically positioned rectangular polygons.(a), (b).
The periodic behavior of the alternate shedding of vortices is confirmed by the time-history plots of CD and CL, as shown in Figures 4C–F. It has been found that the time of CL is consistently double that of CD. The spectrum graphs exhibit a single peak for square and vertically positioned rectangular polygons. The peak of utmost elevation guarantees the presence of rhythmic characteristics in the flow, as depicted in Figures 4G, H. The laminar flow subjected to square and vertically positioned rectangular polygons has St values of 0.1608 and 0.1630, correspondingly.
Due to viscosity, fluid sticks to the square and rectangular polygons (Fig, 4 (i-l) and has almost little velocity. Fluid velocity increases as it flows away from the polygon’s surface, causing a velocity gradient in the boundary layer. The boundary layer forms as fluid travels along a polygon surface. Viscous forces slow fluid in the boundary layer. This slowdown is more significant near solid surfaces. The velocity profile over the boundary layer is usually parabolic, with the maximum velocity at the free stream (far from the polygon surface) and zero at the polygon surface. The boundary layer’s polygon-fluid interface has a shear stress, which measures the fluid’s force per unit area on the polygon. The fluid experiences a pressure gradient at square or rectangular polygons due to viscous forces. Pressure gradients occur from velocity gradients in the boundary layer, the fluid layer next to the solid surface, where viscous effects are significant. The fluid motion-describing Navier-Stokes equations link shear stress and pressure gradient. Pressure gradient and shear stress interact in the boundary layer. Viscous forces may cause a pressure drop when the fluid flows along the polygon surface, especially in the boundary layer. This pressure reduction is caused by fluid kinetic energy to internal energy conversion. As fluid flows across a polygon surface, the boundary layer may separate. This separation may alter pressure distribution and flow patterns. Reattaching the boundary layer can restore pressure. Pressure is usually highest at the stagnation point when fluid meets the polygon. When the fluid rests, pressure energy becomes kinetic energy. This pressure behavior depends on fluid viscosity, flow velocity, and solid object geometry.
In the subsequent sections, we will examine the unique flow characteristics that arise when fluid flows through two horizontally positioned rectangular polygons in a staggered pattern. The primary objective of this study is to examine the impact of flow separation and re-attachment phenomena after interaction. CD1 and CD2 show the drag coefficients of RP1 and RP2, CL1 and CL2 show the Lift coefficients of RP1 and RP2, and St1 and St2 show the Strouhal number of RP1 and RP2, respectively.
5.1 Solitary Contorted Bluff Body Vortex Street
In this numerical study, the Reynolds number is fixed at 150, and the XY-gap is varied from 0–6, so distinct vortex streets are observed at different combinations of Re, XG, and YG. A Solitary Contorted Bluff Body Vortex Street occurs at Reynolds number 150, X-gap spacing 0, and Y-gap spacing 0, respectively. (Re, XG, YG) = (150, 0, 0) is the only combination of chosen physical parameters for which this vortex street is obtained see Figures 5A–E. Two rectangular polygons, RP1 and RP2, are placed vertically along the center line of the computational domain. Since the XY-gap spacings between the polygons are zero, due to which two polygons are acting as a solitary bluff body, see Figure 5A. Also, when RP1 and RP2 are visualized individually, they appear as regularly shaped polygons, but at zero spacing between them, both RP1 and RP2 combinedly act as a single bluff body having an irregular structure called a contorted bluff body. The vortex shedding process for Solitary Bluff Body flow is represented in the gyre snapshot see Figure 5A. The uniform and laminar flow interacts with RP2 firstly due to the staggered alignment of polygons. It is observed that flow separation takes place in the form of negative and positive vortices. The stagnation point is relatively observed for RP2, but for RP1, no clear separation is visible. A clear negative vortex is shedding from the top corner of RP2. The positive vortex separating from the bottom corner of RP2 is re-attached with the incoming flow behind RP1, so no flow separation occurs from the top corner of RP2. No flow is observed passing between the polygons due to zero gap spacing. The positive vortices shedding from the bottom corners of RP2 and RP1 are mixing, and a significant positive vortex is shedding from the bottom of RP1. An alternate movement of the single positive and negative vortices is observed throughout the computational domain. Due to the vertical alignments of polygons, the wake of flow is centralized and widened. Both negative and positive vortices are round and oval. This type of vortex street is also observed for square and rectangle single polygons, which generate Von Karman Vortex Street. Here, we conclude that when two solid obstacles in the shape of rectangular polygons are nearby, i.e., they act as a single obstacle and generate a flow like a single solid obstacle with an expanded wake.
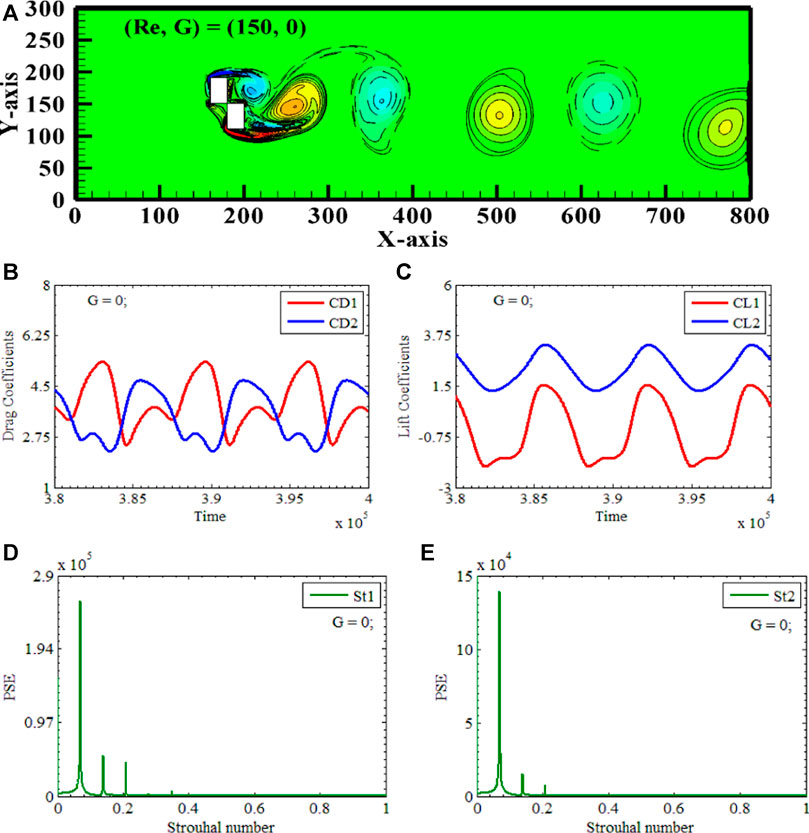
FIGURE 5. Solitary Contorted Bluff Body Vortex Street (A) Vorticity contours (B, C) Time-trace signals of (CD1 & CD2) and (CL1 & CL2) (D, E) Power Energy Spectrum of CL1 and CL2.
The above observations regarding the shedding pattern can also be verified by looking into the time series of the drag and lift coefficients of two vertically aligned polygons, RP1 and RP2, respectively. Figures 5B, C for (Re, XG, YG) = (150, 0.0, 0.0) shows that both (CD1 & CD2) and (CL1 & CL2) have a periodic behavior. The magnitude of CD1 is observed to be greater than that of CD2. The amplitudes of CL1 for the first rectangular polygon is 1.5, and that for the second polygon is 3.3, implying that the lift coefficient of the second polygon is greater than the first one. In contrast, the amplitude of CD1 and CD2 for the first rectangular polygon is 5.486 with a, and that for the second polygon is 4.9. The frequency of oscillation for both drags and lift coefficients is the same. This finding aligns with the empirical evidence indicating that the occurrence of an extremum in lift is also associated with the highest level of drag. The phenomenon is further explained by the power spectrum analysis of CL1 and CL2, respectively see Figures 5D, E. For (Re, XG, YG) = (150, 0.0, 0.0), single cylinder interaction frequency is observed for both polygons. Two baby peaks along with the primary are observed at the right side of the single cylinder interaction frequency, indicating the amalgamation of shear layers.
5.2 Contorted descending bluff body vortex street
A Contorted Descending Bluff Body Vortex Street appears at Reynolds number 150, with X-gap spacing of 0.1 and Y-gap spacing of 0.1, respectively. (Re, XG, YG) = (150, 0.1, 0.1) is the only combination of physical parameters to obtain this vortex street. Two rectangular polygons, RP1 and RP2, are again placed vertically along the center line of the computational domain, having XY-gap spacings 0.1 between the polygons, due to which two polygons are acting as non-solitary bluff bodies, see Figure 6A. Also, when RP1 and RP2 are visualized individually, they appear as regularly shaped polygons, but at minimal gap spacing (0.1) between them, both RP1 and RP2 again combinedly act as a bluff body having an irregular structure called a contorted bluff body. Figure 5A depicts the vortex shedding process during the Contorted Descending Bluff Body movement as seen in the gyre photograph. Uniform and laminar flow initially interacts with RP2 due to the asymmetrical arrangement of polygons. Observations indicate that flow separation occurs in terms of negative and positive vortices. For RP2, the stagnation point is quite evident, whereas for RP1, no distinct separation is observed. A distinct negative vortex emanates from the upper corner of RP2 near 340d. The positive vortex that separates from the bottom corner of RP2 stretches and rejoins with the incoming flow behind RP1. There is a slight flow between the top corner of RP1 and the lower corner of RP2 due to minimal gap spacing. The positive vortices shedding from the bottom extremities of RP2 and RP1 combine, and a giant positive vortex is shedding from the bottom of RP1. The alternate movement of positive and negative vortices is observed throughout the computational domain see Figure 6A. Due to the vertical alignment of polygons and 0.1 gap spacing between polygons, the flow wake is widened and deflected to the computational domain’s lower wall. Both negative and positive vortices are round, oval, and spike shaped. This type of vortex street is to Von Karman Vortex Street flow with two differences, i.e., wake is descending, and vortex is showing spiked behavior at 450d.
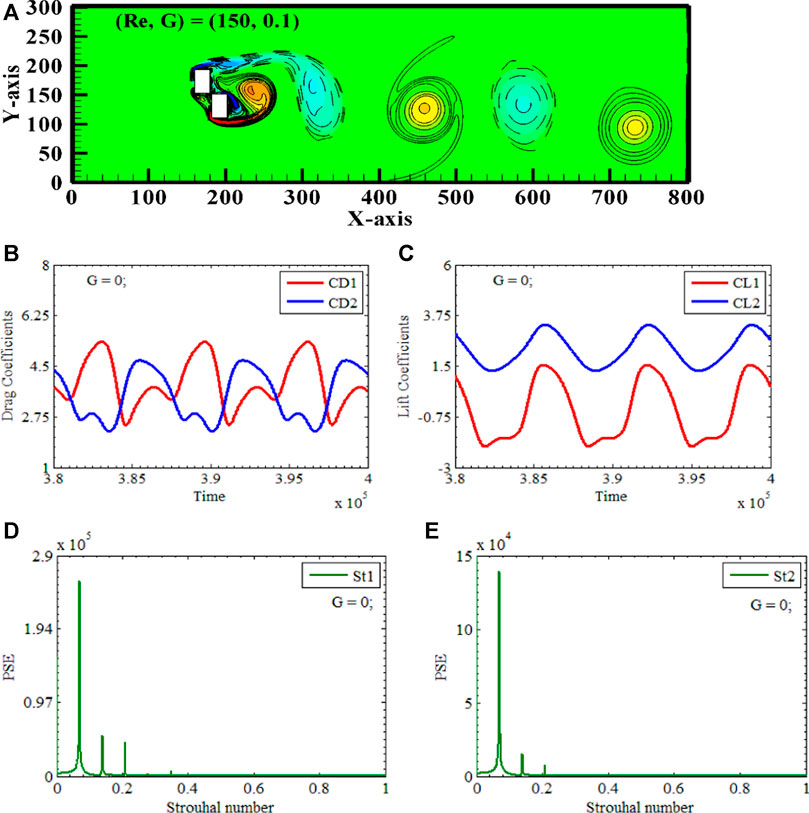
FIGURE 6. Contorted Descending Bluff Body Vortex Street (A) Vorticity contours (B, C) Time-trace signals of (CD1 & CD2) and (CL1 & CL2) (D, E) Power Energy Spectrum of CL1 and CL2.
The temporal histories are discussed for drag and lift forces. Here, CD1 and CD2 are highly periodic signals. The amplitude of CD1 is much higher when compared to CD2 because RP1 interacts with already disturbed flow. The behavior of the lift coefficient is opposite to that of drag. In Figure 4B, in-phase fluctuations for both drag and lift are observed for both polygons. The sinusoidal behavior of lift is observed for an upstream polygon. Primary Vortex shedding frequency (PVSF) and secondary cylinder frequencies (SCF) are observed for rectangular polygons. The facts about the shedding pattern can be corroborated by examining the time series data of the drag and lift coefficients for two vertically aligned polygons, denoted as RP1 and RP2, respectively. In Figures 6B, C, it can be shown that for the given values of (Re, XG, YG) = (150, 0.1, 0.1), CD1, CD2, CL1, and CL2 show a periodic behavior, while CL2 exhibits a sinusoidal pattern with amplitude of 3.2. The CD1 continuously shows a linear increase, with the highest value of 5.375. The drag coefficient for CD2 has a constant increase in amplitude, indicating that the maximum value is identical for each cycle. CL2 is clearly greater than CD2. The phenomenon can be further elucidated by utilizing power spectrum analysis on CL1 and CL2. When the values of (Re, XG, YG) are set to (150, 0.1, 0.1), it is noticed that the single cylinder interaction frequency occurs for both polygons see Figures 6D, E. Two small peaks can be detected on the right side of the frequency at which the interaction of a single cylinder occurs. These peaks suggest that a small gap significantly impacts flow due to jet flow that affects the flow and deflects the wake towards the lower boundary.
5.3 Solitary contorted bluff body distorted vortex street
A Distorted Von Karman Street Vortex Street appears at Reynolds number 150, with X-gap spacing of 0.25 and Y-gap spacing of 0.25, respectively. (Re, XG, YG) = (150, 0.25, 0.25) is the only combination of physical characteristics to obtain this vortex street. Figure 7A demonstrates that RP1 and RP2 are positioned vertically along the center line of the channel. The XY-gap spacings are increased to 0.25 between the polygons, due to which two polygons act as independent bluff bodies. In addition, when RP1 and RP2 are viewed separately, they appear as regularly shaped polygons. However, at minimal gap spacing (0.25) between them, both RP1 and RP2 function as two independent bluff bodies with a regular structure. In the gyre snapshot, independent fluid separation occurs from upstream and downstream polygons. The floe separation from the lower corner of RP2 and the upper corner of RP1 is intermixing, creating a jet flow. The jet flow between the cylinders affects the wake of flow. The sizeable positive vortex is shedding near 400d. We observe that vortices have damaged their size and shape in the far domain. Now, vortices are scattered toward the lateral walls. The alternate shedding mechanism is present in the near wake but has lost its occurrence in the far wake. Vortices are distorted, slender, rounded, and dispersed in the domain. A minimal gap spacing can change the vortex street.
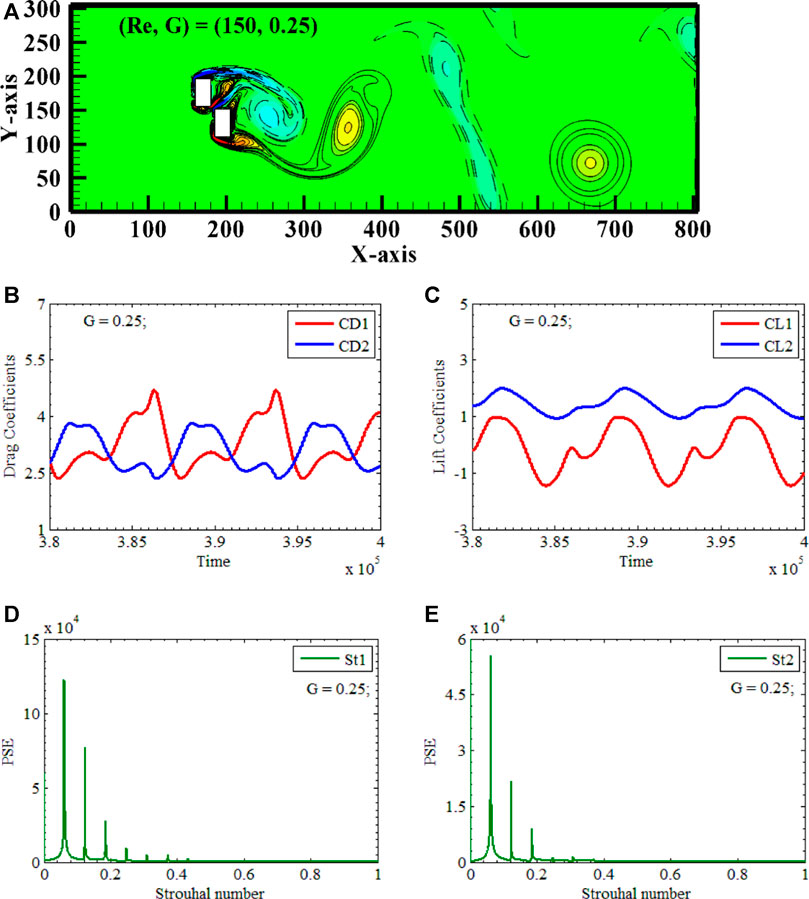
FIGURE 7. Solitary Contorted Bluff Body Distorted Vortex Street (A) Vorticity contours (B, C) Time-trace signals of (CD1 & CD2) and (CL1 & CL2) (D, E) Power Energy Spectrum of CL1 and CL2.
Figure 7A depicts the vortex-shedding process during the Contorted Descending Bluff Body movement. RP2 initially interacts with uniform and laminar flow due to the asymmetrical arrangement of polygons. Observations suggest that negative and positive vortices characterize flow separation. For RP2, the stagnation point is quite apparent, whereas for RP1, there is no discernible separation. A distinct negative vortex emanates from the upper corner of RP2 near 340d. Behind RP1, the positive vortex that separates from the bottom corner of RP2 stretches and rejoins the incoming flow. Due to minimal gap spacing, there is a minor flow between the upper corner of RP1 and the lower corner of RP2. Positive vortices emanating from the bottom extremities of RP2 and RP1 combine, and a massive positive vortex emanates from the bottom of RP1. The movement of positive and negative vortices alternates throughout the computational domain. The flow discharge is widened and deflected towards the lower wall of the computational domain due to the vertical alignment of polygons and 0.1 gap spacing between polygons. Both positive and negative vortices are spherical, oval, and spiked. This vortex street differs from Von Karman Vortex Street flows in two ways: the wake is descending, and the vortex exhibits spiked behavior at 450d. Examining the time series data of the drag and lift coefficients for two vertically aligned polygons, designated as RP1 and RP2, respectively, is a method that can provide supporting evidence for the assertions made concerning the shedding pattern. It can be seen in Figures 7B, C that CD1, CD2, CL1, and CL2 show periodic behaviors for the values of (Re, XG, YG) equal to (150, 0.25, 0.25). CD1 has an amplitude of 4.75, while CD2 has 4. The drag curves of both polygons are attractive to each other. At the same time, the lift curve of the second polygon is higher than the lift curve of the first polygon. Due to a small gap between the polygons, we can see the distorted vortices in a far domain.
It is seen that the single cylinder interaction frequency is present for both polygons when the values of (Re, XG, YG) are set to (150, 0.25, 0.25), respectively. On the right-hand side of the SCF, there are visible signs of two minor peaks. These peaks are more significant than those occurring for XG, YG = 0.1. These peaks imply that a relatively tiny gap substantially impacts the flow due to jet flow, which influences the flow and directs the wake toward the lower and upper boundaries of the computational domain see Figures 7D,E.
5.4 Contorted ascending bluff body vortex street
A Contorted Ascending Bluff Body Vortex Street appears at Reynolds number 150, with X-gap spacing of 0.1 and Y-gap spacing of 0.1, respectively. (Re, XG, YG) = (150, 0.5, 0.5) is the only combination of physical parameters to obtain this vortex street. Two rectangular polygons, RP1 and RP2, are again placed vertically along the center line of the computational domain, having XY-gap spacings 0.5 between the polygons, due to which two polygons are acting as non-solitary bluff bodies, see Figure 8A. Figure 8A depicts the vortex shedding process during the Contorted Ascending Bluff Body movement as seen in the gyre photograph. Uniform and laminar flow initially interacts with RP2 due to the asymmetrical arrangement of polygons. When RP1 and RP2 are visualized keenly, they appear as regularly shaped independent polygons. However, the presence of nominal stream-wise and transverse-wise gaps of 0.5 between them dramatically impacts the development of the vortex street. We can see that an independent separation of flow is taking place from both polygons. Flow is separated from the top and bottom corners of the polygons. But it is also visible that the negative vortex detaching from the upper corner of RP2 is growing into a well-established negative vortex visible with dotted lines. Similarly, the positive vortex separating from the lower edge of RP1 is sprouting into a well-established positive vortex visible with solid lines. We will highlight the impact of the 0.5 gap between the polygons. The flow is well separated from the lower corner of RP2 and the upper corner of RP1 see Figure 8A. However, due to minimal gap spacing, the formation of positive and negative vortices is completely suppressed, so we see the sandwiching behavior of the vortices. Due to this combining mechanism of vortices, a jet flow impact appears, pushing the sandwich vortices toward the upper boundary. All this mechanism appears near the wake of two polygons. In the far domain, we see that alternate vortices are moving, which are slightly enlarged, having spikes and irregular shapes. This type of flow behavior is called Von Karman Vortex Street Flow (VKVSF), a benchmark of a single square cylinder. Here, two isolated rectangular polygons give a flow phenomenon of a single cylinder in ascending VKVSF; that’s why this flow is called the Contorted Ascending Bluff Body Vortex Street. Due to the vertical alignment of polygons and 0.5 gap spacing between polygons, the flow wake is widened and deflected to the computational domain’s upper wall.
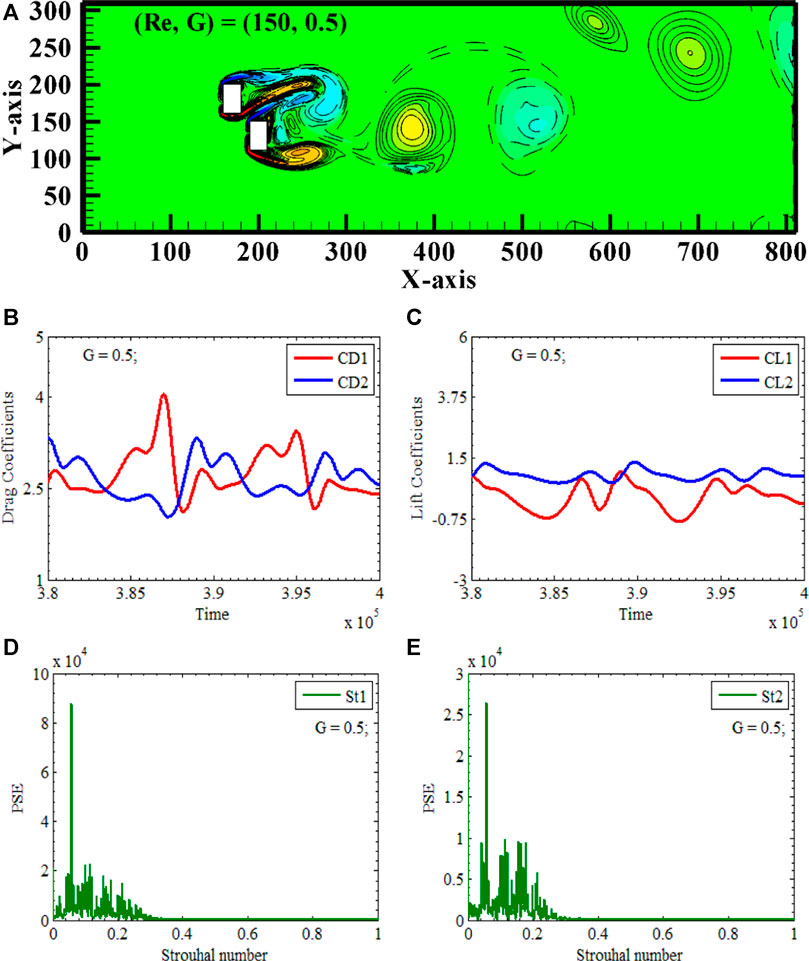
FIGURE 8. Contorted Ascending Bluff Body Vortex Street (A) Vorticity contours (B, C) Time-trace signals of (CD1 & CD2) and (CL1 & CL2) (D, E) Power Energy Spectrum of CL1 and CL2.
The time series of the drag and lift coefficients of two vertically aligned polygons can confirm the shedding pattern. Figures 8B,C shows that (CD1 & CD2) and (CL1 & CL2) are strongly modulated curves at (Re, XG, YG) = (150, 0.5, 0.5). RP1 interacts with the disturbed flow; CD1 amplitude is 4.0, compared to CD2, which is 3.2. Both lift coefficient curves interact at this gap spacing, indicating the same lift coefficient at some places. Lift curves did not interact before this gap. Rectangular polygons have primary vortex shedding frequency and multiple secondary cylinder interaction frequencies before and after the PVSF see Figures 8D,E. The enlargement of vortices and the spread of the wake toward the upper wall of the computational domain confirm the ascending feature of the flow.
5.5 Jumbled vortex street
A Jumbled Vortex Street appears at Reynolds number 150, with X-gap and Y-gap spacing of 0.75, 1, & 1.5, respectively. (Re, XG, YG) = (150, 0.75, 0.75) is the only case we will discuss in detail. Two rectangular polygons, RP1 and RP2, are again placed vertically along the center line of the computational domain, having increased XY-gap spacings of 0.75 between the polygons, due to which two polygons are acting as independent bluff bodies, see Figure 9A. This flow is distinguished by the absence of any discernible flow structure see Figure 9A. Independent flow separation occurs from RP1 and RP2 in the form of upper and lower shear layers, which then re-attach themselves to the horizontal surfaces of both polygons. These shear layers are spreading downward in a near computational domain. In the near domain of the channel, a chaotic flow is produced because of the upper shear layer of RP1 combining with the lower shear layer of RP2 through intermixing. The vortices shedding from the lower corner of RP1 is well defined. Still, the vortices shedding from the upper corner of RP1 & RP2 and the lower corner of RP2 are amalgamated to form a triangular-shaped vortex deflected to the lower boundary of the domain. No alternate shedding is visible in the far domain. Between 400d and 500d, the independent positive vortex is present, followed by the mixture of negative and positive vortices. Because of the expansion and amalgamation of the shear layer, the normal shedding of vortices is disrupted, which ultimately results in chaos; due to this character, the flow is named as the jumbled Vortex Street. The observations about the shedding pattern can be corroborated by examining the time series of the drag and lift coefficients of two vertically aligned polygons, denoted as RP1 and RP2, respectively. In Figures 9B, C, it can be shown that for the given values of (Re, XG, YG) = (150, 0.75, 0.75), both (CD1 & CD2) and (CL1 & CL2) exhibit a highly modulated behavior. The amplitude of CD1 is 3.1, much higher when compared to CD2, which is 2.8 because RP1 interacts with already disturbed flow. Both lift coefficient curves interact at this gap spacing, showing that they have a standard lift coefficient at some points. Before this gap spacing, lift curves did not interact with each other. Primary Vortex shedding frequency and multiple SCF are observed for rectangular polygons see Figures 9D, E. It is observed that modulation and multiple peaks before and after PVSF indicate complete Jumbled flow. The distortion of vortices and amalgamation of vortices support Jumbled flow.
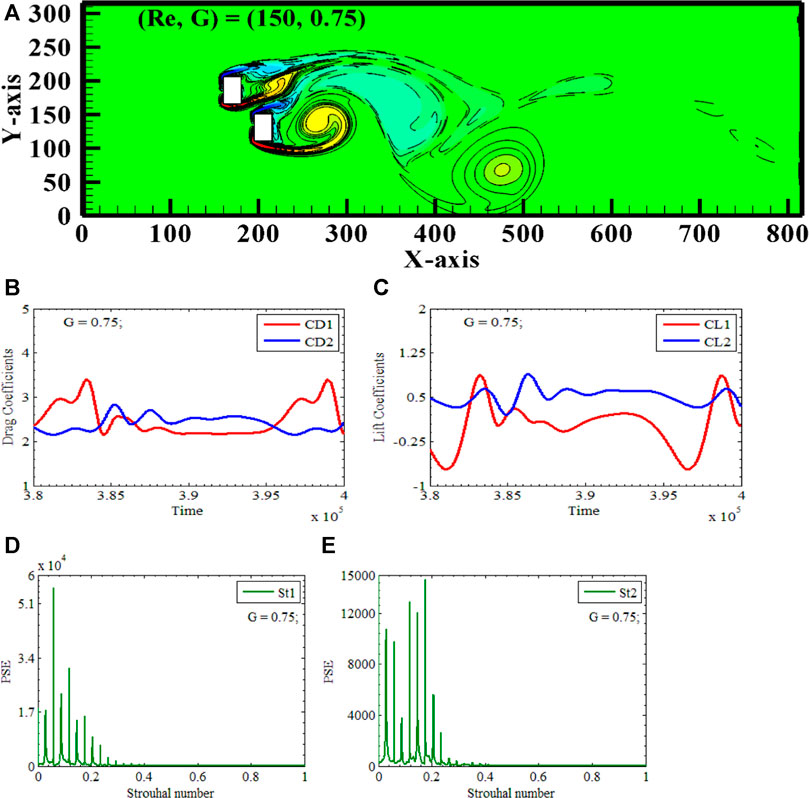
FIGURE 9. Jumbled Vortex Street (A) Vorticity contours (B, C) Time-trace signals of (CD1 & CD2) and (CL1 & CL2) (D, E) Power Energy Spectrum of CL1 and CL2.
5.6 Anti-phase jumbled vortex street
An Anti-phase Jumbled Flow appears at Reynolds number 150, with X-gap spacing and Y-gap spacing of 2 & 2.5, respectively. (Re, XG, YG) = (150, 2.5, 2.5) is the case we will discuss in detail. Two rectangular polygons, RP1 and RP2, are again placed vertically along the center line of the computational domain, having XY-gap spacings 2.5 between the polygons, due to which two polygons are acting as independent bluff bodies, see Figure 10A. Again, the distance between the polygons is sufficient for the independent shedding of vortices from both polygons (see Figure 10). (a). It is clear from the vorticity snapshot that flow is separating from the polygons, reattaching, and then shedding negative and positive vortices. The shedding mechanism is delayed for RP1 as there exists a gap of 2.5 between two polygons. Additionally, the two polygons are arranged in a staggered alignment, which results in a delay in the process of separation of RP1. We can see when RP2 is shedding its positive vortex, RP1 is shedding its negative vortex. There is a time-lapse due to staggered alignment in the shedding process. Also, different types of vortices are shedding simultaneously, so the flow is called Anti-phase in nature. If we see the vortices in the far domain, it has been seen that shed vortices are amalgamating and becoming distorted. Now that the shedding process has taken longer than expected, a merger of vortices has occurred, which has led to anti-phase jumbled flow in the flow domain. Therefore, this flow is known as the Anti-phase Jumbled Flow because, despite its staggered nature, the shedding can be seen as anti-phase when observed simultaneously.
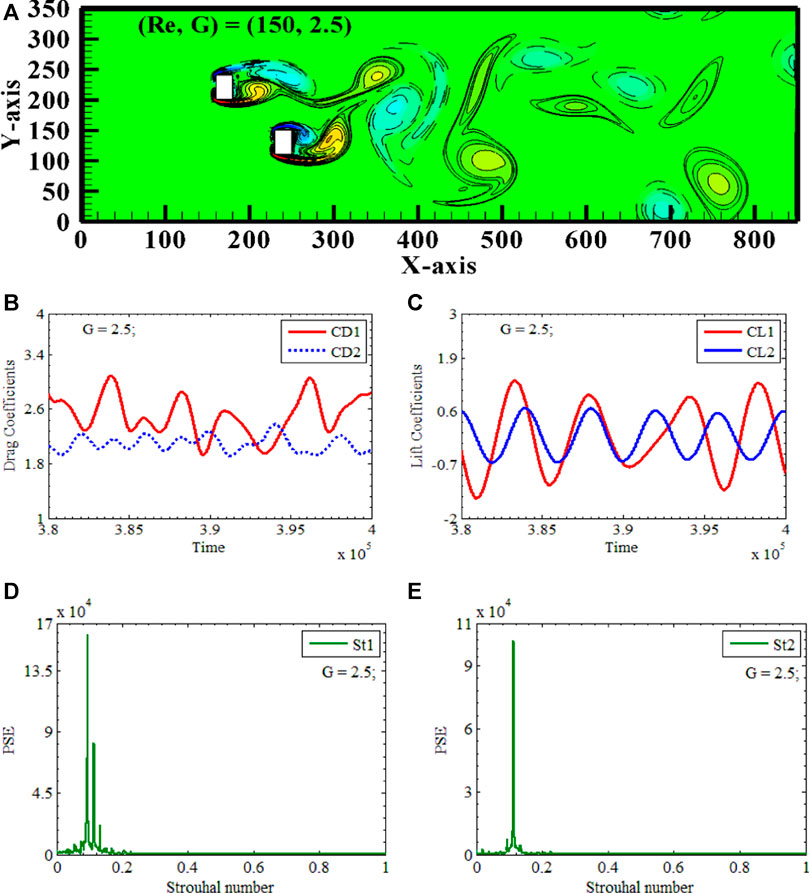
FIGURE 10. Anti-Phase Jumbled Vortex Street (A) Vorticity contours (B, C) Time-trace signals of (CD1 & CD2) and (CL1 & CL2) (D, E) Power Energy Spectrum of CL1 and CL2.
The previous observations regarding the shedding pattern can also be validated by looking at the drag and lift coefficients of the RP1 and RP2 time series, respectively. It can be shown in Figures 10B,C that both CD1 and CD2 have modulated signals, while CL1 and CL2 have continuously varying sinusoidal behaviors with changing amplitude. The maximum amplitude that is observed exists for CD1, having the value of 3.08 is regulated when (Re, XG, YG) is equal to (150, 2.5, 2.4). Figure 5 depicts a time series of the lift and drag coefficients for two adjacent cylinders under the gap spacing of 2.5 is less than 3.08. It has been shown that CD1 has a magnitude that is larger than that of CD2. It may be deduced that the amplitudes of CL1 for the first rectangular polygon are 1.38 and that for the second polygon, they are 0.6, and the lift coefficient of the first polygon is higher than that of the second polygon. The drag and lift coefficients have no same oscillation frequency in motion. This discovery is consistent with the empirical evidence, which suggests that the occurrence of an extremum in lift is also related to the maximum amount of drag. The power spectrum study of CL1 and CL2 further explains the phenomenon. The probability of a single cylinder interaction frequency is seen for both polygons when (Re, XG, YG) = (150, 2.5, 2.5). The merging of shear layers may be indicated by two baby peaks on the right-hand side of the single-cylinder interaction frequency for CL1. No, baby peaks are observed for CL2, indicating a single polygon behavior confirming the sinusoidal behavior of the lift coefficient see in Figures 10D, E.
5.7 In-phase Jumbled Vortex Street
At a Reynolds number of 150, In-phase Jumbled flow manifests itself with X-gap spacings of 3, 3.5, 4, 4.5, and 5 and Y-gap spacings of 3, 3.5, 4, 4.5, and 5, respectively. The chosen scenario in which In-phase Jumbled flow (Re, XG, YG) = (150, 3.5, 3.5) occurs is the one that will be the subject of our in-depth discussion. Again, two rectangular polygons, RP1 and RP2, are placed vertically along the center line of the computational domain. This time, however, the XY-gap spacings between the polygons are set to 3.5, which results in the two polygons functioning as independent bluff bodies see Figures 11A–E. Again, the distance between the polygons is adequate for the independent shedding of vortices from both polygons see Figure 11A. The snapshot of the vorticity makes it clear that the flow is detaching from the polygons, reattaching itself, and then releasing both negative and positive vortices. Because there is a space of 3.5 between the two polygons, the shedding mechanism is delayed for this RP1. In addition, the two polygons are placed in a staggered alignment, which causes a delay in the process of RP1’s flow separation. When RP2 is shedding its positive vortex, we can see that RP1 is also shedding its positive vortex. In the process of shedding, there is a delay caused by the staggered alignment of the Polygons. Additionally, since the same kind of vortices are shedding simultaneously, the flow is referred to as In-phase when it occurs in nature. Looking at the vortices in the distant domain, we can see that the shed vortices combine into larger ones and become distorted. A merging of vortices has taken place, which has resulted in In-phase jumbled flow within the flow domain as a direct consequence of the shedding process taking significantly more time than was anticipated. Therefore, this flow is known as the In-phase Jumbled Flow because, although the shedding occurs staggered, it is possible to see the shedding as In-phase when observed simultaneously. The conclusions pertaining to the shedding pattern can be further substantiated by examining the Time series of drag and lift coefficients for RP1 and RP2, correspondingly.
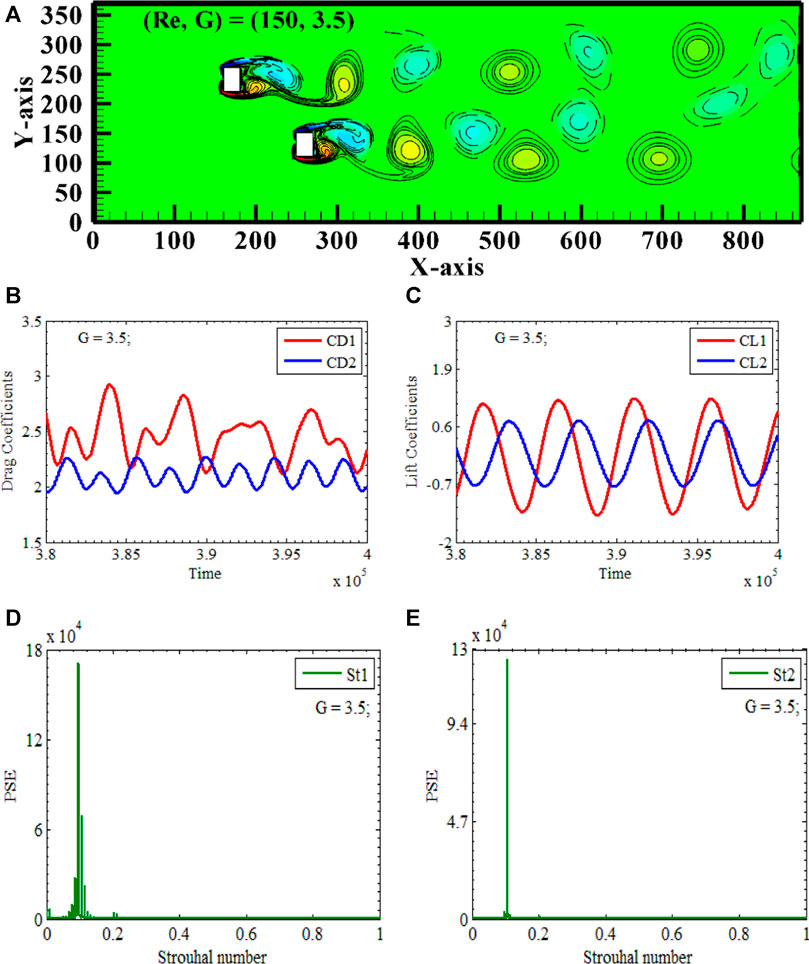
FIGURE 11. In-Phase Jumbled Vortex Street (A) Vorticity contours (B, C) Time-trace signals of (CD1 & CD2) and (CL1 & CL2) (D, E) Power Energy Spectrum of CL1 and CL2.
Figure Figures 11B, C demonstrates that CD1 exhibits modulated signals while CD2 has a periodic nature with the highest amplitude oh 2.25. CL1 and CL2 display sinusoidal behaviors with constant amplitude. The highest observed amplitude is found in CD1, with a value of 2.9, when the values of (Re, XG, YG) are equal to (150, 3.5, 3.5).
Outcomes clearly demonstrated that the magnitude of CD1 is greater than that of CD2. It can be inferred from the given information that the amplitudes of CL1 for the initial rectangular polygon are 1.12, whereas, for the subsequent polygon, they are 0.8. Additionally, it is evident that the lift coefficient of the first polygon surpasses that of the second polygon. The oscillation frequencies of the drag and lift coefficients coincide when they are in motion. This finding aligns with the empirical data, indicating a correlation between the presence of a peak in lift and the highest level of drag. The examination of the power spectrum of CL1 and CL2 offers additional elucidation into the observed event. The occurrence rate of interactions between individual cylinders is seen for both polygons under the conditions of (Re, XG, YG) = (150, 3.5, 3.5). The indication of independent shedding is observed by the highest peaks and merging is observed through the existence of two smaller peaks located on the left side of the interaction frequency for CL1, which corresponds to a single cylinder see Figures 11D,E.
5.8 In-phase two independent row vortex street
An In-phase Two Independent Vortex Street occurs at Reynolds number 150, with X-gap spacing and Y-gap spacing of 5.5, respectively. (Re, XG, YG) = (150, 5.5, 5.5) is the only case we will discuss in detail. Two rectangular polygons, RP1 and RP2, are again placed vertically along the center line of the computational domain, having XY-gap spacings 5.5 between the polygons, due to which two polygons are acting as independent bluff bodies, see Figure 12A. When G equals 5.5, the distance between two polygons is sufficient to prevent interaction. As the interaction between the fluid and the polygon continues, it is possible to observe the independent shedding of both positive and negative vortices. See Figure 12A for an illustration of the two independent Von Karman Vortex Ttreets that can be seen in the whole computational domain. Both polygons shed negative vortices at the same time, which resulted in in-phase behavior. Because of these flow characteristics, this type of flow is known as In-phase Two Rows Independent Vortex Street Flow. The positive and negative vortices initially are spike-shaped, but as the flow continues through the channel, they change to an oval and round shape.
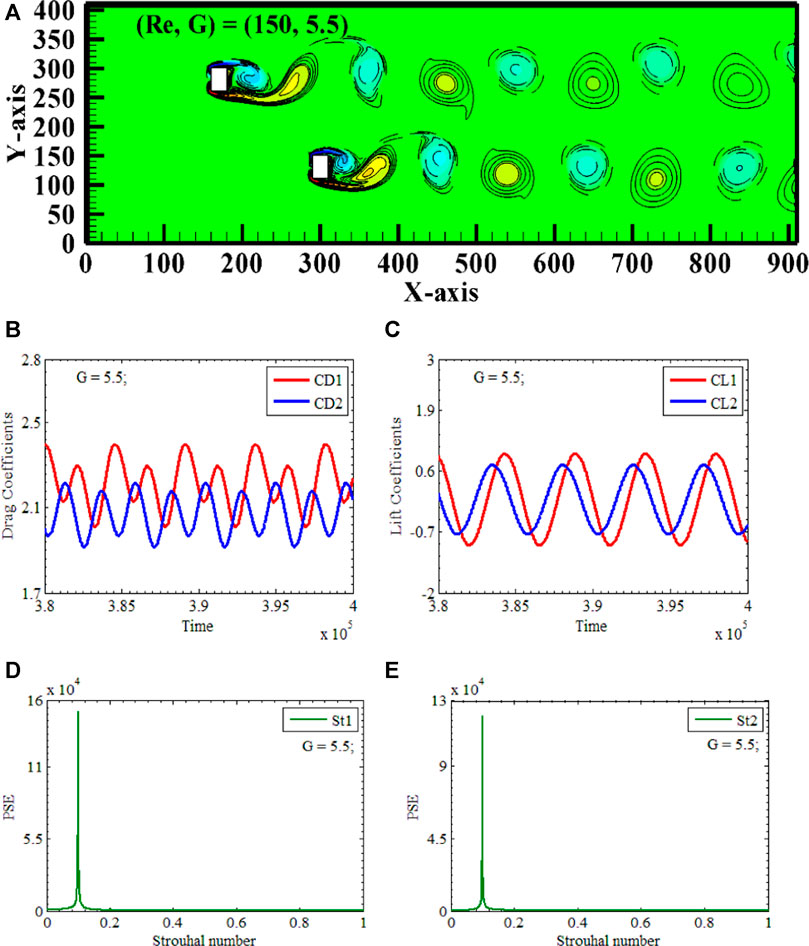
FIGURE 12. In-Phase Two Independent Row Vortex Street (A) Vorticity contours (B, C) Time-trace signals of (CD1 & CD2) and (CL1 & CL2) (D, E) Power Energy Spectrum of CL1 and CL2.
The conclusions about the shedding pattern can be further substantiated by examining the time series of drag and lift coefficients for RP1 and RP2. Figures 12B, C demonstrates that CD1 and CD2 have a periodic nature with the highest amplitude, of 2.25. CL1 and CL2 display sinusoidal behaviors with constant amplitude. The highest observed amplitude is found in CD1, with a value of 2.25, when the values of (Re, XG, YG) are equal to (150, 5.5, 5.5). Outcomes clearly demonstrated that the magnitude of CD1 is greater than that of CD2. It can be inferred from the given information that the amplitudes of CL1 for the initial rectangular polygon are 1.0, whereas, for the subsequent polygon, they are 0.8. Additionally, the lift coefficient of the first polygon surpasses that of the second polygon. The oscillation frequencies of the drag and lift coefficients coincide when they are in motion. This finding aligns with the empirical data, indicating a correlation between a peak in lift and the highest level of drag. Examining the power spectrum of CL1 and CL2 offers additional elucidation into the observed event. The occurrence rate of interactions between individual cylinders is seen for both polygons under the conditions of (Re, XG, YG) = (150, 5.5, 5.5). The highest peaks observe the indication of independent shedding. No merging is observed since there is no existence of smaller peaks see Figures 12D, E. The power spectrum is narrow like a single polygon clearly indicating the effect of Von Karman Street on the other. The gap is vast enough that the effect of the wake of one polygon does not affect the wake of another.
5.9 Anti-phase two independent row vortex street
An Anti-phase Two Independent Vortex Street occurs at Reynolds number 150, with X-gap spacing and Y-gap spacing of 6, respectively. (Re, XG, YG) = (150, 6, 6) is the only case we will discuss in detail. Two rectangular polygons, RP1 and RP2, are again placed vertically along the center line of the computational domain, having XY-gap spacings 6 between the polygons, due to which two polygons are acting as independent bluff bodies, see Figures 13A–E. When G equals 6, the distance between two polygons is insignificant and prevents the interaction between polygons. As the interaction between the fluid and the polygon continues, it is possible to observe the independent shedding of both positive and negative vortices. See Figure 13(8) for an illustration of the two independent Von Karman Vortex Ttreets that can be seen in the whole computational domain. RP1 shed a negative vortex, and RP2 shed a positive vortex simultaneously, which resulted in Anti-phase behavior. Because of these flow characteristics, this type of flow is known as Anti-phase Two Rows Independent Vortex Street Flow. The positive and negative vortices initially are spike-shaped, but as the flow continues through the channel, they change to an oval and round shape. Further evidence supporting the conclusions regarding the shedding pattern may be obtained by analyzing the time series data of the drag and lift coefficients for RP1 and RP2. The cyclic character of CD1 and CD2 is illustrated in Figures 13B, C, with the maximum amplitude recorded at 2.3. Both CL1 and CL2 exhibit sinusoidal patterns characterized by a consistent amplitude. The maximum observed amplitude is in CD1, exhibiting a magnitude of 2.2, corresponding to the values of (Re, XG, YG) = (150, 6.0, 6.0).
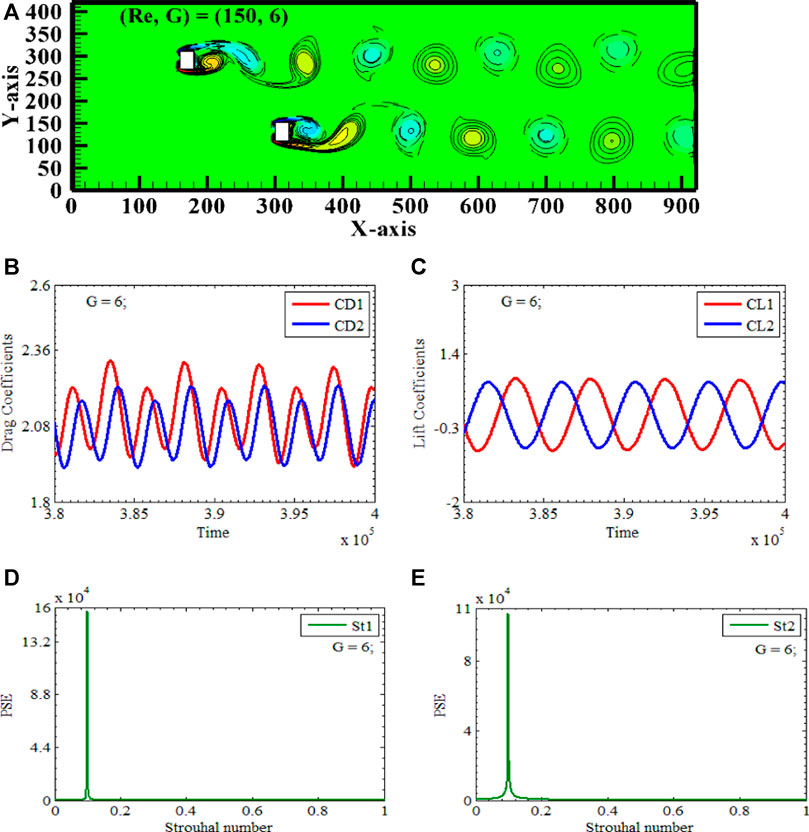
FIGURE 13. Anti-Phase Two Independent Row Vortex Street (A) Vorticity contours (B, C) Time-trace signals of (CD1 & CD2) and (CL1 & CL2) (D, E) Power Energy Spectrum of CL1 and CL2.
The results clearly indicate that the magnitude of CD1 is more significant than that of CD2. Based on the above information, it can be deduced that the amplitudes of CL1 for the initial rectangular polygon are 0.775, whereas, for the subsequent polygon, it is 0.665. Furthermore, the lift coefficient of the initial polygon exceeds that of the subsequent polygon. The frequency of oscillation for the drag and lift coefficients aligns while they are in motion. This discovery is consistent with the empirical evidence, which suggests a positive association between the maximum lift and the corresponding peak in drag.
Further analysis of the power spectrum of CL1 and CL2 provides additional clarification regarding the reported phenomenon. The frequency at which individual cylinders contact is observed for both polygons with the specified conditions of (Re, XG, YG) = (150, 6.0, 6.0). The tallest peaks exhibit evidence of autonomous shedding. The absence of lesser peaks precludes the occurrence of a merger of vortices see Figures 13D, E. The power spectrum has a narrow profile, resembling that of a single polygon, which strongly indicates the comparison with Von Karman Street on adjacent elements. The spacing between polygons is sufficient to ensure that the wake generated by the second polygon does not impact the wake generated by the first polygon.
6 Force statistical analysis
The deviation of different physical entities such as CDMEAN, CDRMS, CLRMS, and St with gap spacing G at fixed Re = 150 is discussed in this section and is given in Figures 14A–D. It is observed that CDMEAN2 shows a decreasing behavior till G = 5. After that, it shows a jump towards an increase and again a sudden drop at G = 6. Since RP2 is positioned upstream, its mean drag coefficient smoothly changes from increasing to decreasing behavior. The maximum value of CDMEAN2 is observed at G = 0 where flow is Solitary Contorted Bluff Body Vortex Street and the smallest value at G = 6 where two bluff bodies act as single bluff bodies. CDMEAN1 also shows decreasing behavior till G = 0.75; after that, it shows increasing behavior till 1.5. After that, it shows a steady decreasing behavior till G = 5; again, it shows a sudden jump at gap spacing G = 5.5 and a sudden drop at G = 6. Since RP1 is positioned downstream, its mean drag coefficient is very disturbed due to presence of another bluff body in the proximity of the bluff body. The mixed trend in CDMEAN is observed For RP1. Clearly, CDMEAN1 > CDMEAN2. The maximum value of CDMEAN1 is observed at G = 0, where the flow is Solitary Contorted Bluff Body Vortex Street, and the smallest value at G = 6, where two bluff bodies act as single bluff bodies. A vertical V is the observed trend in both CDMEANS at G = 5–6. This phenomenon indicates that the size, shape, and distance between the bluff bodies can change the drag. At large gap spacing CDMEAN of single and two staggered rectangular polygons coincides see Figure 14A.
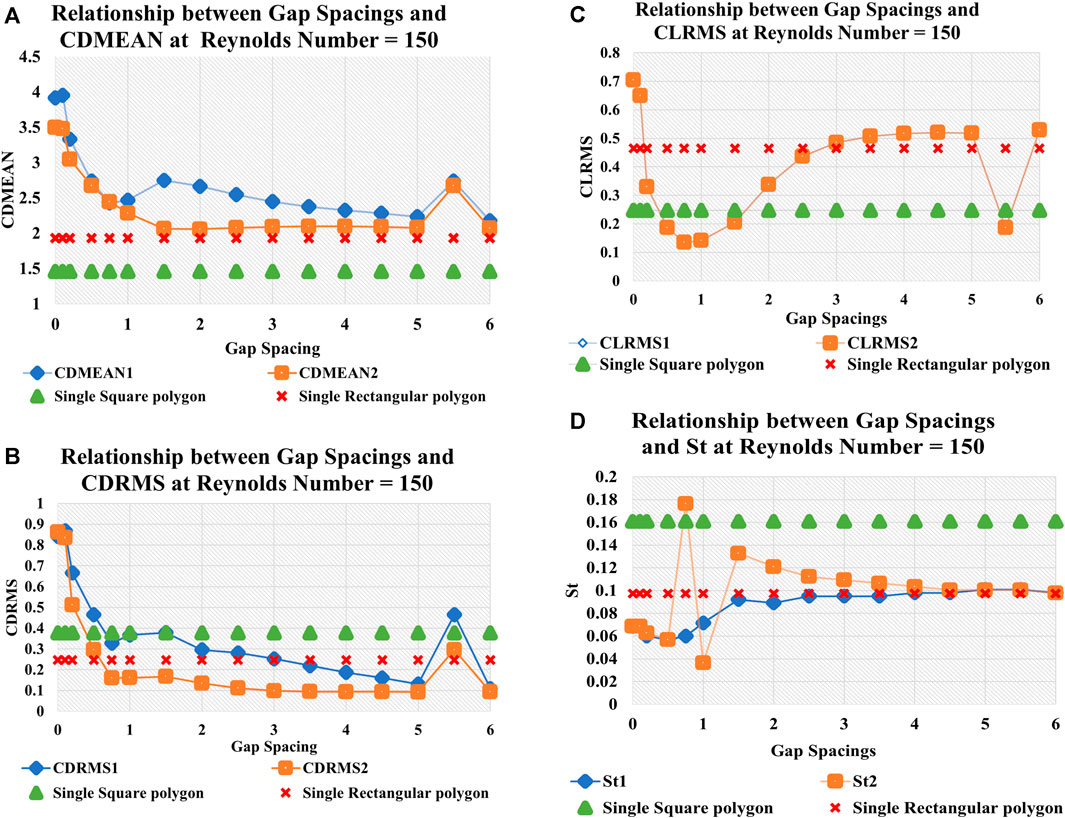
FIGURE 14. Statistical analysis. Effect of g on (A) CDMEAN, (B) CDRMS, (C) CLRMS, and (D) St.(a), (b).
Due to significant gap flow interference between two staggered polygons, upstream cylinder RP2 CDRMS decreases until G = 0.75. CDRMS2 decreases further monotonically up to G = 5. For downstream cylinder RP1, CDRMS behaves irregularly at gap spacings G = 0 and 5. Figure 14B shows that CDRMS decreases in the 1.25 ≤ G ≤ 5 gap spacing range. The analysis showed that adding an upstream cylinder RP2 before downstream cylinder RP1 and increasing cylinder gap spacings significantly lowered CDRMS2. In Figure 14B, the upstream cylinder RP2 has higher CDRMS2 values than a single square cylinder, while the downstream cylinder RP1 has lower values for G ≥ 0.75. Importantly, CDRMS of downstream cylinder RP1 and upstream cylinder RP2 approach single cylinder data at large gap spacings (Figure 14B). The CLRMS values of two Staggered polygons exhibit identical behavior when the gap spacings G are varied, and the Re is fixed at 150. The CLRMS exhibits a declining trend as the gap spacing increases to G = 0.75; at this point, the minimal CLRMS for both cylinders is achieved. G = 0.75 is determined to be crucial due to the presence of a Jumbled Vortex Street at this specific gap spacing. There is a noticeable upward trend in the behavior of CLRMS when G is greater than or equal to 5. Additionally, it has been shown that the CLRMS values for both Staggered cylinders with a gap spacing of G ≤ 0.25 are more pronounced compared to the data from a single cylinder see Figure 14C. This indicates the existence of a strong interaction between the wakes of the two cylinders without any vortex-generating phenomena. Furthermore, the CLRMS values for both cylinders are lower than those for a single polygon when the gap separation G is greater than or equal to 0.1–2.5 and at 5.5. This indicates that the interaction between the wakes of the two Staggered polygons is nearly insignificant. The Fast Fourier Transform of the lift coefficient estimates the Strouhal number, which describes oscillating flow behavior. As we know, a time series power spectrum is a signal that describes power distribution as frequency components. The power spectrum energy is a statistical average of the signal’s frequency. In Figure 14D, the single cylinder interaction frequency, the most prominent peak of this frequency, is shown against all gap spacings. Upstream cylinder RP2 has the highest value at G = 0.75 and the lowest at G = 1. Meanwhile, downstream cylinder RP1 increases monotonically. Strouhal numbers remain constant at significant gaps. This incident effectively isolates two Staggered polygons wakes. Thus, the two cylinders' wakes barely interact at large gap spacings. At large gap spacings, all physical entities, i.e., CDMEAN, CDRMS, CLRMS, and St of both Staggered cylinders, are almost approaching the single cylinder values CDMEAN, CDRMS, CLRMS, and St.
7 Relationship between gap spacings and maximum and minimum values of CD and CL
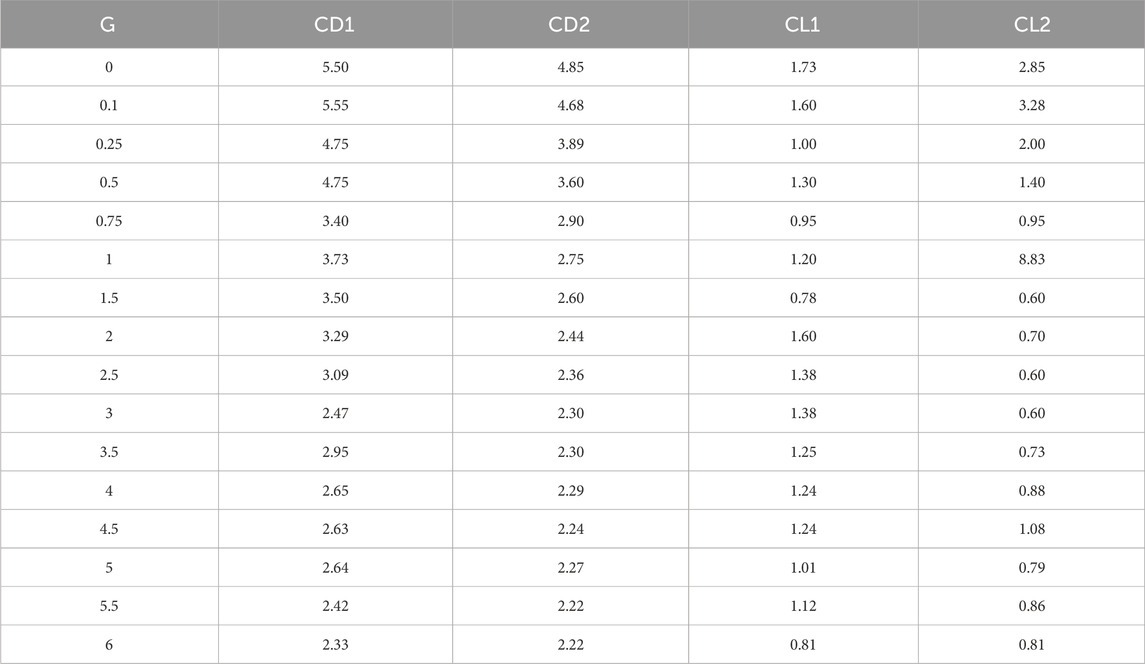
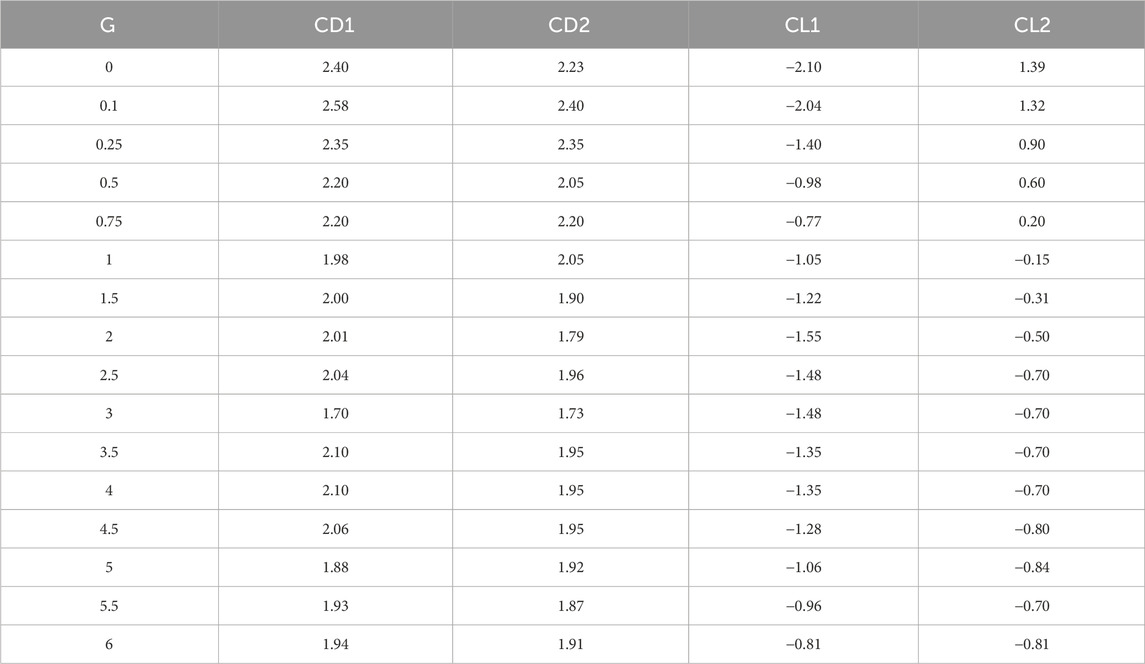
Table 5, 6 present the maximum and minimum drag and lift values for upstream and downstream rectangular polygons. Clearly, the values of CD and CL are not same simultaneously for any chosen case. For a pair of polygons positioned in a staggered configuration, the impact of fluid forces, that is, drag and lift, is experienced by the downstream cylinder because it always gets an impact with a disturbed flow. Outcomes clearly show that the flow’s maximum values of CD1 and CD2 decrease monotonically as the gap spacing between the polygons increases with CD1 > CD2. On the other hand, maximum values of CL1 and CL2 also show decreasing behavior but follow some mixing behavior. In Table 6, both minimum values of drag and lift show increasing and decreasing behaviors for different gap spacings. All this occurs due to the presence of jet flow and the irregular shape of two polygons as a unit.
8 Conclusion
A two-dimensional numerical analysis is conducted for the flow past two vertically arranged staggered rectangular polygons. The Reynolds number is fixed at 150, while the distance between vertical polygons differs from 0 to 6. Simulations are conducted by using SRT-LBM. Nine distinct flow regimes are identified and referred to as Solo Bluff Body Flow, Distorted Solo Bluff Body Flow, Jumbled flow, In-phase Jumbled Flow, Anti-phase Jumbled flow, In-phase Two Rows Vortex Street Flow, and Anti-phase Two rows vortex Street Flow. When two rectangular polygons are situated in proximity, the distance between them has a significant effect on the flow characteristics, resulting in the development of nine distinct flow regimes with their own characteristics. For a pair of polygons positioned in a staggered configuration, the impact of fluid forces, that is, drag and lift, is experienced by the downstream cylinder because it always gets an impact with a disturbed flow. It is observed that the configuration of a bluff body can alter the flow field. The vertical alignment of polygons favors the immediate detachment of shear layers rather than promoting their reattachment and growth. The time histories of the coefficients of drag and lift alternate between modulated and sinusoidal behavior for various gaps and among the same gaps for different polygons. Strouhal numbers remain constant at significant gaps. This incident effectively isolates two Staggered polygons wakes. Thus, the two cylinders wakes barely interact at large gap spacings. At large gap spacings, all physical quantities, i.e., CDMEAN, CDRMS, CLRMS, and St of both Staggered polygons, are almost approaching the single rectangular polygons values of CDMEAN, CDRMS, CLRMS, and St. It is also observed that values of CDMEAN for different Reynolds number are greater for rectangular polygon as compared to square polygon but for St it is totally opposite.
Data availability statement
The original contributions presented in the study are included in the article/Supplementary material, further inquiries can be directed to the corresponding author.
Author contributions
FG: Conceptualization, Writing–review and editing. GN: Writing–original draft. MS: Investigation, Writing–review and editing. SS: Formal Analysis, Writing–review and editing. SI: Supervision, Writing–review and editing.
Funding
The author(s) declare financial support was received for the research, authorship, and/or publication of this article.
Acknowledgments
I thank all my colleagues for their hard work and support.
Conflict of interest
The authors declare that the research was conducted in the absence of any commercial or financial relationships that could be construed as a potential conflict of interest.
Publisher’s note
All claims expressed in this article are solely those of the authors and do not necessarily represent those of their affiliated organizations, or those of the publisher, the editors and the reviewers. Any product that may be evaluated in this article, or claim that may be made by its manufacturer, is not guaranteed or endorsed by the publisher.
References
Abbasi, W. S., Naheed, A., Islam, S. U., and Rahman, H. (2021). Investigation of optimum conditions for flow control around two inline square cylinders. Arabian J. Sci. Eng. 46, 2845–2864. doi:10.1007/s13369-020-05303-x
Abdolahipour, S. (2023). Effects of low and high frequency actuation on aerodynamic performance of a supercritical airfoil. Front. Mech. Eng. 9, 1290074. doi:10.3389/fmech.2023.1290074
Abdolahipour, S., Mani, M., and Shams Taleghani, A. (2022a). Experimental investigation of flow control on a high-lift wing using modulated pulse jet vortex generator. J. Aerosp. Eng. 35 (5), 05022001. doi:10.1061/(ASCE)AS.1943-5525.0001463
Abdolahipour, S., Mani, M., and Shams Taleghani, A. (2022b). Pressure improvement on a supercritical high-lift wing using simple and modulated pulse jet vortex generator. Flow, Turbul. Combust. 109 (1), 65–100. doi:10.1007/s10494-022-00327-9
Abdolahipour, S., Mani, M., and Taleghani, A. S. (2021). Parametric study of a frequency-modulated pulse jet by measurements of flow characteristics. Phys. Scr. 96 (12), 125012. doi:10.1088/1402-4896/ac2bdf
Aboueian, J., and Sohankar, A. (2017). Identification of flow regimes around two staggered square cylinders by a numerical study. Theor. Comput. Fluid Dyn. 31, 295–315. doi:10.1007/s00162-017-0424-2
Agrawal, A., Djenidi, L., and Antonia, R. A. (2006). Investigation of flow around a pair of side-by-side square cylinders using the lattice Boltzmann method. Comput. fluids 35 (10), 1093–1107. doi:10.1016/j.compfluid.2005.05.008
Ahmad, S., ul Islam, S., Nazeer, G., and Zhou, C. Y. (2021). Numerical investigation of Strouhal number discontinuity and flow characteristics around single rectangular cylinder at low aspect ratios and Reynolds numbers. J. Braz. Soc. Mech. Sci. Eng. 43, 315–326. doi:10.1007/s40430-021-03040-2
Bajalan, S., Shadaram, A., Hedayat, N., and Taleghani, A. S. (2011). Experimental study of frequency behavior for a circular cylinder behind an airfoil. World Acad. Sci. Eng. Technol. Int. J. Mech. Aerosp. Industrial, Mechatron. Manuf. Eng. 5 (11), 2356–2360. doi:10.5281/zenodo.1078273
Boix, A. C. (2013). Application of the Lattice Boltzmann Method to issues of coolant flows in nuclear power reactors. Master’s thesis. Technische Universita¨t Mu¨nchen. Available at: http://hdl.handle.net/2099.1/19944.
Chatterjee, D., Biswas, G., and Amiroudine, S. (2010). Numerical simulation of flow past row of square cylinders for various separation ratios. Comput. Fluids 39 (1), 49–59. doi:10.1016/j.compfluid.2009.07.002
Chen, Y., Cai, Q., Xia, Z., Wang, M., and Chen, S. (2013). Momentum-exchange method in lattice Boltzmann simulations of particle-fluid interactions. Phys. Rev. E 88 (1), 013303. doi:10.1103/PhysRevE.88.013303
Chopard, B., Luthi, P. O., and Masselot, A. (2002). Cellular automata and lattice Boltzmann techniques: an approach to model and simulate complex systems. Adv. Complex Syst. 5, 103–246. doi:10.1142/S0219525902000602
Davis, R. W., and Moore, E. F. (1982). A numerical study of vortex shedding from rectangles. J. Fluid Mech. 116, 475–506. doi:10.1017/S0022112082000561
Dutta, S., Panigrahi, P. K., and Muralidhar, K. (2004). Effect of orientation on the wake of a square cylinder at low Reynolds numbers. Available at: http://nopr.niscpr.res.in/handle/123456789/9325.
Fezai, S., Nefzi, R., Ben-Beya, B., and Lili, T. (2021). Analysis of the interaction in flow around Three Staggered Square Cylinders at two Different triangular arrangements. Glob. J. Soc. Eng. Sci. 39, 2519–2534. doi:10.33552/GJES.2021.07.000651
Gad-el-Hak, M. (2000). Flow control: passive, active, and reactive flow management. new york: Cambridge University Press.
Gera, B., Sharma, P. K., and Singh, R. K. (2010). CFD analysis of 2D unsteady flow around a square cylinder. Int. J. Appl. Eng. Res. 1 (3), 602.
Hishikar, P., Dhiman, S. K., Tiwari, A. K., and Gaba, V. K. (2021). Analysis of flow characteristics of two circular cylinders in cross-flow with varying Reynolds number: a review. J. Therm. Analysis Calorim. 147, 5549–5574. doi:10.1007/s10973-021-10933-w
Islam, S. U., Manzoor, R., Ying, Z. C., and Islam, Z. U. (2018). Numerical investigation of different aspect ratios for flow past three inline rectangular cylinders. J. Braz. Soc. Mech. Sci. Eng. 40, 410–419. doi:10.1007/s40430-018-1334-y
Islam, S. U., Nazeer, G., and Shigri, S. H. (2019). Numerical investigation of different flow regimes for square cylinders in staggered configuration. KSCE J. Civ. Eng. 23, 2188–2197. doi:10.1007/s12205-019-0726-6
Kumar, D., and Sen, S. (2021). Flow-induced vibrations of a pair of in-line square cylinders. Phys. Fluids 33 (4), 043602. doi:10.1063/5.0038714
Luo, X., Zhang, W., Dong, H., Thakur, A. K., Yang, B., and Zhao, W. (2021). Numerical analysis of heat transfer enhancement of fluid past an oscillating circular cylinder in laminar flow regime. Prog. Nucl. Energy 139, 103853. doi:10.1016/j.pnucene.2021.103853
Mirzaei, M., Taleghani, A. S., and Shadaram, A. (2012). Experimental study of vortex shedding control using plasma actuator. Appl. Mech. Mater. 186, 75–86. doi:10.4028/www.scientific.net/AMM.186.75
Mohammad, A. A. (2011a). Lattice Boltzmann method: fundamentals and engineering applications with computer codes. New York: Springer. doi:10.1007/978-1-4471-7423-3
Mohammad, A. A. (2011b). Lattice Boltzmann method: fundamentals and engineering applications with computer codes. New York: Springer.
Mohammadi, M., and Taleghani, A. S. (2014). Active flow control by dielectric barrier discharge to increase stall angle of a NACA0012 airfoil. Arabian J. Sci. Eng. 39, 2363–2370. doi:10.1007/s13369-013-0772-1
Namvar, M., and Leclaire, S. (2023). LaBCof: lattice Boltzmann boundary condition framework. Comput. Phys. Commun. 285, 108647. doi:10.1016/j.cpc.2022.108647
Nazeer, G., Islam, S. U., and Shigri, S. H. (2019). Numerical investigation of vortex shedding mechanism for staggered rows of cylinders. Heliyon 5 (2), e01224. doi:10.1016/j.heliyon.2019.e01224
Noori, M. S., Taleghani, A. S., and Rahni, M. T. (2020). Phenomenological investigation of drop manipulation using surface acoustic waves. Microgravity Sci. Technol. 32, 1147–1158. doi:10.1007/s12217-020-09839-3
Noori, M. S., Taleghani, A. S., and Rahni, M. T. (2021). Surface acoustic waves as control actuator for drop removal from solid surface. Fluid Dyn. Res. 53 (4), 045503. doi:10.1088/1873-7005/ac12af
Okajima, A. (1982). Strouhal numbers of rectangular cylinders. J. Fluid Mech. 123, 379–398. doi:10.1017/S0022112082003115
Qiu, T., Zhao, Y., Du, X., and Lin, W. (2021). Spacing effect on the two-degree-of-freedom VIV of two tandem square cylinders. Ocean. Eng. 236, 109519. doi:10.1016/j.oceaneng.2021.109519
Rahimi, H., Tang, X., Esmaeeli, Y., Li, M., and Pourbakhtiar, A. (2020). Numerical simulation of flow around two side-by-side circular cylinders at high Reynolds number. Int. J. Heat Technol. 38 (1), 77–91. doi:10.18280/ijht.380109
Rahman, H., Khan, I., Islam, S. U., Abbasi, W. S., Ullah, R., and Khan, M. U. (2022). Numerical analysis of fluid flow dynamics around two side-by-side square cylinders in the presence and absence of splitter plate. J. Braz. Soc. Mech. Sci. Eng. 44 (11), 552. doi:10.1007/s40430-022-03804-4
Rahni, M. T., Taleghani, A. S., Sheikholeslam, M., and Ahmadi, G. (2022). Computational simulation of water removal from a flat plate, using surface acoustic waves. Wave Motion 111, 102867. doi:10.1016/j.wavemoti.2021.102867
Robichaux, J., Balachandar, S., and Vanka, S. P. (1999). Three-dimensional Floquet instability of the wake of square cylinder. Phys. Fluids 11 (3), 560–578. doi:10.1063/1.869930
Salmasi, A., Shadaram, A., and Taleghani, A. S. (2013). Effect of plasma actuator placement on the airfoil efficiency at poststall angles of attack. IEEE Trans. Plasma Sci. 41 (10), 3079–3085. doi:10.1109/TPS.2013.2280612
Seyed-Aghazadeh, B., Anderson, N., and Dulac, S. (2021). Flow-induced vibration of high-mass ratio isolated and tandem flexible cylinders with fixed boundary conditions. J. Fluids Struct. 103, 103276. doi:10.1016/j.jfluidstructs.2021.103276
Shahab, M., Ul-Islam, S., and Nazeer, G. (2021). T-shaped control plate effect on flow past a square cylinder at low Reynolds numbers. Math. Problems Eng. 2021, 1–19. doi:10.1155/2021/7562460
Shams Taleghani, A., and Sheikholeslam Noori, M. (2022). Numerical investigation of coalescence phenomena, affected by surface acoustic waves. Eur. Phys. J. Plus 137 (8), 975. doi:10.1140/epjp/s13360-022-03175-8
Shui, Q., Duan, C., Wang, D., and Gu, Z. (2021). New insights into numerical simulations of flow around two tandem square cylinders. AIP Adv. 11 (4). doi:10.1063/5.0042797
Sohankar, A., Davidson, L., and Norberg, C. (1995). “Numerical simulation of unsteady flow around a square two-dimensional cylinder,” in Twelfth australasian fluid Mechanics conference (The University of Sydney, Australia), 517–520. University of Sydney.
Taleghani, A. S., Shadaram, A., Mirzaei, M., and Abdolahipour, S. (2018). Parametric study of a plasma actuator at unsteady actuation by measurements of the induced flow velocity for flow control. J. Braz. Soc. Mech. Sci. Eng. 40, 173–213. doi:10.1007/s40430-018-1120-x
Viggen, E. M. (2009). The Lattice Boltzmann method with applications in acoustics. Master’s thesis. NTNU, Norway.
Wang, F., and Lam, K. M. (2021). Experimental and numerical investigation of turbulent wake flow around wall-mounted square cylinder of aspect ratio 2. Exp. Therm. Fluid Sci. 123, 110325. doi:10.1016/j.expthermflusci.2020.110325
Zhou, C. Y., ul-Islam, S., and Ying Zhou, C. (2021). The wake and force statistics of flow past tandem rectangles. Ocean. Eng. 236, 109476. doi:10.1016/j.oceaneng.2021.109476
Zia ul, I., Shams ul, I., and Zhou, C. Y. (2021). Flow control around two side-by-side square cylinders using dual splitter plates. J. Braz. Soc. Mech. Sci. Eng. 43 (2), 90. doi:10.1007/s40430-020-02795-4
Nomenclature
Keywords: fluid dynamical system, flow control, vortex shedding mechanism, viscous fluid flow, vertical rectangular polygons, staggered arrangement
Citation: Gul F, Nazeer G, Sana M, Shigri SH and Islam SU (2024) Extensive study of flow characters for two vertical rectangular polygons in a two-dimensional cross flow. Front. Mech. Eng 9:1334830. doi: 10.3389/fmech.2023.1334830
Received: 07 November 2023; Accepted: 29 December 2023;
Published: 19 January 2024.
Edited by:
Arash Shams Taleghani, Aerospace Research Institute, IranReviewed by:
Mahdi Sheikholeslam, K.N.Toosi University of Technology, IranSoheila Abdolahipour, Aerospace Research Institute, Iran
Copyright © 2024 Gul, Nazeer, Sana, Shigri and Islam. This is an open-access article distributed under the terms of the Creative Commons Attribution License (CC BY). The use, distribution or reproduction in other forums is permitted, provided the original author(s) and the copyright owner(s) are credited and that the original publication in this journal is cited, in accordance with accepted academic practice. No use, distribution or reproduction is permitted which does not comply with these terms.
*Correspondence: Ghazala Nazeer, ghazala.nazeer@gscwu.edu.pk, ghazala.nazeer@yahoo.com
 Farheen Gul1
  Ghazala Nazeer
 Shams Ul Islam